national health interview survey, 1994 - centers for disease
TRANSCRIPT
Series 10No. 193
Current EstimatesFrom the NationalHealth InterviewSurvey, 1994
December 1995
Vital andHealth StatisticsFrom the CENTERS FOR DISEASE CONTROL AND PREVENTION /National Center for Health Statistics
U.S. DEPARTMENT OF HEALTH AND HUMAN SERVICESPublic Health Service
Centers for Disease Control and PreventionNational Center for Health Statistics

Copyright Information
All material appearing in this report is in the public domain and may bereproduced or copied without permission; citation as to source, however, isappreciated.
Suggested citation
Adams PF, Marano MA. Current estimates from the National Health InterviewSurvey, 1994. National Center for Health Statistics. Vital Health Stat 10(193).1995.
Library of Congress Catalog Card Number 65-62623

Current EstimatesFrom the NationalHealth InterviewSurvey, 1994
Series 10:Data From the National HealthSurveyNo. 193Includes estimates on incidence of acute conditions, episodes of personsinjured, disability days, physician contacts, prevalence of chronicconditions, limitation of activity, hospitalizations, and assessed health status.
Hyattsville, MarylandDecember 1995DHHS Publication No. (PHS) 96-1521
Vital andHealth Statistics
U.S. DEPARTMENT OF HEALTH AND HUMAN SERVICESPublic Health ServiceCenters for Disease Control and PreventionNational Center for Health Statistics
National Center for Health StatisticsJack R. Anderson,Acting Director
Jennifer H. Madans, Ph.D.,Acting Deputy Director
Jacob J. Feldman, Ph.D.,Associate Director for Analysis,Epidemiology, and Health Promotion
Gail F. Fisher, Ph.D.,Associate Director for Planning andExtramural Programs
Jack R. Anderson,Acting Associate Director forInternational Statistics
Stephen E. Nieberding,Associate Director forManagement
Charles J. Rothwell,Associate Director for DataProcessing and Services
Monroe G. Sirken, Ph.D.,Associate Director for Researchand Methodology
Division of Health Interview Statistics
Owen T. Thornberry, Jr., Ph.D.,Director
Gerry E. Hendershot, Ph.D.,Assistant to the Director forData Analysis and Dissemination
Ann M. Hardy, Dr.P.H.,Chief, Illness and DisabilityStatistics Branch
John W. Horm,Chief, Survey Planning and DevelopmentBranch
Robert S. Krasowski,Chief, Systems and ProgrammingBranch
Robert A. Wright,Chief, Utilization and ExpenditureStatistics Branch
Cooperation of the U.S. Bureau of the Census
Under the legislation establishing the National Health Survey, the Public HealthService is authorized to use, insofar as possible, the services or facilities of otherFederal, State, or private agencies.
In accordance with specifications established by the National Center for HealthStatistics, the U.S. Bureau of the Census, under a contractual arrangement, participatedin planning the survey and collecting the data.
iii
Contents
Introduction . . . . . . . . . . . . . . . . . . . . . . . . . . . . . . . . . . . . . . . . . . . . . . . . . . . . . . . . . . . . . . . . . . . . . . . . . . . . . . . . . . . . . . . . 1
Source and limitations of data . . . . . . . . . . . . . . . . . . . . . . . . . . . . . . . . . . . . . . . . . . . . . . . . . . . . . . . . . . . . . . . . . . . . . . . . . . 3
Selected results and uses of tables . . . . . . . . . . . . . . . . . . . . . . . . . . . . . . . . . . . . . . . . . . . . . . . . . . . . . . . . . . . . . . . . . . . . . . . 4Acute conditions: Incidence, medical attention, and associated restriction in activity . . . . . . . . . . . . . . . . . . . . . . . . . . . . . 4Episodes of persons injured . . . . . . . . . . . . . . . . . . . . . . . . . . . . . . . . . . . . . . . . . . . . . . . . . . . . . . . . . . . . . . . . . . . . . . . . . 5Restricted activity associated with injury and impairment due to injury . . . . . . . . . . . . . . . . . . . . . . . . . . . . . . . . . . . . . . . . 5Prevalence of reported chronic conditions . . . . . . . . . . . . . . . . . . . . . . . . . . . . . . . . . . . . . . . . . . . . . . . . . . . . . . . . . . . . . . 5Limitation of activity due to chronic conditions . . . . . . . . . . . . . . . . . . . . . . . . . . . . . . . . . . . . . . . . . . . . . . . . . . . . . . . . . . 5Restricted activity due to acute and chronic conditions . . . . . . . . . . . . . . . . . . . . . . . . . . . . . . . . . . . . . . . . . . . . . . . . . . . . 6Respondent-assessed health status . . . . . . . . . . . . . . . . . . . . . . . . . . . . . . . . . . . . . . . . . . . . . . . . . . . . . . . . . . . . . . . . . . . . 6Physician contacts: Rate and interval since last contact . . . . . . . . . . . . . . . . . . . . . . . . . . . . . . . . . . . . . . . . . . . . . . . . . . . . 6Hospitalization: Episodes and days for persons; discharges and average length of stay . . . . . . . . . . . . . . . . . . . . . . . . . . . . 6
References . . . . . . . . . . . . . . . . . . . . . . . . . . . . . . . . . . . . . . . . . . . . . . . . . . . . . . . . . . . . . . . . . . . . . . . . . . . . . . . . . . . . . . . . 8
List of detailed tables . . . . . . . . . . . . . . . . . . . . . . . . . . . . . . . . . . . . . . . . . . . . . . . . . . . . . . . . . . . . . . . . . . . . . . . . . . . . . . . . 9
Appendixes
I. Technical notes on methods . . . . . . . . . . . . . . . . . . . . . . . . . . . . . . . . . . . . . . . . . . . . . . . . . . . . . . . . . . . . . . . . . . . . . . . 130II. Definitions of certain terms used in this report . . . . . . . . . . . . . . . . . . . . . . . . . . . . . . . . . . . . . . . . . . . . . . . . . . . . . . . . . 137III. Questionnaires and flashcards Because of its large size Appendix III has been separated into 5 files. Click below to open.
File: 10_193_2.pdf (pages 142-240) . . . . . . . . . . . . . . . . . . . . . . . . . . . . . . . . . . . . . . . . . . . . . . . . . . . . . . . . . . . . . . 142File: 10_193_3.pdf (pages 241-324) . . . . . . . . . . . . . . . . . . . . . . . . . . . . . . . . . . . . . . . . . . . . . . . . . . . . . . . . . . . . . . 229File: 10_193_4.pdf (pages 325-412) . . . . . . . . . . . . . . . . . . . . . . . . . . . . . . . . . . . . . . . . . . . . . . . . . . . . . . . . . . . . . . 317File: 10_193_5.pdf (pages 413-482) . . . . . . . . . . . . . . . . . . . . . . . . . . . . . . . . . . . . . . . . . . . . . . . . . . . . . . . . . . . . . . 380File: 10_193_6.pdf (pages 483-back cover) . . . . . . . . . . . . . . . . . . . . . . . . . . . . . . . . . . . . . . . . . . . . . . . . . . . . . . . . 445
Symbols
. . . Category not applicable
- Quantity zero
* Figure does not meet standard ofreliability or precision
*– Figure does not meet standard ofreliability or precision and quantity zero
iv
an
-ai
a
d
ctta
dimt
cticsth
n5
ntre-ed
ofbleion94r-d,ialr-bei-ingic)
87orntn,beta
he
l-
althn;
ur-
h,artily
-a-nDSkis).
o
f
d
a
r
Current Estimates From theNational Health InterviewSurvey, 1994
by Patricia F. Adams and Marie A. Marano, Division ofHealth Interview Statistics
IntroductionThis report provides detailed data from the 1994 Nation
Health Interview Survey (NHIS) on the health of the civilianoninstitutionalized population. Estimates are presentedacute conditions, episodes of persons injured, restrictionactivity, prevalence of chronic conditions, limitation of activity due to chronic conditions, respondent-assessed hestatus, and the use of medical services—including physiccontacts and short-stay hospitalization.
Estimates of these health characteristics are showntables 1–78 for various groups in the population, includinthose defined by age, sex, race, and family income (eshown for specific age groups), and by geographic region aplace of residence. Estimates for other characteristicsspecial relevance to particular health measures are also incluFor example, estimates of physician contacts are shown byplace where the contact occurred.
The Results section includes a brief definition of eahealth characteristic included in tables 1–78 and reports1994 estimate for each characteristic. Previous issues ofannual report have included text tables that presented compsons of the corresponding estimates from the previous 2 yeand standardized rates for each of the major health characistics. Because the primary focus of this report is to providata from the current survey, these tables have been elnated. However, selected significant differences between1994 and 1993 estimates are presented in the text.
The NHIS data are often used to monitor trends. Suanalyses must address changes in the survey design overIn 1982, the NHIS questionnaire and data preparation produres of the survey were extensively revised. The baconcepts of the NHIS changed in some cases, and in ocases the concepts were measured in a different way. Compsons with earlier results should not be undertaken withocarefully examining these changes. A more complete explation of these changes is in appendix IV of Series 10, No. 1
This report was prepared in the Division of Health Interview Statistics. Viona Brown
the Systems and Programming Branch and Van L. Parsons and Jessica Y. Chan o
Office of Research Methodology produced estimated paramaters and relative stan
errors. Nancy Gagne, Richard H. Coles, Mira L. B. Shanks, Loung Tonthat, and J
Page of the Systems and Programming Branch did the computer programming fo
report. This report was edited by Klaudia M. Cox and typeset by Annette F. Holman
the Publications Branch, Division of Data Services.
l
onin
lthan
ingchndofed.the
hhehisri-arster-ei-he
hme.e-icerari-uta-0
(1). In 1985, a new sample for the NHIS and a differemethod of presenting sampling errors were introduced. Thefore, the technical material is important to readers accustomto using data from the NHIS prior to 1985.
Although published reports are the primary methoddisseminating estimates from the NHIS, data also are availain standardized microdata tapes. Tapes containing informatfrom the NHIS Core questionnaires from 1969 through 19are available for purchase from the National Technical Infomation Service (NTIS), 5285 Port Royal Road, SpringfielVA 22161. Public use tapes also are available for spectopics included in the NHIS from 1973 through 1994. Infomation about the cost and availability of these tapes canobtained from the National Center for Health Statistics, Divsion of Health Interview Statistics, Systems and ProgrammBranch, 6525 Belcrest Road, Hyattsville, MD 20782. Publuse microdata on compact disk read-only memory (CD-ROMare available for the NHIS core and special topic data for 19through 1992. They can be purchased through the NTIS,from the Government Printing Office (GPO), Superintendeof Documents, U.S. Government Printing Office, WashingtoDC 20402. Questions about CD-ROM data files shoulddirected to the National Center for Health Statistics, DaDissemination Branch at 301–436–8500.
The special topics included in the 1994 NHIS covered tfollowing five areas:
+ Childhood immunizations (including hepatitis b);+ Disability (including sensory, communication, and mobi
ity problems; health conditions; activities of daily livingand independent activities of daily living; functional limi-tations; mental health; services and benefits; special heneeds of children; early child development; educatiorelationship to respondent; and perceived disability);
+ Family resources (including access to care, health insance, and detailed income);
+ Year 2000 objectives (including environmental healttobacco, nutrition, occupational safety and health, hedisease and stroke, clinical preventive services, famhealth knowledge, and firearm safety); and
+ Acquired immunodeficiency syndrome (AIDS) knowledge and attitudes (including sources of AIDS informtion, knowledge of AIDS virus transmission, blood donatioexperience, personal acquaintance with persons with AIor the AIDS virus, a general question on AIDS risbehaviors, and self-assessed knowledge of tuberculos
f
the
ard
ne
the
of
1
drealessi
sd
srrhe
lldithse).
ths
Data from the special health topics in 1994 were collectethroughout the entire year. The immunization questionnaicollected information on a sample child under age 6 and onchildren 19–35 months of age in each family with age-eligiblchildren. The disability and family resources questionnairewere asked about all family members. All other health topicwere asked of one sample adult 18 years of age and overeach household.
In 1994, there were also a series of followback surveybased on responses to the NHIS interviews. These include
2
l
n
+ The disability followback (with separate questionnairefor children under 18 years of age with disabilities, foadults 18 years of age and over with disabilities, and fopersons18 years of age and over who had polio in tpast);
+ The supplement on aging (a followback survey of aadults 69 years of age and over without a disability); an
+ Access to care (a telephone followup on respondents waccess to care problems, asthma, or ischemic heart disea
These followback surveys were conducted several monafter the initial NHIS interview.
-acdoot
0te
se
s
g
m
A
sa
ic
nsda.yewefoo
es
d
e
ta
f
Source and limitations ofdata
The information from the National Health Interview Survey (NHIS) in this report is based on data collected incontinuing nationwide survey by household interview. Eaweek a probability sample of the civilian noninstitutionalizepopulation of the United States is interviewed by personnelthe U.S. Bureau of the Census. Information is obtained abthe health and other characteristics of each member ofhousehold.
The interviewed sample for 1994 consisted of 45,7households containing 116,179 persons. The total noninview rate was 5.9 percent: 4.2 percent was the resultrespondent refusal, and the remainder was primarily the reof failure to locate an eligible respondent at home aftrepeated calls as described in appendix I.
In 1994, the following changes were made to the bahealth and demographic questionnaire:
+ A question was added asking if there were a workintelephone in the home;
+ The questions on race were moved within section L froquestions 3a and 3b to questions 4a and 4b;
+ The Hispanic Origin questions were moved from section(questions 4e and 4f) to section L (questions 3a and 3b
+ The question added in 1992 asking persons 12–21 yearage if they were in school or on vacation from school wdeleted; and
+ The questions added in 1992 to oversample Hispanwere deleted.
For a detailed list of changes to the basic health ademographic questionnaire that have occurred since 1985,appendix I. A description of the survey design, the methoused in estimation, and general qualifications of the dobtained from the survey are also presented in appendix I
All information collected in the survey is from reports bresponsible family members residing in the household. Whpossible, all adult family members participate in the intervieHowever, proxy responses are accepted for family membwho are not at home and are required for all children andfamily members who are physically or mentally incapableresponding for themselves. Although a considerable effort
h
futhe
5r-ofultr
ic
);ofs
s
deesta
n.rsrfis
made to ensure accurate reporting, the information from bothproxy respondents and self-respondents may be inaccuratbecause the respondent is unaware of relevant information, haforgotten it, does not wish to reveal it to an interviewer, orbecause the respondent does not understand the intendemeaning of a question.
Because the estimates in this report are based on a samplof the population, they are subject to sampling errors. There-fore, readers should pay particular attention to ‘‘Reliability ofthe estimates’’ in appendix I of this report, which showsformulas for calculating standard errors along with instruc-tions for their use. The estimated standard error parametersand relative standard error cut-off points presented in thisreport were derived from 1991 data because 1994 data werenot available. The 1991 parameters were used because the dacollection methods were similar to those in 1994 and bothwere based on a full sample. Although the 1991 estimatedstandard error parameters used in this report may differ fromthose that would be derived using the 1994 data, the 1991 dataare more comparable than other more recent years because othe different sampling designs used in 1992 and 1993.
In this report, terms such as ‘‘similar’’ and ‘‘no differ-ence’’ mean that there is no statistically significant differencebetween the measures being compared. Terms relating todifference (for example, ‘‘greater than ’’ or ‘‘less than’’)indicate that differences are statistically significant. Individualt-tests, with a critical value of 1.96 (0.05 level of significance),were used to test all comparisons. These tests do not takemultiple comparisons into account. Lack of comment regard-ing the difference between any two statistics does not meanthe difference was tested and found to be not significant.
The major concepts for these estimates are described inappendix II and the questionnaires and flashcards used in theinterview are shown in appendix III. Illnesses and injuries arecoded using a slight modification of the ninth revision of theInternational Classification of Diseases(2). The Division ofHealth Interview Statistics of NCHS should be contacted forinformation about coding and editing procedures used toproduce the final data file from which the estimates shown arederived.
3

dathsrtc
einic-
icea
is
taa
eao
n–aa
cer
s-tesre8.9ity
re4,thetellyast
,stndaysgilyded-y,dr
ultutei-nschice,tey toh’’ty.tec-) isearte
Selected results and uses oftables
In the following sections, each of the health-relatecharacteristics included in this report is defined and the over1994 estimates are presented. Although previous issues ofreport included tables comparing current estimates with thofrom earlier years, they have been eliminated in this repoHowever, some comparisons are noted where large differenhave been observed between the 1994 and 1993 estimatesthe same characteristic. Readers wanting more extensive coparisons should refer to Series 10, No. 190 (3) for the 199estimates.
Readers comparing subgroups of the population in tabl1–78 may want to consider the possible effect of agecomparing subgroups. For sociodemographic characteristfor which the age distribution of the subgroups differs significantly (such as sex, race, and family income), the results ashown for specific age groups. However, for geographregion and place of residence, there is little difference in thage distributions of the subgroups. Therefore, these resultsnot shown for specific age groups.
Tables 1–77 show detailed results for health charactertics. The population figures used to calculate the rates aretable 78.
Acute conditions: Incidence, medicalattention, and associated restriction inactivity
An acute condition is defined for the National HealthInterview Survey (NHIS) as a type of illness or injury thaordinarily lasts less than 3 months, was first noticed less th3 months before the reference date of the interview, and wserious enough to have had an impact on behavior. Only twtypes of impact are considered: (a) the illness or injury causthe person to cut down on daily activities for at least halfday, or (b) a physician was contacted regarding the illnessinjury.
Incidence
Incidence rates for acute conditions by type of conditioand sociodemographic characteristics are shown in tables 1and incidence (number) is shown in tables 6–10. The 1994 rof 171.5 acute conditions per 100 persons per year wsignificantly lower than the 1993 rate of 190.4.
For broad types of acute conditions, the 1994 incidenrates per 100 persons per year rank as follows: respirato
4
llise.esform-3
s
s
re
re
-in
nsod
r
5tes
y
conditions (80.5), injuries (23.8), infective and parasitic dieases (20.9), and digestive system conditions (6.1). The rafor respiratory conditions (80.5) and influenza (34.8) aconsiderably lower than the corresponding rates for 1993 (9and 52.2, respectively) primarily due to less influenza activin 1994.
Medical attention
Estimates of the percent of acute conditions that wemedically attended are shown in tables 11–15. During 199an estimated 67.3 percent of acute conditions reported inNHIS were medically attended. Of the broad types of acuconditions, injuries were proportionately most often medicaattended (91.7 percent) and respiratory conditions were leoften medically attended (50.1 percent).
Restricted activity associated with acute conditions
Four types of restricted activity resulting from illnessinjury, or impairment are measured in the NHIS: days lofrom work for currently employed persons 18 years of age aover, school days missed by youths 5–17 years of age, dspent in bed (which may overlap either of the precedintypes), and other days on which a person cuts down on daactivities. Estimates of ‘‘cut-down’’ days are not presenteseparately, but are included in the generic concept of ‘‘restrictactivity days.’’ The other three types of restricted activitwhich are also included in the generic concept ‘‘restricteactivity,’’ are usually shown separately in this and othereports from the NHIS.
A person may restrict activities on a given day as a resof more than one condition and these conditions may be acor chronic. ‘‘Restricted activity associated with acute condtions’’ includes days on which one or more acute conditiocaused the activity restriction. It also includes days on whione or more acute conditions and one or more chronconditions caused the activity restriction. In the latter casbecause the restriction in activity was the result of both acuand chronic conditions, the cause cannot be attributed solelan acute condition. Therefore, the term ‘‘associated witrather than ‘‘caused by’’ is used to describe restricted activi
Incidence rates of restricted activity associated with acuconditions by type of condition and sociodemographic charateristics are shown in tables 16–20 and incidence (numbershown in tables 21–25. The 1994 rate per 100 persons per yof restricted-activity days (693.3) is lower than the ra

yginaobb
nth.3iso
hh
taynoohn9thIrs
o
tintrthr
raTyiellsb
a
-
hearns
re
edeisineshecu-of
,nse12
eicoreedi-
ninss,y
y).
al
ls
rtoes
observed in 1993 (781.1). The rates of bed disability da(287.6) and school-loss days for youths 5–17 years of a(331.2) are also substantially lower than the correspondrates for 1993 ( 335.9, and 412.4, respectively). The 1994 rof work-loss days for currently employed persons 18 yearsage and over is 312.2. Detailed rates and frequencies fordays, work-loss days, and school-loss days are shown in ta26–49.
Incidence by quarter
The 1994 incidence rate and incidence of acute conditioby quarter are shown in table 50. The estimated rate forfirst quarter of 1994 is 51.5, for the second quarter it is 37for the third quarter it is 33.1, and for the fourth quarter it49.6. The rates for the first (51.5) and the fourth quarters1994 (49.6) are significantly lower than the rates observed1993 (62.2 and 56.1, respectively). This is primarily due to tresult of less influenza activity during the first and fourtquarters of 1994.
Episodes of persons injured
Injury data may be analyzed in three ways: (a) the tonumber of injuries sustained during episodes involving injur(b) the number of episodes involving injury during a giveperiod of time, or (c) the number of persons involved in onemore episodes in which injury occurred during a periodtime. The estimated number of injuries (measured above) toccurred during 1994 is shown in tables 1–50. Tables 51 a52 present the number of episodes that occurred during 1that involved one or more injuries (measure b). Because ofshort reference period used to collect injury data in the NH(2 weeks), the number of persons involved in one or moepisodes during any given year (measure c) cannot be emated.
Table 51 shows the incidence rate of episodes of persinjured and table 52 shows the incidence of such episodessociodemographic characteristics, by whether a moving movehicle was involved and, if so, whether this occurredtraffic. The table also shows episodes classified by whereepisode occurred and for persons 18 years of age and ovewhether they were working at a job or business at the timeepisode occurred. The 1994 rate of episodes of persons injuper 100 persons per year is 23.3.
Restricted activity associated with injuryand impairment due to injury
An injury may have health-related effects for many yeaafter its occurrence or even for a lifetime (for example,person who suffered a dislocated back due to an accident).estimates of activity restriction (tables 53–54) and of bed da(tables 55–56) are based on the current effects of injurregardless of when they occurred. Thus, these estimates incthe days shown in earlier tables for acute injuries and ainclude days of restricted activity during 1994 that are attriutable to the effects of injuries suffered prior to 1994. In mancases, these old injuries have become impairments and
segtefedles
se,
fine
l,
rfatd94eSeti-
nsbyor
hebyeed
s
hessudeo-yny
restricted activity during 1994 that was caused by an injuryrelated impairment is also included.
The 1994 rate for restricted-activity days associated witepisodes of persons injured is 304.5 per 100 persons per yand the rate for bed days associated with episodes of persoinjured is 83.1 per 100 persons per year.
Prevalence of reported chronic conditions
Chronic conditions are defined as conditions that eithe(a) were first noticed 3 months or more before the referencdate of the interview or (b) belong to a group of conditions(including heart disease and diabetes) that are considerchronic regardless of when they began. To estimate thprevalence of reported chronic conditions, the NHIS sampledivided into six representative subsamples; respondentseach subsample are administered one of six checklists of typof chronic conditions. Respondents are asked to indicate tpresence or absence of each condition specified on the partilar list assigned to them. Because the presence or absencemany types of chronic conditions is often difficult to ascertainseveral ‘‘impact’’ questions are asked about each conditioreported. Information is elicited on whether the person habeen hospitalized for the condition and the number of days hor she stayed in bed because of the condition during themonths prior to the interview.
Totals for all chronic conditions are not shown becausthe NHIS does not measure the total number of chronconditions for each person. Because a person may have mthan one chronic condition, the sum of conditions that arcounted may exceed the sum of persons having those contions.
Prevalence rates for selected chronic conditions are showin tables 57–61 and the prevalence (number) is showntables 62–66. As shown in table 57, the reported conditionwith the highest prevalence rates were sinusitis, arthritideformity or orthopedic impairment, hypertension, and hafever or allergic rhinitis without asthma (with rates per 1,000persons of 134.4, 128.8, 119.7, 108.8, and 100.7 respectivel
Limitation of activity due to chronicconditions
Limitation of activity refers to long-term reduction inactivity resulting from chronic disease or impairment. TheNHIS measurement of limitation of activity permits one todistinguish among (a) persons unable to carry on their usuactivity, (b) persons limited in the amount or kind of theirusual activity, (c) persons limited but not in their usuaactivity, and (d) persons not limited. The category of personlimited in their major activity includes those in the first twogroups, that is, those unable to carry on usual activities fotheir age group, whether it is working, keeping house, goingschool, or living independently, and those restricted in thamount or kind of usual activity for their age group. Person
5
eda
inheespeonin
tedhipeoe,
oedrfooac
kiiloowin-erre
inenheon
tsInan7aroer
r-reofasinedanu-ng
byryede2ce
tal-arhisr ofheedesetayll
esn’ser-oner-reas
tofthebyheedr-talisof
ethe
limited, but not in their major activity, include persons restrictin other activities such as civic, church, or recreationactivities.
The 1994 estimate of the percent of persons limitedactivity due to chronic conditions is 15.0 percent and testimate of persons limited in their major activity (categori(a) and (b) discussed in the previous paragraph) is 10.3cent. The percent distributions and frequencies for limitatiin activity are shown by sociodemographic characteristicstables 67–68.
Restricted activity due to acute andchronic conditions
Earlier, estimates of restricted-activity days associawith acute conditions (tables 16–49) and the relationsbetween the types of restricted-activity days were discussThe estimates shown in table 69 are for person daysrestricted activity resulting from all conditions, either acutchronic, or both.
The 1994 estimated days of restricted activity per persper year are as follows: 16.0 days for all types of restrictactivity, 6.2 days of bed disability, 5.2 days lost from work focurrently employed persons, and 4.5 days lost from schoolyouths 5–17 years of age. The estimates for each typerestricted-activity day are shown by sociodemographic charteristics in table 69.
Respondent-assessed health status
Data on assessed health status are obtained by asrespondents to assess their own health or that of fammembers living in the same household as excellent, very gogood, fair, or poor. The percent distribution for these categries, according to sociodemographic characteristics, is shoin table 70. The health of most persons in the civilian nonstitutionalized population is assessed as ‘‘excellent’’ (37.9 pcent) or ‘‘very good’’ (28.5 percent). Only 2.9 percent aassessed as ‘‘poor’’.
Physician contacts: Rate and interval sincelast contact
A contact is defined as a consultation with a physician,person or by telephone, for examination, diagnosis, treatmor advice. The visit is considered a physician contact if tservice is provided by the physician or by another persworking under the physician’s supervision.
Annual rate
As shown in table 71, the rate of physician contacreported for 1994 is 6.1 doctor visits per person per year.addition to the sociodemographic characteristics, the ratesfrequencies also are shown by the place of contact in tableThe rate is highest for doctor’s office (3.4 per person per yeand is less than one contact per person per year via telephand hospital while ‘‘other’’ place is about one contact pperson per year.
6
l
r-
d.f
n
rf-
ngyd,-n
-
t,
d1.)ne
Interval since last contact
The percent distribution and number of persons by inteval of time since the person last had a physician contact ashown in table 72. Whereas the estimates for the ratephysician contacts do not include contacts while a person wan overnight patient in a hospital, such contacts are includedthe definitions of the interval since a person last saw or talkto a physician or a physician’s assistant. During 1994,estimated 78.8 percent of the civilian noninstitutionalized poplation had contact with a physician during the year precedithe interview.
Other estimates of ambulatory medical care servicesphysicians are provided by data from the National AmbulatoMedical Care Survey, a probability sample survey conductperiodically by the Division of Health Care Statistics of thNational Center for Health Statistics. A summary of 199survey results, the most recent available, is found in Advandata from vital and health statistics, No. 253 (4).
Hospitalization: Episodes and days forpersons; discharges and average length ofstay
The NHIS respondents are asked to describe any hospiizations that involved at least a one-night stay during the yepreceding the interview. Two measures obtained through tseries of questions are the number of times and the numbedays spent in short-stay hospitals in the 12 months prior to tinterview. Because persons who died or were institutionalizin a given reference period are not included in the NHIS, thrates and frequencies shown in this report will vary from thobased on all overnight patients who entered a short-shospital during any given period of time. The difference wibe greater for older persons.
Estimates of hospitalizations are presented for episodand for discharges. Episode estimates focus on the persohospital experience during the 12 months preceding the intview. The tables showing these estimates classify peoplethe basis of whether they were hospitalized during the refence period and, if so, the number of times they wehospitalized. Discharge estimates focus on hospital staysthe unit of analysis rather than on persons.
Hospital episodes and days
The distribution of short-stay hospital episodes (firsincluding and then excluding deliveries) by the numbertimes a person was hospitalized during the year precedinginterview and sociodemographic characteristics are shownpercent distribution (table 73) and frequency (table 74). Tcategory ‘‘delivery’’ is based on the reason the woman enterthe hospital or whether surgery related to delivery was peformed. The percent of persons in 1994 with one hospiepisode or more during the year preceding the interview7.5 percent and is 27 percent lower than the 1982 estimate10.3 percent (1).
The total number of days (strictly speaking, nights) thperson spent as a patient in the hospital is associated with
itn.wthntic
abe7rga
isag
-ientli-hmerents’
methe
e ofndd atesd.heon
number of times a person was in a short-stay hospduring the year preceding the interview. In 1994, persowith one hospitalization or more spent an average of 7days in the hospital in the year preceding the intervieEstimated rates and numbers of hospital days bynumber of times people were hospitalized (including aexcluding deliveries) and sociodemographic characterisare shown in tables 75 and 76.
Hospital discharges and average length of stay
Rates and numbers of hospital discharges, the averlength of stay, and the number of hospital discharge dayssociodemographic characteristics and by whether a delivwas involved in the hospitalization are shown in table 7Based on data collected during 1994, there are 10.6 dischaper 100 persons, and the average length of stay per dischis 5.9 days.
Examining longer term trends, the 1994 hospital dcharge rate of 10.6 is about 25 percent lower than the restimated by the NHIS in 1981 (14.2), and the averalength of stay, 5.9 days, is about 20 percent lower than1981 (7.4) (5).
als4.eds
geyry.esrge
-teein
This finding probably reflects the following two phenomena: (a) some medical procedures, once performed as inpathospital care, are now performed in outpatient medical facities, and (b) the Health Care Financing Administration (whicoperates the Medicare program), some States, and sothird-party payers now reimburse hospitals for inpatient causing a preestablished payment schedule based on patiediagnosis-related groups.
Information also is collected on hospital discharges frohospital records through the National Hospital DischargSurvey (NHDS) conducted by the National Center for HealStatistics. Estimates from the NHDS, published in Advancdata or Series 13 publications ofVital and Health Statistics,are somewhat higher than those presented here becausdifferences in collection procedures, population sampled, adefinitions used. In recent years, the NHDS has experiencedecline in its hospital discharge rates, and the NHDS estimaof average length of stay for all persons also have declineThus, the trend data from the two surveys are consistent. Tmost recent national estimates of short-stay hospitalizatibased on the NHDS are summarized inVital and HealthStatistics, Series 13, no. 121 (6).
7

thta
tisatfe
nalth
ey; nis
ewti
mlth
n40)
eyr
d.
-
i-r
l
fc
References
1. National Center for Health Statistics. Current estimates fromNational Health Interview Survey: United States, 1982. ViHealth Stat 10(150). 1985.
2. World Health Organization. Manual of the International Statical Classification of Diseases, Injuries, and Causes of Debased on the recommendations of the Ninth Revision Conence, 1975. Geneva: World Health Organization. 1977.
3. Benson V, Marano MA. Current estimates from the NatioHealth Interview Survey, 1993. National Center for HeaStatistics. Vital Health Stat 10(190). 1994.
4. Schappert, SM. National Ambulatory Medical Care Surv1992 summary. Advance data from vital and health statistics253. Hyattsville, Maryland: National Center for Health Stattics. 1994.
5. Bloom B. Current estimates from the National Health InterviSurvey: United States, 1981. National Center for Health Statics. Vital Health Stat 10(141). 1982.
6. Graves EJ. National Hospital Discharge Survey: Annual Sumary, 1993. National Center for Health Statistics. Vital HeaStat 13 (121). 1995.
7. Massey JT, Moore TF, Parsons VL, Tadros W. Design aestimation for the National Health Interview Survey, 1985–9National Center for Health Statistics. Vital Health Stat 2(111989.
8. Kovar MG, Poe GS. The National Health Interview Survdesign, 1973–84, and procedures, 1975–83. National CenteHealth Statistics. Vital Health Stat 1(18). 1985.
8
el
-h,r-
l
:o-
s-
-
d..
for
9. Koons DA. Quality control and measurement of nonsamplingerror in the Health Interview Survey. National Center for HealthStatistics. Vital Health Stat 2(54). 1973.
10. Balamuth E, Shapiro S. Health interview responses comparewith medical records. National Center for Health StatisticsVital Health Stat 2(7). 1965.
11. Cannell CF, Fowler FJ Jr. Comparison of hospitalization reporting in three survey procedures. National Center for HealthStatistics. Vital Health Stat 2(8). 1965.
12. Madow WG. Interview data on chronic conditions comparedwith information derived from medical records. National Centerfor Health Statistics. Vital Health Stat 2(23). 1967.
13. Cannell CF, Fowler FJ Jr., Marquis KH. The influence ofinterviewer and respondent psychological and behavioral varables on the reporting in household interviews. National Centefor Health Statistics. Vital Health Stat 2(26). 1968.
14. National Center for Health Statistics. Reporting of hospitaliza-tion in the Health Interview Survey. Vital Health Stat 2(6).1965.
15. Benson V, Marano MA. Current estimates from the NationaHealth Interview Survey, 1992. National Center for HealthStatistics. Vital Health Stat 10(189). 1994.
16. U.S. Bureau of the Census. National Health Interview SurveyField Representative’s Manual. HIS-100. U.S. Department oCommerce acting as a collecting agent for the U.S. PubliHealth Service. 1994.
List of detailed tables
Incidence of acute conditions
Rates
1. Number of acute conditions per 100 persons per year, byage and type of condition: United States, 1994. . . . . . 12
2. Number of acute conditions per 100 persons per year, bysex, age, and type of condition: United States, 1994 . . .13
3. Number of acute conditions per 100 persons per year, byrace, age, and type of condition: United States, 1994 . .14
4. Number of acute conditions per 100 persons per year, byfamily income, age, and type of condition: United States,1994 . . . . . . . . . . . . . . . . . . . . . . . . . . . . . . . . . . . . . 15
5. Number of acute conditions per 100 persons per year, bygeographic region, place of residence, and type of condi-tion: United States, 1994. . . . . . . . . . . . . . . . . . . . . . . 17
Frequencies
6. Number of acute conditions, by age and type of condi-tion: United States, 1994. . . . . . . . . . . . . . . . . . . . . . . 18
7. Number of acute conditions, by sex, age, and type ofcondition: United States, 1994. . . . . . . . . . . . . . . . . . . 19
8. Number of acute conditions, by race, age, and type ofcondition: United States, 1994. . . . . . . . . . . . . . . . . . . 20
9. Number of acute conditions, by family income, age, andtype of condition: United States, 1994. . . . . . . . . . . . . 21
10. Number of acute conditions, by geographic region, placeof residence, and type of condition: United States,1994 . . . . . . . . . . . . . . . . . . . . . . . . . . . . . . . . . . . . . 23
Percent of acute conditions medicallyattended
11. Percent of acute conditions medically attended, by age andtype of condition: United States, 1994. . . . . . . . . . . . . . 24
12. Percent of acute conditions medically attended, by sex,age, and type of condition: United States, 1994. . . . . . . 25
13. Percent of acute conditions medically attended, by race,age, and type of condition: United States, 1994. . . . . . . 26
14. Percent of acute conditions medically attended, by familyincome, age, and type of condition: United States,1994 . . . . . . . . . . . . . . . . . . . . . . . . . . . . . . . . . . . . . . 27
15. Percent of acute conditions medically attended, by geo-graphic region, place of residence, and type of condition:United States, 1994. . . . . . . . . . . . . . . . . . . . . . . . . . . 29
Restricted activity associated with acuteconditions
Restricted-activity days: Rates
16. Number of restricted-activity days associated with acuteconditions per 100 persons per year, by age and type ofcondition: United States, 1994. . . . . . . . . . . . . . . . . . . 30
17. Number of restricted-activity days associated with acuteconditions per 100 persons per year, by sex, age, and typeof condition: United States, 1994. . . . . . . . . . . . . . . . . 31
18. Number of restricted-activity days associated with acuteconditions per 100 persons per year, by race, age, and typeof condition: United States, 1994. . . . . . . . . . . . . . . . . 32
19. Number of restricted-activity days associated with acuteconditions per 100 persons per year, by family income,age, and type of condition: United States, 1994. . . . . . . 33
20. Number of restricted-activity days associated with acuteconditions per 100 persons per year, by geographic region,place of residence, and type of condition: United States,1994 . . . . . . . . . . . . . . . . . . . . . . . . . . . . . . . . . . . . . . 35
Restricted-activity days: Frequencies
21. Number of restricted-activity days associated with acuteconditions, by age and type of condition: United States,1994 . . . . . . . . . . . . . . . . . . . . . . . . . . . . . . . . . . . . . . 36
22. Number of restricted-activity days associated with acuteconditions, by sex, age, and type of condition: UnitedStates, 1994. . . . . . . . . . . . . . . . . . . . . . . . . . . . . . . . . 37
23. Number of restricted-activity days associated with acuteconditions, by race, age, and type of condition: UnitedStates, 1994. . . . . . . . . . . . . . . . . . . . . . . . . . . . . . . . . 38
24. Number of restricted-activity days associated with acuteconditions, by family income, age, and type of condition:United States, 1994. . . . . . . . . . . . . . . . . . . . . . . . . . . 39
25. Number of restricted-activity days associated with acuteconditions, by geographic region, place of residence, andtype of condition: United States, 1994. . . . . . . . . . . . . . 41
Bed days: Rates
26. Number of bed days associated with acute conditions per100 persons per year, by age and type of condition: UnitedStates, 1994. . . . . . . . . . . . . . . . . . . . . . . . . . . . . . . . . 42
27. Number of bed days associated with acute conditions per100 persons per year, by sex, age, and type of condition:United States, 1994. . . . . . . . . . . . . . . . . . . . . . . . . . . 43
9
47
49
50
28. Number of bed days associated with acute conditions per100 persons per year, by race, age, and type of condition:United States, 1994. . . . . . . . . . . . . . . . . . . . . . . . . . . 44
29. Number of bed days associated with acute conditions per100 persons per year, by family income, age, and type ofcondition: United States, 1994. . . . . . . . . . . . . . . . . . . 45
30. Number of bed days associated with acute conditions per100 persons per year, by geographic region, place ofresidence, and type of condition: United States, 1994 . . .
Bed days: Frequencies
31. Number of bed days associated with acute conditions, byage and type of condition: United States, 1994. . . . . . . 48
32. Number of bed days associated with acute conditions, bysex, age, and type of condition: United States, 1994 . . .
33. Number of bed days associated with acute conditions, byrace, age, and type of condition: United States, 1994 . . .
34. Number of bed days associated with acute conditions, byfamily income, age, and type of condition: United States,1994 . . . . . . . . . . . . . . . . . . . . . . . . . . . . . . . . . . . . . . 51
35. Number of bed days associated with acute conditions, bygeographic region, place of residence, and type of condi-tion: United States, 1994. . . . . . . . . . . . . . . . . . . . . . . 53
Work-loss days: Rates
36. Number of work-loss days associated with acute condi-tions per 100 currently employed persons 18 years of ageand over, by age and type of condition: United States,1994 . . . . . . . . . . . . . . . . . . . . . . . . . . . . . . . . . . . . . . 54
37. Number of work-loss days associated with acute condi-tions per 100 currently employed persons 18 years of ageand over, by sex, age, and type of condition: United States,1994 . . . . . . . . . . . . . . . . . . . . . . . . . . . . . . . . . . . . . . 55
38. Number of work-loss days associated with acute condi-tions per 100 currently employed persons 18 years of ageand over, by race, age, and type of condition: UnitedStates, 1994. . . . . . . . . . . . . . . . . . . . . . . . . . . . . . . . . 56
39. Number of work-loss days associated with acute condi-tions per 100 currently employed persons 18 years of ageand over, by family income, age, and type of condition:United States, 1994. . . . . . . . . . . . . . . . . . . . . . . . . . . 57
40. Number of work-loss days associated with acute condi-tions per 100 currently employed persons 18 years of ageand over, by geographic region, place of residence, andtype of condition: United States, 1994. . . . . . . . . . . . . . 58
Work-loss days: Frequencies
41. Number of work-loss days associated with acute condi-tions for currently employed persons 18 years of age andover, by age and type of condition: United States, 1994 .59
42. Number of work-loss days associated with acute condi-tions for currently employed persons 18 years of age andover, by sex, age, and type of condition: United States,1994 . . . . . . . . . . . . . . . . . . . . . . . . . . . . . . . . . . . . . . 60
43. Number of work-loss days associated with acute condi-tions for currently employed persons 18 years of age andover, by race, age, and type of condition: United States,1994 . . . . . . . . . . . . . . . . . . . . . . . . . . . . . . . . . . . . . . 61
44. Number of work-loss days associated with acute condi-tions for currently employed persons 18 years of age and
10
over, by family income, age, and type of condition: UnitedStates, 1994. . . . . . . . . . . . . . . . . . . . . . . . . . . . . . . . . 62
45. Number of work-loss days associated with acute condi-tions for currently employed persons 18 years of age andover, by geographic region, place of residence, and type ofcondition: United States, 1994. . . . . . . . . . . . . . . . . . . 63
School-loss days: Rates
46. Number of school-loss days associated with acute condi-tions per 100 youths 5–17 years of age, by sex, race,family income, and type of condition: United States,1994 . . . . . . . . . . . . . . . . . . . . . . . . . . . . . . . . . . . . . . 64
47. Number of school-loss days associated with acute condi-tions per 100 youths 5–17 years of age, by geographicregion, place of residence, and type of condition: UnitedStates, 1994. . . . . . . . . . . . . . . . . . . . . . . . . . . . . . . . . 65
School-loss days: Frequencies
48. Number of school-loss days associated with acute condi-tions for youths 5–17 years of age, by sex, race, familyincome, and type of condition: United States, 1994. . . . 66
49. Number of school-loss days associated with acute condi-tions for youths 5–17 years of age, by geographic region,place of residence, and type of condition: United States,1994 . . . . . . . . . . . . . . . . . . . . . . . . . . . . . . . . . . . . . . 67
Incidence of acute conditions by quarter
50. Number of acute conditions per 100 persons per quarterand number of acute conditions, by quarter and type ofcondition: United States, 1994. . . . . . . . . . . . . . . . . . . 68
Episodes of persons injured andassociated restriction of activity
51. Number of episodes of persons injured per 100 personsper year, by whether in moving motor vehicle, whether atwork, place of accident, and sociodemographic character-istics: United States, 1994. . . . . . . . . . . . . . . . . . . . . . . 69
52. Number of episodes of persons injured, by whether inmoving motor vehicle, whether at work, place of accident,and sociodemographic characteristics: United States,1994 . . . . . . . . . . . . . . . . . . . . . . . . . . . . . . . . . . . . . . 71
53. Number of restricted-activity days associated with epi-sodes of persons injured per 100 persons per year, bywhether in moving motor vehicle, whether at work, placeof accident, and sociodemographic characteristics: UnitedStates, 1994. . . . . . . . . . . . . . . . . . . . . . . . . . . . . . . . . 73
54. Number of restricted-activity days associated with epi-sodes of persons injured, by whether in moving motorvehicle, whether at work, place of accident, and sociode-mographic characteristics: United States, 1994. . . . . . . . 75
55. Number of bed days associated with episodes of personsinjured per 100 persons per year, by whether in movingmotor vehicle, whether at work, place of accident, andsociodemographic characteristics: United States, 1994 . .77
56. Number of bed days associated with episodes of personsinjured, by whether in moving motor vehicle, whether atwork, place of accident, and sociodemographic character-istics: United States, 1994. . . . . . . . . . . . . . . . . . . . . . . 79
7
Prevalence of chronic conditions
Rates
57. Number of selected reported chronic conditions per 1,000persons, by age: United States, 1994. . . . . . . . . . . . . . . 81
58. Number of selected reported chronic conditions per 1,000persons, by sex and age: United States, 1994. . . . . . . . . 83
59. Number of selected reported chronic conditions per 1,000persons, by race and age: United States, 1994. . . . . . . . 85
60. Number of selected reported chronic conditions per 1,000persons, by family income and age: United States,1994 . . . . . . . . . . . . . . . . . . . . . . . . . . . . . . . . . . . . . . 87
61. Number of selected reported chronic conditions per 1,000persons, by geographic region and place of residence:United States, 1994. . . . . . . . . . . . . . . . . . . . . . . . . . . 91
Frequencies
62. Number of selected reported chronic conditions, by age:United States, 1994. . . . . . . . . . . . . . . . . . . . . . . . . . . 93
63. Number of selected reported chronic conditions, by sexand age: United States, 1994. . . . . . . . . . . . . . . . . . . . . 95
64. Number of selected reported chronic conditions, by raceand age: United States, 1994. . . . . . . . . . . . . . . . . . . . . 97
65. Number of selected reported chronic conditions, by familyincome and age: United States, 1994. . . . . . . . . . . . . . . 99
66. Number of selected reported chronic conditions, by geo-graphic region and place of residence: United States,1994 . . . . . . . . . . . . . . . . . . . . . . . . . . . . . . . . . . . . . . 103
Limitation of activity due to chronicconditions
67. Percent distribution of persons by degree of activitylimitation due to chronic conditions, according to sociode-mographic characteristics: United States, 1994. . . . . . . . 105
68. Number of persons by degree of activity limitation due tochronic conditions and sociodemographic characteristics:United States, 1994. . . . . . . . . . . . . . . . . . . . . . . . . . . 107
Restricted activity associated with acuteand chronic conditions
69. Number of days per person per year and number of daysof activity restriction due to acute and chronic conditions,by type of restriction and sociodemographic characteris-tics: United States, 1994. . . . . . . . . . . . . . . . . . . . . . . . 109
Respondent-assessed health status
70. Number of persons and percent distribution by respondent-assessed health status, according to sociodemographiccharacteristics: United States, 1994. . . . . . . . . . . . . . . . 111
Physician contacts
71. Number per person per year and number of physiciancontacts, by place of contact and sociodemographic char-acteristics: United States, 1994. . . . . . . . . . . . . . . . . . . 113
72. Percent distribution and number of persons by intervalsince last physician contact, according to sociodemo-graphic characteristics: United States, 1994. . . . . . . . . . 115
Hospitalization
73. Percent distribution of living persons by number of short-stay hospital episodes during the year preceding interviewfor all causes and excluding deliveries, according tosociodemographic characteristics: United States, 1994 . . 11
74. Number of living persons, by number of short-stay hospi-tal episodes during the year preceding interview for allcauses and excluding deliveries and by sociodemographiccharacteristics: United States, 1994. . . . . . . . . . . . . . . . 119
75. Number of short-stay hospital days during the year preced-ing interview per living person hospitalized for all causesand excluding deliveries, by number of episodes andsociodemographic characteristics: United States,1994 . . . . . . . . . . . . . . . . . . . . . . . . . . . . . . . . . . . . . . 121
76. Number of short-stay hospital days during the year preced-ing interview for living persons hospitalized for all causesand excluding deliveries, by number of episodes andsociodemographic characteristics: United States,1994 . . . . . . . . . . . . . . . . . . . . . . . . . . . . . . . . . . . . . . 123
77. Number per 100 persons per year and annual number ofshort-stay hospital discharges, average length of stay, andannual number of hospital days for living persons hospi-talized for all causes and excluding deliveries, by sociode-mographic characteristics: United States, 1994. . . . . . . . 125
Population78. Number of persons of all ages and number of currently
employed persons 18 years of age and over, by sociode-mographic characteristics: United States, 1994. . . . . . . . 127
11
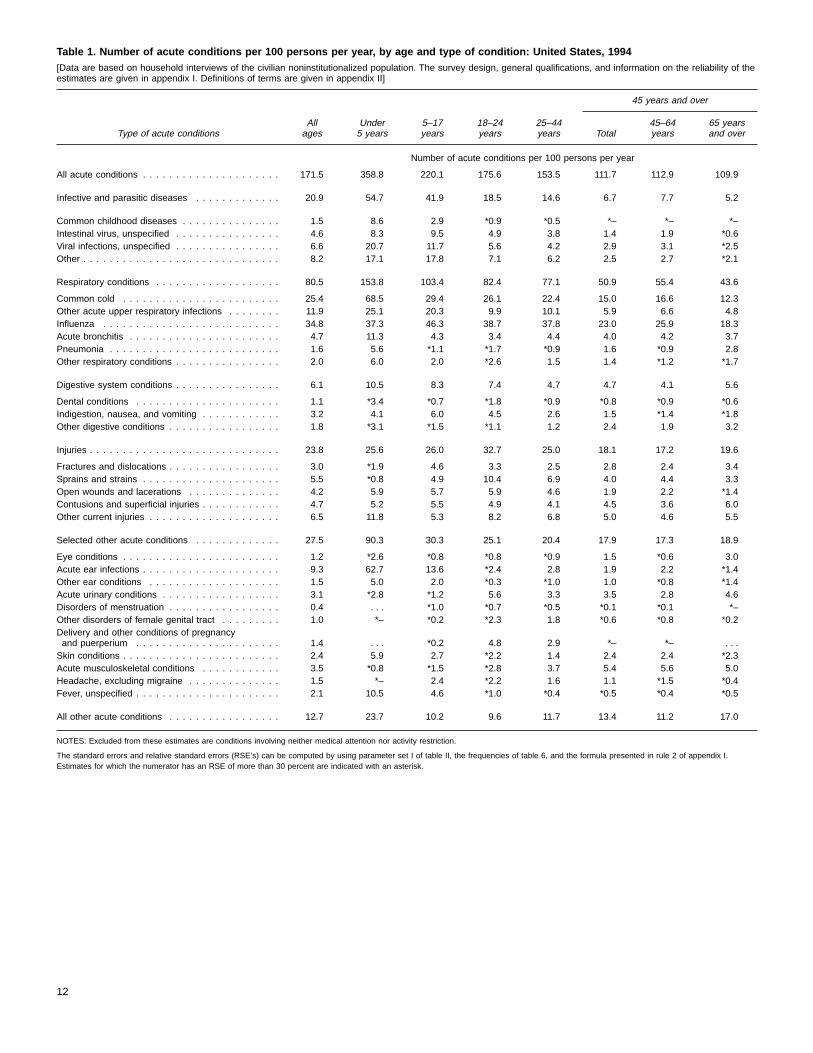
Table 1. Number of acute conditions per 100 persons per year, by age and type of condition: United States, 1994[Data are based on household interviews of the civilian noninstitutionalized population. The survey design, general qualifications, and information on the reliability of theestimates are given in appendix I. Definitions of terms are given in appendix II]
Type of acute conditionsAllages
Under5 years
5–17years
18–24years
25–44years
45 years and over
Total45–64years
65 yearsand over
Number of acute conditions per 100 persons per year
All acute conditions . . . . . . . . . . . . . . . . . . . . . 171.5 358.8 220.1 175.6 153.5 111.7 112.9 109.9
Infective and parasitic diseases . . . . . . . . . . . . . 20.9 54.7 41.9 18.5 14.6 6.7 7.7 5.2
Common childhood diseases . . . . . . . . . . . . . . . 1.5 8.6 2.9 *0.9 *0.5 *– *– *–Intestinal virus, unspecified . . . . . . . . . . . . . . . . 4.6 8.3 9.5 4.9 3.8 1.4 1.9 *0.6Viral infections, unspecified . . . . . . . . . . . . . . . . 6.6 20.7 11.7 5.6 4.2 2.9 3.1 *2.5Other . . . . . . . . . . . . . . . . . . . . . . . . . . . . . . 8.2 17.1 17.8 7.1 6.2 2.5 2.7 *2.1
Respiratory conditions . . . . . . . . . . . . . . . . . . . 80.5 153.8 103.4 82.4 77.1 50.9 55.4 43.6
Common cold . . . . . . . . . . . . . . . . . . . . . . . . 25.4 68.5 29.4 26.1 22.4 15.0 16.6 12.3Other acute upper respiratory infections . . . . . . . . 11.9 25.1 20.3 9.9 10.1 5.9 6.6 4.8Influenza . . . . . . . . . . . . . . . . . . . . . . . . . . . 34.8 37.3 46.3 38.7 37.8 23.0 25.9 18.3Acute bronchitis . . . . . . . . . . . . . . . . . . . . . . . 4.7 11.3 4.3 3.4 4.4 4.0 4.2 3.7Pneumonia . . . . . . . . . . . . . . . . . . . . . . . . . . 1.6 5.6 *1.1 *1.7 *0.9 1.6 *0.9 2.8Other respiratory conditions . . . . . . . . . . . . . . . . 2.0 6.0 2.0 *2.6 1.5 1.4 *1.2 *1.7
Digestive system conditions . . . . . . . . . . . . . . . . 6.1 10.5 8.3 7.4 4.7 4.7 4.1 5.6
Dental conditions . . . . . . . . . . . . . . . . . . . . . . 1.1 *3.4 *0.7 *1.8 *0.9 *0.8 *0.9 *0.6Indigestion, nausea, and vomiting . . . . . . . . . . . . 3.2 4.1 6.0 4.5 2.6 1.5 *1.4 *1.8Other digestive conditions . . . . . . . . . . . . . . . . . 1.8 *3.1 *1.5 *1.1 1.2 2.4 1.9 3.2
Injuries . . . . . . . . . . . . . . . . . . . . . . . . . . . . . 23.8 25.6 26.0 32.7 25.0 18.1 17.2 19.6
Fractures and dislocations . . . . . . . . . . . . . . . . . 3.0 *1.9 4.6 3.3 2.5 2.8 2.4 3.4Sprains and strains . . . . . . . . . . . . . . . . . . . . . 5.5 *0.8 4.9 10.4 6.9 4.0 4.4 3.3Open wounds and lacerations . . . . . . . . . . . . . . 4.2 5.9 5.7 5.9 4.6 1.9 2.2 *1.4Contusions and superficial injuries . . . . . . . . . . . . 4.7 5.2 5.5 4.9 4.1 4.5 3.6 6.0Other current injuries . . . . . . . . . . . . . . . . . . . . 6.5 11.8 5.3 8.2 6.8 5.0 4.6 5.5
Selected other acute conditions . . . . . . . . . . . . . 27.5 90.3 30.3 25.1 20.4 17.9 17.3 18.9
Eye conditions . . . . . . . . . . . . . . . . . . . . . . . . 1.2 *2.6 *0.8 *0.8 *0.9 1.5 *0.6 3.0Acute ear infections . . . . . . . . . . . . . . . . . . . . . 9.3 62.7 13.6 *2.4 2.8 1.9 2.2 *1.4Other ear conditions . . . . . . . . . . . . . . . . . . . . 1.5 5.0 2.0 *0.3 *1.0 1.0 *0.8 *1.4Acute urinary conditions . . . . . . . . . . . . . . . . . . 3.1 *2.8 *1.2 5.6 3.3 3.5 2.8 4.6Disorders of menstruation . . . . . . . . . . . . . . . . . 0.4 . . . *1.0 *0.7 *0.5 *0.1 *0.1 *–Other disorders of female genital tract . . . . . . . . . 1.0 *– *0.2 *2.3 1.8 *0.6 *0.8 *0.2Delivery and other conditions of pregnancyand puerperium . . . . . . . . . . . . . . . . . . . . . . 1.4 . . . *0.2 4.8 2.9 *– *– . . .Skin conditions . . . . . . . . . . . . . . . . . . . . . . . . 2.4 5.9 2.7 *2.2 1.4 2.4 2.4 *2.3Acute musculoskeletal conditions . . . . . . . . . . . . 3.5 *0.8 *1.5 *2.8 3.7 5.4 5.6 5.0Headache, excluding migraine . . . . . . . . . . . . . . 1.5 *– 2.4 *2.2 1.6 1.1 *1.5 *0.4Fever, unspecified . . . . . . . . . . . . . . . . . . . . . . 2.1 10.5 4.6 *1.0 *0.4 *0.5 *0.4 *0.5
All other acute conditions . . . . . . . . . . . . . . . . . 12.7 23.7 10.2 9.6 11.7 13.4 11.2 17.0
NOTES: Excluded from these estimates are conditions involving neither medical attention nor activity restriction.
The standard errors and relative standard errors (RSE’s) can be computed by using parameter set I of table II, the frequencies of table 6, and the formula presented in rule 2 of appendix I.Estimates for which the numerator has an RSE of more than 30 percent are indicated with an asterisk.
12

Table 2. Number of acute conditions per 100 persons per year, by sex, age, and type of condition: United States, 1994[Data are based on household interviews of the civilian noninstitutionalized population. The survey design, general qualifications, and information on the reliability of theestimates are given in appendix I. Definitions of terms are given in appendix II]
Type of acute condition
Male Female
Allages
Under5 years
5–17years
18–44years
45 yearsand over
Allages
Under5 years
5–17years
18–44years
45 yearsand over
Number of acute conditions per 100 persons per year
All acute conditions . . . . . . . . . . . . . . . . . . . . . 154.9 371.3 209.0 134.2 86.9 187.2 345.6 231.8 182.5 132.7
Infective and parasitic diseases . . . . . . . . . . . . . 18.8 55.0 40.2 11.6 4.5 22.8 54.5 43.7 19.3 8.6
Common childhood diseases . . . . . . . . . . . . . . . 1.6 8.3 3.7 *0.5 *– 1.3 8.9 *2.0 *0.6 *–Intestinal virus, unspecified . . . . . . . . . . . . . . . . 4.8 8.8 9.7 3.8 *1.6 4.4 *7.9 9.3 4.2 *1.2Viral infections, unspecified . . . . . . . . . . . . . . . . 5.8 20.0 10.4 3.5 *1.8 7.5 21.5 13.1 5.5 3.8Other . . . . . . . . . . . . . . . . . . . . . . . . . . . . . . 6.7 18.0 16.5 3.7 *1.1 9.6 16.2 19.3 9.0 3.6
Respiratory conditions . . . . . . . . . . . . . . . . . . . 75.3 160.6 99.7 69.7 42.6 85.4 146.7 107.2 86.7 57.9
Common cold . . . . . . . . . . . . . . . . . . . . . . . . 24.0 70.6 27.8 20.5 13.3 26.8 66.2 31.1 26.0 16.4Other acute upper respiratory infections . . . . . . . . 10.6 28.3 17.0 8.8 3.7 13.1 21.8 23.8 11.2 7.8Influenza . . . . . . . . . . . . . . . . . . . . . . . . . . . 34.1 40.5 46.2 36.4 20.8 35.5 34.0 46.3 39.6 24.9Acute bronchitis . . . . . . . . . . . . . . . . . . . . . . . 3.6 9.9 4.1 2.7 2.8 5.7 12.6 4.5 5.6 4.9Pneumonia . . . . . . . . . . . . . . . . . . . . . . . . . . 1.3 *3.9 *1.5 *0.5 *1.6 1.9 *7.4 *0.7 1.7 *1.7Other respiratory conditions . . . . . . . . . . . . . . . . 1.7 *7.4 *3.1 *0.9 *0.5 2.3 *4.7 *0.8 2.7 2.2
Digestive system conditions . . . . . . . . . . . . . . . . 5.5 12.6 7.2 4.3 4.0 6.7 8.4 9.4 6.4 5.3
Dental conditions . . . . . . . . . . . . . . . . . . . . . . 1.2 *5.1 *0.7 *1.1 *0.8 1.0 *1.6 *0.7 *1.2 *0.7Indigestion, nausea, and vomiting . . . . . . . . . . . . 2.8 *3.6 5.3 2.6 *1.1 3.6 *4.5 6.8 3.4 1.9Other digestive conditions . . . . . . . . . . . . . . . . . 1.4 *3.8 *1.1 *0.6 *2.1 2.1 *2.3 *2.0 1.8 2.6
Injuries . . . . . . . . . . . . . . . . . . . . . . . . . . . . . 25.8 31.1 27.9 31.1 15.3 22.0 19.8 24.1 22.6 20.5
Fractures and dislocations . . . . . . . . . . . . . . . . . 3.6 *1.5 5.1 4.0 2.4 2.5 *2.4 4.1 *1.5 3.1Sprains and strains . . . . . . . . . . . . . . . . . . . . . 5.7 *1.0 5.8 7.6 4.0 5.3 *0.7 3.8 7.9 3.9Open wounds and lacerations . . . . . . . . . . . . . . 5.7 8.8 7.4 7.0 *1.9 2.7 *2.8 4.1 2.8 1.9Contusions and superficial injuries . . . . . . . . . . . . 4.6 *4.3 5.4 5.6 2.6 4.8 *6.2 5.7 3.0 6.1Other current injuries . . . . . . . . . . . . . . . . . . . . 6.3 15.6 4.2 6.9 4.3 6.6 *7.9 6.4 7.4 5.5
Selected other acute conditions . . . . . . . . . . . . . 19.4 89.5 25.6 9.4 9.9 35.1 91.2 35.3 33.3 24.7
Eye conditions . . . . . . . . . . . . . . . . . . . . . . . . 0.8 *1.7 *0.8 *0.8 *0.6 1.6 *3.5 *0.9 *1.0 2.3Acute ear infections . . . . . . . . . . . . . . . . . . . . . 9.2 66.5 12.5 2.1 *0.9 9.4 58.7 14.8 3.3 2.8Other ear conditions . . . . . . . . . . . . . . . . . . . . 1.3 *6.4 *1.7 *0.4 *0.8 1.6 *3.6 *2.3 *1.3 *1.3Acute urinary conditions . . . . . . . . . . . . . . . . . . *0.6 *0.5 *0.2 *0.6 *1.0 5.5 *5.2 *2.2 6.9 5.6Disorders of menstruation . . . . . . . . . . . . . . . . . . . . . . . . . . . . . . . . 0.9 . . . *2.0 *1.1 *0.1Other disorders of female genital tract . . . . . . . . . . . . . . . . . . . . . . . . 2.0 *– *0.5 3.8 *1.1Delivery and other conditions of pregnancyand puerperium . . . . . . . . . . . . . . . . . . . . . . . . . . . . . . . . . . . . . 2.8 . . . *0.4 6.6 *–Skin conditions . . . . . . . . . . . . . . . . . . . . . . . . 2.0 *4.4 *2.3 *1.3 2.2 2.7 *7.5 *3.1 1.8 2.5Acute musculoskeletal conditions . . . . . . . . . . . . 2.5 *0.5 *1.1 2.6 3.8 4.5 *1.1 *2.0 4.4 6.7Headache, excluding migraine . . . . . . . . . . . . . . 1.1 *– *2.1 *1.2 *0.4 2.0 *– *2.8 2.3 *1.6Fever, unspecified . . . . . . . . . . . . . . . . . . . . . . 2.0 9.6 4.9 *0.3 *0.1 2.2 11.6 4.4 *0.7 *0.7
All other acute conditions . . . . . . . . . . . . . . . . . 10.1 22.5 8.4 8.1 10.6 15.2 25.0 12.0 14.2 15.8
NOTES: Excluded from these estimates are conditions involving neither medical attention nor activity restriction.
The standard errors and relative standard errors (RSE’s) can be computed by using parameter set I of table II, the frequencies of table 7, and the formula presented in rule 2 of appendix I.Estimates for which the numerator has an RSE of more than 30 percent are indicated with an asterisk.
13
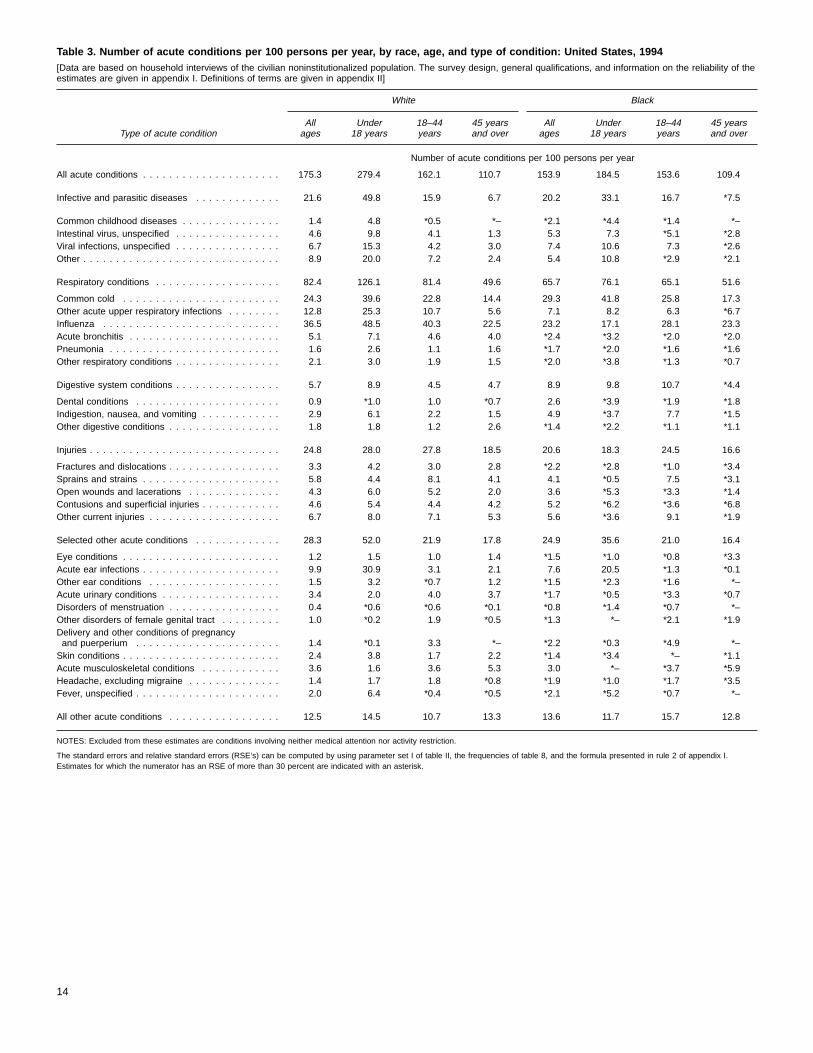
Table 3. Number of acute conditions per 100 persons per year, by race, age, and type of condition: United States, 1994[Data are based on household interviews of the civilian noninstitutionalized population. The survey design, general qualifications, and information on the reliability of theestimates are given in appendix I. Definitions of terms are given in appendix II]
Type of acute condition
White Black
Allages
Under18 years
18–44years
45 yearsand over
Allages
Under18 years
18–44years
45 yearsand over
Number of acute conditions per 100 persons per year
All acute conditions . . . . . . . . . . . . . . . . . . . . . 175.3 279.4 162.1 110.7 153.9 184.5 153.6 109.4
Infective and parasitic diseases . . . . . . . . . . . . . 21.6 49.8 15.9 6.7 20.2 33.1 16.7 *7.5
Common childhood diseases . . . . . . . . . . . . . . . 1.4 4.8 *0.5 *– *2.1 *4.4 *1.4 *–Intestinal virus, unspecified . . . . . . . . . . . . . . . . 4.6 9.8 4.1 1.3 5.3 7.3 *5.1 *2.8Viral infections, unspecified . . . . . . . . . . . . . . . . 6.7 15.3 4.2 3.0 7.4 10.6 7.3 *2.6Other . . . . . . . . . . . . . . . . . . . . . . . . . . . . . . 8.9 20.0 7.2 2.4 5.4 10.8 *2.9 *2.1
Respiratory conditions . . . . . . . . . . . . . . . . . . . 82.4 126.1 81.4 49.6 65.7 76.1 65.1 51.6
Common cold . . . . . . . . . . . . . . . . . . . . . . . . 24.3 39.6 22.8 14.4 29.3 41.8 25.8 17.3Other acute upper respiratory infections . . . . . . . . 12.8 25.3 10.7 5.6 7.1 8.2 6.3 *6.7Influenza . . . . . . . . . . . . . . . . . . . . . . . . . . . 36.5 48.5 40.3 22.5 23.2 17.1 28.1 23.3Acute bronchitis . . . . . . . . . . . . . . . . . . . . . . . 5.1 7.1 4.6 4.0 *2.4 *3.2 *2.0 *2.0Pneumonia . . . . . . . . . . . . . . . . . . . . . . . . . . 1.6 2.6 1.1 1.6 *1.7 *2.0 *1.6 *1.6Other respiratory conditions . . . . . . . . . . . . . . . . 2.1 3.0 1.9 1.5 *2.0 *3.8 *1.3 *0.7
Digestive system conditions . . . . . . . . . . . . . . . . 5.7 8.9 4.5 4.7 8.9 9.8 10.7 *4.4
Dental conditions . . . . . . . . . . . . . . . . . . . . . . 0.9 *1.0 1.0 *0.7 2.6 *3.9 *1.9 *1.8Indigestion, nausea, and vomiting . . . . . . . . . . . . 2.9 6.1 2.2 1.5 4.9 *3.7 7.7 *1.5Other digestive conditions . . . . . . . . . . . . . . . . . 1.8 1.8 1.2 2.6 *1.4 *2.2 *1.1 *1.1
Injuries . . . . . . . . . . . . . . . . . . . . . . . . . . . . . 24.8 28.0 27.8 18.5 20.6 18.3 24.5 16.6
Fractures and dislocations . . . . . . . . . . . . . . . . . 3.3 4.2 3.0 2.8 *2.2 *2.8 *1.0 *3.4Sprains and strains . . . . . . . . . . . . . . . . . . . . . 5.8 4.4 8.1 4.1 4.1 *0.5 7.5 *3.1Open wounds and lacerations . . . . . . . . . . . . . . 4.3 6.0 5.2 2.0 3.6 *5.3 *3.3 *1.4Contusions and superficial injuries . . . . . . . . . . . . 4.6 5.4 4.4 4.2 5.2 *6.2 *3.6 *6.8Other current injuries . . . . . . . . . . . . . . . . . . . . 6.7 8.0 7.1 5.3 5.6 *3.6 9.1 *1.9
Selected other acute conditions . . . . . . . . . . . . . 28.3 52.0 21.9 17.8 24.9 35.6 21.0 16.4
Eye conditions . . . . . . . . . . . . . . . . . . . . . . . . 1.2 1.5 1.0 1.4 *1.5 *1.0 *0.8 *3.3Acute ear infections . . . . . . . . . . . . . . . . . . . . . 9.9 30.9 3.1 2.1 7.6 20.5 *1.3 *0.1Other ear conditions . . . . . . . . . . . . . . . . . . . . 1.5 3.2 *0.7 1.2 *1.5 *2.3 *1.6 *–Acute urinary conditions . . . . . . . . . . . . . . . . . . 3.4 2.0 4.0 3.7 *1.7 *0.5 *3.3 *0.7Disorders of menstruation . . . . . . . . . . . . . . . . . 0.4 *0.6 *0.6 *0.1 *0.8 *1.4 *0.7 *–Other disorders of female genital tract . . . . . . . . . 1.0 *0.2 1.9 *0.5 *1.3 *– *2.1 *1.9Delivery and other conditions of pregnancyand puerperium . . . . . . . . . . . . . . . . . . . . . . 1.4 *0.1 3.3 *– *2.2 *0.3 *4.9 *–Skin conditions . . . . . . . . . . . . . . . . . . . . . . . . 2.4 3.8 1.7 2.2 *1.4 *3.4 *– *1.1Acute musculoskeletal conditions . . . . . . . . . . . . 3.6 1.6 3.6 5.3 3.0 *– *3.7 *5.9Headache, excluding migraine . . . . . . . . . . . . . . 1.4 1.7 1.8 *0.8 *1.9 *1.0 *1.7 *3.5Fever, unspecified . . . . . . . . . . . . . . . . . . . . . . 2.0 6.4 *0.4 *0.5 *2.1 *5.2 *0.7 *–
All other acute conditions . . . . . . . . . . . . . . . . . 12.5 14.5 10.7 13.3 13.6 11.7 15.7 12.8
NOTES: Excluded from these estimates are conditions involving neither medical attention nor activity restriction.
The standard errors and relative standard errors (RSE’s) can be computed by using parameter set I of table II, the frequencies of table 8, and the formula presented in rule 2 of appendix I.Estimates for which the numerator has an RSE of more than 30 percent are indicated with an asterisk.
14
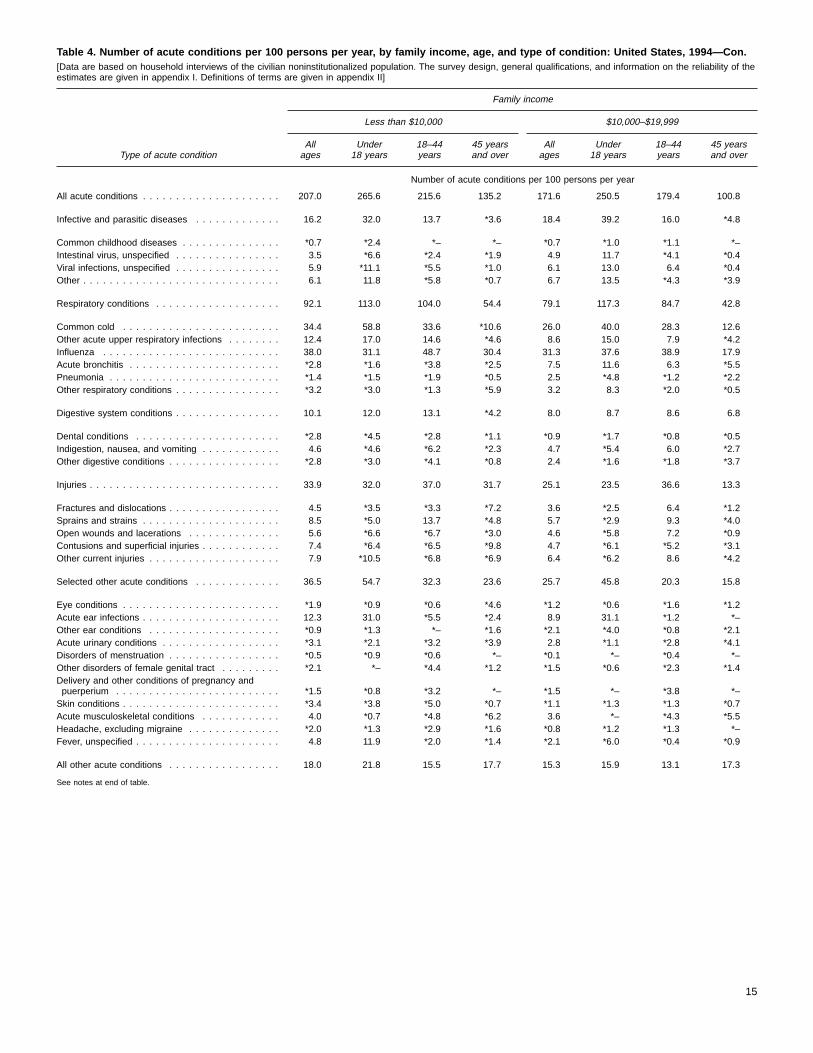
Table 4. Number of acute conditions per 100 persons per year, by family income, age, and type of condition: United States, 1994—Con.[Data are based on household interviews of the civilian noninstitutionalized population. The survey design, general qualifications, and information on the reliability of theestimates are given in appendix I. Definitions of terms are given in appendix II]
Type of acute condition
Family income
Less than $10,000 $10,000–$19,999
Allages
Under18 years
18–44years
45 yearsand over
Allages
Under18 years
18–44years
45 yearsand over
Number of acute conditions per 100 persons per year
All acute conditions . . . . . . . . . . . . . . . . . . . . . 207.0 265.6 215.6 135.2 171.6 250.5 179.4 100.8
Infective and parasitic diseases . . . . . . . . . . . . . 16.2 32.0 13.7 *3.6 18.4 39.2 16.0 *4.8
Common childhood diseases . . . . . . . . . . . . . . . *0.7 *2.4 *– *– *0.7 *1.0 *1.1 *–Intestinal virus, unspecified . . . . . . . . . . . . . . . . 3.5 *6.6 *2.4 *1.9 4.9 11.7 *4.1 *0.4Viral infections, unspecified . . . . . . . . . . . . . . . . 5.9 *11.1 *5.5 *1.0 6.1 13.0 6.4 *0.4Other . . . . . . . . . . . . . . . . . . . . . . . . . . . . . . 6.1 11.8 *5.8 *0.7 6.7 13.5 *4.3 *3.9
Respiratory conditions . . . . . . . . . . . . . . . . . . . 92.1 113.0 104.0 54.4 79.1 117.3 84.7 42.8
Common cold . . . . . . . . . . . . . . . . . . . . . . . . 34.4 58.8 33.6 *10.6 26.0 40.0 28.3 12.6Other acute upper respiratory infections . . . . . . . . 12.4 17.0 14.6 *4.6 8.6 15.0 7.9 *4.2Influenza . . . . . . . . . . . . . . . . . . . . . . . . . . . 38.0 31.1 48.7 30.4 31.3 37.6 38.9 17.9Acute bronchitis . . . . . . . . . . . . . . . . . . . . . . . *2.8 *1.6 *3.8 *2.5 7.5 11.6 6.3 *5.5Pneumonia . . . . . . . . . . . . . . . . . . . . . . . . . . *1.4 *1.5 *1.9 *0.5 2.5 *4.8 *1.2 *2.2Other respiratory conditions . . . . . . . . . . . . . . . . *3.2 *3.0 *1.3 *5.9 3.2 8.3 *2.0 *0.5
Digestive system conditions . . . . . . . . . . . . . . . . 10.1 12.0 13.1 *4.2 8.0 8.7 8.6 6.8
Dental conditions . . . . . . . . . . . . . . . . . . . . . . *2.8 *4.5 *2.8 *1.1 *0.9 *1.7 *0.8 *0.5Indigestion, nausea, and vomiting . . . . . . . . . . . . 4.6 *4.6 *6.2 *2.3 4.7 *5.4 6.0 *2.7Other digestive conditions . . . . . . . . . . . . . . . . . *2.8 *3.0 *4.1 *0.8 2.4 *1.6 *1.8 *3.7
Injuries . . . . . . . . . . . . . . . . . . . . . . . . . . . . . 33.9 32.0 37.0 31.7 25.1 23.5 36.6 13.3
Fractures and dislocations . . . . . . . . . . . . . . . . . 4.5 *3.5 *3.3 *7.2 3.6 *2.5 6.4 *1.2Sprains and strains . . . . . . . . . . . . . . . . . . . . . 8.5 *5.0 13.7 *4.8 5.7 *2.9 9.3 *4.0Open wounds and lacerations . . . . . . . . . . . . . . 5.6 *6.6 *6.7 *3.0 4.6 *5.8 7.2 *0.9Contusions and superficial injuries . . . . . . . . . . . . 7.4 *6.4 *6.5 *9.8 4.7 *6.1 *5.2 *3.1Other current injuries . . . . . . . . . . . . . . . . . . . . 7.9 *10.5 *6.8 *6.9 6.4 *6.2 8.6 *4.2
Selected other acute conditions . . . . . . . . . . . . . 36.5 54.7 32.3 23.6 25.7 45.8 20.3 15.8
Eye conditions . . . . . . . . . . . . . . . . . . . . . . . . *1.9 *0.9 *0.6 *4.6 *1.2 *0.6 *1.6 *1.2Acute ear infections . . . . . . . . . . . . . . . . . . . . . 12.3 31.0 *5.5 *2.4 8.9 31.1 *1.2 *–Other ear conditions . . . . . . . . . . . . . . . . . . . . *0.9 *1.3 *– *1.6 *2.1 *4.0 *0.8 *2.1Acute urinary conditions . . . . . . . . . . . . . . . . . . *3.1 *2.1 *3.2 *3.9 2.8 *1.1 *2.8 *4.1Disorders of menstruation . . . . . . . . . . . . . . . . . *0.5 *0.9 *0.6 *– *0.1 *– *0.4 *–Other disorders of female genital tract . . . . . . . . . *2.1 *– *4.4 *1.2 *1.5 *0.6 *2.3 *1.4Delivery and other conditions of pregnancy andpuerperium . . . . . . . . . . . . . . . . . . . . . . . . . *1.5 *0.8 *3.2 *– *1.5 *– *3.8 *–Skin conditions . . . . . . . . . . . . . . . . . . . . . . . . *3.4 *3.8 *5.0 *0.7 *1.1 *1.3 *1.3 *0.7Acute musculoskeletal conditions . . . . . . . . . . . . 4.0 *0.7 *4.8 *6.2 3.6 *– *4.3 *5.5Headache, excluding migraine . . . . . . . . . . . . . . *2.0 *1.3 *2.9 *1.6 *0.8 *1.2 *1.3 *–Fever, unspecified . . . . . . . . . . . . . . . . . . . . . . 4.8 11.9 *2.0 *1.4 *2.1 *6.0 *0.4 *0.9
All other acute conditions . . . . . . . . . . . . . . . . . 18.0 21.8 15.5 17.7 15.3 15.9 13.1 17.3
See notes at end of table.
15
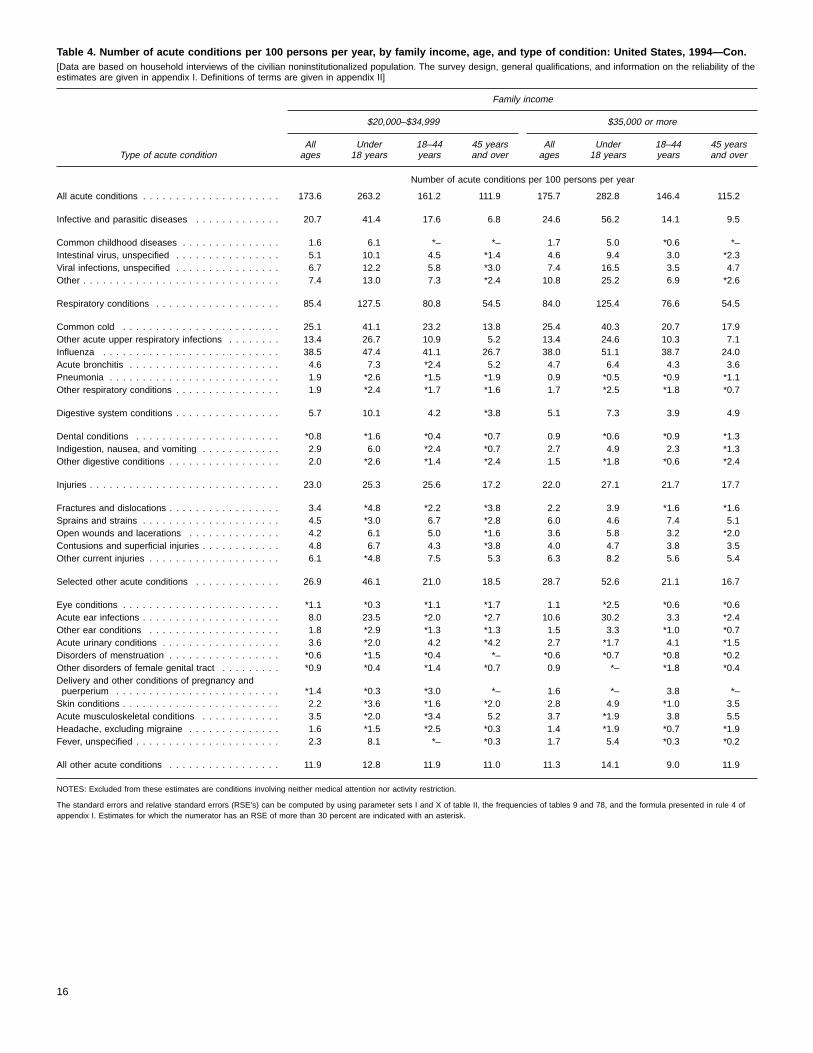
Table 4. Number of acute conditions per 100 persons per year, by family income, age, and type of condition: United States, 1994—Con.[Data are based on household interviews of the civilian noninstitutionalized population. The survey design, general qualifications, and information on the reliability of theestimates are given in appendix I. Definitions of terms are given in appendix II]
Type of acute condition
Family income
$20,000–$34,999 $35,000 or more
Allages
Under18 years
18–44years
45 yearsand over
Allages
Under18 years
18–44years
45 yearsand over
Number of acute conditions per 100 persons per year
All acute conditions . . . . . . . . . . . . . . . . . . . . . 173.6 263.2 161.2 111.9 175.7 282.8 146.4 115.2
Infective and parasitic diseases . . . . . . . . . . . . . 20.7 41.4 17.6 6.8 24.6 56.2 14.1 9.5
Common childhood diseases . . . . . . . . . . . . . . . 1.6 6.1 *– *– 1.7 5.0 *0.6 *–Intestinal virus, unspecified . . . . . . . . . . . . . . . . 5.1 10.1 4.5 *1.4 4.6 9.4 3.0 *2.3Viral infections, unspecified . . . . . . . . . . . . . . . . 6.7 12.2 5.8 *3.0 7.4 16.5 3.5 4.7Other . . . . . . . . . . . . . . . . . . . . . . . . . . . . . . 7.4 13.0 7.3 *2.4 10.8 25.2 6.9 *2.6
Respiratory conditions . . . . . . . . . . . . . . . . . . . 85.4 127.5 80.8 54.5 84.0 125.4 76.6 54.5
Common cold . . . . . . . . . . . . . . . . . . . . . . . . 25.1 41.1 23.2 13.8 25.4 40.3 20.7 17.9Other acute upper respiratory infections . . . . . . . . 13.4 26.7 10.9 5.2 13.4 24.6 10.3 7.1Influenza . . . . . . . . . . . . . . . . . . . . . . . . . . . 38.5 47.4 41.1 26.7 38.0 51.1 38.7 24.0Acute bronchitis . . . . . . . . . . . . . . . . . . . . . . . 4.6 7.3 *2.4 5.2 4.7 6.4 4.3 3.6Pneumonia . . . . . . . . . . . . . . . . . . . . . . . . . . 1.9 *2.6 *1.5 *1.9 0.9 *0.5 *0.9 *1.1Other respiratory conditions . . . . . . . . . . . . . . . . 1.9 *2.4 *1.7 *1.6 1.7 *2.5 *1.8 *0.7
Digestive system conditions . . . . . . . . . . . . . . . . 5.7 10.1 4.2 *3.8 5.1 7.3 3.9 4.9
Dental conditions . . . . . . . . . . . . . . . . . . . . . . *0.8 *1.6 *0.4 *0.7 0.9 *0.6 *0.9 *1.3Indigestion, nausea, and vomiting . . . . . . . . . . . . 2.9 6.0 *2.4 *0.7 2.7 4.9 2.3 *1.3Other digestive conditions . . . . . . . . . . . . . . . . . 2.0 *2.6 *1.4 *2.4 1.5 *1.8 *0.6 *2.4
Injuries . . . . . . . . . . . . . . . . . . . . . . . . . . . . . 23.0 25.3 25.6 17.2 22.0 27.1 21.7 17.7
Fractures and dislocations . . . . . . . . . . . . . . . . . 3.4 *4.8 *2.2 *3.8 2.2 3.9 *1.6 *1.6Sprains and strains . . . . . . . . . . . . . . . . . . . . . 4.5 *3.0 6.7 *2.8 6.0 4.6 7.4 5.1Open wounds and lacerations . . . . . . . . . . . . . . 4.2 6.1 5.0 *1.6 3.6 5.8 3.2 *2.0Contusions and superficial injuries . . . . . . . . . . . . 4.8 6.7 4.3 *3.8 4.0 4.7 3.8 3.5Other current injuries . . . . . . . . . . . . . . . . . . . . 6.1 *4.8 7.5 5.3 6.3 8.2 5.6 5.4
Selected other acute conditions . . . . . . . . . . . . . 26.9 46.1 21.0 18.5 28.7 52.6 21.1 16.7
Eye conditions . . . . . . . . . . . . . . . . . . . . . . . . *1.1 *0.3 *1.1 *1.7 1.1 *2.5 *0.6 *0.6Acute ear infections . . . . . . . . . . . . . . . . . . . . . 8.0 23.5 *2.0 *2.7 10.6 30.2 3.3 *2.4Other ear conditions . . . . . . . . . . . . . . . . . . . . 1.8 *2.9 *1.3 *1.3 1.5 3.3 *1.0 *0.7Acute urinary conditions . . . . . . . . . . . . . . . . . . 3.6 *2.0 4.2 *4.2 2.7 *1.7 4.1 *1.5Disorders of menstruation . . . . . . . . . . . . . . . . . *0.6 *1.5 *0.4 *– *0.6 *0.7 *0.8 *0.2Other disorders of female genital tract . . . . . . . . . *0.9 *0.4 *1.4 *0.7 0.9 *– *1.8 *0.4Delivery and other conditions of pregnancy andpuerperium . . . . . . . . . . . . . . . . . . . . . . . . . *1.4 *0.3 *3.0 *– 1.6 *– 3.8 *–Skin conditions . . . . . . . . . . . . . . . . . . . . . . . . 2.2 *3.6 *1.6 *2.0 2.8 4.9 *1.0 3.5Acute musculoskeletal conditions . . . . . . . . . . . . 3.5 *2.0 *3.4 5.2 3.7 *1.9 3.8 5.5Headache, excluding migraine . . . . . . . . . . . . . . 1.6 *1.5 *2.5 *0.3 1.4 *1.9 *0.7 *1.9Fever, unspecified . . . . . . . . . . . . . . . . . . . . . . 2.3 8.1 *– *0.3 1.7 5.4 *0.3 *0.2
All other acute conditions . . . . . . . . . . . . . . . . . 11.9 12.8 11.9 11.0 11.3 14.1 9.0 11.9
NOTES: Excluded from these estimates are conditions involving neither medical attention nor activity restriction.
The standard errors and relative standard errors (RSE’s) can be computed by using parameter sets I and X of table II, the frequencies of tables 9 and 78, and the formula presented in rule 4 ofappendix I. Estimates for which the numerator has an RSE of more than 30 percent are indicated with an asterisk.
16
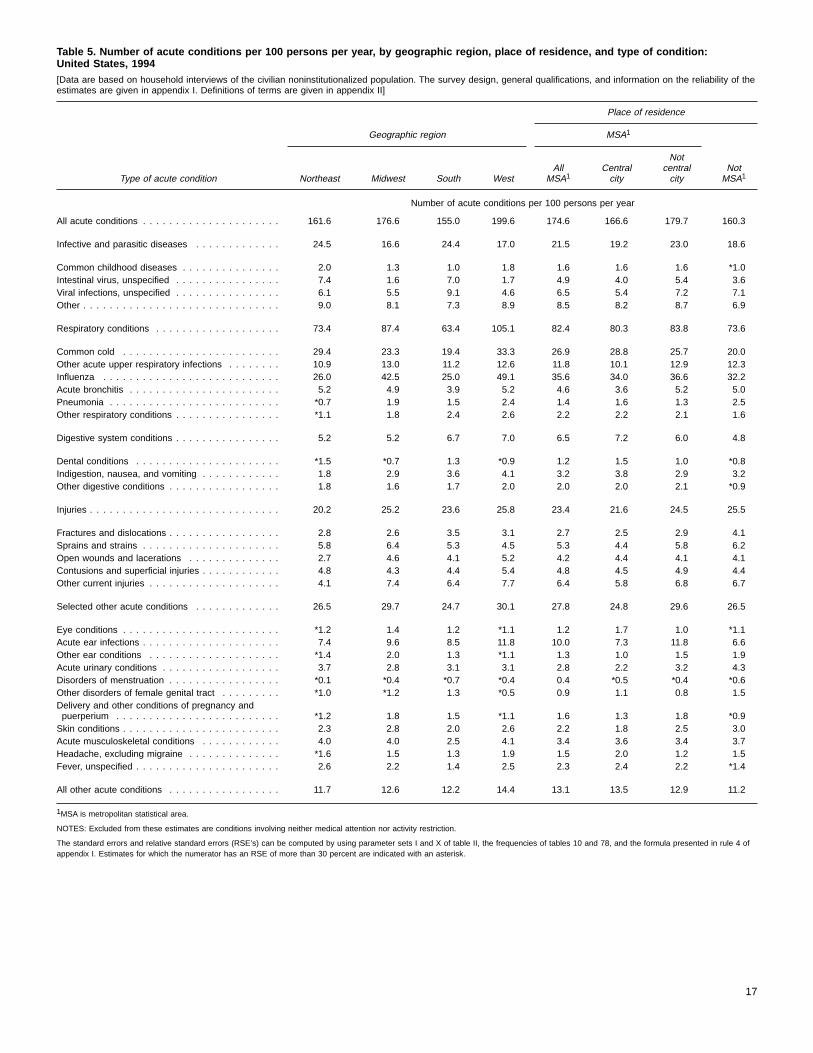
Table 5. Number of acute conditions per 100 persons per year, by geographic region, place of residence, and type of condition:United States, 1994[Data are based on household interviews of the civilian noninstitutionalized population. The survey design, general qualifications, and information on the reliability of theestimates are given in appendix I. Definitions of terms are given in appendix II]
Type of acute condition
Place of residence
Geographic region MSA1
Northeast Midwest South WestAll
MSA1Centralcity
Notcentralcity
NotMSA1
Number of acute conditions per 100 persons per year
All acute conditions . . . . . . . . . . . . . . . . . . . . . 161.6 176.6 155.0 199.6 174.6 166.6 179.7 160.3
Infective and parasitic diseases . . . . . . . . . . . . . 24.5 16.6 24.4 17.0 21.5 19.2 23.0 18.6
Common childhood diseases . . . . . . . . . . . . . . . 2.0 1.3 1.0 1.8 1.6 1.6 1.6 *1.0Intestinal virus, unspecified . . . . . . . . . . . . . . . . 7.4 1.6 7.0 1.7 4.9 4.0 5.4 3.6Viral infections, unspecified . . . . . . . . . . . . . . . . 6.1 5.5 9.1 4.6 6.5 5.4 7.2 7.1Other . . . . . . . . . . . . . . . . . . . . . . . . . . . . . . 9.0 8.1 7.3 8.9 8.5 8.2 8.7 6.9
Respiratory conditions . . . . . . . . . . . . . . . . . . . 73.4 87.4 63.4 105.1 82.4 80.3 83.8 73.6
Common cold . . . . . . . . . . . . . . . . . . . . . . . . 29.4 23.3 19.4 33.3 26.9 28.8 25.7 20.0Other acute upper respiratory infections . . . . . . . . 10.9 13.0 11.2 12.6 11.8 10.1 12.9 12.3Influenza . . . . . . . . . . . . . . . . . . . . . . . . . . . 26.0 42.5 25.0 49.1 35.6 34.0 36.6 32.2Acute bronchitis . . . . . . . . . . . . . . . . . . . . . . . 5.2 4.9 3.9 5.2 4.6 3.6 5.2 5.0Pneumonia . . . . . . . . . . . . . . . . . . . . . . . . . . *0.7 1.9 1.5 2.4 1.4 1.6 1.3 2.5Other respiratory conditions . . . . . . . . . . . . . . . . *1.1 1.8 2.4 2.6 2.2 2.2 2.1 1.6
Digestive system conditions . . . . . . . . . . . . . . . . 5.2 5.2 6.7 7.0 6.5 7.2 6.0 4.8
Dental conditions . . . . . . . . . . . . . . . . . . . . . . *1.5 *0.7 1.3 *0.9 1.2 1.5 1.0 *0.8Indigestion, nausea, and vomiting . . . . . . . . . . . . 1.8 2.9 3.6 4.1 3.2 3.8 2.9 3.2Other digestive conditions . . . . . . . . . . . . . . . . . 1.8 1.6 1.7 2.0 2.0 2.0 2.1 *0.9
Injuries . . . . . . . . . . . . . . . . . . . . . . . . . . . . . 20.2 25.2 23.6 25.8 23.4 21.6 24.5 25.5
Fractures and dislocations . . . . . . . . . . . . . . . . . 2.8 2.6 3.5 3.1 2.7 2.5 2.9 4.1Sprains and strains . . . . . . . . . . . . . . . . . . . . . 5.8 6.4 5.3 4.5 5.3 4.4 5.8 6.2Open wounds and lacerations . . . . . . . . . . . . . . 2.7 4.6 4.1 5.2 4.2 4.4 4.1 4.1Contusions and superficial injuries . . . . . . . . . . . . 4.8 4.3 4.4 5.4 4.8 4.5 4.9 4.4Other current injuries . . . . . . . . . . . . . . . . . . . . 4.1 7.4 6.4 7.7 6.4 5.8 6.8 6.7
Selected other acute conditions . . . . . . . . . . . . . 26.5 29.7 24.7 30.1 27.8 24.8 29.6 26.5
Eye conditions . . . . . . . . . . . . . . . . . . . . . . . . *1.2 1.4 1.2 *1.1 1.2 1.7 1.0 *1.1Acute ear infections . . . . . . . . . . . . . . . . . . . . . 7.4 9.6 8.5 11.8 10.0 7.3 11.8 6.6Other ear conditions . . . . . . . . . . . . . . . . . . . . *1.4 2.0 1.3 *1.1 1.3 1.0 1.5 1.9Acute urinary conditions . . . . . . . . . . . . . . . . . . 3.7 2.8 3.1 3.1 2.8 2.2 3.2 4.3Disorders of menstruation . . . . . . . . . . . . . . . . . *0.1 *0.4 *0.7 *0.4 0.4 *0.5 *0.4 *0.6Other disorders of female genital tract . . . . . . . . . *1.0 *1.2 1.3 *0.5 0.9 1.1 0.8 1.5Delivery and other conditions of pregnancy andpuerperium . . . . . . . . . . . . . . . . . . . . . . . . . *1.2 1.8 1.5 *1.1 1.6 1.3 1.8 *0.9Skin conditions . . . . . . . . . . . . . . . . . . . . . . . . 2.3 2.8 2.0 2.6 2.2 1.8 2.5 3.0Acute musculoskeletal conditions . . . . . . . . . . . . 4.0 4.0 2.5 4.1 3.4 3.6 3.4 3.7Headache, excluding migraine . . . . . . . . . . . . . . *1.6 1.5 1.3 1.9 1.5 2.0 1.2 1.5Fever, unspecified . . . . . . . . . . . . . . . . . . . . . . 2.6 2.2 1.4 2.5 2.3 2.4 2.2 *1.4
All other acute conditions . . . . . . . . . . . . . . . . . 11.7 12.6 12.2 14.4 13.1 13.5 12.9 11.2
1MSA is metropolitan statistical area.
NOTES: Excluded from these estimates are conditions involving neither medical attention nor activity restriction.
The standard errors and relative standard errors (RSE’s) can be computed by using parameter sets I and X of table II, the frequencies of tables 10 and 78, and the formula presented in rule 4 ofappendix I. Estimates for which the numerator has an RSE of more than 30 percent are indicated with an asterisk.
17
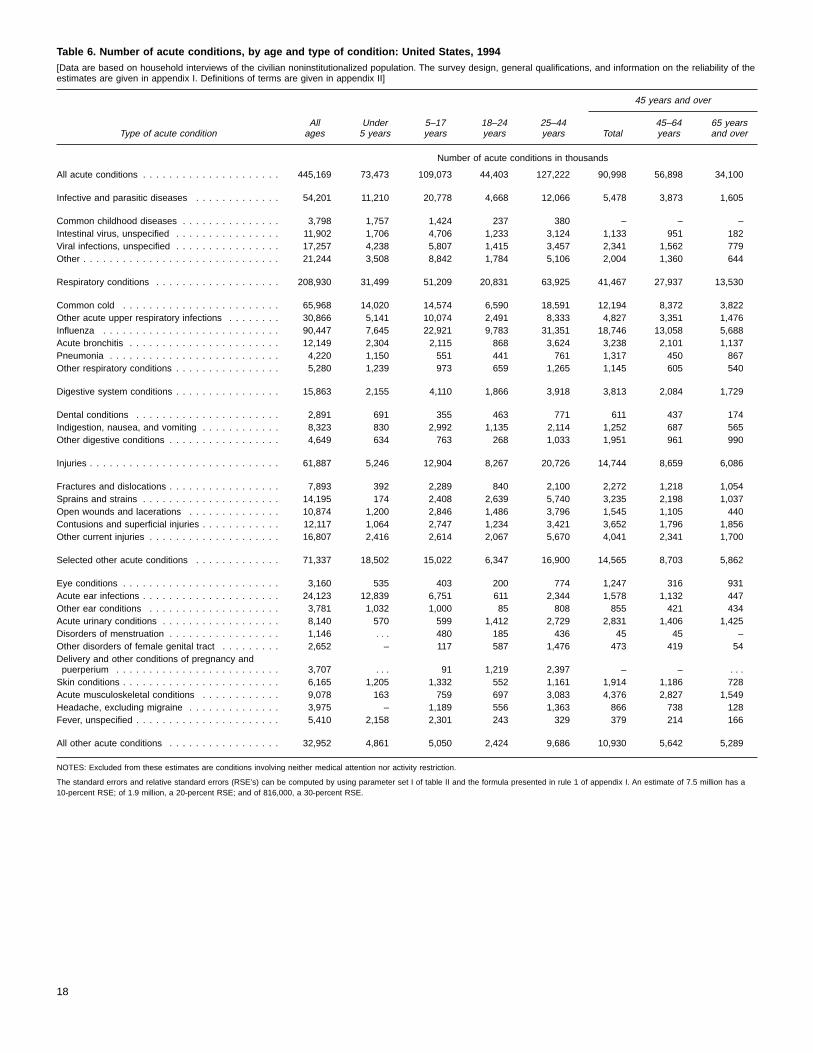
Table 6. Number of acute conditions, by age and type of condition: United States, 1994[Data are based on household interviews of the civilian noninstitutionalized population. The survey design, general qualifications, and information on the reliability of theestimates are given in appendix I. Definitions of terms are given in appendix II]
Type of acute condition
45 years and over
Allages
Under5 years
5–17years
18–24years
25–44years Total
45–64years
65 yearsand over
Number of acute conditions in thousands
All acute conditions . . . . . . . . . . . . . . . . . . . . . 445,169 73,473 109,073 44,403 127,222 90,998 56,898 34,100
Infective and parasitic diseases . . . . . . . . . . . . . 54,201 11,210 20,778 4,668 12,066 5,478 3,873 1,605
Common childhood diseases . . . . . . . . . . . . . . . 3,798 1,757 1,424 237 380 – – –Intestinal virus, unspecified . . . . . . . . . . . . . . . . 11,902 1,706 4,706 1,233 3,124 1,133 951 182Viral infections, unspecified . . . . . . . . . . . . . . . . 17,257 4,238 5,807 1,415 3,457 2,341 1,562 779Other . . . . . . . . . . . . . . . . . . . . . . . . . . . . . . 21,244 3,508 8,842 1,784 5,106 2,004 1,360 644
Respiratory conditions . . . . . . . . . . . . . . . . . . . 208,930 31,499 51,209 20,831 63,925 41,467 27,937 13,530
Common cold . . . . . . . . . . . . . . . . . . . . . . . . 65,968 14,020 14,574 6,590 18,591 12,194 8,372 3,822Other acute upper respiratory infections . . . . . . . . 30,866 5,141 10,074 2,491 8,333 4,827 3,351 1,476Influenza . . . . . . . . . . . . . . . . . . . . . . . . . . . 90,447 7,645 22,921 9,783 31,351 18,746 13,058 5,688Acute bronchitis . . . . . . . . . . . . . . . . . . . . . . . 12,149 2,304 2,115 868 3,624 3,238 2,101 1,137Pneumonia . . . . . . . . . . . . . . . . . . . . . . . . . . 4,220 1,150 551 441 761 1,317 450 867Other respiratory conditions . . . . . . . . . . . . . . . . 5,280 1,239 973 659 1,265 1,145 605 540
Digestive system conditions . . . . . . . . . . . . . . . . 15,863 2,155 4,110 1,866 3,918 3,813 2,084 1,729
Dental conditions . . . . . . . . . . . . . . . . . . . . . . 2,891 691 355 463 771 611 437 174Indigestion, nausea, and vomiting . . . . . . . . . . . . 8,323 830 2,992 1,135 2,114 1,252 687 565Other digestive conditions . . . . . . . . . . . . . . . . . 4,649 634 763 268 1,033 1,951 961 990
Injuries . . . . . . . . . . . . . . . . . . . . . . . . . . . . . 61,887 5,246 12,904 8,267 20,726 14,744 8,659 6,086
Fractures and dislocations . . . . . . . . . . . . . . . . . 7,893 392 2,289 840 2,100 2,272 1,218 1,054Sprains and strains . . . . . . . . . . . . . . . . . . . . . 14,195 174 2,408 2,639 5,740 3,235 2,198 1,037Open wounds and lacerations . . . . . . . . . . . . . . 10,874 1,200 2,846 1,486 3,796 1,545 1,105 440Contusions and superficial injuries . . . . . . . . . . . . 12,117 1,064 2,747 1,234 3,421 3,652 1,796 1,856Other current injuries . . . . . . . . . . . . . . . . . . . . 16,807 2,416 2,614 2,067 5,670 4,041 2,341 1,700
Selected other acute conditions . . . . . . . . . . . . . 71,337 18,502 15,022 6,347 16,900 14,565 8,703 5,862
Eye conditions . . . . . . . . . . . . . . . . . . . . . . . . 3,160 535 403 200 774 1,247 316 931Acute ear infections . . . . . . . . . . . . . . . . . . . . . 24,123 12,839 6,751 611 2,344 1,578 1,132 447Other ear conditions . . . . . . . . . . . . . . . . . . . . 3,781 1,032 1,000 85 808 855 421 434Acute urinary conditions . . . . . . . . . . . . . . . . . . 8,140 570 599 1,412 2,729 2,831 1,406 1,425Disorders of menstruation . . . . . . . . . . . . . . . . . 1,146 . . . 480 185 436 45 45 –Other disorders of female genital tract . . . . . . . . . 2,652 – 117 587 1,476 473 419 54Delivery and other conditions of pregnancy andpuerperium . . . . . . . . . . . . . . . . . . . . . . . . . 3,707 . . . 91 1,219 2,397 – – . . .Skin conditions . . . . . . . . . . . . . . . . . . . . . . . . 6,165 1,205 1,332 552 1,161 1,914 1,186 728Acute musculoskeletal conditions . . . . . . . . . . . . 9,078 163 759 697 3,083 4,376 2,827 1,549Headache, excluding migraine . . . . . . . . . . . . . . 3,975 – 1,189 556 1,363 866 738 128Fever, unspecified . . . . . . . . . . . . . . . . . . . . . . 5,410 2,158 2,301 243 329 379 214 166
All other acute conditions . . . . . . . . . . . . . . . . . 32,952 4,861 5,050 2,424 9,686 10,930 5,642 5,289
NOTES: Excluded from these estimates are conditions involving neither medical attention nor activity restriction.
The standard errors and relative standard errors (RSE’s) can be computed by using parameter set I of table II and the formula presented in rule 1 of appendix I. An estimate of 7.5 million has a10-percent RSE; of 1.9 million, a 20-percent RSE; and of 816,000, a 30-percent RSE.
18

Table 7. Number of acute conditions, by sex, age, and type of condition: United States, 1994[Data are based on household interviews of the civilian noninstitutionalized population. The survey design, general qualifications, and information on the reliability of theestimates are given in appendix I. Definitions of terms are given in appendix II]
Type of acute condition
Male Female
Allages
Under5 years
5–17years
18–44years
45 yearsand over
Allages
Under5 years
5–17years
18–44years
45 yearsand over
Number of acute conditions in thousands
All acute conditions . . . . . . . . . . . . . . . . . . . . . 195,919 38,882 53,011 71,633 32,392 249,251 34,591 56,062 99,991 58,606
Infective and parasitic diseases . . . . . . . . . . . . . 23,831 5,759 10,202 6,181 1,689 30,370 5,451 10,576 10,554 3,789
Common childhood diseases . . . . . . . . . . . . . . . 2,067 866 931 270 – 1,731 892 493 346 –Intestinal virus, unspecified . . . . . . . . . . . . . . . . 6,040 918 2,463 2,049 611 5,861 788 2,243 2,308 522Viral infections, unspecified . . . . . . . . . . . . . . . . 7,281 2,091 2,632 1,878 680 9,976 2,148 3,175 2,993 1,660Other . . . . . . . . . . . . . . . . . . . . . . . . . . . . . . 8,442 1,884 4,177 1,984 398 12,802 1,624 4,665 4,907 1,607
Respiratory conditions . . . . . . . . . . . . . . . . . . . 95,218 16,814 25,279 37,233 15,892 113,712 14,685 25,930 47,522 25,575
Common cold . . . . . . . . . . . . . . . . . . . . . . . . 30,299 7,393 7,041 10,926 4,939 35,669 6,627 7,533 14,254 7,255Other acute upper respiratory infections . . . . . . . . 13,369 2,961 4,307 4,712 1,389 17,497 2,181 5,767 6,111 3,438Influenza . . . . . . . . . . . . . . . . . . . . . . . . . . . 43,151 4,241 11,725 19,444 7,740 47,296 3,404 11,196 21,690 11,006Acute bronchitis . . . . . . . . . . . . . . . . . . . . . . . 4,564 1,038 1,032 1,439 1,054 7,585 1,266 1,083 3,053 2,184Pneumonia . . . . . . . . . . . . . . . . . . . . . . . . . . 1,644 411 388 257 588 2,576 739 162 945 729Other respiratory conditions . . . . . . . . . . . . . . . . 2,192 770 784 455 183 3,088 468 189 1,469 962
Digestive system conditions . . . . . . . . . . . . . . . . 6,900 1,315 1,826 2,270 1,489 8,963 841 2,283 3,515 2,324
Dental conditions . . . . . . . . . . . . . . . . . . . . . . 1,575 535 190 570 281 1,316 157 165 664 330Indigestion, nausea, and vomiting . . . . . . . . . . . . 3,510 377 1,353 1,367 413 4,813 453 1,639 1,882 839Other digestive conditions . . . . . . . . . . . . . . . . . 1,814 403 284 332 796 2,835 231 479 969 1,156
Injuries . . . . . . . . . . . . . . . . . . . . . . . . . . . . . 32,639 3,260 7,070 16,599 5,710 29,247 1,986 5,834 12,393 9,034
Fractures and dislocations . . . . . . . . . . . . . . . . . 4,506 154 1,297 2,143 913 3,387 239 992 797 1,359Sprains and strains . . . . . . . . . . . . . . . . . . . . . 7,156 106 1,479 4,069 1,502 7,040 68 929 4,309 1,733Open wounds and lacerations . . . . . . . . . . . . . . 7,233 924 1,865 3,737 707 3,640 276 982 1,544 838Contusions and superficial injuries . . . . . . . . . . . . 5,775 447 1,366 2,992 971 6,342 617 1,381 1,663 2,681Other current injuries . . . . . . . . . . . . . . . . . . . . 7,970 1,630 1,064 3,658 1,618 8,838 786 1,550 4,079 2,423
Selected other acute conditions . . . . . . . . . . . . . 24,572 9,375 6,497 5,026 3,674 46,766 9,127 8,526 18,222 10,891
Eye conditions . . . . . . . . . . . . . . . . . . . . . . . . 1,002 183 194 412 213 2,158 353 209 562 1,034Acute ear infections . . . . . . . . . . . . . . . . . . . . . 11,634 6,961 3,182 1,141 351 12,489 5,879 3,569 1,814 1,228Other ear conditions . . . . . . . . . . . . . . . . . . . . 1,605 673 438 205 290 2,175 359 562 689 565Acute urinary conditions . . . . . . . . . . . . . . . . . . 814 51 55 338 370 7,327 520 544 3,802 2,461Disorders of menstruation . . . . . . . . . . . . . . . . . . . . . . . . . . . . . . . . 1,146 . . . 480 621 45Other disorders of female genital tract . . . . . . . . . . . . . . . . . . . . . . . . 2,652 – 117 2,063 473Delivery and other conditions of pregnancyand puerperium . . . . . . . . . . . . . . . . . . . . . . . . . . . . . . . . . . . . . 3,707 . . . 91 3,616 –Skin conditions . . . . . . . . . . . . . . . . . . . . . . . . 2,581 459 590 712 819 3,583 746 742 1,001 1,095Acute musculoskeletal conditions . . . . . . . . . . . . 3,127 50 279 1,383 1,416 5,951 113 480 2,398 2,960Headache, excluding migraine . . . . . . . . . . . . . . 1,330 – 520 648 161 2,646 – 669 1,271 705Fever, unspecified . . . . . . . . . . . . . . . . . . . . . . 2,478 1,000 1,238 186 53 2,933 1,158 1,063 386 326
All other acute conditions . . . . . . . . . . . . . . . . . 12,758 2,359 2,136 4,325 3,938 20,193 2,502 2,914 7,785 6,993
NOTES: Excluded from these estimates are conditions involving neither medical attention nor activity restriction.
The standard errors and relative standard errors (RSE’s) can be computed by using parameter set I of table II and the formula presented in rule 1 of appendix I. An estimate of 7.5 million has a10-percent RSE; of 1.9 million, a 20-percent RSE; and of 816,000, a 30-percent RSE.
19

Table 8. Number of acute conditions, by race, age, and type of condition: United States, 1994[Data are based on household interviews of the civilian noninstitutionalized population. The survey design, general qualifications, and information on the reliability of theestimates are given in appendix I. Definitions of terms are given in appendix II]
Type of acute condition
White Black
Allages
Under18 years
18–44years
45 yearsand over
Allages
Under18 years
18–44years
45 yearsand over
Number of acute conditions in thousands1
All acute conditions . . . . . . . . . . . . . . . . . . . . . 376,062 154,351 143,214 78,497 50,855 20,850 21,633 8,372
Infective and parasitic diseases . . . . . . . . . . . . . 46,374 27,530 14,059 4,785 6,665 3,738 2,353 574
Common childhood diseases . . . . . . . . . . . . . . . 3,054 2,629 425 – 689 498 191 –Intestinal virus, unspecified . . . . . . . . . . . . . . . . 9,926 5,414 3,589 923 1,746 823 713 211Viral infections, unspecified . . . . . . . . . . . . . . . . 14,285 8,466 3,681 2,138 2,438 1,202 1,035 202Other . . . . . . . . . . . . . . . . . . . . . . . . . . . . . . 19,108 11,021 6,364 1,724 1,791 1,216 414 161
Respiratory conditions . . . . . . . . . . . . . . . . . . . 176,767 69,663 71,913 35,191 21,714 8,597 9,170 3,948
Common cold . . . . . . . . . . . . . . . . . . . . . . . . 52,150 21,870 20,100 10,181 9,680 4,725 3,628 1,326Other acute upper respiratory infections . . . . . . . . 27,431 13,977 9,474 3,981 2,333 925 893 516Influenza . . . . . . . . . . . . . . . . . . . . . . . . . . . 78,327 26,767 35,587 15,973 7,668 1,934 3,952 1,782Acute bronchitis . . . . . . . . . . . . . . . . . . . . . . . 10,916 3,949 4,098 2,869 795 360 279 156Pneumonia . . . . . . . . . . . . . . . . . . . . . . . . . . 3,535 1,423 972 1,140 575 226 230 119Other respiratory conditions . . . . . . . . . . . . . . . . 4,407 1,678 1,682 1,047 664 427 187 50
Digestive system conditions . . . . . . . . . . . . . . . . 12,149 4,892 3,937 3,319 2,939 1,103 1,500 335
Dental conditions . . . . . . . . . . . . . . . . . . . . . . 1,922 544 905 472 853 443 271 138Indigestion, nausea, and vomiting . . . . . . . . . . . . 6,327 3,352 1,940 1,036 1,611 417 1,080 114Other digestive conditions . . . . . . . . . . . . . . . . . 3,900 996 1,092 1,811 474 243 148 83
Injuries . . . . . . . . . . . . . . . . . . . . . . . . . . . . . 53,108 15,489 24,527 13,092 6,798 2,070 3,453 1,274
Fractures and dislocations . . . . . . . . . . . . . . . . . 6,998 2,320 2,669 2,009 719 312 145 262Sprains and strains . . . . . . . . . . . . . . . . . . . . . 12,450 2,415 7,146 2,890 1,349 51 1,063 235Open wounds and lacerations . . . . . . . . . . . . . . 9,322 3,329 4,555 1,439 1,174 599 468 106Contusions and superficial injuries . . . . . . . . . . . . 9,879 3,009 3,884 2,986 1,719 696 500 523Other current injuries . . . . . . . . . . . . . . . . . . . . 14,458 4,417 6,273 3,769 1,836 412 1,276 148
Selected other acute conditions . . . . . . . . . . . . . 60,758 28,748 19,363 12,647 8,233 4,024 2,951 1,258
Eye conditions . . . . . . . . . . . . . . . . . . . . . . . . 2,680 824 858 998 481 115 117 249Acute ear infections . . . . . . . . . . . . . . . . . . . . . 21,298 17,085 2,697 1,517 2,512 2,315 188 8Other ear conditions . . . . . . . . . . . . . . . . . . . . 3,293 1,775 662 855 488 257 231 –Acute urinary conditions . . . . . . . . . . . . . . . . . . 7,230 1,115 3,499 2,617 573 55 466 52Disorders of menstruation . . . . . . . . . . . . . . . . . 885 317 522 45 261 163 98 –Other disorders of female genital tract . . . . . . . . . 2,152 117 1,705 330 445 – 302 143Delivery and other conditions of pregnancy andpuerperium . . . . . . . . . . . . . . . . . . . . . . . . . 2,932 54 2,878 – 725 37 688 –
Skin conditions . . . . . . . . . . . . . . . . . . . . . . . . 5,161 2,092 1,477 1,592 472 384 – 87Acute musculoskeletal conditions . . . . . . . . . . . . 7,791 877 3,157 3,758 978 – 523 454Headache, excluding migraine . . . . . . . . . . . . . . 3,069 965 1,549 555 619 116 238 265Fever, unspecified . . . . . . . . . . . . . . . . . . . . . . 4,268 3,529 359 379 680 582 99 –
All other acute conditions . . . . . . . . . . . . . . . . . 26,907 8,029 9,415 9,463 4,507 1,317 2,207 983
1Totals for white and black do not sum to total acute conditions because other races are not included.
NOTES: Excluded from these estimates are conditions involving neither medical attention nor activity restriction.
The standard errors and relative standard errors (RSE’s) can be computed by using parameter set I of table II and the formula presented in rule 1 of appendix I. An estimate of 7.5 million has a10-percent RSE; of 1.9 million, a 20-percent RSE; and of 816,000, a 30-percent RSE.
20

Table 9. Number of acute conditions, by family income, age, and type of condition: United States, 1994[Data are based on household interviews of the civilian noninstitutionalized population. The survey design, general qualifications, and information on the reliability of theestimates are given in appendix I. Definitions of terms are given in appendix II]
Type of acute condition
Family income
Less than $10,000 $10,000–$19,999
Allages
Under18 years
18–44years
45 yearsand over
Allages
Under18 years
18–44years
45 yearsand over
Number of acute conditions in thousands1
All acute conditions . . . . . . . . . . . . . . . . . . . . . 48,355 18,670 20,388 9,296 63,966 25,306 25,737 12,923
Infective and parasitic diseases . . . . . . . . . . . . . 3,796 2,251 1,298 247 6,863 3,962 2,292 609
Common childhood diseases . . . . . . . . . . . . . . . 171 171 – – 253 98 156 –Intestinal virus, unspecified . . . . . . . . . . . . . . . . 826 465 229 132 1,834 1,186 592 56Viral infections, unspecified . . . . . . . . . . . . . . . . 1,372 783 521 69 2,285 1,315 920 50Other . . . . . . . . . . . . . . . . . . . . . . . . . . . . . . 1,427 831 549 46 2,491 1,364 624 503
Respiratory conditions . . . . . . . . . . . . . . . . . . . 21,517 7,942 9,833 3,743 29,488 11,850 12,148 5,490
Common cold . . . . . . . . . . . . . . . . . . . . . . . . 8,035 4,131 3,177 727 9,709 4,037 4,061 1,611Other acute upper respiratory infections . . . . . . . . 2,890 1,196 1,380 314 3,187 1,513 1,138 535Influenza . . . . . . . . . . . . . . . . . . . . . . . . . . . 8,877 2,185 4,604 2,088 11,684 3,802 5,583 2,299Acute bronchitis . . . . . . . . . . . . . . . . . . . . . . . 644 111 362 171 2,787 1,176 910 702Pneumonia . . . . . . . . . . . . . . . . . . . . . . . . . . 325 107 184 34 937 480 173 283Other respiratory conditions . . . . . . . . . . . . . . . . 745 211 125 409 1,184 842 283 59
Digestive system conditions . . . . . . . . . . . . . . . . 2,370 846 1,236 289 2,992 876 1,241 875
Dental conditions . . . . . . . . . . . . . . . . . . . . . . 650 315 261 74 349 170 117 62Indigestion, nausea, and vomiting . . . . . . . . . . . . 1,065 321 588 156 1,755 548 867 340Other digestive conditions . . . . . . . . . . . . . . . . . 654 210 387 58 887 158 257 473
Injuries . . . . . . . . . . . . . . . . . . . . . . . . . . . . . 7,928 2,252 3,500 2,176 9,342 2,379 5,257 1,706
Fractures and dislocations . . . . . . . . . . . . . . . . . 1,050 245 312 493 1,331 257 922 152Sprains and strains . . . . . . . . . . . . . . . . . . . . . 1,980 354 1,293 332 2,136 297 1,328 511Open wounds and lacerations . . . . . . . . . . . . . . 1,303 466 633 203 1,719 581 1,028 110Contusions and superficial injuries . . . . . . . . . . . . 1,740 450 615 675 1,762 613 751 398Other current injuries . . . . . . . . . . . . . . . . . . . . 1,855 736 646 473 2,394 631 1,227 535
Selected other acute conditions . . . . . . . . . . . . . 8,529 3,848 3,058 1,623 9,575 4,629 2,918 2,028
Eye conditions . . . . . . . . . . . . . . . . . . . . . . . . 437 61 59 317 436 56 227 153Acute ear infections . . . . . . . . . . . . . . . . . . . . . 2,867 2,182 520 166 3,313 3,139 173 –Other ear conditions . . . . . . . . . . . . . . . . . . . . 206 94 – 112 797 408 120 269Acute urinary conditions . . . . . . . . . . . . . . . . . . 722 150 306 265 1,036 111 404 521Disorders of menstruation . . . . . . . . . . . . . . . . . 122 64 58 – 55 – 55 –Other disorders of female genital tract . . . . . . . . . 493 – 412 81 563 61 328 174Delivery and other conditions of pregnancy andpuerperium . . . . . . . . . . . . . . . . . . . . . . . . . 361 54 306 – 552 – 552 –Skin conditions . . . . . . . . . . . . . . . . . . . . . . . . 787 264 474 49 409 130 183 95Acute musculoskeletal conditions . . . . . . . . . . . . 933 48 458 427 1,330 – 624 707Headache, excluding migraine . . . . . . . . . . . . . . 474 94 274 107 310 119 191 –Fever, unspecified . . . . . . . . . . . . . . . . . . . . . . 1,128 837 192 99 773 604 60 109
All other acute conditions . . . . . . . . . . . . . . . . . 4,215 1,533 1,464 1,219 5,706 1,609 1,882 2,215
See footnote and notes at end of table.
21

Table 9. Number of acute conditions, by family income, age, and type of condition: United States, 1994—Con.[Data are based on household interviews of the civilian noninstitutionalized population. The survey design, general qualifications, and information on the reliability of theestimates are given in appendix I. Definitions of terms are given in appendix II]
Type of acute condition
Family income
$20,000–$34,999 $35,000 or more
Allages
Under18 years
18–44years
45 yearsand over
Allages
Under18 years
18–44years
45 yearsand over
Number of acute conditions in thousands1
All acute conditions . . . . . . . . . . . . . . . . . . . . . 94,062 38,040 37,895 18,126 176,197 79,308 64,002 32,887
Infective and parasitic diseases . . . . . . . . . . . . . 11,229 5,981 4,139 1,109 24,633 15,768 6,153 2,712
Common childhood diseases . . . . . . . . . . . . . . . 875 875 – – 1,696 1,415 281 –Intestinal virus, unspecified . . . . . . . . . . . . . . . . 2,740 1,456 1,052 233 4,621 2,649 1,325 646Viral infections, unspecified . . . . . . . . . . . . . . . . 3,629 1,765 1,373 491 7,467 4,626 1,512 1,329Other . . . . . . . . . . . . . . . . . . . . . . . . . . . . . . 3,984 1,885 1,714 385 10,849 7,077 3,035 737
Respiratory conditions . . . . . . . . . . . . . . . . . . . 46,256 18,425 19,004 8,827 84,246 35,182 33,499 15,564
Common cold . . . . . . . . . . . . . . . . . . . . . . . . 13,624 5,934 5,449 2,241 25,450 11,301 9,034 5,115Other acute upper respiratory infections . . . . . . . . 7,256 3,863 2,557 836 13,424 6,897 4,491 2,036Influenza . . . . . . . . . . . . . . . . . . . . . . . . . . . 20,840 6,846 9,660 4,334 38,095 14,338 16,914 6,842Acute bronchitis . . . . . . . . . . . . . . . . . . . . . . . 2,472 1,061 575 836 4,703 1,804 1,863 1,036Pneumonia . . . . . . . . . . . . . . . . . . . . . . . . . . 1,042 376 352 314 878 147 404 328Other respiratory conditions . . . . . . . . . . . . . . . . 1,022 346 411 265 1,696 695 793 208
Digestive system conditions . . . . . . . . . . . . . . . . 3,073 1,462 993 618 5,143 2,044 1,710 1,389
Dental conditions . . . . . . . . . . . . . . . . . . . . . . 434 225 93 116 935 168 409 359Indigestion, nausea, and vomiting . . . . . . . . . . . . 1,557 864 576 118 2,746 1,370 1,019 357Other digestive conditions . . . . . . . . . . . . . . . . . 1,081 373 324 384 1,462 506 282 674
Injuries . . . . . . . . . . . . . . . . . . . . . . . . . . . . . 12,485 3,661 6,030 2,794 22,109 7,594 9,472 5,043
Fractures and dislocations . . . . . . . . . . . . . . . . . 1,823 689 520 614 2,225 1,085 683 457Sprains and strains . . . . . . . . . . . . . . . . . . . . . 2,455 428 1,576 451 5,980 1,291 3,224 1,465Open wounds and lacerations . . . . . . . . . . . . . . 2,301 878 1,170 253 3,618 1,624 1,417 577Contusions and superficial injuries . . . . . . . . . . . . 2,595 974 1,008 613 3,985 1,305 1,681 999Other current injuries . . . . . . . . . . . . . . . . . . . . 3,311 693 1,755 863 6,299 2,289 2,466 1,544
Selected other acute conditions . . . . . . . . . . . . . 14,599 6,669 4,937 2,993 28,773 14,756 9,237 4,780
Eye conditions . . . . . . . . . . . . . . . . . . . . . . . . 601 50 269 282 1,132 707 253 172Acute ear infections . . . . . . . . . . . . . . . . . . . . . 4,312 3,400 471 442 10,608 8,471 1,455 682Other ear conditions . . . . . . . . . . . . . . . . . . . . 957 426 312 218 1,551 934 429 189Acute urinary conditions . . . . . . . . . . . . . . . . . . 1,960 287 994 679 2,714 486 1,792 435Disorders of menstruation . . . . . . . . . . . . . . . . . 302 212 90 – 598 203 350 45Other disorders of female genital tract . . . . . . . . . 504 55 335 113 882 – 777 105Delivery and other conditions of pregnancy andpuerperium . . . . . . . . . . . . . . . . . . . . . . . . . 747 37 710 – 1,644 – 1,644 –Skin conditions . . . . . . . . . . . . . . . . . . . . . . . . 1,212 523 369 319 2,820 1,367 451 1,002Acute musculoskeletal conditions . . . . . . . . . . . . 1,921 289 793 839 3,761 531 1,672 1,558Headache, excluding migraine . . . . . . . . . . . . . . 863 221 594 47 1,375 545 293 537Fever, unspecified . . . . . . . . . . . . . . . . . . . . . . 1,221 1,168 – 53 1,690 1,512 122 55
All other acute conditions . . . . . . . . . . . . . . . . . 6,420 1,843 2,792 1,786 11,293 3,964 3,931 3,398
1Totals for income categories do not sum to total acute conditions because persons with unknown family income are not included.
NOTES: Excluded from these estimates are conditions involving neither medical attention nor activity restriction.
The standard errors and relative standard errors (RSE’s) can be computed by using parameter set I of table II and the formula presented in rule 1 of appendix I. An estimate of 7.5 million has a10-percent RSE; of 1.9 million, a 20-percent RSE; and of 816,000, a 30-percent RSE.
22

Table 10. Number of acute conditions, by geographic region, place of residence, and type of condition: United States, 1994[Data are based on household interviews of the civilian noninstitutionalized population. The survey design, general qualifications, and information on the reliability of theestimates are given in appendix I. Definitions of terms are given in appendix II]
Type of acute condition
Place of residence
Geographic region MSA1
Northeast Midwest South WestAll
MSA1Centralcity
Notcentralcity
NotMSA1
Number of acute conditions in thousands
All acute conditions . . . . . . . . . . . . . . . . . . . . . 81,803 111,701 136,518 115,147 354,502 132,447 222,055 90,668
Infective and parasitic diseases . . . . . . . . . . . . . 12,422 10,477 21,466 9,836 43,654 15,277 28,377 10,547
Common childhood diseases . . . . . . . . . . . . . . . 1,023 847 881 1,046 3,212 1,234 1,978 585Intestinal virus, unspecified . . . . . . . . . . . . . . . . 3,754 1,007 6,143 999 9,867 3,193 6,674 2,035Viral infections, unspecified . . . . . . . . . . . . . . . . 3,110 3,501 8,011 2,635 13,236 4,298 8,937 4,022Other . . . . . . . . . . . . . . . . . . . . . . . . . . . . . . 4,535 5,122 6,430 5,156 17,339 6,551 10,787 3,905
Respiratory conditions . . . . . . . . . . . . . . . . . . . 37,170 55,255 55,844 60,662 167,305 63,813 103,492 41,625
Common cold . . . . . . . . . . . . . . . . . . . . . . . . 14,889 14,764 17,109 19,207 54,629 22,900 31,729 11,339Other acute upper respiratory infections . . . . . . . . 5,535 8,200 9,878 7,254 23,931 8,037 15,894 6,935Influenza . . . . . . . . . . . . . . . . . . . . . . . . . . . 13,181 26,895 22,045 28,327 72,232 27,024 45,208 18,215Acute bronchitis . . . . . . . . . . . . . . . . . . . . . . . 2,628 3,075 3,416 3,029 9,304 2,848 6,457 2,845Pneumonia . . . . . . . . . . . . . . . . . . . . . . . . . . 368 1,173 1,309 1,370 2,814 1,233 1,582 1,405Other respiratory conditions . . . . . . . . . . . . . . . . 569 1,148 2,087 1,475 4,394 1,772 2,622 886
Digestive system conditions . . . . . . . . . . . . . . . . 2,617 3,315 5,864 4,067 13,128 5,754 7,374 2,735
Dental conditions . . . . . . . . . . . . . . . . . . . . . . 782 431 1,154 524 2,446 1,179 1,267 445Indigestion, nausea, and vomiting . . . . . . . . . . . . 901 1,858 3,190 2,374 6,538 3,016 3,522 1,784Other digestive conditions . . . . . . . . . . . . . . . . . 935 1,026 1,520 1,169 4,144 1,559 2,585 505
Injuries . . . . . . . . . . . . . . . . . . . . . . . . . . . . . 10,243 15,930 20,818 14,897 47,445 17,156 30,289 14,442
Fractures and dislocations . . . . . . . . . . . . . . . . . 1,407 1,628 3,082 1,776 5,553 1,972 3,582 2,339Sprains and strains . . . . . . . . . . . . . . . . . . . . . 2,956 4,027 4,636 2,576 10,676 3,478 7,198 3,519Open wounds and lacerations . . . . . . . . . . . . . . 1,382 2,887 3,623 2,982 8,563 3,465 5,098 2,310Contusions and superficial injuries . . . . . . . . . . . . 2,408 2,693 3,884 3,133 9,654 3,599 6,055 2,464Other current injuries . . . . . . . . . . . . . . . . . . . . 2,090 4,695 5,594 4,429 12,998 4,641 8,357 3,809
Selected other acute conditions . . . . . . . . . . . . . 13,408 18,761 21,800 17,369 56,358 19,722 36,636 14,979
Eye conditions . . . . . . . . . . . . . . . . . . . . . . . . 629 855 1,063 614 2,537 1,345 1,193 623Acute ear infections . . . . . . . . . . . . . . . . . . . . . 3,758 6,080 7,490 6,796 20,365 5,782 14,582 3,759Other ear conditions . . . . . . . . . . . . . . . . . . . . 719 1,278 1,148 636 2,697 821 1,876 1,083Acute urinary conditions . . . . . . . . . . . . . . . . . . 1,849 1,802 2,696 1,794 5,731 1,775 3,956 2,409Disorders of menstruation . . . . . . . . . . . . . . . . . 33 278 626 209 821 366 455 324Other disorders of female genital tract . . . . . . . . . 502 732 1,127 290 1,789 854 935 863Delivery and other conditions of pregnancy andpuerperium . . . . . . . . . . . . . . . . . . . . . . . . . 623 1,124 1,323 637 3,223 1,021 2,203 484Skin conditions . . . . . . . . . . . . . . . . . . . . . . . . 1,171 1,748 1,753 1,493 4,452 1,414 3,038 1,712Acute musculoskeletal conditions . . . . . . . . . . . . 2,014 2,502 2,213 2,348 6,997 2,830 4,167 2,081Headache, excluding migraine . . . . . . . . . . . . . . 796 946 1,130 1,103 3,116 1,604 1,512 859Fever, unspecified . . . . . . . . . . . . . . . . . . . . . . 1,314 1,416 1,231 1,449 4,628 1,910 2,718 782
All other acute conditions . . . . . . . . . . . . . . . . . 5,943 7,964 10,727 8,318 26,612 10,725 15,887 6,340
1MSA is metropolitan statistical area.
NOTES: Excluded from these estimates are conditions involving neither medical attention nor activity restriction.
The standard errors and relative standard errors (RSE’s) can be computed by using parameter set I of table II and the formula presented in rule 1 of appendix I. An estimate of 7.5 million has a10-percent RSE; of 1.9 million, a 20-percent RSE; and of 816,000, a 30-percent RSE.
23

Table 11. Percent of acute conditions medically attended, by age and type of condition: United States, 1994[Data are based on household interviews of the civilian noninstitutionalized population. The survey design, general qualifications, and information on the reliability of theestimates are given in appendix I. Definitions of terms are given in appendix II]
Type of acute condition
45 years and over
Allages
Under5 years
5–17years
18–24years
25–44years Total
45–64years
65 yearsand over
Percent
All acute conditions . . . . . . . . . . . . . . . . . . . . . 67.3 84.1 60.7 60.4 62.9 71.2 64.9 81.6
Infective and parasitic diseases . . . . . . . . . . . . . 65.5 83.6 62.0 58.5 61.0 58.0 52.7 70.8
Common childhood diseases . . . . . . . . . . . . . . . 58.3 73.2 *29.7 *71.3 *88.7 *– *– *–Intestinal virus, unspecified . . . . . . . . . . . . . . . . 35.7 64.2 29.7 *29.4 31.0 *37.3 *31.3 *68.7Viral infections, unspecified . . . . . . . . . . . . . . . . 57.0 84.5 *49.5 *51.2 45.8 45.5 *41.0 *54.4Other . . . . . . . . . . . . . . . . . . . . . . . . . . . . . . 90.5 97.2 92.7 82.7 87.4 84.3 81.0 *91.1
Respiratory conditions . . . . . . . . . . . . . . . . . . . 50.1 73.7 45.0 39.7 44.7 51.8 45.4 65.2
Common cold . . . . . . . . . . . . . . . . . . . . . . . . 40.9 67.6 32.5 29.0 31.4 41.1 36.0 52.2Other acute upper respiratory infections . . . . . . . . 80.9 94.2 76.0 77.4 81.6 77.8 78.0 77.6Influenza . . . . . . . . . . . . . . . . . . . . . . . . . . . 36.2 57.6 32.5 27.0 34.1 40.2 32.8 57.2Acute bronchitis . . . . . . . . . . . . . . . . . . . . . . . 90.9 95.6 86.5 *86.4 92.8 89.5 83.8 100.0Pneumonia . . . . . . . . . . . . . . . . . . . . . . . . . . 98.7 100.0 *100.0 *100.0 *100.0 96.0 *88.2 100.0Other respiratory conditions . . . . . . . . . . . . . . . . 89.1 91.3 *83.4 *89.7 89.9 90.3 *100.0 *79.4
Digestive system conditions . . . . . . . . . . . . . . . . 60.7 79.0 37.3 51.6 55.1 85.8 78.8 94.2
Dental conditions . . . . . . . . . . . . . . . . . . . . . . 67.3 *64.3 *74.1 *43.2 *55.6 *100.0 *100.0 *100.0Indigestion, nausea, and vomiting . . . . . . . . . . . . 40.8 *75.2 *22.0 *43.5 40.6 *60.8 *35.5 *91.5Other digestive conditions . . . . . . . . . . . . . . . . . 92.1 *100.0 *80.1 *100.0 84.5 97.3 100.0 94.7
Injuries . . . . . . . . . . . . . . . . . . . . . . . . . . . . . 91.7 93.4 94.9 88.5 91.0 91.0 91.2 90.7
Fractures and dislocations . . . . . . . . . . . . . . . . . 97.3 *100.0 100.0 *93.2 92.6 100.0 100.0 100.0Sprains and strains . . . . . . . . . . . . . . . . . . . . . 88.0 *100.0 89.4 89.0 83.5 93.2 90.0 100.0Open wounds and lacerations . . . . . . . . . . . . . . 94.8 95.8 96.6 81.6 96.3 100.0 100.0 *100.0Contusions and superficial injuries . . . . . . . . . . . . 92.3 100.0 98.8 87.2 96.8 82.8 79.1 86.3Other current injuries . . . . . . . . . . . . . . . . . . . . 89.7 87.8 89.5 91.7 90.9 88.1 93.0 81.5
Selected other acute conditions . . . . . . . . . . . . . 89.6 96.9 79.8 89.5 87.9 92.4 90.8 94.9
Eye conditions . . . . . . . . . . . . . . . . . . . . . . . . 96.6 *89.7 *100.0 *100.0 *93.4 100.0 *100.0 100.0Acute ear infections . . . . . . . . . . . . . . . . . . . . . 97.1 100.0 92.9 *89.4 92.9 100.0 100.0 *100.0Other ear conditions . . . . . . . . . . . . . . . . . . . . 93.1 100.0 88.8 *100.0 *81.9 100.0 *100.0 *100.0Acute urinary conditions . . . . . . . . . . . . . . . . . . 100.0 *100.0 *100.0 100.0 100.0 100.0 100.0 100.0Disorders of menstruation . . . . . . . . . . . . . . . . . 50.0 . . . *23.8 *100.0 *52.5 *100.0 *100.0 *–Other disorders of female genital tract . . . . . . . . . 100.0 *– *100.0 *100.0 100.0 *100.0 *100.0 *100.0Delivery and other conditions of pregnancy andpuerperium . . . . . . . . . . . . . . . . . . . . . . . . . 96.8 . . . *100.0 100.0 95.0 *– *– . . .Skin conditions . . . . . . . . . . . . . . . . . . . . . . . . 99.0 100.0 95.6 *100.0 100.0 100.0 100.0 *100.0Acute musculoskeletal conditions . . . . . . . . . . . . 87.5 *100.0 *100.0 *90.0 88.0 84.1 83.9 84.5Headache, excluding migraine . . . . . . . . . . . . . . 46.0 *– *38.4 *48.6 *43.4 *58.8 *59.6 *53.9Fever, unspecified . . . . . . . . . . . . . . . . . . . . . . 57.5 75.9 44.2 *– *37.1 *87.6 *77.6 *100.0
All other acute conditions . . . . . . . . . . . . . . . . . 88.5 96.8 88.2 76.3 85.0 90.9 84.5 97.7
NOTES: Excluded from these estimates are conditions involving neither medical attention nor activity restriction.
The standard errors and relative standard errors (RSE’s) can be computed by using parameter set I of table II, the frequencies of table 6, and the formula presented in rule 3 of appendix I.Estimates for which the numerator has an RSE of more than 30 percent are indicated with an asterisk.
24
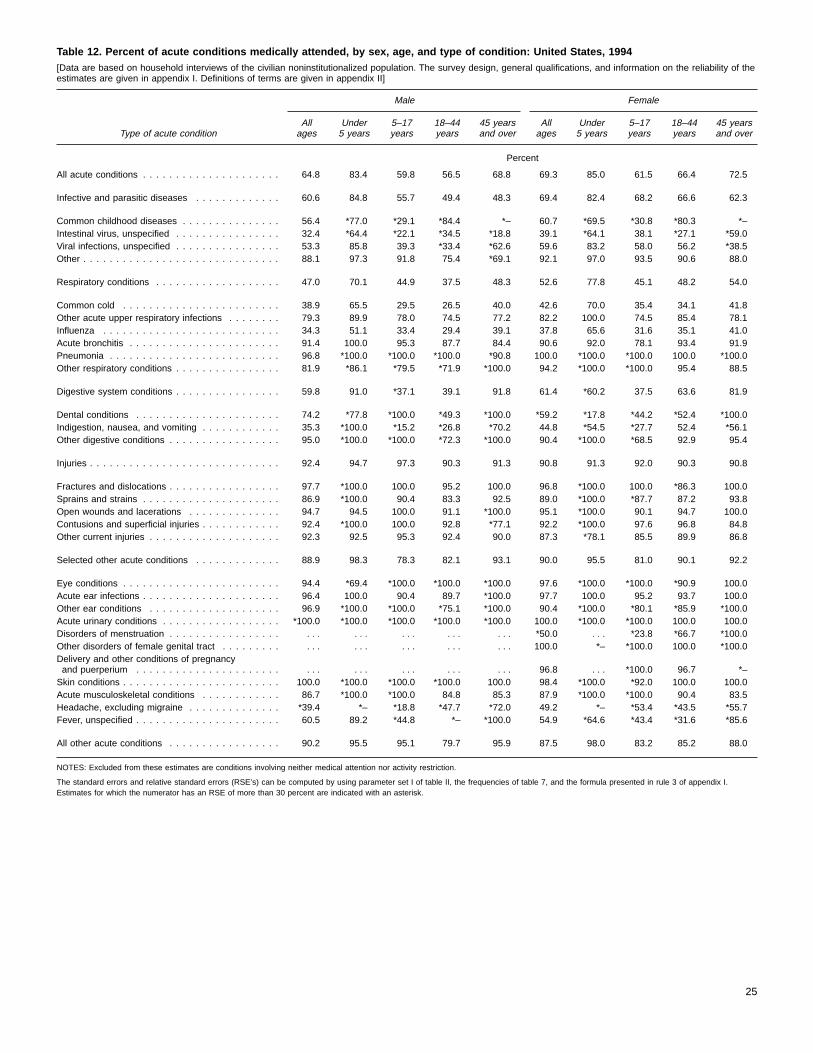
Table 12. Percent of acute conditions medically attended, by sex, age, and type of condition: United States, 1994[Data are based on household interviews of the civilian noninstitutionalized population. The survey design, general qualifications, and information on the reliability of theestimates are given in appendix I. Definitions of terms are given in appendix II]
Type of acute condition
Male Female
Allages
Under5 years
5–17years
18–44years
45 yearsand over
Allages
Under5 years
5–17years
18–44years
45 yearsand over
Percent
All acute conditions . . . . . . . . . . . . . . . . . . . . . 64.8 83.4 59.8 56.5 68.8 69.3 85.0 61.5 66.4 72.5
Infective and parasitic diseases . . . . . . . . . . . . . 60.6 84.8 55.7 49.4 48.3 69.4 82.4 68.2 66.6 62.3
Common childhood diseases . . . . . . . . . . . . . . . 56.4 *77.0 *29.1 *84.4 *– 60.7 *69.5 *30.8 *80.3 *–Intestinal virus, unspecified . . . . . . . . . . . . . . . . 32.4 *64.4 *22.1 *34.5 *18.8 39.1 *64.1 38.1 *27.1 *59.0Viral infections, unspecified . . . . . . . . . . . . . . . . 53.3 85.8 39.3 *33.4 *62.6 59.6 83.2 58.0 56.2 *38.5Other . . . . . . . . . . . . . . . . . . . . . . . . . . . . . . 88.1 97.3 91.8 75.4 *69.1 92.1 97.0 93.5 90.6 88.0
Respiratory conditions . . . . . . . . . . . . . . . . . . . 47.0 70.1 44.9 37.5 48.3 52.6 77.8 45.1 48.2 54.0
Common cold . . . . . . . . . . . . . . . . . . . . . . . . 38.9 65.5 29.5 26.5 40.0 42.6 70.0 35.4 34.1 41.8Other acute upper respiratory infections . . . . . . . . 79.3 89.9 78.0 74.5 77.2 82.2 100.0 74.5 85.4 78.1Influenza . . . . . . . . . . . . . . . . . . . . . . . . . . . 34.3 51.1 33.4 29.4 39.1 37.8 65.6 31.6 35.1 41.0Acute bronchitis . . . . . . . . . . . . . . . . . . . . . . . 91.4 100.0 95.3 87.7 84.4 90.6 92.0 78.1 93.4 91.9Pneumonia . . . . . . . . . . . . . . . . . . . . . . . . . . 96.8 *100.0 *100.0 *100.0 *90.8 100.0 *100.0 *100.0 100.0 *100.0Other respiratory conditions . . . . . . . . . . . . . . . . 81.9 *86.1 *79.5 *71.9 *100.0 94.2 *100.0 *100.0 95.4 88.5
Digestive system conditions . . . . . . . . . . . . . . . . 59.8 91.0 *37.1 39.1 91.8 61.4 *60.2 37.5 63.6 81.9
Dental conditions . . . . . . . . . . . . . . . . . . . . . . 74.2 *77.8 *100.0 *49.3 *100.0 *59.2 *17.8 *44.2 *52.4 *100.0Indigestion, nausea, and vomiting . . . . . . . . . . . . 35.3 *100.0 *15.2 *26.8 *70.2 44.8 *54.5 *27.7 52.4 *56.1Other digestive conditions . . . . . . . . . . . . . . . . . 95.0 *100.0 *100.0 *72.3 *100.0 90.4 *100.0 *68.5 92.9 95.4
Injuries . . . . . . . . . . . . . . . . . . . . . . . . . . . . . 92.4 94.7 97.3 90.3 91.3 90.8 91.3 92.0 90.3 90.8
Fractures and dislocations . . . . . . . . . . . . . . . . . 97.7 *100.0 100.0 95.2 100.0 96.8 *100.0 100.0 *86.3 100.0Sprains and strains . . . . . . . . . . . . . . . . . . . . . 86.9 *100.0 90.4 83.3 92.5 89.0 *100.0 *87.7 87.2 93.8Open wounds and lacerations . . . . . . . . . . . . . . 94.7 94.5 100.0 91.1 *100.0 95.1 *100.0 90.1 94.7 100.0Contusions and superficial injuries . . . . . . . . . . . . 92.4 *100.0 100.0 92.8 *77.1 92.2 *100.0 97.6 96.8 84.8Other current injuries . . . . . . . . . . . . . . . . . . . . 92.3 92.5 95.3 92.4 90.0 87.3 *78.1 85.5 89.9 86.8
Selected other acute conditions . . . . . . . . . . . . . 88.9 98.3 78.3 82.1 93.1 90.0 95.5 81.0 90.1 92.2
Eye conditions . . . . . . . . . . . . . . . . . . . . . . . . 94.4 *69.4 *100.0 *100.0 *100.0 97.6 *100.0 *100.0 *90.9 100.0Acute ear infections . . . . . . . . . . . . . . . . . . . . . 96.4 100.0 90.4 89.7 *100.0 97.7 100.0 95.2 93.7 100.0Other ear conditions . . . . . . . . . . . . . . . . . . . . 96.9 *100.0 *100.0 *75.1 *100.0 90.4 *100.0 *80.1 *85.9 *100.0Acute urinary conditions . . . . . . . . . . . . . . . . . . *100.0 *100.0 *100.0 *100.0 *100.0 100.0 *100.0 *100.0 100.0 100.0Disorders of menstruation . . . . . . . . . . . . . . . . . . . . . . . . . . . . . . . . *50.0 . . . *23.8 *66.7 *100.0Other disorders of female genital tract . . . . . . . . . . . . . . . . . . . . . . . . 100.0 *– *100.0 100.0 *100.0Delivery and other conditions of pregnancyand puerperium . . . . . . . . . . . . . . . . . . . . . . . . . . . . . . . . . . . . . 96.8 . . . *100.0 96.7 *–Skin conditions . . . . . . . . . . . . . . . . . . . . . . . . 100.0 *100.0 *100.0 *100.0 100.0 98.4 *100.0 *92.0 100.0 100.0Acute musculoskeletal conditions . . . . . . . . . . . . 86.7 *100.0 *100.0 84.8 85.3 87.9 *100.0 *100.0 90.4 83.5Headache, excluding migraine . . . . . . . . . . . . . . *39.4 *– *18.8 *47.7 *72.0 49.2 *– *53.4 *43.5 *55.7Fever, unspecified . . . . . . . . . . . . . . . . . . . . . . 60.5 89.2 *44.8 *– *100.0 54.9 *64.6 *43.4 *31.6 *85.6
All other acute conditions . . . . . . . . . . . . . . . . . 90.2 95.5 95.1 79.7 95.9 87.5 98.0 83.2 85.2 88.0
NOTES: Excluded from these estimates are conditions involving neither medical attention nor activity restriction.
The standard errors and relative standard errors (RSE’s) can be computed by using parameter set I of table II, the frequencies of table 7, and the formula presented in rule 3 of appendix I.Estimates for which the numerator has an RSE of more than 30 percent are indicated with an asterisk.
25

Table 13. Percent of acute conditions medically attended, by race, age, and type of condition: United States, 1994[Data are based on household interviews of the civilian noninstitutionalized population. The survey design, general qualifications, and information on the reliability of theestimates are given in appendix I. Definitions of terms are given in appendix II]
Type of acute condition
White Black
Allages
Under18 years
18–44years
45 yearsand over
Allages
Under18 years
18–44years
45 yearsand over
Percent
All acute conditions . . . . . . . . . . . . . . . . . . . . . 67.4 70.5 61.8 71.6 69.0 71.0 66.4 70.5
Infective and parasitic diseases . . . . . . . . . . . . . 66.7 70.8 61.4 58.4 56.7 61.0 52.4 *45.6
Common childhood diseases . . . . . . . . . . . . . . . 64.9 59.1 *100.0 *– *26.3 *20.3 *42.4 *–Intestinal virus, unspecified . . . . . . . . . . . . . . . . 33.0 37.3 25.5 *36.7 49.8 *51.6 *50.5 *40.3Viral infections, unspecified . . . . . . . . . . . . . . . . 58.3 66.2 46.3 47.6 48.0 *47.5 *53.3 *23.3Other . . . . . . . . . . . . . . . . . . . . . . . . . . . . . . 90.7 93.5 87.8 83.5 86.9 97.5 *58.2 *80.7
Respiratory conditions . . . . . . . . . . . . . . . . . . . 50.1 56.4 42.9 52.5 52.8 58.5 48.0 51.7
Common cold . . . . . . . . . . . . . . . . . . . . . . . . 39.7 49.9 28.8 39.3 48.5 56.5 38.8 *46.7Other acute upper respiratory infections . . . . . . . . 82.1 82.1 83.0 80.0 74.4 *81.8 *70.1 *68.2Influenza . . . . . . . . . . . . . . . . . . . . . . . . . . . 35.9 39.3 30.8 41.5 39.6 *30.2 43.2 *41.9Acute bronchitis . . . . . . . . . . . . . . . . . . . . . . . 91.1 90.2 91.5 91.8 *96.1 *100.0 *88.9 *100.0Pneumonia . . . . . . . . . . . . . . . . . . . . . . . . . . 98.5 100.0 100.0 95.4 *100.0 *100.0 *100.0 *100.0Other respiratory conditions . . . . . . . . . . . . . . . . 86.9 84.0 88.3 89.4 *100.0 *100.0 *100.0 *100.0
Digestive system conditions . . . . . . . . . . . . . . . . 61.0 47.1 56.0 87.4 62.3 *64.9 57.2 *77.0
Dental conditions . . . . . . . . . . . . . . . . . . . . . . 68.6 *54.6 *60.7 *100.0 *66.8 *79.2 *29.9 *100.0Indigestion, nausea, and vomiting . . . . . . . . . . . . 40.4 34.6 *37.3 *64.7 *48.9 *29.3 *58.2 *31.6Other digestive conditions . . . . . . . . . . . . . . . . . 90.6 84.8 85.3 97.1 *100.0 *100.0 *100.0 *100.0
Injuries . . . . . . . . . . . . . . . . . . . . . . . . . . . . . 91.2 94.9 89.3 90.4 93.9 89.4 95.0 98.3
Fractures and dislocations . . . . . . . . . . . . . . . . . 97.0 100.0 92.1 100.0 *100.0 *100.0 *100.0 *100.0Sprains and strains . . . . . . . . . . . . . . . . . . . . . 87.1 91.1 83.7 92.4 92.1 *21.6 93.7 *100.0Open wounds and lacerations . . . . . . . . . . . . . . 95.2 98.2 91.4 100.0 92.3 *85.0 *100.0 *100.0Contusions and superficial injuries . . . . . . . . . . . . 91.9 100.0 94.3 80.5 95.2 *95.1 *90.4 *100.0Other current injuries . . . . . . . . . . . . . . . . . . . . 88.9 88.4 89.9 87.9 92.7 *86.4 95.7 *84.5
Selected other acute conditions . . . . . . . . . . . . . 89.8 89.5 88.3 92.8 89.5 89.9 89.3 89.0
Eye conditions . . . . . . . . . . . . . . . . . . . . . . . . 96.0 *93.2 *93.9 100.0 *100.0 *100.0 *100.0 *100.0Acute ear infections . . . . . . . . . . . . . . . . . . . . . 96.7 97.2 91.4 100.0 100.0 100.0 *100.0 *100.0Other ear conditions . . . . . . . . . . . . . . . . . . . . 93.1 93.6 *82.8 100.0 *93.2 *100.0 *85.7 *–Acute urinary conditions . . . . . . . . . . . . . . . . . . 100.0 100.0 100.0 100.0 *100.0 *100.0 *100.0 *100.0Disorders of menstruation . . . . . . . . . . . . . . . . . *57.4 *36.0 *66.9 *100.0 *24.9 *– *66.3 *–Other disorders of female genital tract . . . . . . . . . 100.0 *100.0 100.0 *100.0 *100.0 *– *100.0 *100.0Delivery and other conditions of pregnancy andpuerperium . . . . . . . . . . . . . . . . . . . . . . . . . 98.4 *100.0 98.3 *– *90.1 *100.0 *89.5 *–Skin conditions . . . . . . . . . . . . . . . . . . . . . . . . 98.9 97.2 100.0 100.0 *100.0 *100.0 *– *100.0Acute musculoskeletal conditions . . . . . . . . . . . . 85.8 100.0 86.1 82.4 96.7 *– *100.0 *93.2Headache, excluding migraine . . . . . . . . . . . . . . 44.5 *32.0 *45.6 *63.2 *55.3 *81.9 *37.4 *59.6Fever, unspecified . . . . . . . . . . . . . . . . . . . . . . 56.2 58.6 *– *87.6 *62.9 *61.9 *68.7 *–
All other acute conditions . . . . . . . . . . . . . . . . . 87.7 90.7 83.1 89.6 93.9 100.0 88.3 98.4
NOTES: Excluded from these estimates are conditions involving neither medical attention nor activity restriction.
The standard errors and relative standard errors (RSE’s) can be computed by using parameter set I of table II, the frequencies of table 8, and the formula presented in rule 3 of appendix I.Estimates for which the numerator has an RSE of more than 30 percent are indicated with an asterisk.
26

Table 14. Percent of acute conditions medically attended, by family income, age, and type of condition: United States, 1994[Data are based on household interviews of the civilian noninstitutionalized population. The survey design, general qualifications, and information on the reliability of theestimates are given in appendix I. Definitions of terms are given in appendix II]
Type of acute condition
Family income
Less than $10,000 $10,000–$19,999
Allages
Under18 years
18–44years
45 yearsand over
Allages
Under18 years
18–44years
45 yearsand over
Percent
All acute conditions . . . . . . . . . . . . . . . . . . . . . 71.5 74.5 66.8 75.9 66.5 70.4 59.5 72.6
Infective and parasitic diseases . . . . . . . . . . . . . 57.7 56.3 66.2 *25.9 65.6 70.1 48.9 *100.0
Common childhood diseases . . . . . . . . . . . . . . . *44.4 *44.4 *– *– *54.2 *50.0 *56.4 *–Intestinal virus, unspecified . . . . . . . . . . . . . . . . *58.4 *60.4 *79.9 *13.6 *36.2 *36.9 *28.5 *100.0Viral infections, unspecified . . . . . . . . . . . . . . . . *25.9 *20.3 *37.8 *– 68.6 74.2 *58.9 *100.0Other . . . . . . . . . . . . . . . . . . . . . . . . . . . . . . 89.3 *90.3 *87.2 *100.0 85.8 96.3 *51.6 *100.0
Respiratory conditions . . . . . . . . . . . . . . . . . . . 56.9 63.4 50.5 60.0 48.8 54.8 41.7 51.6
Common cold . . . . . . . . . . . . . . . . . . . . . . . . 51.4 58.8 43.5 *44.0 38.1 46.7 27.5 *43.3Other acute upper respiratory infections . . . . . . . . 79.2 86.4 72.4 *81.5 73.7 75.0 *68.6 *81.1Influenza . . . . . . . . . . . . . . . . . . . . . . . . . . . 46.7 52.4 42.2 50.6 33.7 34.5 33.5 *33.2Acute bronchitis . . . . . . . . . . . . . . . . . . . . . . . *95.2 *100.0 *91.4 *100.0 93.9 89.5 100.0 *93.4Pneumonia . . . . . . . . . . . . . . . . . . . . . . . . . . *100.0 *100.0 *100.0 *100.0 100.0 *100.0 *100.0 *100.0Other respiratory conditions . . . . . . . . . . . . . . . . *100.0 *100.0 *100.0 *100.0 71.4 *74.8 *76.0 *–
Digestive system conditions . . . . . . . . . . . . . . . . 69.5 *58.6 69.8 *100.0 57.0 *66.1 *35.6 *78.3
Dental conditions . . . . . . . . . . . . . . . . . . . . . . *56.8 *52.7 *49.4 *100.0 *66.5 *100.0 *– *100.0Indigestion, nausea, and vomiting . . . . . . . . . . . . *58.7 *37.7 *59.2 *100.0 *38.6 *45.8 *31.9 *44.4Other digestive conditions . . . . . . . . . . . . . . . . . *100.0 *100.0 *100.0 *100.0 *89.7 *100.0 *64.2 *100.0
Injuries . . . . . . . . . . . . . . . . . . . . . . . . . . . . . 92.4 98.3 90.0 90.3 87.4 92.2 86.2 84.8
Fractures and dislocations . . . . . . . . . . . . . . . . . 100.0 *100.0 *100.0 *100.0 91.9 *100.0 *88.2 *100.0Sprains and strains . . . . . . . . . . . . . . . . . . . . . 89.7 *100.0 84.4 *100.0 84.5 *86.5 82.2 *89.6Open wounds and lacerations . . . . . . . . . . . . . . 95.4 *91.8 *96.5 *100.0 86.9 *89.8 83.8 *100.0Contusions and superficial injuries . . . . . . . . . . . . 94.0 *100.0 *100.0 *84.4 86.5 *94.5 *86.0 *75.4Other current injuries . . . . . . . . . . . . . . . . . . . . 87.5 *100.0 *80.7 *77.4 88.7 *91.6 91.3 *79.6
Selected other acute conditions . . . . . . . . . . . . . 86.3 88.9 83.9 84.8 91.4 90.5 91.6 92.9
Eye conditions . . . . . . . . . . . . . . . . . . . . . . . . *100.0 *100.0 *100.0 *100.0 *75.5 *– *77.5 *100.0Acute ear infections . . . . . . . . . . . . . . . . . . . . . 95.7 97.1 *88.5 *100.0 95.3 96.8 *68.8 *–Other ear conditions . . . . . . . . . . . . . . . . . . . . *100.0 *100.0 *– *100.0 *79.5 *72.5 *57.5 *100.0Acute urinary conditions . . . . . . . . . . . . . . . . . . *100.0 *100.0 *100.0 *100.0 100.0 *100.0 *100.0 *100.0Disorders of menstruation . . . . . . . . . . . . . . . . . *47.5 *– *100.0 *– *100.0 *– *100.0 *–Other disorders of female genital tract . . . . . . . . . *100.0 *– *100.0 *100.0 *100.0 *100.0 *100.0 *100.0Delivery and other conditions of pregnancy andpuerperium . . . . . . . . . . . . . . . . . . . . . . . . . *80.1 *100.0 *76.5 *– *100.0 *– *100.0 *–Skin conditions . . . . . . . . . . . . . . . . . . . . . . . . *100.0 *100.0 *100.0 *100.0 *100.0 *100.0 *100.0 *100.0Acute musculoskeletal conditions . . . . . . . . . . . . *77.2 *100.0 *73.8 *78.2 89.2 *– *100.0 *79.6Headache, excluding migraine . . . . . . . . . . . . . . *55.5 *100.0 *61.7 *– *69.4 *42.9 *85.9 *–Fever, unspecified . . . . . . . . . . . . . . . . . . . . . . *57.1 *64.2 *28.1 *52.5 *79.0 *83.1 *– *100.0
All other acute conditions . . . . . . . . . . . . . . . . . 90.2 96.4 82.4 91.6 87.6 98.7 78.6 87.0
See notes at end of table.
27
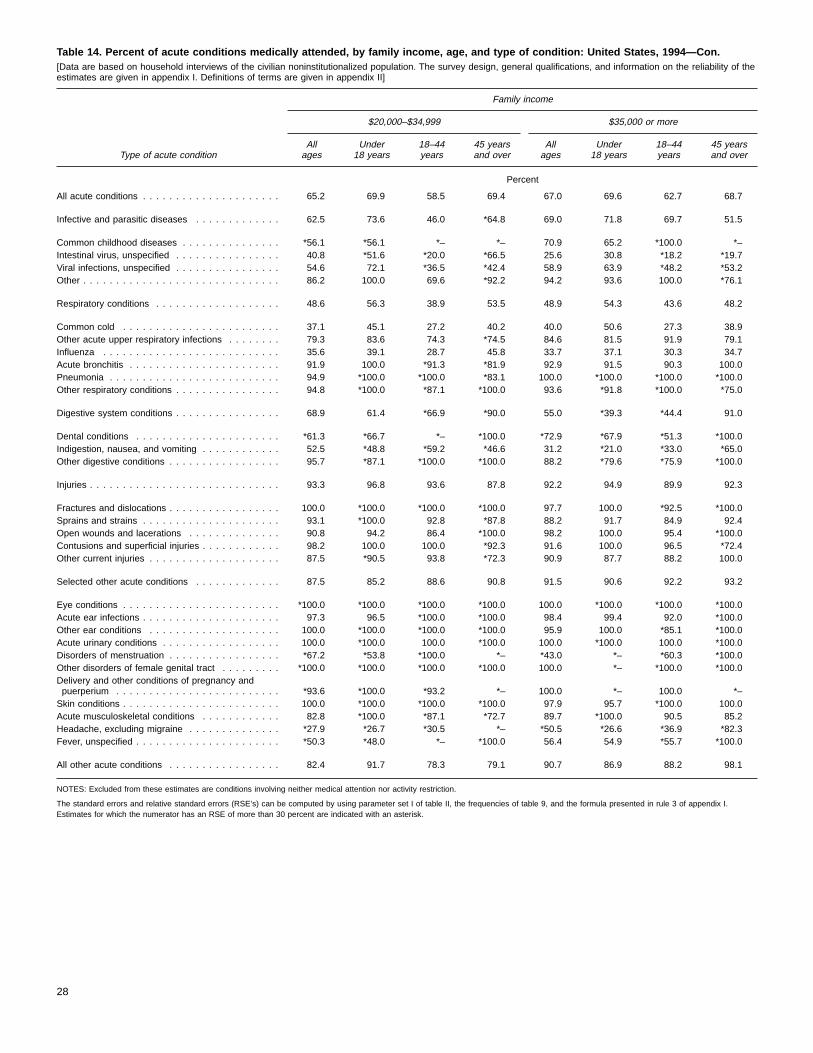
Table 14. Percent of acute conditions medically attended, by family income, age, and type of condition: United States, 1994—Con.[Data are based on household interviews of the civilian noninstitutionalized population. The survey design, general qualifications, and information on the reliability of theestimates are given in appendix I. Definitions of terms are given in appendix II]
Type of acute condition
Family income
$20,000–$34,999 $35,000 or more
Allages
Under18 years
18–44years
45 yearsand over
Allages
Under18 years
18–44years
45 yearsand over
Percent
All acute conditions . . . . . . . . . . . . . . . . . . . . . 65.2 69.9 58.5 69.4 67.0 69.6 62.7 68.7
Infective and parasitic diseases . . . . . . . . . . . . . 62.5 73.6 46.0 *64.8 69.0 71.8 69.7 51.5
Common childhood diseases . . . . . . . . . . . . . . . *56.1 *56.1 *– *– 70.9 65.2 *100.0 *–Intestinal virus, unspecified . . . . . . . . . . . . . . . . 40.8 *51.6 *20.0 *66.5 25.6 30.8 *18.2 *19.7Viral infections, unspecified . . . . . . . . . . . . . . . . 54.6 72.1 *36.5 *42.4 58.9 63.9 *48.2 *53.2Other . . . . . . . . . . . . . . . . . . . . . . . . . . . . . . 86.2 100.0 69.6 *92.2 94.2 93.6 100.0 *76.1
Respiratory conditions . . . . . . . . . . . . . . . . . . . 48.6 56.3 38.9 53.5 48.9 54.3 43.6 48.2
Common cold . . . . . . . . . . . . . . . . . . . . . . . . 37.1 45.1 27.2 40.2 40.0 50.6 27.3 38.9Other acute upper respiratory infections . . . . . . . . 79.3 83.6 74.3 *74.5 84.6 81.5 91.9 79.1Influenza . . . . . . . . . . . . . . . . . . . . . . . . . . . 35.6 39.1 28.7 45.8 33.7 37.1 30.3 34.7Acute bronchitis . . . . . . . . . . . . . . . . . . . . . . . 91.9 100.0 *91.3 *81.9 92.9 91.5 90.3 100.0Pneumonia . . . . . . . . . . . . . . . . . . . . . . . . . . 94.9 *100.0 *100.0 *83.1 100.0 *100.0 *100.0 *100.0Other respiratory conditions . . . . . . . . . . . . . . . . 94.8 *100.0 *87.1 *100.0 93.6 *91.8 *100.0 *75.0
Digestive system conditions . . . . . . . . . . . . . . . . 68.9 61.4 *66.9 *90.0 55.0 *39.3 *44.4 91.0
Dental conditions . . . . . . . . . . . . . . . . . . . . . . *61.3 *66.7 *– *100.0 *72.9 *67.9 *51.3 *100.0Indigestion, nausea, and vomiting . . . . . . . . . . . . 52.5 *48.8 *59.2 *46.6 31.2 *21.0 *33.0 *65.0Other digestive conditions . . . . . . . . . . . . . . . . . 95.7 *87.1 *100.0 *100.0 88.2 *79.6 *75.9 *100.0
Injuries . . . . . . . . . . . . . . . . . . . . . . . . . . . . . 93.3 96.8 93.6 87.8 92.2 94.9 89.9 92.3
Fractures and dislocations . . . . . . . . . . . . . . . . . 100.0 *100.0 *100.0 *100.0 97.7 100.0 *92.5 *100.0Sprains and strains . . . . . . . . . . . . . . . . . . . . . 93.1 *100.0 92.8 *87.8 88.2 91.7 84.9 92.4Open wounds and lacerations . . . . . . . . . . . . . . 90.8 94.2 86.4 *100.0 98.2 100.0 95.4 *100.0Contusions and superficial injuries . . . . . . . . . . . . 98.2 100.0 100.0 *92.3 91.6 100.0 96.5 *72.4Other current injuries . . . . . . . . . . . . . . . . . . . . 87.5 *90.5 93.8 *72.3 90.9 87.7 88.2 100.0
Selected other acute conditions . . . . . . . . . . . . . 87.5 85.2 88.6 90.8 91.5 90.6 92.2 93.2
Eye conditions . . . . . . . . . . . . . . . . . . . . . . . . *100.0 *100.0 *100.0 *100.0 100.0 *100.0 *100.0 *100.0Acute ear infections . . . . . . . . . . . . . . . . . . . . . 97.3 96.5 *100.0 *100.0 98.4 99.4 92.0 *100.0Other ear conditions . . . . . . . . . . . . . . . . . . . . 100.0 *100.0 *100.0 *100.0 95.9 100.0 *85.1 *100.0Acute urinary conditions . . . . . . . . . . . . . . . . . . 100.0 *100.0 100.0 *100.0 100.0 *100.0 100.0 *100.0Disorders of menstruation . . . . . . . . . . . . . . . . . *67.2 *53.8 *100.0 *– *43.0 *– *60.3 *100.0Other disorders of female genital tract . . . . . . . . . *100.0 *100.0 *100.0 *100.0 100.0 *– *100.0 *100.0Delivery and other conditions of pregnancy andpuerperium . . . . . . . . . . . . . . . . . . . . . . . . . *93.6 *100.0 *93.2 *– 100.0 *– 100.0 *–Skin conditions . . . . . . . . . . . . . . . . . . . . . . . . 100.0 *100.0 *100.0 *100.0 97.9 95.7 *100.0 100.0Acute musculoskeletal conditions . . . . . . . . . . . . 82.8 *100.0 *87.1 *72.7 89.7 *100.0 90.5 85.2Headache, excluding migraine . . . . . . . . . . . . . . *27.9 *26.7 *30.5 *– *50.5 *26.6 *36.9 *82.3Fever, unspecified . . . . . . . . . . . . . . . . . . . . . . *50.3 *48.0 *– *100.0 56.4 54.9 *55.7 *100.0
All other acute conditions . . . . . . . . . . . . . . . . . 82.4 91.7 78.3 79.1 90.7 86.9 88.2 98.1
NOTES: Excluded from these estimates are conditions involving neither medical attention nor activity restriction.
The standard errors and relative standard errors (RSE’s) can be computed by using parameter set I of table II, the frequencies of table 9, and the formula presented in rule 3 of appendix I.Estimates for which the numerator has an RSE of more than 30 percent are indicated with an asterisk.
28
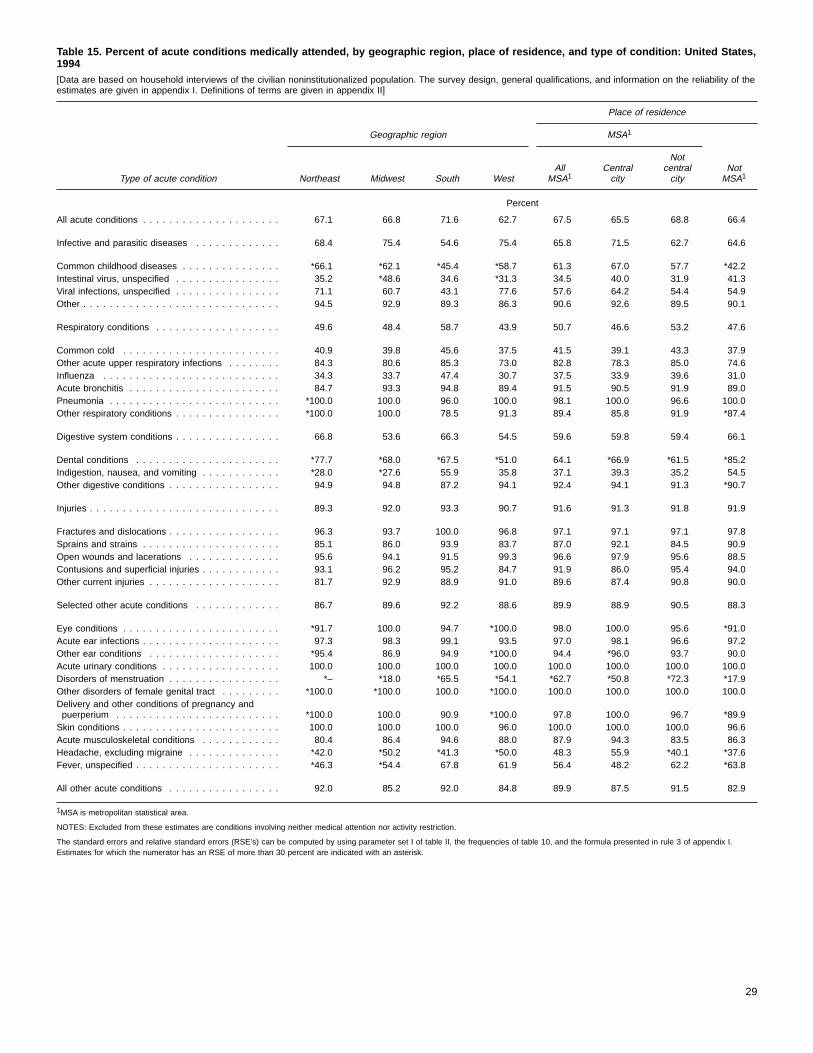
Table 15. Percent of acute conditions medically attended, by geographic region, place of residence, and type of condition: United States,1994[Data are based on household interviews of the civilian noninstitutionalized population. The survey design, general qualifications, and information on the reliability of theestimates are given in appendix I. Definitions of terms are given in appendix II]
Type of acute condition
Place of residence
Geographic region MSA1
Northeast Midwest South WestAll
MSA1Centralcity
Notcentralcity
NotMSA1
Percent
All acute conditions . . . . . . . . . . . . . . . . . . . . . 67.1 66.8 71.6 62.7 67.5 65.5 68.8 66.4
Infective and parasitic diseases . . . . . . . . . . . . . 68.4 75.4 54.6 75.4 65.8 71.5 62.7 64.6
Common childhood diseases . . . . . . . . . . . . . . . *66.1 *62.1 *45.4 *58.7 61.3 67.0 57.7 *42.2Intestinal virus, unspecified . . . . . . . . . . . . . . . . 35.2 *48.6 34.6 *31.3 34.5 40.0 31.9 41.3Viral infections, unspecified . . . . . . . . . . . . . . . . 71.1 60.7 43.1 77.6 57.6 64.2 54.4 54.9Other . . . . . . . . . . . . . . . . . . . . . . . . . . . . . . 94.5 92.9 89.3 86.3 90.6 92.6 89.5 90.1
Respiratory conditions . . . . . . . . . . . . . . . . . . . 49.6 48.4 58.7 43.9 50.7 46.6 53.2 47.6
Common cold . . . . . . . . . . . . . . . . . . . . . . . . 40.9 39.8 45.6 37.5 41.5 39.1 43.3 37.9Other acute upper respiratory infections . . . . . . . . 84.3 80.6 85.3 73.0 82.8 78.3 85.0 74.6Influenza . . . . . . . . . . . . . . . . . . . . . . . . . . . 34.3 33.7 47.4 30.7 37.5 33.9 39.6 31.0Acute bronchitis . . . . . . . . . . . . . . . . . . . . . . . 84.7 93.3 94.8 89.4 91.5 90.5 91.9 89.0Pneumonia . . . . . . . . . . . . . . . . . . . . . . . . . . *100.0 100.0 96.0 100.0 98.1 100.0 96.6 100.0Other respiratory conditions . . . . . . . . . . . . . . . . *100.0 100.0 78.5 91.3 89.4 85.8 91.9 *87.4
Digestive system conditions . . . . . . . . . . . . . . . . 66.8 53.6 66.3 54.5 59.6 59.8 59.4 66.1
Dental conditions . . . . . . . . . . . . . . . . . . . . . . *77.7 *68.0 *67.5 *51.0 64.1 *66.9 *61.5 *85.2Indigestion, nausea, and vomiting . . . . . . . . . . . . *28.0 *27.6 55.9 35.8 37.1 39.3 35.2 54.5Other digestive conditions . . . . . . . . . . . . . . . . . 94.9 94.8 87.2 94.1 92.4 94.1 91.3 *90.7
Injuries . . . . . . . . . . . . . . . . . . . . . . . . . . . . . 89.3 92.0 93.3 90.7 91.6 91.3 91.8 91.9
Fractures and dislocations . . . . . . . . . . . . . . . . . 96.3 93.7 100.0 96.8 97.1 97.1 97.1 97.8Sprains and strains . . . . . . . . . . . . . . . . . . . . . 85.1 86.0 93.9 83.7 87.0 92.1 84.5 90.9Open wounds and lacerations . . . . . . . . . . . . . . 95.6 94.1 91.5 99.3 96.6 97.9 95.6 88.5Contusions and superficial injuries . . . . . . . . . . . . 93.1 96.2 95.2 84.7 91.9 86.0 95.4 94.0Other current injuries . . . . . . . . . . . . . . . . . . . . 81.7 92.9 88.9 91.0 89.6 87.4 90.8 90.0
Selected other acute conditions . . . . . . . . . . . . . 86.7 89.6 92.2 88.6 89.9 88.9 90.5 88.3
Eye conditions . . . . . . . . . . . . . . . . . . . . . . . . *91.7 100.0 94.7 *100.0 98.0 100.0 95.6 *91.0Acute ear infections . . . . . . . . . . . . . . . . . . . . . 97.3 98.3 99.1 93.5 97.0 98.1 96.6 97.2Other ear conditions . . . . . . . . . . . . . . . . . . . . *95.4 86.9 94.9 *100.0 94.4 *96.0 93.7 90.0Acute urinary conditions . . . . . . . . . . . . . . . . . . 100.0 100.0 100.0 100.0 100.0 100.0 100.0 100.0Disorders of menstruation . . . . . . . . . . . . . . . . . *– *18.0 *65.5 *54.1 *62.7 *50.8 *72.3 *17.9Other disorders of female genital tract . . . . . . . . . *100.0 *100.0 100.0 *100.0 100.0 100.0 100.0 100.0Delivery and other conditions of pregnancy andpuerperium . . . . . . . . . . . . . . . . . . . . . . . . . *100.0 100.0 90.9 *100.0 97.8 100.0 96.7 *89.9Skin conditions . . . . . . . . . . . . . . . . . . . . . . . . 100.0 100.0 100.0 96.0 100.0 100.0 100.0 96.6Acute musculoskeletal conditions . . . . . . . . . . . . 80.4 86.4 94.6 88.0 87.9 94.3 83.5 86.3Headache, excluding migraine . . . . . . . . . . . . . . *42.0 *50.2 *41.3 *50.0 48.3 55.9 *40.1 *37.6Fever, unspecified . . . . . . . . . . . . . . . . . . . . . . *46.3 *54.4 67.8 61.9 56.4 48.2 62.2 *63.8
All other acute conditions . . . . . . . . . . . . . . . . . 92.0 85.2 92.0 84.8 89.9 87.5 91.5 82.9
1MSA is metropolitan statistical area.
NOTES: Excluded from these estimates are conditions involving neither medical attention nor activity restriction.
The standard errors and relative standard errors (RSE’s) can be computed by using parameter set I of table II, the frequencies of table 10, and the formula presented in rule 3 of appendix I.Estimates for which the numerator has an RSE of more than 30 percent are indicated with an asterisk.
29

Table 16. Number of restricted-activity days associated with acute conditions per 100 persons per year, by age and type of condition:United States, 1994[Data are based on household interviews of the civilian noninstitutionalized population. The survey design, general qualifications, and information on the reliability of theestimates are given in appendix I. Definitions of terms are given in appendix II]
Type of acute condition
45 years and over
Allages
Under5 years
5–17years
18–24years
25–44years Total
45–64years
65 yearsand over
Number of restricted-activity days per 100 persons per year
All acute conditions . . . . . . . . . . . . . . . . . . . . . 693.3 876.3 632.6 639.1 663.9 731.0 629.9 895.3
Infective and parasitic diseases . . . . . . . . . . . . . 71.8 199.4 136.2 53.2 45.2 33.5 28.0 42.5
Common childhood diseases . . . . . . . . . . . . . . . 13.1 61.1 32.6 *7.8 *4.0 *– *– *–Intestinal virus, unspecified . . . . . . . . . . . . . . . . 10.1 *22.8 18.3 *6.6 8.9 *4.3 *5.6 *2.2Viral infections, unspecified . . . . . . . . . . . . . . . . 20.2 63.3 29.7 *16.8 11.7 13.3 *10.3 *18.1Other . . . . . . . . . . . . . . . . . . . . . . . . . . . . . . 28.4 52.2 55.6 *22.0 20.6 15.9 12.0 22.2
Respiratory conditions . . . . . . . . . . . . . . . . . . . 272.5 389.2 284.1 233.3 251.7 269.4 231.1 331.7
Common cold . . . . . . . . . . . . . . . . . . . . . . . . 61.8 135.6 62.3 67.8 50.8 52.3 47.2 60.7Other acute upper respiratory infections . . . . . . . . 28.8 41.6 42.9 29.1 26.1 19.8 18.2 22.2Influenza . . . . . . . . . . . . . . . . . . . . . . . . . . . 121.5 109.3 134.4 104.9 130.5 112.7 105.5 124.3Acute bronchitis . . . . . . . . . . . . . . . . . . . . . . . 25.9 41.3 27.7 *16.6 21.1 28.6 29.2 27.6Pneumonia . . . . . . . . . . . . . . . . . . . . . . . . . . 24.8 39.5 *11.4 *11.1 15.7 42.6 24.9 71.3Other respiratory conditions . . . . . . . . . . . . . . . . 9.7 *22.1 *5.4 *3.7 7.4 13.5 *6.2 25.5
Digestive system conditions . . . . . . . . . . . . . . . . 26.1 *18.1 18.5 29.9 20.3 37.3 36.6 38.4
Dental conditions . . . . . . . . . . . . . . . . . . . . . . 4.7 *6.9 *3.3 *6.3 *5.7 *3.6 *3.9 *3.0Indigestion, nausea, and vomiting . . . . . . . . . . . . 6.3 *7.3 *9.3 *10.8 *4.4 *4.9 *3.2 *7.7Other digestive conditions . . . . . . . . . . . . . . . . . 15.0 *4.0 *5.9 *12.8 10.2 28.9 29.6 27.7
Injuries . . . . . . . . . . . . . . . . . . . . . . . . . . . . . 168.6 *26.5 100.7 171.0 203.2 209.7 186.6 247.4
Fractures and dislocations . . . . . . . . . . . . . . . . . 52.7 *2.7 47.4 30.6 44.5 83.7 63.7 116.3Sprains and strains . . . . . . . . . . . . . . . . . . . . . 44.3 *2.8 17.4 79.9 62.3 41.7 43.3 39.2Open wounds and lacerations . . . . . . . . . . . . . . 13.5 *5.1 14.0 *16.4 21.8 *5.9 *2.2 *12.0Contusions and superficial injuries . . . . . . . . . . . . 18.7 *0.5 *10.9 *7.9 21.6 28.4 27.4 30.1Other current injuries . . . . . . . . . . . . . . . . . . . . 39.4 *15.4 *11.0 36.1 53.0 49.9 50.0 49.8
Selected other acute conditions . . . . . . . . . . . . . 97.7 191.7 71.5 114.0 92.1 90.6 76.3 113.8
Eye conditions . . . . . . . . . . . . . . . . . . . . . . . . 2.5 *1.9 *0.3 *– *2.1 *5.2 *3.2 *8.5Acute ear infections . . . . . . . . . . . . . . . . . . . . . 18.8 137.0 24.1 *7.2 *4.0 *4.3 *5.6 *2.4Other ear conditions . . . . . . . . . . . . . . . . . . . . 2.4 *9.8 *2.3 *0.5 *2.9 *0.6 *0.1 *1.3Acute urinary conditions . . . . . . . . . . . . . . . . . . 11.6 *4.7 *3.2 *16.0 8.2 20.4 12.9 32.6Disorders of menstruation . . . . . . . . . . . . . . . . . *0.9 . . . *2.4 *1.0 *1.0 *0.0 *0.1 *–Other disorders of female genital tract . . . . . . . . . 4.9 *– *2.5 *12.6 8.2 *1.9 *3.0 *–Delivery and other conditions of pregnancy andpuerperium . . . . . . . . . . . . . . . . . . . . . . . . . 17.2 . . . 17.6 48.5 28.6 *– *– . . .Skin conditions . . . . . . . . . . . . . . . . . . . . . . . . 4.4 *7.2 *2.3 *4.5 *1.1 8.4 *5.0 *14.0Acute musculoskeletal conditions . . . . . . . . . . . . 27.3 *– *4.2 *17.2 31.8 46.7 43.2 52.4Headache, excluding migraine . . . . . . . . . . . . . . 3.1 *– *5.7 *5.1 *3.5 *1.4 *2.0 *0.4Fever, unspecified . . . . . . . . . . . . . . . . . . . . . . 4.7 31.1 *6.9 *1.4 *0.8 *1.7 *1.3 *2.4
All other acute conditions . . . . . . . . . . . . . . . . . 56.6 51.5 21.6 37.7 51.4 90.4 71.3 121.6
NOTES: The standard errors and relative standard errors (RSE’s) can be computed by using parameter set II of table II, the frequencies of table 21, and the formula presented in rule 2 ofappendix I. Estimates for which the numerator has an RSE of more than 30 percent are indicated with an asterisk.
30

Table 17. Number of restricted-activity days associated with acute conditions per 100 persons per year, by sex, age, and type ofcondition: United States, 1994[Data are based on household interviews of the civilian noninstitutionalized population. The survey design, general qualifications, and information on the reliability of theestimates are given in appendix I. Definitions of terms are given in appendix II]
Type of acute condition
Male Female
Allages
Under5 years
5–17years
18–44years
45 yearsand over
Allages
Under5 years
5–17years
18–44years
45 yearsand over
Number of restricted-activity days per 100 persons per year
All acute conditions . . . . . . . . . . . . . . . . . . . . . 594.7 856.2 586.3 566.8 567.0 787.0 897.4 681.1 747.1 869.5
Infective and parasitic diseases . . . . . . . . . . . . . 66.1 196.3 115.6 40.9 32.0 77.2 202.5 157.8 53.0 34.7
Common childhood diseases . . . . . . . . . . . . . . . 12.1 58.4 25.6 *5.1 *– 13.9 63.9 39.8 *4.6 *–Intestinal virus, unspecified . . . . . . . . . . . . . . . . 9.5 *23.4 *17.3 *8.4 *2.1 10.7 *22.2 *19.4 *8.3 *6.2Viral infections, unspecified . . . . . . . . . . . . . . . . 17.1 *55.4 25.4 13.3 *6.1 23.1 71.5 34.3 12.5 19.3Other . . . . . . . . . . . . . . . . . . . . . . . . . . . . . . 27.3 59.1 47.3 14.1 23.8 29.5 *44.9 64.2 27.6 *9.2
Respiratory conditions . . . . . . . . . . . . . . . . . . . 243.8 380.3 279.7 211.0 227.9 299.8 398.6 288.7 282.8 304.5
Common cold . . . . . . . . . . . . . . . . . . . . . . . . 53.5 123.0 60.2 42.7 44.8 69.7 148.8 64.5 66.5 58.7Other acute upper respiratory infections . . . . . . . . 22.5 *50.3 33.5 20.3 *10.2 34.9 *32.4 52.8 33.1 27.8Influenza . . . . . . . . . . . . . . . . . . . . . . . . . . . 114.7 115.4 128.5 117.5 101.3 127.9 102.9 140.6 131.4 122.3Acute bronchitis . . . . . . . . . . . . . . . . . . . . . . . 21.3 *28.5 36.2 15.5 17.6 30.2 *54.6 *18.7 24.6 37.9Pneumonia . . . . . . . . . . . . . . . . . . . . . . . . . . 24.6 *46.5 *14.9 *8.7 47.9 24.9 *32.1 *7.8 20.5 38.1Other respiratory conditions . . . . . . . . . . . . . . . . 7.2 *16.6 *6.5 *6.3 *6.1 12.2 *27.8 *4.3 *6.8 19.8
Digestive system conditions . . . . . . . . . . . . . . . . 19.6 *17.1 *14.8 15.8 28.9 32.2 *19.2 *22.3 29.2 44.4
Dental conditions . . . . . . . . . . . . . . . . . . . . . . 5.2 *8.6 *2.9 *6.0 *4.7 *4.2 *5.1 *3.6 *5.6 *2.6Indigestion, nausea, and vomiting . . . . . . . . . . . . *4.4 *2.6 *8.4 *3.8 *3.0 8.2 *12.2 *10.2 *8.0 *6.5Other digestive conditions . . . . . . . . . . . . . . . . . 10.0 *5.9 *3.5 *6.0 21.2 19.8 *2.0 *8.6 15.6 35.3
Injuries . . . . . . . . . . . . . . . . . . . . . . . . . . . . . 169.0 *41.2 112.5 233.5 150.9 168.2 *11.1 88.3 158.8 259.4
Fractures and dislocations . . . . . . . . . . . . . . . . . 53.3 *3.0 63.1 58.1 53.8 52.2 *2.4 30.9 24.9 109.0Sprains and strains . . . . . . . . . . . . . . . . . . . . . 42.9 *5.4 *9.6 70.5 36.5 45.6 *– 25.6 62.3 46.1Open wounds and lacerations . . . . . . . . . . . . . . 18.5 *9.0 *18.2 30.3 *4.4 8.8 *1.1 *9.7 11.1 *7.3Contusions and superficial injuries . . . . . . . . . . . . 16.3 *1.0 *7.8 23.5 16.1 21.0 *– *14.1 13.4 38.8Other current injuries . . . . . . . . . . . . . . . . . . . . 38.1 *22.8 *13.8 51.1 40.2 40.7 *7.6 *8.0 47.1 58.1
Selected other acute conditions . . . . . . . . . . . . . 58.2 174.6 50.5 36.5 61.7 135.3 209.5 93.6 156.5 115.0
Eye conditions . . . . . . . . . . . . . . . . . . . . . . . . *2.7 *3.7 *0.6 *0.9 *6.5 *2.3 *– *– *2.2 *4.2Acute ear infections . . . . . . . . . . . . . . . . . . . . . 15.4 106.7 23.8 *3.2 *1.4 22.0 168.6 *24.4 *6.3 *6.9Other ear conditions . . . . . . . . . . . . . . . . . . . . *2.2 *17.2 *1.7 *1.0 *0.2 *2.5 *2.0 *3.0 *3.6 *0.9Acute urinary conditions . . . . . . . . . . . . . . . . . . 6.3 *6.8 *1.7 *2.8 *14.5 16.5 *2.4 *4.8 17.1 25.4Disorders of menstruation . . . . . . . . . . . . . . . . . . . . . . . . . . . . . . . . *1.7 . . . *4.9 *1.9 *0.1Other disorders of female genital tract . . . . . . . . . . . . . . . . . . . . . . . . 9.6 *– *5.1 18.2 *3.5Delivery and other conditions of pregnancyand puerperium . . . . . . . . . . . . . . . . . . . . . . . . . . . . . . . . . . . . . 33.6 . . . 36.0 65.7 *–Skin conditions . . . . . . . . . . . . . . . . . . . . . . . . 5.1 *10.5 *3.3 *2.0 *9.4 *3.8 *3.8 *1.4 *1.8 *7.6Acute musculoskeletal conditions . . . . . . . . . . . . 19.7 *– *5.9 23.1 29.8 34.5 *– *2.4 33.6 61.0Headache, excluding migraine . . . . . . . . . . . . . . *2.4 *– *5.8 *2.8 *0.1 *3.8 *– *5.6 *4.9 *2.4Fever, unspecified . . . . . . . . . . . . . . . . . . . . . . *4.3 *29.6 *7.6 *0.7 *– 5.1 *32.6 *6.1 *1.3 *3.1
All other acute conditions . . . . . . . . . . . . . . . . . 38.1 *46.6 *13.2 29.1 65.5 74.3 *56.6 30.4 66.8 111.5
NOTES: The standard errors and relative standard errors (RSE’s) can be computed by using parameter set II of table II, the frequencies of table 22, and the formula presented in rule 2 ofappendix I. Estimates for which the numerator has an RSE of more than 30 percent are indicated with an asterisk.
31

Table 18. Number of restricted-activity days associated with acute conditions per 100 persons per year, by race, age, and type ofcondition: United States, 1994[Data are based on household interviews of the civilian noninstitutionalized population. The survey design, general qualifications, and information on the reliability of theestimates are given in appendix I. Definitions of terms are given in appendix II]
Type of acute condition
White Black
Allages
Under18 years
18–44years
45 yearsand over
Allages
Under18 years
18–44years
45 yearsand over
Number of restricted-activity days per 100 persons per year
All acute conditions . . . . . . . . . . . . . . . . . . . . . 707.7 749.2 668.3 724.4 656.6 518.0 687.6 804.3
Infective and parasitic diseases . . . . . . . . . . . . . 72.3 168.1 47.5 28.7 84.5 121.5 54.5 84.8
Common childhood diseases . . . . . . . . . . . . . . . 12.9 42.3 *4.8 *– 18.4 *44.9 *7.2 *–Intestinal virus, unspecified . . . . . . . . . . . . . . . . 9.2 19.2 7.9 *2.9 18.3 *26.5 *11.3 *19.1Viral infections, unspecified . . . . . . . . . . . . . . . . 19.3 41.8 12.5 10.4 29.0 *30.1 *19.2 *45.3Other . . . . . . . . . . . . . . . . . . . . . . . . . . . . . . 31.0 64.9 22.3 15.4 18.8 *20.1 *16.9 *20.4
Respiratory conditions . . . . . . . . . . . . . . . . . . . 276.8 334.2 251.5 263.6 234.5 206.1 234.1 277.1
Common cold . . . . . . . . . . . . . . . . . . . . . . . . 59.2 79.7 52.9 51.1 68.8 81.6 64.6 *57.7Other acute upper respiratory infections . . . . . . . . 29.7 47.4 27.7 18.5 20.5 *17.5 *20.0 *25.8Influenza . . . . . . . . . . . . . . . . . . . . . . . . . . . 124.5 141.7 126.3 108.9 103.5 *52.6 131.5 127.1Acute bronchitis . . . . . . . . . . . . . . . . . . . . . . . 27.9 35.9 23.5 27.1 *11.5 *16.8 *4.2 *17.0Pneumonia . . . . . . . . . . . . . . . . . . . . . . . . . . 27.3 21.4 15.9 46.0 *14.9 *16.7 *12.6 *16.3Other respiratory conditions . . . . . . . . . . . . . . . . 8.2 *8.2 *5.1 12.0 *15.3 *20.8 *1.2 *33.2
Digestive system conditions . . . . . . . . . . . . . . . . 25.3 17.0 20.7 37.5 32.4 *26.5 *37.9 *31.0
Dental conditions . . . . . . . . . . . . . . . . . . . . . . 4.2 *2.8 *5.5 *3.6 *8.6 *13.3 *7.1 *4.4Indigestion, nausea, and vomiting . . . . . . . . . . . . 5.6 *8.7 *4.9 *4.1 *10.7 *10.5 *12.0 *8.4Other digestive conditions . . . . . . . . . . . . . . . . . 15.5 *5.5 10.3 29.8 *13.2 *2.7 *18.9 *18.2
Injuries . . . . . . . . . . . . . . . . . . . . . . . . . . . . . 178.4 91.6 205.4 212.6 137.2 *30.9 180.0 215.5
Fractures and dislocations . . . . . . . . . . . . . . . . . 60.0 42.4 48.3 88.1 19.3 *4.7 *7.6 *62.6Sprains and strains . . . . . . . . . . . . . . . . . . . . . 44.7 15.1 65.5 42.0 47.7 *4.4 86.2 *40.9Open wounds and lacerations . . . . . . . . . . . . . . 14.1 *10.8 23.9 *4.5 *9.2 *12.2 *5.3 *12.0Contusions and superficial injuries . . . . . . . . . . . . 18.7 *8.8 18.2 27.0 21.6 *5.8 *18.2 *51.3Other current injuries . . . . . . . . . . . . . . . . . . . . 41.0 14.6 49.4 50.9 39.3 *3.8 62.7 *48.8
Selected other acute conditions . . . . . . . . . . . . . 97.3 107.3 98.0 88.7 103.9 99.0 107.0 105.6
Eye conditions . . . . . . . . . . . . . . . . . . . . . . . . *2.5 *0.7 *0.8 *6.0 *3.7 *1.4 *7.4 *–Acute ear infections . . . . . . . . . . . . . . . . . . . . . 19.7 61.1 *5.7 *4.9 18.6 *53.0 *1.0 *0.1Other ear conditions . . . . . . . . . . . . . . . . . . . . *2.8 *5.6 *2.7 *0.6 *0.6 *0.6 *0.9 *–Acute urinary conditions . . . . . . . . . . . . . . . . . . 12.2 *4.6 10.5 20.2 *9.4 *– *9.9 *22.4Disorders of menstruation . . . . . . . . . . . . . . . . . *0.6 *0.8 *0.9 *– *3.2 *6.7 *1.9 *0.5Other disorders of female genital tract . . . . . . . . . 4.2 *2.2 8.8 *– *6.5 *– *6.3 *16.7Delivery and other conditions of pregnancy andpuerperium . . . . . . . . . . . . . . . . . . . . . . . . . 15.3 *6.5 33.1 *– 24.6 *22.1 *40.0 *–Skin conditions . . . . . . . . . . . . . . . . . . . . . . . . 4.4 *3.7 *1.8 *8.0 *1.4 *0.8 *– *4.7Acute musculoskeletal conditions . . . . . . . . . . . . 28.2 *3.8 29.1 46.2 28.0 *– *35.5 *55.3Headache, excluding migraine . . . . . . . . . . . . . . 2.9 *4.2 *3.8 *0.8 *3.6 *1.8 *3.7 *6.0Fever, unspecified . . . . . . . . . . . . . . . . . . . . . . 4.6 14.1 *0.9 *2.0 *4.5 *12.6 *0.4 *–
All other acute conditions . . . . . . . . . . . . . . . . . 57.4 31.0 45.2 93.3 64.1 *34.0 74.1 90.2
NOTES: The standard errors and relative standard errors (RSE’s) can be computed by using parameter set II of table II, the frequencies of table 23, and the formula presented in rule 2 ofappendix I. Estimates for which the numerator has an RSE of more than 30 percent are indicated with an asterisk.
32
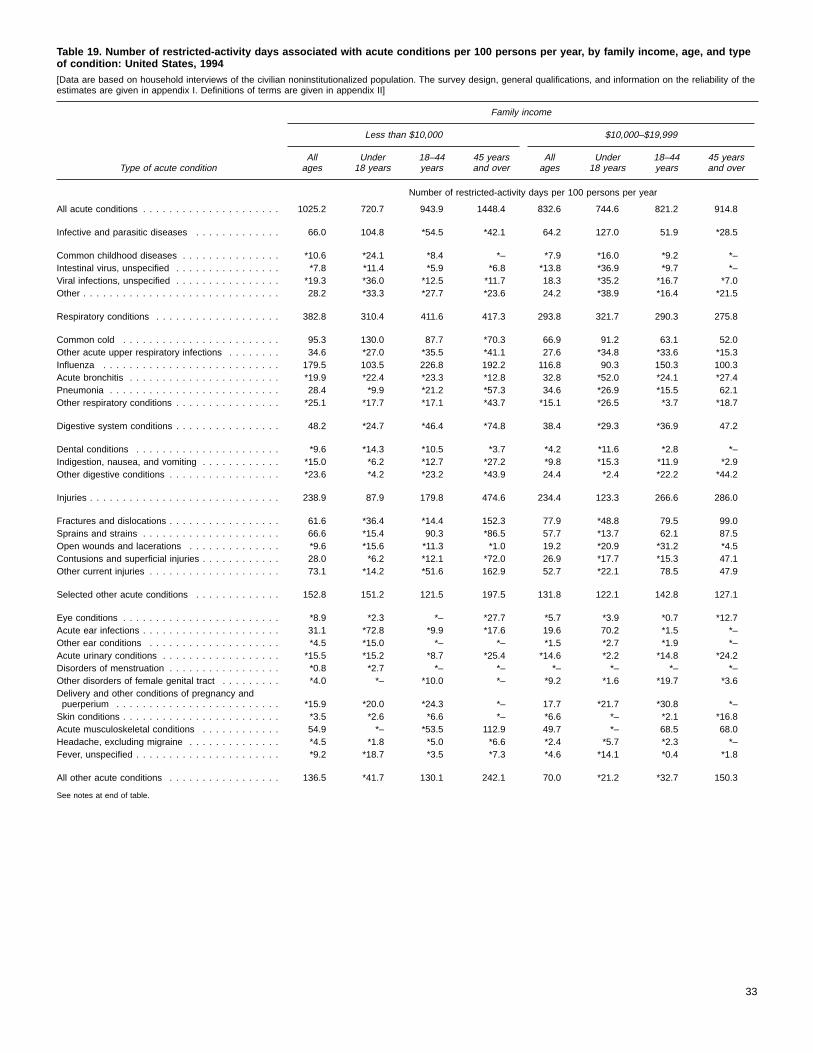
Table 19. Number of restricted-activity days associated with acute conditions per 100 persons per year, by family income, age, and typeof condition: United States, 1994[Data are based on household interviews of the civilian noninstitutionalized population. The survey design, general qualifications, and information on the reliability of theestimates are given in appendix I. Definitions of terms are given in appendix II]
Type of acute condition
Family income
Less than $10,000 $10,000–$19,999
Allages
Under18 years
18–44years
45 yearsand over
Allages
Under18 years
18–44years
45 yearsand over
Number of restricted-activity days per 100 persons per year
All acute conditions . . . . . . . . . . . . . . . . . . . . . 1025.2 720.7 943.9 1448.4 832.6 744.6 821.2 914.8
Infective and parasitic diseases . . . . . . . . . . . . . 66.0 104.8 *54.5 *42.1 64.2 127.0 51.9 *28.5
Common childhood diseases . . . . . . . . . . . . . . . *10.6 *24.1 *8.4 *– *7.9 *16.0 *9.2 *–Intestinal virus, unspecified . . . . . . . . . . . . . . . . *7.8 *11.4 *5.9 *6.8 *13.8 *36.9 *9.7 *–Viral infections, unspecified . . . . . . . . . . . . . . . . *19.3 *36.0 *12.5 *11.7 18.3 *35.2 *16.7 *7.0Other . . . . . . . . . . . . . . . . . . . . . . . . . . . . . . 28.2 *33.3 *27.7 *23.6 24.2 *38.9 *16.4 *21.5
Respiratory conditions . . . . . . . . . . . . . . . . . . . 382.8 310.4 411.6 417.3 293.8 321.7 290.3 275.8
Common cold . . . . . . . . . . . . . . . . . . . . . . . . 95.3 130.0 87.7 *70.3 66.9 91.2 63.1 52.0Other acute upper respiratory infections . . . . . . . . 34.6 *27.0 *35.5 *41.1 27.6 *34.8 *33.6 *15.3Influenza . . . . . . . . . . . . . . . . . . . . . . . . . . . 179.5 103.5 226.8 192.2 116.8 90.3 150.3 100.3Acute bronchitis . . . . . . . . . . . . . . . . . . . . . . . *19.9 *22.4 *23.3 *12.8 32.8 *52.0 *24.1 *27.4Pneumonia . . . . . . . . . . . . . . . . . . . . . . . . . . 28.4 *9.9 *21.2 *57.3 34.6 *26.9 *15.5 62.1Other respiratory conditions . . . . . . . . . . . . . . . . *25.1 *17.7 *17.1 *43.7 *15.1 *26.5 *3.7 *18.7
Digestive system conditions . . . . . . . . . . . . . . . . 48.2 *24.7 *46.4 *74.8 38.4 *29.3 *36.9 47.2
Dental conditions . . . . . . . . . . . . . . . . . . . . . . *9.6 *14.3 *10.5 *3.7 *4.2 *11.6 *2.8 *–Indigestion, nausea, and vomiting . . . . . . . . . . . . *15.0 *6.2 *12.7 *27.2 *9.8 *15.3 *11.9 *2.9Other digestive conditions . . . . . . . . . . . . . . . . . *23.6 *4.2 *23.2 *43.9 24.4 *2.4 *22.2 *44.2
Injuries . . . . . . . . . . . . . . . . . . . . . . . . . . . . . 238.9 87.9 179.8 474.6 234.4 123.3 266.6 286.0
Fractures and dislocations . . . . . . . . . . . . . . . . . 61.6 *36.4 *14.4 152.3 77.9 *48.8 79.5 99.0Sprains and strains . . . . . . . . . . . . . . . . . . . . . 66.6 *15.4 90.3 *86.5 57.7 *13.7 62.1 87.5Open wounds and lacerations . . . . . . . . . . . . . . *9.6 *15.6 *11.3 *1.0 19.2 *20.9 *31.2 *4.5Contusions and superficial injuries . . . . . . . . . . . . 28.0 *6.2 *12.1 *72.0 26.9 *17.7 *15.3 47.1Other current injuries . . . . . . . . . . . . . . . . . . . . 73.1 *14.2 *51.6 162.9 52.7 *22.1 78.5 47.9
Selected other acute conditions . . . . . . . . . . . . . 152.8 151.2 121.5 197.5 131.8 122.1 142.8 127.1
Eye conditions . . . . . . . . . . . . . . . . . . . . . . . . *8.9 *2.3 *– *27.7 *5.7 *3.9 *0.7 *12.7Acute ear infections . . . . . . . . . . . . . . . . . . . . . 31.1 *72.8 *9.9 *17.6 19.6 70.2 *1.5 *–Other ear conditions . . . . . . . . . . . . . . . . . . . . *4.5 *15.0 *– *– *1.5 *2.7 *1.9 *–Acute urinary conditions . . . . . . . . . . . . . . . . . . *15.5 *15.2 *8.7 *25.4 *14.6 *2.2 *14.8 *24.2Disorders of menstruation . . . . . . . . . . . . . . . . . *0.8 *2.7 *– *– *– *– *– *–Other disorders of female genital tract . . . . . . . . . *4.0 *– *10.0 *– *9.2 *1.6 *19.7 *3.6Delivery and other conditions of pregnancy andpuerperium . . . . . . . . . . . . . . . . . . . . . . . . . *15.9 *20.0 *24.3 *– 17.7 *21.7 *30.8 *–Skin conditions . . . . . . . . . . . . . . . . . . . . . . . . *3.5 *2.6 *6.6 *– *6.6 *– *2.1 *16.8Acute musculoskeletal conditions . . . . . . . . . . . . 54.9 *– *53.5 112.9 49.7 *– 68.5 68.0Headache, excluding migraine . . . . . . . . . . . . . . *4.5 *1.8 *5.0 *6.6 *2.4 *5.7 *2.3 *–Fever, unspecified . . . . . . . . . . . . . . . . . . . . . . *9.2 *18.7 *3.5 *7.3 *4.6 *14.1 *0.4 *1.8
All other acute conditions . . . . . . . . . . . . . . . . . 136.5 *41.7 130.1 242.1 70.0 *21.2 *32.7 150.3
See notes at end of table.
33
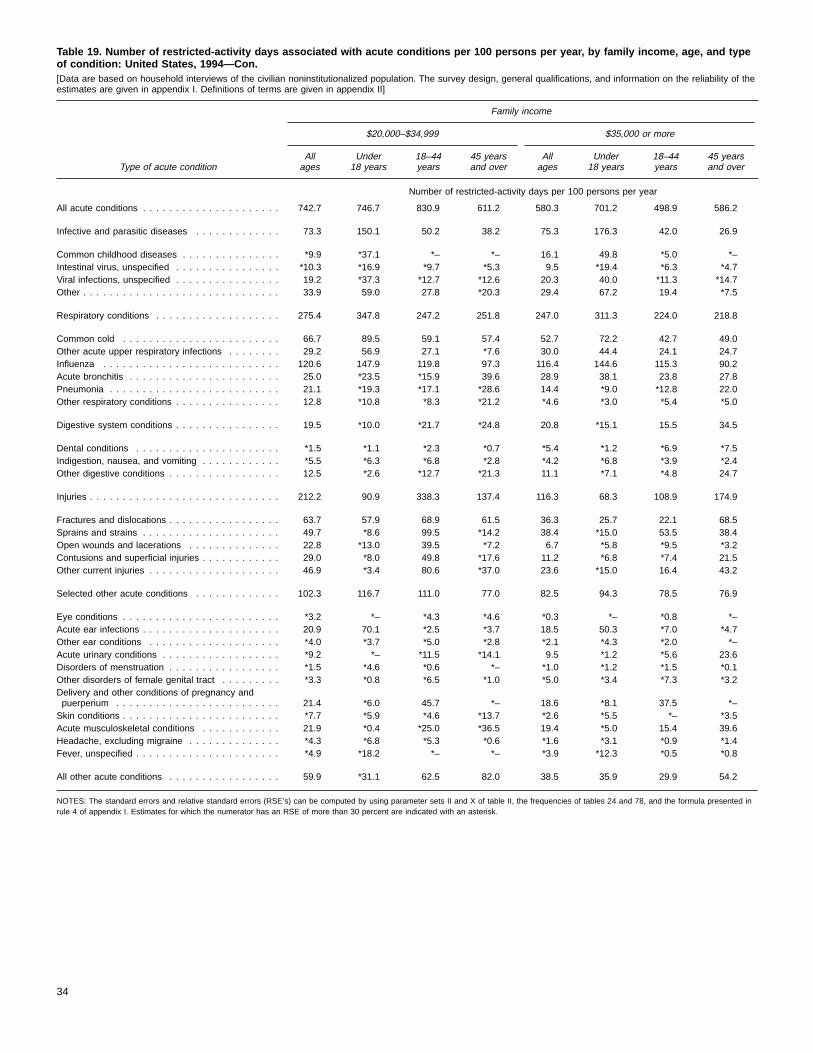
Table 19. Number of restricted-activity days associated with acute conditions per 100 persons per year, by family income, age, and typeof condition: United States, 1994—Con.[Data are based on household interviews of the civilian noninstitutionalized population. The survey design, general qualifications, and information on the reliability of theestimates are given in appendix I. Definitions of terms are given in appendix II]
Type of acute condition
Family income
$20,000–$34,999 $35,000 or more
Allages
Under18 years
18–44years
45 yearsand over
Allages
Under18 years
18–44years
45 yearsand over
Number of restricted-activity days per 100 persons per year
All acute conditions . . . . . . . . . . . . . . . . . . . . . 742.7 746.7 830.9 611.2 580.3 701.2 498.9 586.2
Infective and parasitic diseases . . . . . . . . . . . . . 73.3 150.1 50.2 38.2 75.3 176.3 42.0 26.9
Common childhood diseases . . . . . . . . . . . . . . . *9.9 *37.1 *– *– 16.1 49.8 *5.0 *–Intestinal virus, unspecified . . . . . . . . . . . . . . . . *10.3 *16.9 *9.7 *5.3 9.5 *19.4 *6.3 *4.7Viral infections, unspecified . . . . . . . . . . . . . . . . 19.2 *37.3 *12.7 *12.6 20.3 40.0 *11.3 *14.7Other . . . . . . . . . . . . . . . . . . . . . . . . . . . . . . 33.9 59.0 27.8 *20.3 29.4 67.2 19.4 *7.5
Respiratory conditions . . . . . . . . . . . . . . . . . . . 275.4 347.8 247.2 251.8 247.0 311.3 224.0 218.8
Common cold . . . . . . . . . . . . . . . . . . . . . . . . 66.7 89.5 59.1 57.4 52.7 72.2 42.7 49.0Other acute upper respiratory infections . . . . . . . . 29.2 56.9 27.1 *7.6 30.0 44.4 24.1 24.7Influenza . . . . . . . . . . . . . . . . . . . . . . . . . . . 120.6 147.9 119.8 97.3 116.4 144.6 115.3 90.2Acute bronchitis . . . . . . . . . . . . . . . . . . . . . . . 25.0 *23.5 *15.9 39.6 28.9 38.1 23.8 27.8Pneumonia . . . . . . . . . . . . . . . . . . . . . . . . . . 21.1 *19.3 *17.1 *28.6 14.4 *9.0 *12.8 22.0Other respiratory conditions . . . . . . . . . . . . . . . . 12.8 *10.8 *8.3 *21.2 *4.6 *3.0 *5.4 *5.0
Digestive system conditions . . . . . . . . . . . . . . . . 19.5 *10.0 *21.7 *24.8 20.8 *15.1 15.5 34.5
Dental conditions . . . . . . . . . . . . . . . . . . . . . . *1.5 *1.1 *2.3 *0.7 *5.4 *1.2 *6.9 *7.5Indigestion, nausea, and vomiting . . . . . . . . . . . . *5.5 *6.3 *6.8 *2.8 *4.2 *6.8 *3.9 *2.4Other digestive conditions . . . . . . . . . . . . . . . . . 12.5 *2.6 *12.7 *21.3 11.1 *7.1 *4.8 24.7
Injuries . . . . . . . . . . . . . . . . . . . . . . . . . . . . . 212.2 90.9 338.3 137.4 116.3 68.3 108.9 174.9
Fractures and dislocations . . . . . . . . . . . . . . . . . 63.7 57.9 68.9 61.5 36.3 25.7 22.1 68.5Sprains and strains . . . . . . . . . . . . . . . . . . . . . 49.7 *8.6 99.5 *14.2 38.4 *15.0 53.5 38.4Open wounds and lacerations . . . . . . . . . . . . . . 22.8 *13.0 39.5 *7.2 6.7 *5.8 *9.5 *3.2Contusions and superficial injuries . . . . . . . . . . . . 29.0 *8.0 49.8 *17.6 11.2 *6.8 *7.4 21.5Other current injuries . . . . . . . . . . . . . . . . . . . . 46.9 *3.4 80.6 *37.0 23.6 *15.0 16.4 43.2
Selected other acute conditions . . . . . . . . . . . . . 102.3 116.7 111.0 77.0 82.5 94.3 78.5 76.9
Eye conditions . . . . . . . . . . . . . . . . . . . . . . . . *3.2 *– *4.3 *4.6 *0.3 *– *0.8 *–Acute ear infections . . . . . . . . . . . . . . . . . . . . . 20.9 70.1 *2.5 *3.7 18.5 50.3 *7.0 *4.7Other ear conditions . . . . . . . . . . . . . . . . . . . . *4.0 *3.7 *5.0 *2.8 *2.1 *4.3 *2.0 *–Acute urinary conditions . . . . . . . . . . . . . . . . . . *9.2 *– *11.5 *14.1 9.5 *1.2 *5.6 23.6Disorders of menstruation . . . . . . . . . . . . . . . . . *1.5 *4.6 *0.6 *– *1.0 *1.2 *1.5 *0.1Other disorders of female genital tract . . . . . . . . . *3.3 *0.8 *6.5 *1.0 *5.0 *3.4 *7.3 *3.2Delivery and other conditions of pregnancy andpuerperium . . . . . . . . . . . . . . . . . . . . . . . . . 21.4 *6.0 45.7 *– 18.6 *8.1 37.5 *–Skin conditions . . . . . . . . . . . . . . . . . . . . . . . . *7.7 *5.9 *4.6 *13.7 *2.6 *5.5 *– *3.5Acute musculoskeletal conditions . . . . . . . . . . . . 21.9 *0.4 *25.0 *36.5 19.4 *5.0 15.4 39.6Headache, excluding migraine . . . . . . . . . . . . . . *4.3 *6.8 *5.3 *0.6 *1.6 *3.1 *0.9 *1.4Fever, unspecified . . . . . . . . . . . . . . . . . . . . . . *4.9 *18.2 *– *– *3.9 *12.3 *0.5 *0.8
All other acute conditions . . . . . . . . . . . . . . . . . 59.9 *31.1 62.5 82.0 38.5 35.9 29.9 54.2
NOTES: The standard errors and relative standard errors (RSE’s) can be computed by using parameter sets II and X of table II, the frequencies of tables 24 and 78, and the formula presented inrule 4 of appendix I. Estimates for which the numerator has an RSE of more than 30 percent are indicated with an asterisk.
34

Table 20. Number of restricted-activity days associated with acute conditions per 100 persons per year, by geographic region, place ofresidence, and type of condition: United States, 1994[Data are based on household interviews of the civilian noninstitutionalized population. The survey design, general qualifications, and information on the reliability of theestimates are given in appendix I. Definitions of terms are given in appendix II]
Type of acute condition
Place of residence
Geographic region MSA1
Northeast Midwest South WestAll
MSA1Centralcity
Notcentralcity
NotMSA1
Number of restricted-activity days per 100 persons per year
All acute conditions . . . . . . . . . . . . . . . . . . . . . 658.4 652.8 657.2 823.6 675.7 669.9 679.4 756.5
Infective and parasitic diseases . . . . . . . . . . . . . 83.6 57.3 75.6 71.6 73.2 59.8 81.8 67.0
Common childhood diseases . . . . . . . . . . . . . . . 19.8 *6.9 12.9 14.2 13.6 9.8 16.1 11.1Intestinal virus, unspecified . . . . . . . . . . . . . . . . 17.9 *6.1 12.4 *4.3 10.9 11.2 10.7 *7.5Viral infections, unspecified . . . . . . . . . . . . . . . . 18.5 15.4 25.7 18.5 20.4 17.8 22.1 19.4Other . . . . . . . . . . . . . . . . . . . . . . . . . . . . . . 27.5 28.9 24.6 34.7 28.3 21.1 32.9 29.1
Respiratory conditions . . . . . . . . . . . . . . . . . . . 246.1 278.7 212.2 380.9 274.3 274.8 273.9 266.1
Common cold . . . . . . . . . . . . . . . . . . . . . . . . 72.4 58.6 43.5 84.0 64.7 73.1 59.3 51.5Other acute upper respiratory infections . . . . . . . . 27.6 24.7 27.4 36.7 29.3 27.5 30.4 27.3Influenza . . . . . . . . . . . . . . . . . . . . . . . . . . . 80.0 132.9 100.2 177.8 121.6 116.6 124.8 121.1Acute bronchitis . . . . . . . . . . . . . . . . . . . . . . . 23.1 27.0 20.5 35.2 25.7 20.2 29.2 26.5Pneumonia . . . . . . . . . . . . . . . . . . . . . . . . . . 38.3 23.8 12.6 32.5 23.0 26.5 20.8 30.9Other respiratory conditions . . . . . . . . . . . . . . . . *4.8 11.7 7.9 14.7 10.0 10.9 9.4 *8.8
Digestive system conditions . . . . . . . . . . . . . . . . 24.9 19.5 30.2 27.9 24.4 31.8 19.6 32.0
Dental conditions . . . . . . . . . . . . . . . . . . . . . . *5.9 *2.4 *4.4 *6.6 5.5 *6.9 *4.6 *1.9Indigestion, nausea, and vomiting . . . . . . . . . . . . *3.3 *5.6 8.1 *7.2 6.5 *7.3 6.0 *5.7Other digestive conditions . . . . . . . . . . . . . . . . . 15.7 11.6 17.7 14.1 12.4 17.7 9.0 24.4
Injuries . . . . . . . . . . . . . . . . . . . . . . . . . . . . . 148.0 145.7 190.1 179.0 154.1 140.1 163.1 220.7
Fractures and dislocations . . . . . . . . . . . . . . . . . 55.2 46.6 57.8 49.4 46.0 37.3 51.6 76.7Sprains and strains . . . . . . . . . . . . . . . . . . . . . 42.0 38.7 45.5 50.6 43.1 39.6 45.3 48.6Open wounds and lacerations . . . . . . . . . . . . . . *10.6 11.5 16.0 14.4 11.8 13.9 10.4 19.6Contusions and superficial injuries . . . . . . . . . . . . 13.9 *8.7 26.7 21.6 16.0 14.5 16.9 28.5Other current injuries . . . . . . . . . . . . . . . . . . . . 26.4 40.1 44.0 43.1 37.2 34.8 38.8 47.3
Selected other acute conditions . . . . . . . . . . . . . 106.2 91.3 88.5 111.3 97.3 102.7 93.9 99.1
Eye conditions . . . . . . . . . . . . . . . . . . . . . . . . *5.1 *2.3 *2.3 *0.8 *2.3 *3.9 *1.3 *3.1Acute ear infections . . . . . . . . . . . . . . . . . . . . . 13.8 18.5 16.4 26.9 18.7 18.6 18.8 18.9Other ear conditions . . . . . . . . . . . . . . . . . . . . *1.0 *1.9 *4.0 *1.5 *2.0 *1.1 *2.6 *3.7Acute urinary conditions . . . . . . . . . . . . . . . . . . 12.4 12.0 13.7 *7.0 11.0 11.9 10.4 13.7Disorders of menstruation . . . . . . . . . . . . . . . . . *0.6 *0.8 *1.5 *0.2 *0.9 *1.5 *0.5 *0.8Other disorders of female genital tract . . . . . . . . . *3.6 *4.1 *3.7 *8.8 4.1 *6.6 *2.5 *7.8Delivery and other conditions of pregnancy andpuerperium . . . . . . . . . . . . . . . . . . . . . . . . . 20.4 14.7 16.2 18.8 19.5 17.2 20.9 *9.2Skin conditions . . . . . . . . . . . . . . . . . . . . . . . . *5.3 *5.4 *3.1 *4.7 4.2 *5.1 *3.7 *5.1Acute musculoskeletal conditions . . . . . . . . . . . . 30.9 25.7 23.3 32.0 25.9 25.7 26.0 32.3Headache, excluding migraine . . . . . . . . . . . . . . *4.1 *2.8 *2.3 *3.9 3.3 *5.4 *2.0 *2.5Fever, unspecified . . . . . . . . . . . . . . . . . . . . . . *9.0 *3.2 *2.0 *6.7 5.4 *5.6 5.3 *2.1
All other acute conditions . . . . . . . . . . . . . . . . . 49.5 60.2 60.5 52.9 52.5 60.7 47.2 71.6
1MSA is metropolitan statistical area.
NOTES: The standard errors and relative standard errors (RSE’s) can be computed by using parameter sets II and X of table II, the frequencies of tables 25 and 78, and the formula presented inrule 4 of appendix I. Estimates for which the numerator has an RSE of more than 30 percent are indicated with an asterisk.
35
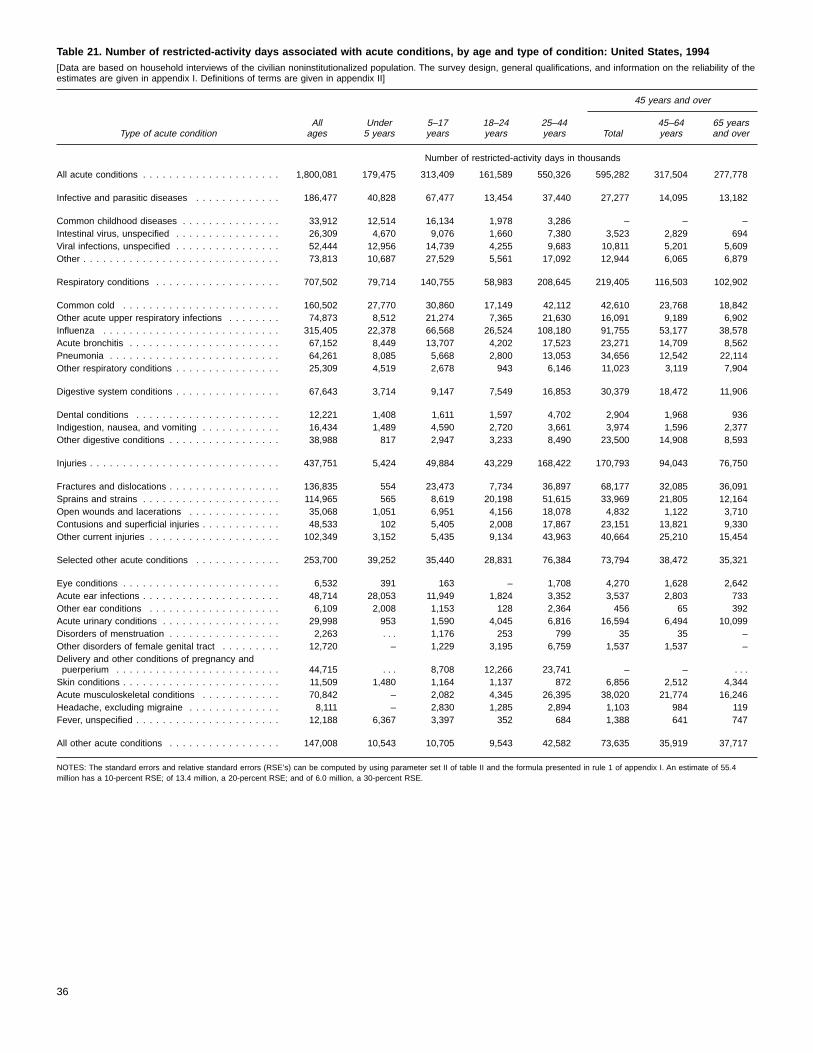
Table 21. Number of restricted-activity days associated with acute conditions, by age and type of condition: United States, 1994[Data are based on household interviews of the civilian noninstitutionalized population. The survey design, general qualifications, and information on the reliability of theestimates are given in appendix I. Definitions of terms are given in appendix II]
Type of acute condition
45 years and over
Allages
Under5 years
5–17years
18–24years
25–44years Total
45–64years
65 yearsand over
Number of restricted-activity days in thousands
All acute conditions . . . . . . . . . . . . . . . . . . . . . 1,800,081 179,475 313,409 161,589 550,326 595,282 317,504 277,778
Infective and parasitic diseases . . . . . . . . . . . . . 186,477 40,828 67,477 13,454 37,440 27,277 14,095 13,182
Common childhood diseases . . . . . . . . . . . . . . . 33,912 12,514 16,134 1,978 3,286 – – –Intestinal virus, unspecified . . . . . . . . . . . . . . . . 26,309 4,670 9,076 1,660 7,380 3,523 2,829 694Viral infections, unspecified . . . . . . . . . . . . . . . . 52,444 12,956 14,739 4,255 9,683 10,811 5,201 5,609Other . . . . . . . . . . . . . . . . . . . . . . . . . . . . . . 73,813 10,687 27,529 5,561 17,092 12,944 6,065 6,879
Respiratory conditions . . . . . . . . . . . . . . . . . . . 707,502 79,714 140,755 58,983 208,645 219,405 116,503 102,902
Common cold . . . . . . . . . . . . . . . . . . . . . . . . 160,502 27,770 30,860 17,149 42,112 42,610 23,768 18,842Other acute upper respiratory infections . . . . . . . . 74,873 8,512 21,274 7,365 21,630 16,091 9,189 6,902Influenza . . . . . . . . . . . . . . . . . . . . . . . . . . . 315,405 22,378 66,568 26,524 108,180 91,755 53,177 38,578Acute bronchitis . . . . . . . . . . . . . . . . . . . . . . . 67,152 8,449 13,707 4,202 17,523 23,271 14,709 8,562Pneumonia . . . . . . . . . . . . . . . . . . . . . . . . . . 64,261 8,085 5,668 2,800 13,053 34,656 12,542 22,114Other respiratory conditions . . . . . . . . . . . . . . . . 25,309 4,519 2,678 943 6,146 11,023 3,119 7,904
Digestive system conditions . . . . . . . . . . . . . . . . 67,643 3,714 9,147 7,549 16,853 30,379 18,472 11,906
Dental conditions . . . . . . . . . . . . . . . . . . . . . . 12,221 1,408 1,611 1,597 4,702 2,904 1,968 936Indigestion, nausea, and vomiting . . . . . . . . . . . . 16,434 1,489 4,590 2,720 3,661 3,974 1,596 2,377Other digestive conditions . . . . . . . . . . . . . . . . . 38,988 817 2,947 3,233 8,490 23,500 14,908 8,593
Injuries . . . . . . . . . . . . . . . . . . . . . . . . . . . . . 437,751 5,424 49,884 43,229 168,422 170,793 94,043 76,750
Fractures and dislocations . . . . . . . . . . . . . . . . . 136,835 554 23,473 7,734 36,897 68,177 32,085 36,091Sprains and strains . . . . . . . . . . . . . . . . . . . . . 114,965 565 8,619 20,198 51,615 33,969 21,805 12,164Open wounds and lacerations . . . . . . . . . . . . . . 35,068 1,051 6,951 4,156 18,078 4,832 1,122 3,710Contusions and superficial injuries . . . . . . . . . . . . 48,533 102 5,405 2,008 17,867 23,151 13,821 9,330Other current injuries . . . . . . . . . . . . . . . . . . . . 102,349 3,152 5,435 9,134 43,963 40,664 25,210 15,454
Selected other acute conditions . . . . . . . . . . . . . 253,700 39,252 35,440 28,831 76,384 73,794 38,472 35,321
Eye conditions . . . . . . . . . . . . . . . . . . . . . . . . 6,532 391 163 – 1,708 4,270 1,628 2,642Acute ear infections . . . . . . . . . . . . . . . . . . . . . 48,714 28,053 11,949 1,824 3,352 3,537 2,803 733Other ear conditions . . . . . . . . . . . . . . . . . . . . 6,109 2,008 1,153 128 2,364 456 65 392Acute urinary conditions . . . . . . . . . . . . . . . . . . 29,998 953 1,590 4,045 6,816 16,594 6,494 10,099Disorders of menstruation . . . . . . . . . . . . . . . . . 2,263 . . . 1,176 253 799 35 35 –Other disorders of female genital tract . . . . . . . . . 12,720 – 1,229 3,195 6,759 1,537 1,537 –Delivery and other conditions of pregnancy andpuerperium . . . . . . . . . . . . . . . . . . . . . . . . . 44,715 . . . 8,708 12,266 23,741 – – . . .Skin conditions . . . . . . . . . . . . . . . . . . . . . . . . 11,509 1,480 1,164 1,137 872 6,856 2,512 4,344Acute musculoskeletal conditions . . . . . . . . . . . . 70,842 – 2,082 4,345 26,395 38,020 21,774 16,246Headache, excluding migraine . . . . . . . . . . . . . . 8,111 – 2,830 1,285 2,894 1,103 984 119Fever, unspecified . . . . . . . . . . . . . . . . . . . . . . 12,188 6,367 3,397 352 684 1,388 641 747
All other acute conditions . . . . . . . . . . . . . . . . . 147,008 10,543 10,705 9,543 42,582 73,635 35,919 37,717
NOTES: The standard errors and relative standard errors (RSE’s) can be computed by using parameter set II of table II and the formula presented in rule 1 of appendix I. An estimate of 55.4million has a 10-percent RSE; of 13.4 million, a 20-percent RSE; and of 6.0 million, a 30-percent RSE.
36
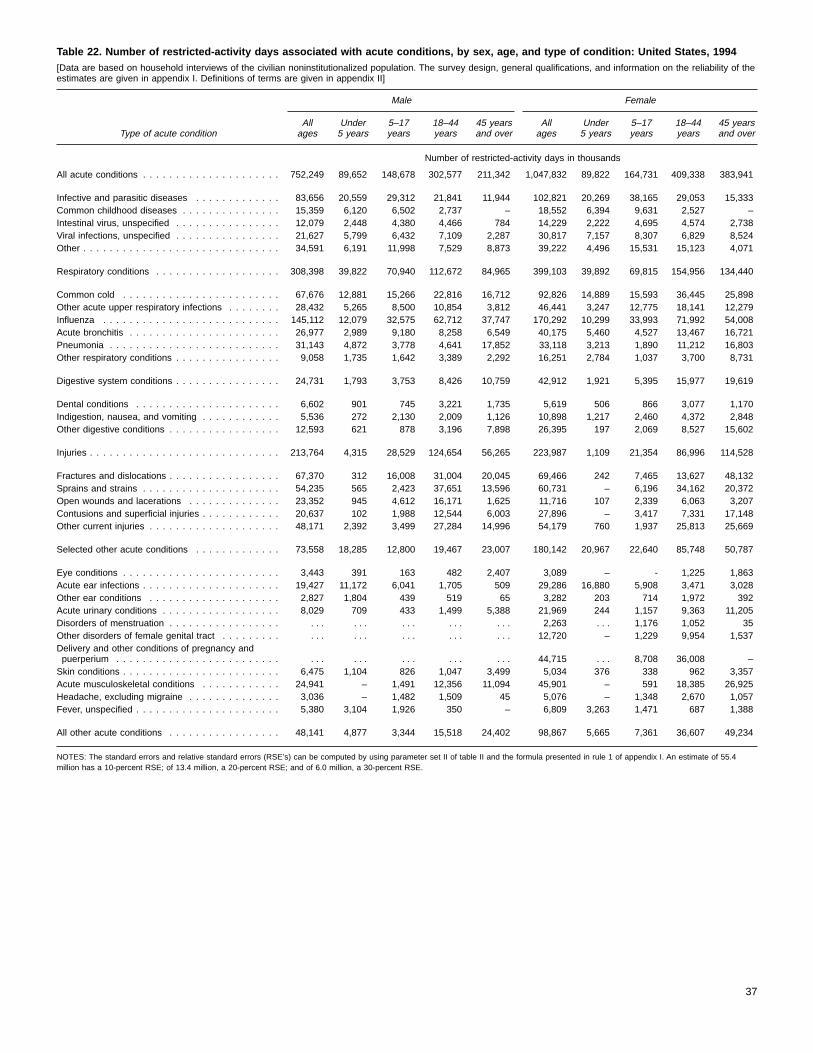
Table 22. Number of restricted-activity days associated with acute conditions, by sex, age, and type of condition: United States, 1994[Data are based on household interviews of the civilian noninstitutionalized population. The survey design, general qualifications, and information on the reliability of theestimates are given in appendix I. Definitions of terms are given in appendix II]
Type of acute condition
Male Female
Allages
Under5 years
5–17years
18–44years
45 yearsand over
Allages
Under5 years
5–17years
18–44years
45 yearsand over
Number of restricted-activity days in thousands
All acute conditions . . . . . . . . . . . . . . . . . . . . . 752,249 89,652 148,678 302,577 211,342 1,047,832 89,822 164,731 409,338 383,941
Infective and parasitic diseases . . . . . . . . . . . . . 83,656 20,559 29,312 21,841 11,944 102,821 20,269 38,165 29,053 15,333Common childhood diseases . . . . . . . . . . . . . . . 15,359 6,120 6,502 2,737 – 18,552 6,394 9,631 2,527 –Intestinal virus, unspecified . . . . . . . . . . . . . . . . 12,079 2,448 4,380 4,466 784 14,229 2,222 4,695 4,574 2,738Viral infections, unspecified . . . . . . . . . . . . . . . . 21,627 5,799 6,432 7,109 2,287 30,817 7,157 8,307 6,829 8,524Other . . . . . . . . . . . . . . . . . . . . . . . . . . . . . . 34,591 6,191 11,998 7,529 8,873 39,222 4,496 15,531 15,123 4,071
Respiratory conditions . . . . . . . . . . . . . . . . . . . 308,398 39,822 70,940 112,672 84,965 399,103 39,892 69,815 154,956 134,440
Common cold . . . . . . . . . . . . . . . . . . . . . . . . 67,676 12,881 15,266 22,816 16,712 92,826 14,889 15,593 36,445 25,898Other acute upper respiratory infections . . . . . . . . 28,432 5,265 8,500 10,854 3,812 46,441 3,247 12,775 18,141 12,279Influenza . . . . . . . . . . . . . . . . . . . . . . . . . . . 145,112 12,079 32,575 62,712 37,747 170,292 10,299 33,993 71,992 54,008Acute bronchitis . . . . . . . . . . . . . . . . . . . . . . . 26,977 2,989 9,180 8,258 6,549 40,175 5,460 4,527 13,467 16,721Pneumonia . . . . . . . . . . . . . . . . . . . . . . . . . . 31,143 4,872 3,778 4,641 17,852 33,118 3,213 1,890 11,212 16,803Other respiratory conditions . . . . . . . . . . . . . . . . 9,058 1,735 1,642 3,389 2,292 16,251 2,784 1,037 3,700 8,731
Digestive system conditions . . . . . . . . . . . . . . . . 24,731 1,793 3,753 8,426 10,759 42,912 1,921 5,395 15,977 19,619
Dental conditions . . . . . . . . . . . . . . . . . . . . . . 6,602 901 745 3,221 1,735 5,619 506 866 3,077 1,170Indigestion, nausea, and vomiting . . . . . . . . . . . . 5,536 272 2,130 2,009 1,126 10,898 1,217 2,460 4,372 2,848Other digestive conditions . . . . . . . . . . . . . . . . . 12,593 621 878 3,196 7,898 26,395 197 2,069 8,527 15,602
Injuries . . . . . . . . . . . . . . . . . . . . . . . . . . . . . 213,764 4,315 28,529 124,654 56,265 223,987 1,109 21,354 86,996 114,528
Fractures and dislocations . . . . . . . . . . . . . . . . . 67,370 312 16,008 31,004 20,045 69,466 242 7,465 13,627 48,132Sprains and strains . . . . . . . . . . . . . . . . . . . . . 54,235 565 2,423 37,651 13,596 60,731 – 6,196 34,162 20,372Open wounds and lacerations . . . . . . . . . . . . . . 23,352 945 4,612 16,171 1,625 11,716 107 2,339 6,063 3,207Contusions and superficial injuries . . . . . . . . . . . . 20,637 102 1,988 12,544 6,003 27,896 – 3,417 7,331 17,148Other current injuries . . . . . . . . . . . . . . . . . . . . 48,171 2,392 3,499 27,284 14,996 54,179 760 1,937 25,813 25,669
Selected other acute conditions . . . . . . . . . . . . . 73,558 18,285 12,800 19,467 23,007 180,142 20,967 22,640 85,748 50,787
Eye conditions . . . . . . . . . . . . . . . . . . . . . . . . 3,443 391 163 482 2,407 3,089 – - 1,225 1,863Acute ear infections . . . . . . . . . . . . . . . . . . . . . 19,427 11,172 6,041 1,705 509 29,286 16,880 5,908 3,471 3,028Other ear conditions . . . . . . . . . . . . . . . . . . . . 2,827 1,804 439 519 65 3,282 203 714 1,972 392Acute urinary conditions . . . . . . . . . . . . . . . . . . 8,029 709 433 1,499 5,388 21,969 244 1,157 9,363 11,205Disorders of menstruation . . . . . . . . . . . . . . . . . . . . . . . . . . . . . . . . 2,263 . . . 1,176 1,052 35Other disorders of female genital tract . . . . . . . . . . . . . . . . . . . . . . . . 12,720 – 1,229 9,954 1,537Delivery and other conditions of pregnancy andpuerperium . . . . . . . . . . . . . . . . . . . . . . . . . . . . . . . . . . . . . . . . 44,715 . . . 8,708 36,008 –Skin conditions . . . . . . . . . . . . . . . . . . . . . . . . 6,475 1,104 826 1,047 3,499 5,034 376 338 962 3,357Acute musculoskeletal conditions . . . . . . . . . . . . 24,941 – 1,491 12,356 11,094 45,901 – 591 18,385 26,925Headache, excluding migraine . . . . . . . . . . . . . . 3,036 – 1,482 1,509 45 5,076 – 1,348 2,670 1,057Fever, unspecified . . . . . . . . . . . . . . . . . . . . . . 5,380 3,104 1,926 350 – 6,809 3,263 1,471 687 1,388
All other acute conditions . . . . . . . . . . . . . . . . . 48,141 4,877 3,344 15,518 24,402 98,867 5,665 7,361 36,607 49,234
NOTES: The standard errors and relative standard errors (RSE’s) can be computed by using parameter set II of table II and the formula presented in rule 1 of appendix I. An estimate of 55.4million has a 10-percent RSE; of 13.4 million, a 20-percent RSE; and of 6.0 million, a 30-percent RSE.
37
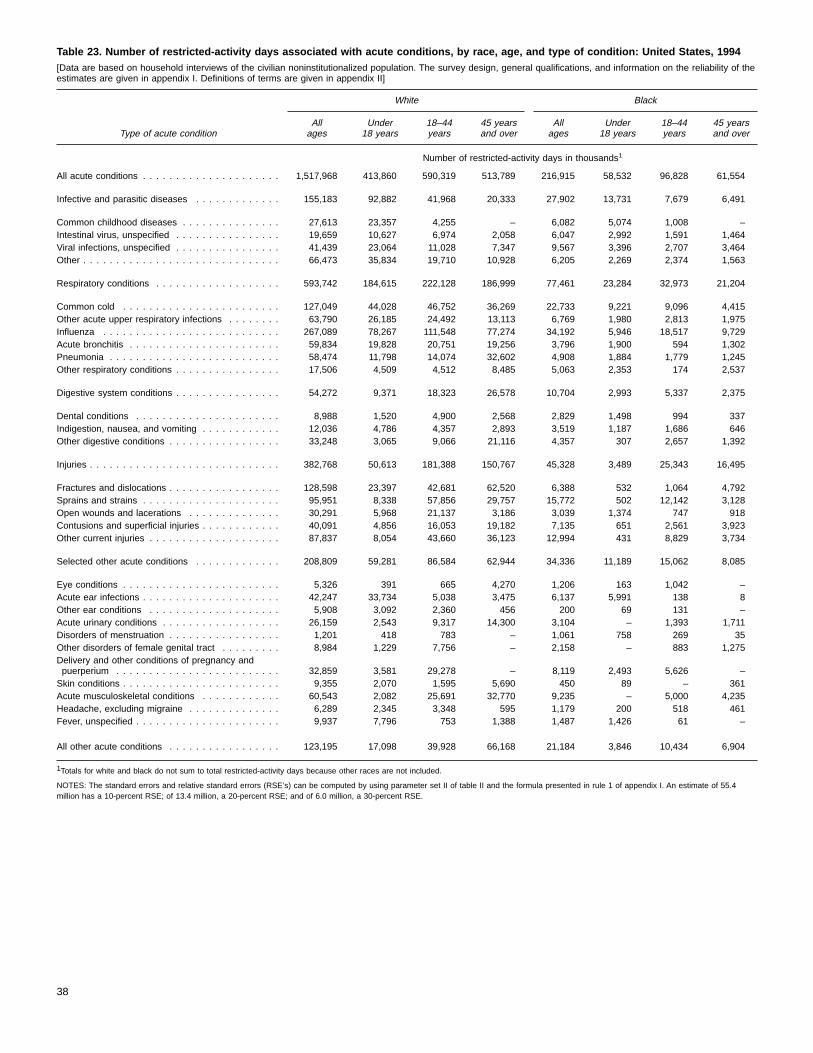
Table 23. Number of restricted-activity days associated with acute conditions, by race, age, and type of condition: United States, 1994[Data are based on household interviews of the civilian noninstitutionalized population. The survey design, general qualifications, and information on the reliability of theestimates are given in appendix I. Definitions of terms are given in appendix II]
Type of acute condition
White Black
Allages
Under18 years
18–44years
45 yearsand over
Allages
Under18 years
18–44years
45 yearsand over
Number of restricted-activity days in thousands1
All acute conditions . . . . . . . . . . . . . . . . . . . . . 1,517,968 413,860 590,319 513,789 216,915 58,532 96,828 61,554
Infective and parasitic diseases . . . . . . . . . . . . . 155,183 92,882 41,968 20,333 27,902 13,731 7,679 6,491
Common childhood diseases . . . . . . . . . . . . . . . 27,613 23,357 4,255 – 6,082 5,074 1,008 –Intestinal virus, unspecified . . . . . . . . . . . . . . . . 19,659 10,627 6,974 2,058 6,047 2,992 1,591 1,464Viral infections, unspecified . . . . . . . . . . . . . . . . 41,439 23,064 11,028 7,347 9,567 3,396 2,707 3,464Other . . . . . . . . . . . . . . . . . . . . . . . . . . . . . . 66,473 35,834 19,710 10,928 6,205 2,269 2,374 1,563
Respiratory conditions . . . . . . . . . . . . . . . . . . . 593,742 184,615 222,128 186,999 77,461 23,284 32,973 21,204
Common cold . . . . . . . . . . . . . . . . . . . . . . . . 127,049 44,028 46,752 36,269 22,733 9,221 9,096 4,415Other acute upper respiratory infections . . . . . . . . 63,790 26,185 24,492 13,113 6,769 1,980 2,813 1,975Influenza . . . . . . . . . . . . . . . . . . . . . . . . . . . 267,089 78,267 111,548 77,274 34,192 5,946 18,517 9,729Acute bronchitis . . . . . . . . . . . . . . . . . . . . . . . 59,834 19,828 20,751 19,256 3,796 1,900 594 1,302Pneumonia . . . . . . . . . . . . . . . . . . . . . . . . . . 58,474 11,798 14,074 32,602 4,908 1,884 1,779 1,245Other respiratory conditions . . . . . . . . . . . . . . . . 17,506 4,509 4,512 8,485 5,063 2,353 174 2,537
Digestive system conditions . . . . . . . . . . . . . . . . 54,272 9,371 18,323 26,578 10,704 2,993 5,337 2,375
Dental conditions . . . . . . . . . . . . . . . . . . . . . . 8,988 1,520 4,900 2,568 2,829 1,498 994 337Indigestion, nausea, and vomiting . . . . . . . . . . . . 12,036 4,786 4,357 2,893 3,519 1,187 1,686 646Other digestive conditions . . . . . . . . . . . . . . . . . 33,248 3,065 9,066 21,116 4,357 307 2,657 1,392
Injuries . . . . . . . . . . . . . . . . . . . . . . . . . . . . . 382,768 50,613 181,388 150,767 45,328 3,489 25,343 16,495
Fractures and dislocations . . . . . . . . . . . . . . . . . 128,598 23,397 42,681 62,520 6,388 532 1,064 4,792Sprains and strains . . . . . . . . . . . . . . . . . . . . . 95,951 8,338 57,856 29,757 15,772 502 12,142 3,128Open wounds and lacerations . . . . . . . . . . . . . . 30,291 5,968 21,137 3,186 3,039 1,374 747 918Contusions and superficial injuries . . . . . . . . . . . . 40,091 4,856 16,053 19,182 7,135 651 2,561 3,923Other current injuries . . . . . . . . . . . . . . . . . . . . 87,837 8,054 43,660 36,123 12,994 431 8,829 3,734
Selected other acute conditions . . . . . . . . . . . . . 208,809 59,281 86,584 62,944 34,336 11,189 15,062 8,085
Eye conditions . . . . . . . . . . . . . . . . . . . . . . . . 5,326 391 665 4,270 1,206 163 1,042 –Acute ear infections . . . . . . . . . . . . . . . . . . . . . 42,247 33,734 5,038 3,475 6,137 5,991 138 8Other ear conditions . . . . . . . . . . . . . . . . . . . . 5,908 3,092 2,360 456 200 69 131 –Acute urinary conditions . . . . . . . . . . . . . . . . . . 26,159 2,543 9,317 14,300 3,104 – 1,393 1,711Disorders of menstruation . . . . . . . . . . . . . . . . . 1,201 418 783 – 1,061 758 269 35Other disorders of female genital tract . . . . . . . . . 8,984 1,229 7,756 – 2,158 – 883 1,275Delivery and other conditions of pregnancy andpuerperium . . . . . . . . . . . . . . . . . . . . . . . . . 32,859 3,581 29,278 – 8,119 2,493 5,626 –Skin conditions . . . . . . . . . . . . . . . . . . . . . . . . 9,355 2,070 1,595 5,690 450 89 – 361Acute musculoskeletal conditions . . . . . . . . . . . . 60,543 2,082 25,691 32,770 9,235 – 5,000 4,235Headache, excluding migraine . . . . . . . . . . . . . . 6,289 2,345 3,348 595 1,179 200 518 461Fever, unspecified . . . . . . . . . . . . . . . . . . . . . . 9,937 7,796 753 1,388 1,487 1,426 61 –
All other acute conditions . . . . . . . . . . . . . . . . . 123,195 17,098 39,928 66,168 21,184 3,846 10,434 6,904
1Totals for white and black do not sum to total restricted-activity days because other races are not included.
NOTES: The standard errors and relative standard errors (RSE’s) can be computed by using parameter set II of table II and the formula presented in rule 1 of appendix I. An estimate of 55.4million has a 10-percent RSE; of 13.4 million, a 20-percent RSE; and of 6.0 million, a 30-percent RSE.
38
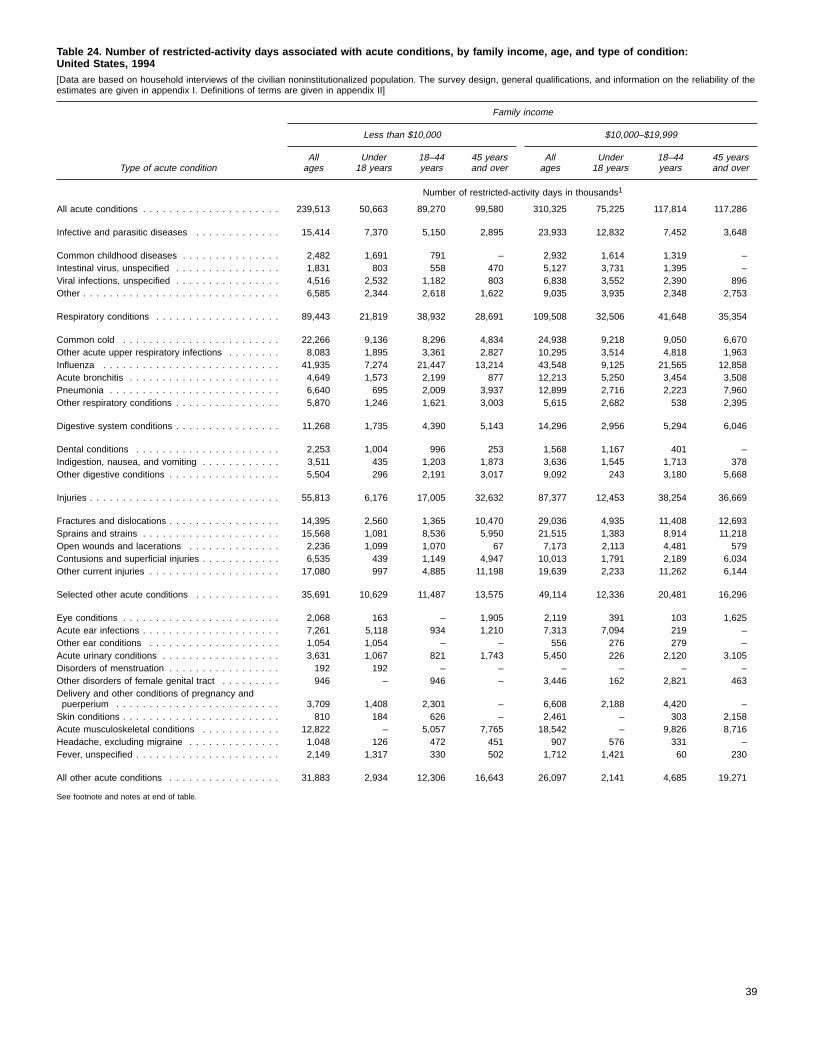
Table 24. Number of restricted-activity days associated with acute conditions, by family income, age, and type of condition:United States, 1994[Data are based on household interviews of the civilian noninstitutionalized population. The survey design, general qualifications, and information on the reliability of theestimates are given in appendix I. Definitions of terms are given in appendix II]
Type of acute condition
Family income
Less than $10,000 $10,000–$19,999
Allages
Under18 years
18–44years
45 yearsand over
Allages
Under18 years
18–44years
45 yearsand over
Number of restricted-activity days in thousands1
All acute conditions . . . . . . . . . . . . . . . . . . . . . 239,513 50,663 89,270 99,580 310,325 75,225 117,814 117,286
Infective and parasitic diseases . . . . . . . . . . . . . 15,414 7,370 5,150 2,895 23,933 12,832 7,452 3,648
Common childhood diseases . . . . . . . . . . . . . . . 2,482 1,691 791 – 2,932 1,614 1,319 –Intestinal virus, unspecified . . . . . . . . . . . . . . . . 1,831 803 558 470 5,127 3,731 1,395 –Viral infections, unspecified . . . . . . . . . . . . . . . . 4,516 2,532 1,182 803 6,838 3,552 2,390 896Other . . . . . . . . . . . . . . . . . . . . . . . . . . . . . . 6,585 2,344 2,618 1,622 9,035 3,935 2,348 2,753
Respiratory conditions . . . . . . . . . . . . . . . . . . . 89,443 21,819 38,932 28,691 109,508 32,506 41,648 35,354
Common cold . . . . . . . . . . . . . . . . . . . . . . . . 22,266 9,136 8,296 4,834 24,938 9,218 9,050 6,670Other acute upper respiratory infections . . . . . . . . 8,083 1,895 3,361 2,827 10,295 3,514 4,818 1,963Influenza . . . . . . . . . . . . . . . . . . . . . . . . . . . 41,935 7,274 21,447 13,214 43,548 9,125 21,565 12,858Acute bronchitis . . . . . . . . . . . . . . . . . . . . . . . 4,649 1,573 2,199 877 12,213 5,250 3,454 3,508Pneumonia . . . . . . . . . . . . . . . . . . . . . . . . . . 6,640 695 2,009 3,937 12,899 2,716 2,223 7,960Other respiratory conditions . . . . . . . . . . . . . . . . 5,870 1,246 1,621 3,003 5,615 2,682 538 2,395
Digestive system conditions . . . . . . . . . . . . . . . . 11,268 1,735 4,390 5,143 14,296 2,956 5,294 6,046
Dental conditions . . . . . . . . . . . . . . . . . . . . . . 2,253 1,004 996 253 1,568 1,167 401 –Indigestion, nausea, and vomiting . . . . . . . . . . . . 3,511 435 1,203 1,873 3,636 1,545 1,713 378Other digestive conditions . . . . . . . . . . . . . . . . . 5,504 296 2,191 3,017 9,092 243 3,180 5,668
Injuries . . . . . . . . . . . . . . . . . . . . . . . . . . . . . 55,813 6,176 17,005 32,632 87,377 12,453 38,254 36,669
Fractures and dislocations . . . . . . . . . . . . . . . . . 14,395 2,560 1,365 10,470 29,036 4,935 11,408 12,693Sprains and strains . . . . . . . . . . . . . . . . . . . . . 15,568 1,081 8,536 5,950 21,515 1,383 8,914 11,218Open wounds and lacerations . . . . . . . . . . . . . . 2,236 1,099 1,070 67 7,173 2,113 4,481 579Contusions and superficial injuries . . . . . . . . . . . . 6,535 439 1,149 4,947 10,013 1,791 2,189 6,034Other current injuries . . . . . . . . . . . . . . . . . . . . 17,080 997 4,885 11,198 19,639 2,233 11,262 6,144
Selected other acute conditions . . . . . . . . . . . . . 35,691 10,629 11,487 13,575 49,114 12,336 20,481 16,296
Eye conditions . . . . . . . . . . . . . . . . . . . . . . . . 2,068 163 – 1,905 2,119 391 103 1,625Acute ear infections . . . . . . . . . . . . . . . . . . . . . 7,261 5,118 934 1,210 7,313 7,094 219 –Other ear conditions . . . . . . . . . . . . . . . . . . . . 1,054 1,054 – – 556 276 279 –Acute urinary conditions . . . . . . . . . . . . . . . . . . 3,631 1,067 821 1,743 5,450 226 2,120 3,105Disorders of menstruation . . . . . . . . . . . . . . . . . 192 192 – – – – – –Other disorders of female genital tract . . . . . . . . . 946 – 946 – 3,446 162 2,821 463Delivery and other conditions of pregnancy andpuerperium . . . . . . . . . . . . . . . . . . . . . . . . . 3,709 1,408 2,301 – 6,608 2,188 4,420 –Skin conditions . . . . . . . . . . . . . . . . . . . . . . . . 810 184 626 – 2,461 – 303 2,158Acute musculoskeletal conditions . . . . . . . . . . . . 12,822 – 5,057 7,765 18,542 – 9,826 8,716Headache, excluding migraine . . . . . . . . . . . . . . 1,048 126 472 451 907 576 331 –Fever, unspecified . . . . . . . . . . . . . . . . . . . . . . 2,149 1,317 330 502 1,712 1,421 60 230
All other acute conditions . . . . . . . . . . . . . . . . . 31,883 2,934 12,306 16,643 26,097 2,141 4,685 19,271
See footnote and notes at end of table.
39
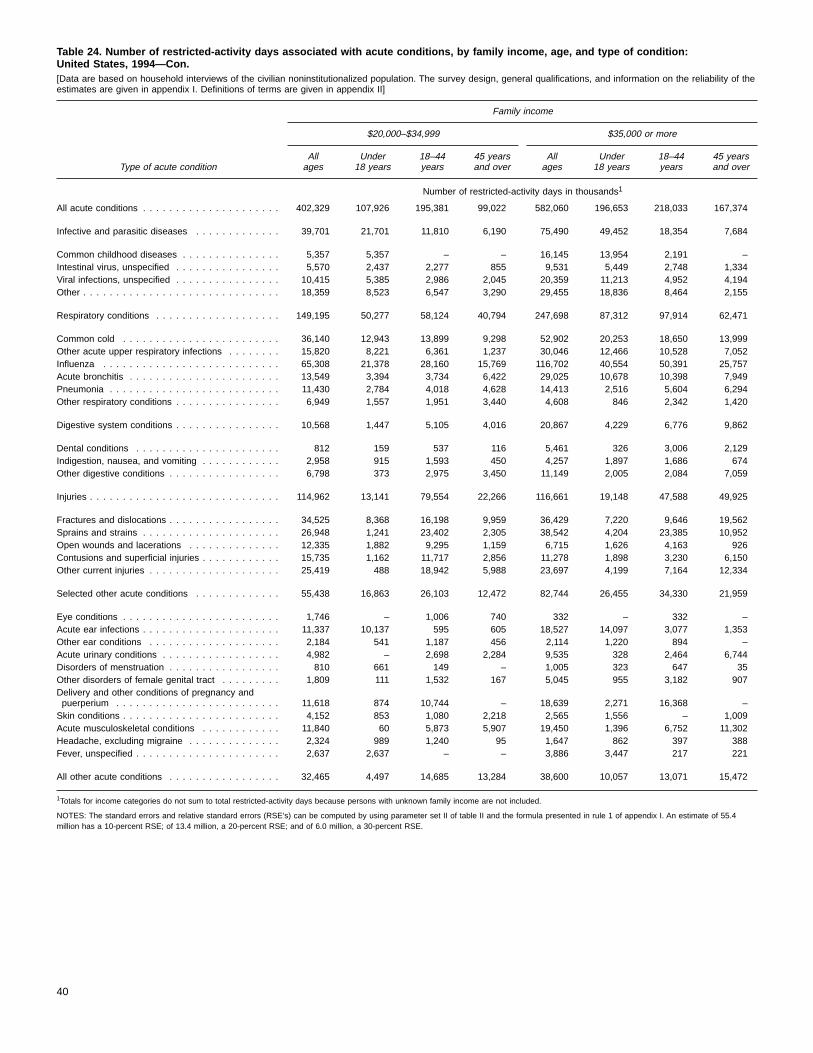
Table 24. Number of restricted-activity days associated with acute conditions, by family income, age, and type of condition:United States, 1994—Con.[Data are based on household interviews of the civilian noninstitutionalized population. The survey design, general qualifications, and information on the reliability of theestimates are given in appendix I. Definitions of terms are given in appendix II]
Type of acute condition
Family income
$20,000–$34,999 $35,000 or more
Allages
Under18 years
18–44years
45 yearsand over
Allages
Under18 years
18–44years
45 yearsand over
Number of restricted-activity days in thousands1
All acute conditions . . . . . . . . . . . . . . . . . . . . . 402,329 107,926 195,381 99,022 582,060 196,653 218,033 167,374
Infective and parasitic diseases . . . . . . . . . . . . . 39,701 21,701 11,810 6,190 75,490 49,452 18,354 7,684
Common childhood diseases . . . . . . . . . . . . . . . 5,357 5,357 – – 16,145 13,954 2,191 –Intestinal virus, unspecified . . . . . . . . . . . . . . . . 5,570 2,437 2,277 855 9,531 5,449 2,748 1,334Viral infections, unspecified . . . . . . . . . . . . . . . . 10,415 5,385 2,986 2,045 20,359 11,213 4,952 4,194Other . . . . . . . . . . . . . . . . . . . . . . . . . . . . . . 18,359 8,523 6,547 3,290 29,455 18,836 8,464 2,155
Respiratory conditions . . . . . . . . . . . . . . . . . . . 149,195 50,277 58,124 40,794 247,698 87,312 97,914 62,471
Common cold . . . . . . . . . . . . . . . . . . . . . . . . 36,140 12,943 13,899 9,298 52,902 20,253 18,650 13,999Other acute upper respiratory infections . . . . . . . . 15,820 8,221 6,361 1,237 30,046 12,466 10,528 7,052Influenza . . . . . . . . . . . . . . . . . . . . . . . . . . . 65,308 21,378 28,160 15,769 116,702 40,554 50,391 25,757Acute bronchitis . . . . . . . . . . . . . . . . . . . . . . . 13,549 3,394 3,734 6,422 29,025 10,678 10,398 7,949Pneumonia . . . . . . . . . . . . . . . . . . . . . . . . . . 11,430 2,784 4,018 4,628 14,413 2,516 5,604 6,294Other respiratory conditions . . . . . . . . . . . . . . . . 6,949 1,557 1,951 3,440 4,608 846 2,342 1,420
Digestive system conditions . . . . . . . . . . . . . . . . 10,568 1,447 5,105 4,016 20,867 4,229 6,776 9,862
Dental conditions . . . . . . . . . . . . . . . . . . . . . . 812 159 537 116 5,461 326 3,006 2,129Indigestion, nausea, and vomiting . . . . . . . . . . . . 2,958 915 1,593 450 4,257 1,897 1,686 674Other digestive conditions . . . . . . . . . . . . . . . . . 6,798 373 2,975 3,450 11,149 2,005 2,084 7,059
Injuries . . . . . . . . . . . . . . . . . . . . . . . . . . . . . 114,962 13,141 79,554 22,266 116,661 19,148 47,588 49,925
Fractures and dislocations . . . . . . . . . . . . . . . . . 34,525 8,368 16,198 9,959 36,429 7,220 9,646 19,562Sprains and strains . . . . . . . . . . . . . . . . . . . . . 26,948 1,241 23,402 2,305 38,542 4,204 23,385 10,952Open wounds and lacerations . . . . . . . . . . . . . . 12,335 1,882 9,295 1,159 6,715 1,626 4,163 926Contusions and superficial injuries . . . . . . . . . . . . 15,735 1,162 11,717 2,856 11,278 1,898 3,230 6,150Other current injuries . . . . . . . . . . . . . . . . . . . . 25,419 488 18,942 5,988 23,697 4,199 7,164 12,334
Selected other acute conditions . . . . . . . . . . . . . 55,438 16,863 26,103 12,472 82,744 26,455 34,330 21,959
Eye conditions . . . . . . . . . . . . . . . . . . . . . . . . 1,746 – 1,006 740 332 – 332 –Acute ear infections . . . . . . . . . . . . . . . . . . . . . 11,337 10,137 595 605 18,527 14,097 3,077 1,353Other ear conditions . . . . . . . . . . . . . . . . . . . . 2,184 541 1,187 456 2,114 1,220 894 –Acute urinary conditions . . . . . . . . . . . . . . . . . . 4,982 – 2,698 2,284 9,535 328 2,464 6,744Disorders of menstruation . . . . . . . . . . . . . . . . . 810 661 149 – 1,005 323 647 35Other disorders of female genital tract . . . . . . . . . 1,809 111 1,532 167 5,045 955 3,182 907Delivery and other conditions of pregnancy andpuerperium . . . . . . . . . . . . . . . . . . . . . . . . . 11,618 874 10,744 – 18,639 2,271 16,368 –Skin conditions . . . . . . . . . . . . . . . . . . . . . . . . 4,152 853 1,080 2,218 2,565 1,556 – 1,009Acute musculoskeletal conditions . . . . . . . . . . . . 11,840 60 5,873 5,907 19,450 1,396 6,752 11,302Headache, excluding migraine . . . . . . . . . . . . . . 2,324 989 1,240 95 1,647 862 397 388Fever, unspecified . . . . . . . . . . . . . . . . . . . . . . 2,637 2,637 – – 3,886 3,447 217 221
All other acute conditions . . . . . . . . . . . . . . . . . 32,465 4,497 14,685 13,284 38,600 10,057 13,071 15,472
1Totals for income categories do not sum to total restricted-activity days because persons with unknown family income are not included.
NOTES: The standard errors and relative standard errors (RSE’s) can be computed by using parameter set II of table II and the formula presented in rule 1 of appendix I. An estimate of 55.4million has a 10-percent RSE; of 13.4 million, a 20-percent RSE; and of 6.0 million, a 30-percent RSE.
40
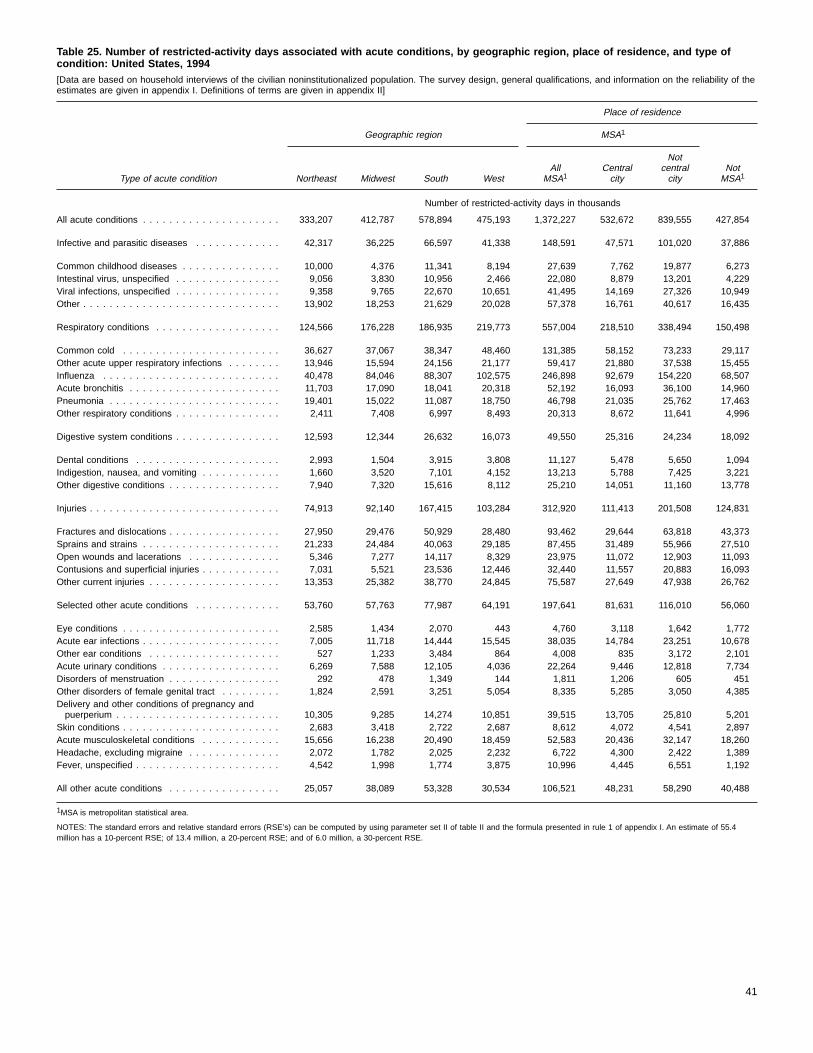
Table 25. Number of restricted-activity days associated with acute conditions, by geographic region, place of residence, and type ofcondition: United States, 1994[Data are based on household interviews of the civilian noninstitutionalized population. The survey design, general qualifications, and information on the reliability of theestimates are given in appendix I. Definitions of terms are given in appendix II]
Type of acute condition
Place of residence
Geographic region MSA1
Northeast Midwest South WestAll
MSA1Centralcity
Notcentralcity
NotMSA1
Number of restricted-activity days in thousands
All acute conditions . . . . . . . . . . . . . . . . . . . . . 333,207 412,787 578,894 475,193 1,372,227 532,672 839,555 427,854
Infective and parasitic diseases . . . . . . . . . . . . . 42,317 36,225 66,597 41,338 148,591 47,571 101,020 37,886
Common childhood diseases . . . . . . . . . . . . . . . 10,000 4,376 11,341 8,194 27,639 7,762 19,877 6,273Intestinal virus, unspecified . . . . . . . . . . . . . . . . 9,056 3,830 10,956 2,466 22,080 8,879 13,201 4,229Viral infections, unspecified . . . . . . . . . . . . . . . . 9,358 9,765 22,670 10,651 41,495 14,169 27,326 10,949Other . . . . . . . . . . . . . . . . . . . . . . . . . . . . . . 13,902 18,253 21,629 20,028 57,378 16,761 40,617 16,435
Respiratory conditions . . . . . . . . . . . . . . . . . . . 124,566 176,228 186,935 219,773 557,004 218,510 338,494 150,498
Common cold . . . . . . . . . . . . . . . . . . . . . . . . 36,627 37,067 38,347 48,460 131,385 58,152 73,233 29,117Other acute upper respiratory infections . . . . . . . . 13,946 15,594 24,156 21,177 59,417 21,880 37,538 15,455Influenza . . . . . . . . . . . . . . . . . . . . . . . . . . . 40,478 84,046 88,307 102,575 246,898 92,679 154,220 68,507Acute bronchitis . . . . . . . . . . . . . . . . . . . . . . . 11,703 17,090 18,041 20,318 52,192 16,093 36,100 14,960Pneumonia . . . . . . . . . . . . . . . . . . . . . . . . . . 19,401 15,022 11,087 18,750 46,798 21,035 25,762 17,463Other respiratory conditions . . . . . . . . . . . . . . . . 2,411 7,408 6,997 8,493 20,313 8,672 11,641 4,996
Digestive system conditions . . . . . . . . . . . . . . . . 12,593 12,344 26,632 16,073 49,550 25,316 24,234 18,092
Dental conditions . . . . . . . . . . . . . . . . . . . . . . 2,993 1,504 3,915 3,808 11,127 5,478 5,650 1,094Indigestion, nausea, and vomiting . . . . . . . . . . . . 1,660 3,520 7,101 4,152 13,213 5,788 7,425 3,221Other digestive conditions . . . . . . . . . . . . . . . . . 7,940 7,320 15,616 8,112 25,210 14,051 11,160 13,778
Injuries . . . . . . . . . . . . . . . . . . . . . . . . . . . . . 74,913 92,140 167,415 103,284 312,920 111,413 201,508 124,831
Fractures and dislocations . . . . . . . . . . . . . . . . . 27,950 29,476 50,929 28,480 93,462 29,644 63,818 43,373Sprains and strains . . . . . . . . . . . . . . . . . . . . . 21,233 24,484 40,063 29,185 87,455 31,489 55,966 27,510Open wounds and lacerations . . . . . . . . . . . . . . 5,346 7,277 14,117 8,329 23,975 11,072 12,903 11,093Contusions and superficial injuries . . . . . . . . . . . . 7,031 5,521 23,536 12,446 32,440 11,557 20,883 16,093Other current injuries . . . . . . . . . . . . . . . . . . . . 13,353 25,382 38,770 24,845 75,587 27,649 47,938 26,762
Selected other acute conditions . . . . . . . . . . . . . 53,760 57,763 77,987 64,191 197,641 81,631 116,010 56,060
Eye conditions . . . . . . . . . . . . . . . . . . . . . . . . 2,585 1,434 2,070 443 4,760 3,118 1,642 1,772Acute ear infections . . . . . . . . . . . . . . . . . . . . . 7,005 11,718 14,444 15,545 38,035 14,784 23,251 10,678Other ear conditions . . . . . . . . . . . . . . . . . . . . 527 1,233 3,484 864 4,008 835 3,172 2,101Acute urinary conditions . . . . . . . . . . . . . . . . . . 6,269 7,588 12,105 4,036 22,264 9,446 12,818 7,734Disorders of menstruation . . . . . . . . . . . . . . . . . 292 478 1,349 144 1,811 1,206 605 451Other disorders of female genital tract . . . . . . . . . 1,824 2,591 3,251 5,054 8,335 5,285 3,050 4,385Delivery and other conditions of pregnancy andpuerperium . . . . . . . . . . . . . . . . . . . . . . . . . 10,305 9,285 14,274 10,851 39,515 13,705 25,810 5,201
Skin conditions . . . . . . . . . . . . . . . . . . . . . . . . 2,683 3,418 2,722 2,687 8,612 4,072 4,541 2,897Acute musculoskeletal conditions . . . . . . . . . . . . 15,656 16,238 20,490 18,459 52,583 20,436 32,147 18,260Headache, excluding migraine . . . . . . . . . . . . . . 2,072 1,782 2,025 2,232 6,722 4,300 2,422 1,389Fever, unspecified . . . . . . . . . . . . . . . . . . . . . . 4,542 1,998 1,774 3,875 10,996 4,445 6,551 1,192
All other acute conditions . . . . . . . . . . . . . . . . . 25,057 38,089 53,328 30,534 106,521 48,231 58,290 40,488
1MSA is metropolitan statistical area.
NOTES: The standard errors and relative standard errors (RSE’s) can be computed by using parameter set II of table II and the formula presented in rule 1 of appendix I. An estimate of 55.4million has a 10-percent RSE; of 13.4 million, a 20-percent RSE; and of 6.0 million, a 30-percent RSE.
41

Table 26. Number of bed days associated with acute conditions per 100 persons per year, by age and type of condition: United States,1994[Data are based on household interviews of the civilian noninstitutionalized population. The survey design, general qualifications, and information on the reliability of theestimates are given in appendix I. Definitions of terms are given in appendix II]
Type of acute condition
45 years and over
Allages
Under5 years
5–17years
18–24years
25–44years Total
45–64years
65 yearsand over
Number of bed days per 100 persons per year
All acute conditions . . . . . . . . . . . . . . . . . . . . . 287.6 377.6 269.6 295.9 255.3 306.2 250.3 396.9
Infective and parasitic diseases . . . . . . . . . . . . . 31.9 73.5 59.7 29.3 20.9 16.4 13.7 20.8
Common childhood diseases . . . . . . . . . . . . . . . 2.6 *12.9 *5.1 *3.1 *1.0 *– *– *–Intestinal virus, unspecified . . . . . . . . . . . . . . . . 5.5 *12.5 *9.7 *3.8 *3.8 *3.3 *4.5 *1.4Viral infections, unspecified . . . . . . . . . . . . . . . . 9.9 *28.6 16.9 *12.5 *5.2 *5.0 *3.7 *7.1Other . . . . . . . . . . . . . . . . . . . . . . . . . . . . . . 13.9 *19.5 28.1 *9.9 10.9 8.1 *5.5 *12.3
Respiratory conditions . . . . . . . . . . . . . . . . . . . 133.1 181.5 140.8 128.4 121.5 129.5 110.3 160.6
Common cold . . . . . . . . . . . . . . . . . . . . . . . . 24.0 53.1 26.6 27.1 18.9 19.5 17.8 22.2Other acute upper respiratory infections . . . . . . . . 12.2 *15.4 20.8 *11.6 11.1 7.4 *8.1 *6.3Influenza . . . . . . . . . . . . . . . . . . . . . . . . . . . 65.5 57.4 74.7 69.1 70.0 56.2 53.5 60.6Acute bronchitis . . . . . . . . . . . . . . . . . . . . . . . 10.8 *14.4 *9.0 *8.6 10.4 11.9 14.4 *7.8Pneumonia . . . . . . . . . . . . . . . . . . . . . . . . . . 15.4 *27.9 *5.5 *9.7 8.0 27.6 14.1 49.6Other respiratory conditions . . . . . . . . . . . . . . . . 5.2 *13.4 *4.1 *2.4 *3.2 *6.8 *2.3 *14.1
Digestive system conditions . . . . . . . . . . . . . . . . 10.9 *11.5 *8.5 *10.8 9.1 14.0 12.9 *15.9
Dental conditions . . . . . . . . . . . . . . . . . . . . . . *1.7 *3.2 *1.0 *2.4 *2.9 *0.3 *0.2 *0.4Indigestion, nausea, and vomiting . . . . . . . . . . . . 2.7 *5.2 *4.8 *3.2 *1.5 *2.0 *1.9 *2.1Other digestive conditions . . . . . . . . . . . . . . . . . 6.4 *3.2 *2.6 *5.3 *4.6 11.8 *10.7 *13.4
Injuries . . . . . . . . . . . . . . . . . . . . . . . . . . . . . 49.2 *9.4 21.1 61.5 51.9 69.8 58.9 87.5
Fractures and dislocations . . . . . . . . . . . . . . . . . 15.6 *1.2 *8.4 *15.0 11.6 27.9 17.8 44.3Sprains and strains . . . . . . . . . . . . . . . . . . . . . 12.1 *0.7 *4.2 *23.1 17.1 11.2 12.1 *9.7Open wounds and lacerations . . . . . . . . . . . . . . *1.7 *2.4 *2.8 *2.0 *0.9 *1.7 *0.3 *4.0Contusions and superficial injuries . . . . . . . . . . . . 4.5 *0.5 *2.4 *3.1 *5.6 *6.2 *4.9 *8.3Other current injuries . . . . . . . . . . . . . . . . . . . . 15.2 *4.5 *3.3 *18.3 16.6 22.9 23.9 21.2
Selected other acute conditions . . . . . . . . . . . . . 40.4 76.4 31.0 49.5 34.7 40.1 27.9 59.9
Eye conditions . . . . . . . . . . . . . . . . . . . . . . . . *0.2 *– *0.1 *– *0.6 *– *– *–Acute ear infections . . . . . . . . . . . . . . . . . . . . . 7.3 50.8 *10.0 *3.8 *1.1 *2.0 *1.7 *2.4Other ear conditions . . . . . . . . . . . . . . . . . . . . *1.0 *4.4 *0.9 *0.5 *0.9 *0.6 *0.1 *1.3Acute urinary conditions . . . . . . . . . . . . . . . . . . 6.5 *0.5 *1.8 *10.9 *4.0 12.1 *7.1 20.3Disorders of menstruation . . . . . . . . . . . . . . . . . *0.4 . . . *0.7 *1.0 *0.6 *0.0 *0.1 *–Other disorders of female genital tract . . . . . . . . . *2.2 *– *2.0 *3.5 *4.4 *0.3 *0.6 *–Delivery and other conditions of pregnancy andpuerperium . . . . . . . . . . . . . . . . . . . . . . . . . 7.3 . . . *8.2 *22.5 11.1 *– *– . . .Skin conditions . . . . . . . . . . . . . . . . . . . . . . . . 2.3 *3.2 *0.4 *1.3 *1.1 *4.9 *2.9 *8.2Acute musculoskeletal conditions . . . . . . . . . . . . 8.9 *– *0.5 *3.0 8.8 18.1 13.8 25.0Headache, excluding migraine . . . . . . . . . . . . . . *1.4 *– *2.3 *1.9 *1.7 *0.7 *0.8 *0.4Fever, unspecified . . . . . . . . . . . . . . . . . . . . . . 2.9 *17.6 *4.0 *1.2 *0.6 *1.4 *0.8 *2.4
All other acute conditions . . . . . . . . . . . . . . . . . 22.1 *25.2 *8.6 *16.4 17.1 36.4 26.8 52.1
NOTES: The standard errors and relative standard errors (RSE’s) can be computed by using parameter set II of table II, the frequencies of table 31, and the formula presented in rule 2 ofappendix I. Estimates for which the numerator has an RSE of more than 30 percent are indicated with an asterisk.
42

Table 27. Number of bed days associated with acute conditions per 100 persons per year, by sex, age, and type of condition:United States, 1994[Data are based on household interviews of the civilian noninstitutionalized population. The survey design, general qualifications, and information on the reliability of theestimates are given in appendix I. Definitions of terms are given in appendix II]
Type of acute condition
Male Female
Allages
Under5 years
5–17years
18–44years
45 yearsand over
Allages
Under5 years
5–17years
18–44years
45 yearsand over
Number of bed days per 100 persons per year
All acute conditions . . . . . . . . . . . . . . . . . . . . . 236.1 372.4 231.2 209.5 239.1 336.5 383.1 309.9 318.6 362.8
Infective and parasitic diseases . . . . . . . . . . . . . 28.8 71.2 48.2 18.2 18.9 34.8 76.0 71.8 27.4 14.3
Common childhood diseases . . . . . . . . . . . . . . . *2.4 *14.6 *4.5 *0.7 *– *2.8 *11.2 *5.7 *2.2 *–Intestinal virus, unspecified . . . . . . . . . . . . . . . . *4.7 *12.1 *8.6 *3.6 *1.5 6.2 *13.0 *10.7 *4.0 *4.8Viral infections, unspecified . . . . . . . . . . . . . . . . 8.4 *26.2 *12.8 *7.0 *2.5 11.3 *31.1 *21.2 *6.8 *7.1Other . . . . . . . . . . . . . . . . . . . . . . . . . . . . . . 13.3 *18.3 *22.2 *6.9 *14.9 14.5 *20.8 34.2 14.3 *2.4
Respiratory conditions . . . . . . . . . . . . . . . . . . . 117.9 184.2 132.6 105.9 106.5 147.5 178.7 149.5 139.9 148.8
Common cold . . . . . . . . . . . . . . . . . . . . . . . . 19.8 *46.1 25.4 16.2 *13.6 28.1 60.4 27.9 25.2 24.4Other acute upper respiratory infections . . . . . . . . 8.4 *16.8 *15.0 *7.4 *3.1 15.8 *13.9 27.0 14.8 *11.1Influenza . . . . . . . . . . . . . . . . . . . . . . . . . . . 63.3 65.5 68.2 67.1 53.7 67.6 *48.8 81.4 72.4 58.4Acute bronchitis . . . . . . . . . . . . . . . . . . . . . . . 8.5 *13.0 *13.2 *7.2 *5.9 12.9 *15.8 *4.7 12.7 16.9Pneumonia . . . . . . . . . . . . . . . . . . . . . . . . . . 14.1 *32.1 *5.8 *5.4 27.1 16.7 *23.5 *5.2 11.2 28.1Other respiratory conditions . . . . . . . . . . . . . . . . *3.9 *10.7 *5.0 *2.5 *3.1 6.5 *16.2 *3.2 *3.5 *10.0
Digestive system conditions . . . . . . . . . . . . . . . . 8.7 *10.0 *7.2 *8.4 *9.7 13.0 *13.1 *9.8 *10.6 17.7
Dental conditions . . . . . . . . . . . . . . . . . . . . . . *1.6 *3.6 *0.2 *2.9 *0.2 *1.8 *2.7 *1.9 *2.7 *0.4Indigestion, nausea, and vomiting . . . . . . . . . . . . *2.5 *2.1 *4.5 *1.7 *2.6 *2.9 *8.4 *5.1 *2.2 *1.4Other digestive conditions . . . . . . . . . . . . . . . . . *4.5 *4.3 *2.5 *3.9 *6.9 8.2 *2.0 *2.7 *5.6 15.8
Injuries . . . . . . . . . . . . . . . . . . . . . . . . . . . . . 44.6 *11.8 *21.1 56.3 53.1 53.6 *6.8 *21.0 52.1 83.9
Fractures and dislocations . . . . . . . . . . . . . . . . . 15.1 *– *10.3 15.2 22.6 16.1 *2.4 *6.5 *9.7 32.3Sprains and strains . . . . . . . . . . . . . . . . . . . . . 10.9 *1.5 *4.8 17.0 *8.8 13.2 *– *3.6 19.9 *13.1Open wounds and lacerations . . . . . . . . . . . . . . *1.6 *3.6 *1.9 *2.1 *– *1.9 *1.1 *3.7 *0.3 *3.1Contusions and superficial injuries . . . . . . . . . . . . *2.9 *1.0 *0.7 *4.8 *2.1 6.1 *– *4.2 *5.2 *9.6Other current injuries . . . . . . . . . . . . . . . . . . . . 14.1 *5.7 *3.5 17.1 19.5 16.3 *3.3 *3.1 16.9 25.7
Selected other acute conditions . . . . . . . . . . . . . 22.8 82.2 *16.4 11.5 26.6 57.1 70.4 46.2 64.1 51.4
Eye conditions . . . . . . . . . . . . . . . . . . . . . . . . *0.3 *– *0.3 *0.6 *– *0.2 *– *– *0.4 *–Acute ear infections . . . . . . . . . . . . . . . . . . . . . 6.7 *51.4 *8.9 *1.2 *0.5 7.8 *50.2 *11.1 *2.3 *3.2Other ear conditions . . . . . . . . . . . . . . . . . . . . *1.0 *8.5 *1.1 *– *0.2 *1.1 *– *0.8 *1.6 *0.9Acute urinary conditions . . . . . . . . . . . . . . . . . . *3.3 *1.0 *– *0.2 *10.7 9.5 *– *3.7 *10.8 *13.4Disorders of menstruation . . . . . . . . . . . . . . . . . . . . . . . . . . . . . . . . *0.8 . . . *1.4 *1.3 *0.1Other disorders of female genital tract . . . . . . . . . . . . . . . . . . . . . . . . *4.4 *– *4.2 *8.3 *0.6Delivery and other conditions of pregnancy andpuerperium . . . . . . . . . . . . . . . . . . . . . . . . . . . . . . . . . . . . . . . . 14.2 . . . *16.8 27.1 *–
Skin conditions . . . . . . . . . . . . . . . . . . . . . . . . *2.6 *4.2 *– *1.3 *5.9 *2.0 *2.1 *0.7 *0.9 *4.1Acute musculoskeletal conditions . . . . . . . . . . . . 5.3 *– *0.8 *5.6 *9.2 12.3 *– *0.2 *9.1 25.5Headache, excluding migraine . . . . . . . . . . . . . . *1.2 *– *1.7 *2.0 *0.1 *1.5 *– *3.0 *1.5 *1.1Fever, unspecified . . . . . . . . . . . . . . . . . . . . . . *2.4 *17.1 *3.7 *0.7 *– *3.3 *18.1 *4.2 *0.7 *2.6
All other acute conditions . . . . . . . . . . . . . . . . . 13.2 *13.0 *5.8 *9.1 24.2 30.6 *38.1 *11.6 24.6 46.8
NOTES: The standard errors and relative standard errors (RSE’s) can be computed by using parameter set II of table II, the frequencies of table 32, and the formula presented in rule 2 ofappendix I. Estimates for which the numerator has an RSE of more than 30 percent are indicated with an asterisk.
43

Table 28. Number of bed days associated with acute conditions per 100 persons per year, by race, age, and type of condition:United States, 1994[Data are based on household interviews of the civilian noninstitutionalized population. The survey design, general qualifications, and information on the reliability of theestimates are given in appendix I. Definitions of terms are given in appendix II]
Type of acute condition
White Black
Allages
Under18 years
18–44years
45 yearsand over
Allages
Under18 years
18–44years
45 yearsand over
Number of bed days per 100 persons per year
All acute conditions . . . . . . . . . . . . . . . . . . . . . 283.6 310.7 259.0 293.1 329.1 259.2 332.6 425.8
Infective and parasitic diseases . . . . . . . . . . . . . 31.0 67.9 22.2 13.3 44.3 55.2 *31.8 *51.2
Common childhood diseases . . . . . . . . . . . . . . . *2.1 *5.9 *1.4 *– *6.5 *16.0 *2.3 *–Intestinal virus, unspecified . . . . . . . . . . . . . . . . 4.9 11.4 *3.3 *1.9 *9.9 *8.6 *6.8 *17.6Viral infections, unspecified . . . . . . . . . . . . . . . . 8.8 20.5 *6.0 *3.2 18.4 *20.2 *14.5 *23.1Other . . . . . . . . . . . . . . . . . . . . . . . . . . . . . . 15.2 30.1 11.5 *8.2 *9.5 *10.5 *8.3 *10.6
Respiratory conditions . . . . . . . . . . . . . . . . . . . 132.3 159.8 120.4 125.8 131.4 116.4 141.7 134.4
Common cold . . . . . . . . . . . . . . . . . . . . . . . . 22.6 34.5 18.9 17.9 29.4 *33.5 *30.2 *22.1Other acute upper respiratory infections . . . . . . . . 12.4 21.5 10.5 *7.7 *9.5 *7.9 *14.0 *3.4Influenza . . . . . . . . . . . . . . . . . . . . . . . . . . . 65.2 76.0 68.4 52.7 68.4 *34.0 84.0 90.4Acute bronchitis . . . . . . . . . . . . . . . . . . . . . . . 10.9 *10.7 11.7 10.0 *6.5 *10.3 *2.6 *7.9Pneumonia . . . . . . . . . . . . . . . . . . . . . . . . . . 16.6 11.8 8.6 30.3 *11.4 *16.7 *10.1 *6.1Other respiratory conditions . . . . . . . . . . . . . . . . 4.8 *5.4 *2.3 *7.3 *6.2 *14.1 *0.7 *4.5
Digestive system conditions . . . . . . . . . . . . . . . . 10.2 *7.9 8.6 14.1 *16.4 *15.2 *18.2 *14.9
Dental conditions . . . . . . . . . . . . . . . . . . . . . . *1.4 *1.0 *2.6 *0.2 *4.5 *5.3 *5.5 *1.7Indigestion, nausea, and vomiting . . . . . . . . . . . . *2.5 *4.7 *1.7 *1.9 *4.0 *7.1 *3.0 *1.4Other digestive conditions . . . . . . . . . . . . . . . . . 6.3 *2.3 *4.3 12.1 *7.8 *2.7 *9.7 *11.9
Injuries . . . . . . . . . . . . . . . . . . . . . . . . . . . . . 49.8 20.4 55.5 65.8 53.3 *9.6 56.4 112.3
Fractures and dislocations . . . . . . . . . . . . . . . . . 16.8 *8.0 13.6 27.7 *10.9 *– *3.8 *40.1Sprains and strains . . . . . . . . . . . . . . . . . . . . . 12.3 *4.0 19.2 10.3 *13.9 *0.4 *20.2 *22.4Open wounds and lacerations . . . . . . . . . . . . . . *1.4 *1.9 *1.4 *0.9 *2.6 *7.0 *0.5 *–Contusions and superficial injuries . . . . . . . . . . . . 4.3 *1.9 *5.4 *4.8 *6.6 *1.7 *3.0 *20.4Other current injuries . . . . . . . . . . . . . . . . . . . . 15.0 *4.5 15.8 22.0 19.4 *0.5 *29.1 *29.4
Selected other acute conditions . . . . . . . . . . . . . 38.9 41.4 38.5 37.5 50.3 *45.8 44.4 *67.9
Eye conditions . . . . . . . . . . . . . . . . . . . . . . . . *0.1 *– *0.3 *– *0.9 *0.6 *1.5 *–Acute ear infections . . . . . . . . . . . . . . . . . . . . . 7.3 22.3 *2.0 *2.2 *9.3 *25.8 *1.0 *–Other ear conditions . . . . . . . . . . . . . . . . . . . . *1.3 *2.5 *1.0 *0.6 *– *– *– *–Acute urinary conditions . . . . . . . . . . . . . . . . . . 6.9 *1.8 *6.3 11.8 *5.8 *– *3.8 *17.9Disorders of menstruation . . . . . . . . . . . . . . . . . *0.4 *0.3 *0.7 *– *0.9 *1.5 *0.7 *0.5Other disorders of female genital tract . . . . . . . . . *2.0 *1.8 *3.8 *– *2.9 *– *5.1 *3.0Delivery and other conditions of pregnancy andpuerperium . . . . . . . . . . . . . . . . . . . . . . . . . 5.6 *1.2 12.8 *– *13.1 *6.9 *25.2 *–Skin conditions . . . . . . . . . . . . . . . . . . . . . . . . *2.3 *1.5 *0.9 *4.6 *1.1 *– *– *4.7Acute musculoskeletal conditions . . . . . . . . . . . . 9.0 *0.5 8.4 16.3 *10.7 *– *4.3 *38.2Headache, excluding migraine . . . . . . . . . . . . . . *1.2 *2.0 *1.5 *0.3 *2.0 *0.6 *2.4 *3.6Fever, unspecified . . . . . . . . . . . . . . . . . . . . . . *2.8 *7.5 *0.8 *1.6 *3.7 *10.4 *0.4 *–
All other acute conditions . . . . . . . . . . . . . . . . . 21.2 13.3 13.9 36.6 33.3 *17.1 *40.0 *45.1
NOTES: The standard errors and relative standard errors (RSE’s) can be computed by using parameter set II of table II, the frequencies of table 33, and the formula presented in rule 2 ofappendix I. Estimates for which the numerator has an RSE of more than 30 percent are indicated with an asterisk.
44

Table 29. Number of bed days associated with acute conditions per 100 persons per year, by family income, age, and type of condition:United States, 1994[Data are based on household interviews of the civilian noninstitutionalized population. The survey design, general qualifications, and information on the reliability of theestimates are given in appendix I. Definitions of terms are given in appendix II]
Type of acute condition
Family income
Less than $10,000 $10,000–$19,999
Allages
Under18 years
18–44years
45 yearsand over
Allages
Under18 years
18–44years
45 yearsand over
Number of bed days per 100 persons per year
All acute conditions . . . . . . . . . . . . . . . . . . . . . 480.6 302.9 453.1 700.2 357.9 332.9 321.7 418.2
Infective and parasitic diseases . . . . . . . . . . . . . 35.9 *43.9 *33.5 *30.9 33.0 64.6 *26.3 *15.8
Common childhood diseases . . . . . . . . . . . . . . . *2.5 *4.9 *2.6 *– *2.2 *5.3 *1.8 *–Intestinal virus, unspecified . . . . . . . . . . . . . . . . *4.3 *4.9 *2.1 *6.6 *5.5 *13.4 *4.8 *–Viral infections, unspecified . . . . . . . . . . . . . . . . *11.8 *22.1 *7.7 *6.8 *12.5 *24.0 *9.2 *7.0Other . . . . . . . . . . . . . . . . . . . . . . . . . . . . . . *17.3 *12.0 *21.1 *17.5 *13.0 *21.8 *10.5 *8.8
Respiratory conditions . . . . . . . . . . . . . . . . . . . 212.4 140.2 249.8 234.6 148.9 166.1 152.0 132.0
Common cold . . . . . . . . . . . . . . . . . . . . . . . . 41.9 *54.3 *49.0 *19.6 27.6 *42.3 *18.5 *26.2Other acute upper respiratory infections . . . . . . . . *14.4 *10.8 *17.3 *14.3 *13.2 *16.1 *17.9 *5.5Influenza . . . . . . . . . . . . . . . . . . . . . . . . . . . 108.0 *47.4 146.7 116.6 66.0 *52.3 91.9 47.9Acute bronchitis . . . . . . . . . . . . . . . . . . . . . . . *9.7 *8.2 *12.3 *7.4 *15.3 *21.6 *10.2 *16.2Pneumonia . . . . . . . . . . . . . . . . . . . . . . . . . . *22.3 *8.6 *13.1 *49.0 17.5 *12.3 *10.6 *29.3Other respiratory conditions . . . . . . . . . . . . . . . . *16.1 *11.0 *11.3 *27.7 *9.3 *21.5 *2.8 *6.9
Digestive system conditions . . . . . . . . . . . . . . . . *22.1 *10.6 *21.9 *34.2 17.2 *16.9 *14.5 *20.5
Dental conditions . . . . . . . . . . . . . . . . . . . . . . *3.9 *6.0 *3.9 *1.8 *2.1 *6.0 *1.3 *–Indigestion, nausea, and vomiting . . . . . . . . . . . . *3.5 *1.8 *3.8 *4.8 *5.1 *8.5 *5.2 *2.4Other digestive conditions . . . . . . . . . . . . . . . . . *14.7 *2.8 *14.3 *27.5 *10.0 *2.4 *8.0 *18.1
Injuries . . . . . . . . . . . . . . . . . . . . . . . . . . . . . 90.7 *26.6 *53.6 207.3 72.3 *29.9 80.4 96.7
Fractures and dislocations . . . . . . . . . . . . . . . . . *20.5 *3.5 *5.3 *58.8 27.5 *18.3 *17.9 *45.4Sprains and strains . . . . . . . . . . . . . . . . . . . . . *20.7 *5.3 *24.4 *31.5 21.1 *3.9 *25.2 *30.1Open wounds and lacerations . . . . . . . . . . . . . . *4.4 *10.6 *2.9 *– *0.6 *1.6 *0.4 *–Contusions and superficial injuries . . . . . . . . . . . . *8.7 *0.9 *6.1 *20.5 *4.7 *4.9 *5.0 *4.2Other current injuries . . . . . . . . . . . . . . . . . . . . 36.3 *6.3 *14.9 96.6 18.4 *1.1 *31.9 *17.0
Selected other acute conditions . . . . . . . . . . . . . 55.8 *59.4 *45.0 *66.7 56.1 *46.0 *41.5 80.5
Eye conditions . . . . . . . . . . . . . . . . . . . . . . . . *0.3 *1.0 *– *– *– *– *– *–Acute ear infections . . . . . . . . . . . . . . . . . . . . . *8.9 *27.8 *– *1.9 *10.4 *36.3 *1.5 *–Other ear conditions . . . . . . . . . . . . . . . . . . . . *0.6 *2.1 *– *– *0.5 *0.6 *0.9 *–Acute urinary conditions . . . . . . . . . . . . . . . . . . *8.4 *1.4 *5.2 *19.9 *7.8 *– *7.4 *14.4Disorders of menstruation . . . . . . . . . . . . . . . . . *– *– *– *– *– *– *– *–Other disorders of female genital tract . . . . . . . . . *2.6 *– *6.4 *– *3.0 *0.6 *5.8 *1.8Delivery and other conditions of pregnancy andpuerperium . . . . . . . . . . . . . . . . . . . . . . . . . *8.8 *14.1 *11.2 *– *5.1 *0.5 *13.0 *–Skin conditions . . . . . . . . . . . . . . . . . . . . . . . . *1.2 *– *3.0 *– *6.0 *– *2.1 *15.1Acute musculoskeletal conditions . . . . . . . . . . . . *17.6 *– *15.2 *38.8 20.2 *– *10.3 47.3Headache, excluding migraine . . . . . . . . . . . . . . *1.6 *0.6 *2.2 *1.7 *0.4 *0.7 *0.4 *–Fever, unspecified . . . . . . . . . . . . . . . . . . . . . . *5.8 *12.4 *1.8 *4.5 *2.6 *7.4 *– *1.8
All other acute conditions . . . . . . . . . . . . . . . . . 63.8 *22.0 *49.3 126.4 30.4 *9.5 *7.1 72.8
See notes at end of table.
45

Table 29. Number of bed days associated with acute conditions per 100 persons per year, by family income, age, and type of condition:United States, 1994—Con.[Data are based on household interviews of the civilian noninstitutionalized population. The survey design, general qualifications, and information on the reliability of theestimates are given in appendix I. Definitions of terms are given in appendix II]
Type of acute condition
Family income
$20,000–$34,999 $35,000 or more
Allages
Under18 years
18–44years
45 yearsand over
Allages
Under18 years
18–44years
45 yearsand over
Number of bed days per 100 persons per year
All acute conditions . . . . . . . . . . . . . . . . . . . . . 276.6 338.1 281.5 214.5 226.8 270.4 204.7 217.9
Infective and parasitic diseases . . . . . . . . . . . . . 33.9 75.0 25.6 *9.3 27.7 60.6 17.2 *11.4
Common childhood diseases . . . . . . . . . . . . . . . *1.8 *6.7 *– *– *2.5 *6.1 *1.7 *–Intestinal virus, unspecified . . . . . . . . . . . . . . . . *6.6 *13.6 *4.3 *3.7 *4.9 *10.8 *2.5 *2.7Viral infections, unspecified . . . . . . . . . . . . . . . . 11.2 *24.3 *9.4 *2.0 7.2 *14.2 *4.1 *4.9Other . . . . . . . . . . . . . . . . . . . . . . . . . . . . . . 14.3 *30.3 *11.9 *3.6 13.2 29.4 *8.8 *3.8
Respiratory conditions . . . . . . . . . . . . . . . . . . . 129.1 170.9 116.5 110.0 114.6 138.1 105.9 104.9
Common cold . . . . . . . . . . . . . . . . . . . . . . . . 23.0 *29.4 *19.0 *23.0 21.0 28.7 16.9 *19.7Other acute upper respiratory infections . . . . . . . . 14.4 *28.3 *12.9 *4.1 10.9 *18.5 *8.9 *6.6Influenza . . . . . . . . . . . . . . . . . . . . . . . . . . . 67.1 85.8 67.4 49.9 59.9 75.8 56.7 48.9Acute bronchitis . . . . . . . . . . . . . . . . . . . . . . . *7.5 *9.0 *5.5 *9.0 11.8 *9.5 *13.2 *11.9Pneumonia . . . . . . . . . . . . . . . . . . . . . . . . . . *9.9 *9.7 *8.2 *12.4 9.7 *4.8 *7.9 *17.4Other respiratory conditions . . . . . . . . . . . . . . . . *7.3 *8.6 *3.4 *11.6 *1.3 *0.8 *2.2 *0.4
Digestive system conditions . . . . . . . . . . . . . . . . *6.0 *5.1 *7.3 *5.0 7.8 *6.3 *8.0 *9.1
Dental conditions . . . . . . . . . . . . . . . . . . . . . . *0.8 *0.6 *1.5 *– *1.4 *0.2 *2.9 *0.4Indigestion, nausea, and vomiting . . . . . . . . . . . . *1.7 *3.0 *1.3 *1.1 *1.8 *3.4 *1.4 *0.7Other digestive conditions . . . . . . . . . . . . . . . . . *3.5 *1.5 *4.4 *3.9 *4.7 *2.7 *3.7 *8.0
Injuries . . . . . . . . . . . . . . . . . . . . . . . . . . . . . 49.4 *17.5 80.6 *32.5 26.8 *12.9 22.7 46.6
Fractures and dislocations . . . . . . . . . . . . . . . . . 15.4 *9.1 *19.5 *15.1 *5.5 *1.8 *4.1 *11.3Sprains and strains . . . . . . . . . . . . . . . . . . . . . 13.8 *1.0 29.4 *2.5 7.9 *3.1 *10.7 *8.5Open wounds and lacerations . . . . . . . . . . . . . . *1.8 *3.3 *– *3.3 *1.3 *1.0 *2.1 *0.5Contusions and superficial injuries . . . . . . . . . . . . *5.5 *3.7 *10.3 *– *3.1 *0.4 *2.2 *7.3Other current injuries . . . . . . . . . . . . . . . . . . . . 12.9 *0.4 *21.4 *11.7 8.9 *6.6 *3.7 *19.0
Selected other acute conditions . . . . . . . . . . . . . 35.8 46.3 36.4 *25.4 37.7 44.3 36.7 32.5
Eye conditions . . . . . . . . . . . . . . . . . . . . . . . . *0.4 *– *0.9 *– *0.1 *– *0.3 *–Acute ear infections . . . . . . . . . . . . . . . . . . . . . *7.6 *24.8 *1.0 *1.8 7.3 *17.5 *3.3 *3.5Other ear conditions . . . . . . . . . . . . . . . . . . . . *2.2 *2.1 *1.8 *2.8 *1.2 *3.0 *0.8 *–Acute urinary conditions . . . . . . . . . . . . . . . . . . *5.0 *– *5.9 *8.3 *4.9 *0.4 *3.4 *11.8Disorders of menstruation . . . . . . . . . . . . . . . . . *0.7 *1.5 *0.6 *– *0.5 *0.4 *0.7 *0.1Other disorders of female genital tract . . . . . . . . . *2.1 *– *4.6 *0.3 *2.2 *3.4 *3.0 *–Delivery and other conditions of pregnancy andpuerperium . . . . . . . . . . . . . . . . . . . . . . . . . *5.5 *4.3 *10.0 *– 10.5 *8.1 19.0 *–Skin conditions . . . . . . . . . . . . . . . . . . . . . . . . *2.3 *– *2.6 *3.9 *1.5 *3.0 *– *2.4Acute musculoskeletal conditions . . . . . . . . . . . . *6.0 *0.4 *7.9 *8.1 6.3 *0.4 *5.6 *13.2Headache, excluding migraine . . . . . . . . . . . . . . *1.2 *2.6 *1.1 *0.3 *0.9 *2.0 *0.3 *0.9Fever, unspecified . . . . . . . . . . . . . . . . . . . . . . *2.9 *10.7 *– *– *2.1 *6.2 *0.5 *0.6
All other acute conditions . . . . . . . . . . . . . . . . . 22.4 *23.3 *15.2 *32.1 12.3 *8.1 14.1 *13.6
NOTES: The standard errors and relative standard errors (RSE’s) can be computed by using parameter sets II and X of table II, the frequencies of tables 34 and 78, and the formula presented inrule 4 of appendix I. Estimates for which the numerator has an RSE of more than 30 percent are indicated with an asterisk.
46

Table 30. Number of bed days associated with acute conditions per 100 persons per year, by geographic region, place of residence, andtype of condition: United States, 1994[Data are based on household interviews of the civilian noninstitutionalized population. The survey design, general qualifications, and information on the reliability of theestimates are given in appendix I. Definitions of terms are given in appendix II]
Type of acute condition
Place of residence
Geographic region MSA1
Northeast Midwest South WestAll
MSA1Centralcity
Notcentralcity
NotMSA1
Number of bed days per 100 persons per year
All acute conditions . . . . . . . . . . . . . . . . . . . . . 247.8 278.2 274.7 352.4 284.4 292.7 279.1 299.0
Infective and parasitic diseases . . . . . . . . . . . . . 32.4 25.1 36.1 32.4 31.7 28.3 34.0 32.3
Common childhood diseases . . . . . . . . . . . . . . . *1.2 *1.7 *3.5 *3.4 *2.4 *2.0 *2.7 *3.3Intestinal virus, unspecified . . . . . . . . . . . . . . . . *9.3 *2.3 7.6 *2.3 5.8 *5.6 5.9 *4.2Viral infections, unspecified . . . . . . . . . . . . . . . . *9.6 *5.8 13.8 *8.7 9.6 9.9 9.5 10.9Other . . . . . . . . . . . . . . . . . . . . . . . . . . . . . . 12.3 15.2 11.2 17.9 13.9 10.8 15.9 13.9
Respiratory conditions . . . . . . . . . . . . . . . . . . . 118.3 133.9 111.0 178.9 135.0 135.0 135.0 126.4
Common cold . . . . . . . . . . . . . . . . . . . . . . . . 25.0 22.6 18.0 33.9 24.8 30.1 21.3 21.4Other acute upper respiratory infections . . . . . . . . *11.7 11.0 14.1 11.1 12.2 10.9 13.0 12.2Influenza . . . . . . . . . . . . . . . . . . . . . . . . . . . 44.1 70.5 57.6 90.8 67.0 65.1 68.2 60.2Acute bronchitis . . . . . . . . . . . . . . . . . . . . . . . *8.8 10.3 10.6 13.3 10.8 *7.2 13.0 10.7Pneumonia . . . . . . . . . . . . . . . . . . . . . . . . . . 25.1 14.4 7.2 20.5 14.9 17.0 13.6 17.1Other respiratory conditions . . . . . . . . . . . . . . . . *3.6 *5.1 *3.5 *9.3 5.4 *4.7 5.8 *4.7
Digestive system conditions . . . . . . . . . . . . . . . . *4.9 9.6 13.9 12.9 10.5 15.7 7.1 12.4
Dental conditions . . . . . . . . . . . . . . . . . . . . . . *2.4 *1.3 *2.3 *0.7 *1.8 *3.1 *1.1 *1.2Indigestion, nausea, and vomiting . . . . . . . . . . . . *1.0 *2.1 *3.7 *3.5 *2.6 *3.7 *1.9 *3.2Other digestive conditions . . . . . . . . . . . . . . . . . *1.5 *6.2 7.9 *8.7 6.0 8.9 *4.1 *8.0
Injuries . . . . . . . . . . . . . . . . . . . . . . . . . . . . . 42.4 43.1 49.1 62.1 46.3 43.9 47.9 59.6
Fractures and dislocations . . . . . . . . . . . . . . . . . 18.9 10.6 16.2 17.4 13.7 10.4 15.9 22.4Sprains and strains . . . . . . . . . . . . . . . . . . . . . 14.7 12.0 9.5 13.8 12.2 12.2 12.3 11.4Open wounds and lacerations . . . . . . . . . . . . . . *0.5 *3.4 *0.5 *2.9 *1.8 *2.7 *1.2 *1.6Contusions and superficial injuries . . . . . . . . . . . . *1.5 *2.4 *6.2 *6.9 4.2 *4.5 *3.9 *5.8Other current injuries . . . . . . . . . . . . . . . . . . . . *6.7 14.8 16.6 21.1 14.4 14.1 14.6 18.3
Selected other acute conditions . . . . . . . . . . . . . 36.4 39.0 40.5 45.2 40.0 42.9 38.1 41.9
Eye conditions . . . . . . . . . . . . . . . . . . . . . . . . *0.4 *0.1 *0.2 *0.3 *0.3 *0.4 *0.2 *–Acute ear infections . . . . . . . . . . . . . . . . . . . . . *4.9 *5.1 7.5 11.4 7.0 *7.0 6.9 *8.3Other ear conditions . . . . . . . . . . . . . . . . . . . . *0.1 *0.7 *2.1 *0.6 *0.7 *0.3 *0.9 *2.4Acute urinary conditions . . . . . . . . . . . . . . . . . . *5.8 *5.6 10.2 *2.6 6.4 *7.3 5.9 *6.9Disorders of menstruation . . . . . . . . . . . . . . . . . *0.1 *0.2 *1.0 *– *0.4 *0.7 *0.2 *0.4Other disorders of female genital tract . . . . . . . . . *0.6 *2.7 *1.8 *3.8 *1.8 *2.2 *1.6 *3.8Delivery and other conditions of pregnancy andpuerperium . . . . . . . . . . . . . . . . . . . . . . . . . *6.6 *8.2 *6.1 *8.7 8.7 8.2 9.1 *2.1Skin conditions . . . . . . . . . . . . . . . . . . . . . . . . *1.7 *3.2 *2.1 *2.3 *2.3 *4.0 *1.3 *2.2Acute musculoskeletal conditions . . . . . . . . . . . . *8.6 10.4 7.6 *9.4 7.5 *6.7 8.0 13.8Headache, excluding migraine . . . . . . . . . . . . . . *2.2 *0.7 *1.1 *1.7 *1.5 *2.2 *1.1 *0.8Fever, unspecified . . . . . . . . . . . . . . . . . . . . . . *5.4 *2.2 *0.9 *4.4 3.4 *4.1 *2.9 *1.1
All other acute conditions . . . . . . . . . . . . . . . . . 13.4 27.5 24.1 20.9 20.9 26.9 17.1 26.4
1MSA is metropolitan statistical area.
NOTES: The standard errors and relative standard errors (RSE’s) can be computed by using parameter sets II and X of table II, the frequencies of tables 35 and 78, and the formula presented inrule 4 of appendix I. Estimates for which the numerator has an RSE of more than 30 percent are indicated with an asterisk.
47
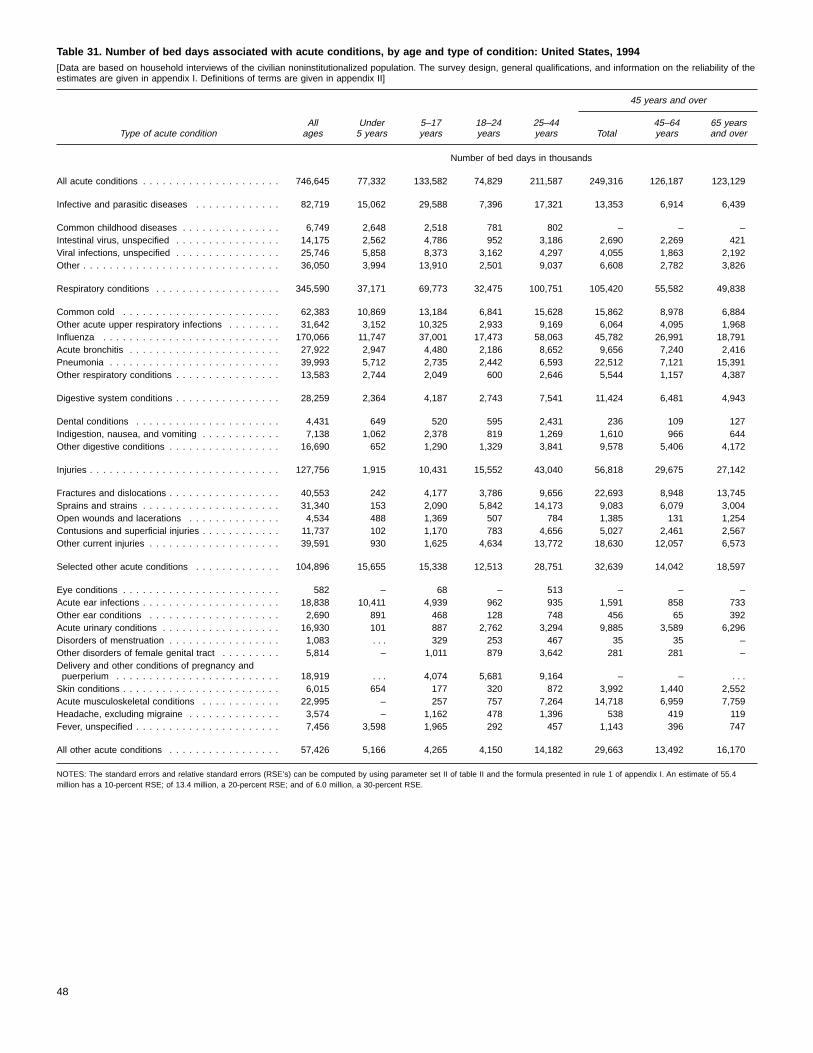
Table 31. Number of bed days associated with acute conditions, by age and type of condition: United States, 1994[Data are based on household interviews of the civilian noninstitutionalized population. The survey design, general qualifications, and information on the reliability of theestimates are given in appendix I. Definitions of terms are given in appendix II]
Type of acute condition
45 years and over
Allages
Under5 years
5–17years
18–24years
25–44years Total
45–64years
65 yearsand over
Number of bed days in thousands
All acute conditions . . . . . . . . . . . . . . . . . . . . . 746,645 77,332 133,582 74,829 211,587 249,316 126,187 123,129
Infective and parasitic diseases . . . . . . . . . . . . . 82,719 15,062 29,588 7,396 17,321 13,353 6,914 6,439
Common childhood diseases . . . . . . . . . . . . . . . 6,749 2,648 2,518 781 802 – – –Intestinal virus, unspecified . . . . . . . . . . . . . . . . 14,175 2,562 4,786 952 3,186 2,690 2,269 421Viral infections, unspecified . . . . . . . . . . . . . . . . 25,746 5,858 8,373 3,162 4,297 4,055 1,863 2,192Other . . . . . . . . . . . . . . . . . . . . . . . . . . . . . . 36,050 3,994 13,910 2,501 9,037 6,608 2,782 3,826
Respiratory conditions . . . . . . . . . . . . . . . . . . . 345,590 37,171 69,773 32,475 100,751 105,420 55,582 49,838
Common cold . . . . . . . . . . . . . . . . . . . . . . . . 62,383 10,869 13,184 6,841 15,628 15,862 8,978 6,884Other acute upper respiratory infections . . . . . . . . 31,642 3,152 10,325 2,933 9,169 6,064 4,095 1,968Influenza . . . . . . . . . . . . . . . . . . . . . . . . . . . 170,066 11,747 37,001 17,473 58,063 45,782 26,991 18,791Acute bronchitis . . . . . . . . . . . . . . . . . . . . . . . 27,922 2,947 4,480 2,186 8,652 9,656 7,240 2,416Pneumonia . . . . . . . . . . . . . . . . . . . . . . . . . . 39,993 5,712 2,735 2,442 6,593 22,512 7,121 15,391Other respiratory conditions . . . . . . . . . . . . . . . . 13,583 2,744 2,049 600 2,646 5,544 1,157 4,387
Digestive system conditions . . . . . . . . . . . . . . . . 28,259 2,364 4,187 2,743 7,541 11,424 6,481 4,943
Dental conditions . . . . . . . . . . . . . . . . . . . . . . 4,431 649 520 595 2,431 236 109 127Indigestion, nausea, and vomiting . . . . . . . . . . . . 7,138 1,062 2,378 819 1,269 1,610 966 644Other digestive conditions . . . . . . . . . . . . . . . . . 16,690 652 1,290 1,329 3,841 9,578 5,406 4,172
Injuries . . . . . . . . . . . . . . . . . . . . . . . . . . . . . 127,756 1,915 10,431 15,552 43,040 56,818 29,675 27,142
Fractures and dislocations . . . . . . . . . . . . . . . . . 40,553 242 4,177 3,786 9,656 22,693 8,948 13,745Sprains and strains . . . . . . . . . . . . . . . . . . . . . 31,340 153 2,090 5,842 14,173 9,083 6,079 3,004Open wounds and lacerations . . . . . . . . . . . . . . 4,534 488 1,369 507 784 1,385 131 1,254Contusions and superficial injuries . . . . . . . . . . . . 11,737 102 1,170 783 4,656 5,027 2,461 2,567Other current injuries . . . . . . . . . . . . . . . . . . . . 39,591 930 1,625 4,634 13,772 18,630 12,057 6,573
Selected other acute conditions . . . . . . . . . . . . . 104,896 15,655 15,338 12,513 28,751 32,639 14,042 18,597
Eye conditions . . . . . . . . . . . . . . . . . . . . . . . . 582 – 68 – 513 – – –Acute ear infections . . . . . . . . . . . . . . . . . . . . . 18,838 10,411 4,939 962 935 1,591 858 733Other ear conditions . . . . . . . . . . . . . . . . . . . . 2,690 891 468 128 748 456 65 392Acute urinary conditions . . . . . . . . . . . . . . . . . . 16,930 101 887 2,762 3,294 9,885 3,589 6,296Disorders of menstruation . . . . . . . . . . . . . . . . . 1,083 . . . 329 253 467 35 35 –Other disorders of female genital tract . . . . . . . . . 5,814 – 1,011 879 3,642 281 281 –Delivery and other conditions of pregnancy andpuerperium . . . . . . . . . . . . . . . . . . . . . . . . . 18,919 . . . 4,074 5,681 9,164 – – . . .Skin conditions . . . . . . . . . . . . . . . . . . . . . . . . 6,015 654 177 320 872 3,992 1,440 2,552Acute musculoskeletal conditions . . . . . . . . . . . . 22,995 – 257 757 7,264 14,718 6,959 7,759Headache, excluding migraine . . . . . . . . . . . . . . 3,574 – 1,162 478 1,396 538 419 119Fever, unspecified . . . . . . . . . . . . . . . . . . . . . . 7,456 3,598 1,965 292 457 1,143 396 747
All other acute conditions . . . . . . . . . . . . . . . . . 57,426 5,166 4,265 4,150 14,182 29,663 13,492 16,170
NOTES: The standard errors and relative standard errors (RSE’s) can be computed by using parameter set II of table II and the formula presented in rule 1 of appendix I. An estimate of 55.4million has a 10-percent RSE; of 13.4 million, a 20-percent RSE; and of 6.0 million, a 30-percent RSE.
48
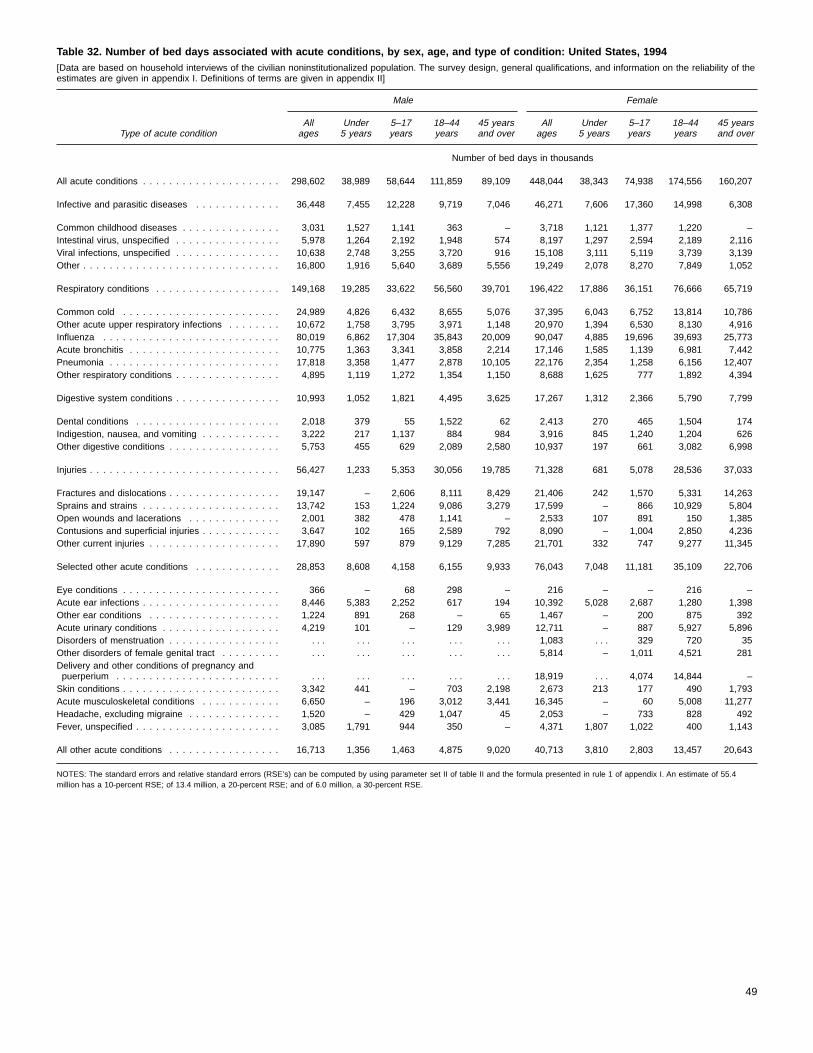
Table 32. Number of bed days associated with acute conditions, by sex, age, and type of condition: United States, 1994[Data are based on household interviews of the civilian noninstitutionalized population. The survey design, general qualifications, and information on the reliability of theestimates are given in appendix I. Definitions of terms are given in appendix II]
Type of acute condition
Male Female
Allages
Under5 years
5–17years
18–44years
45 yearsand over
Allages
Under5 years
5–17years
18–44years
45 yearsand over
Number of bed days in thousands
All acute conditions . . . . . . . . . . . . . . . . . . . . . 298,602 38,989 58,644 111,859 89,109 448,044 38,343 74,938 174,556 160,207
Infective and parasitic diseases . . . . . . . . . . . . . 36,448 7,455 12,228 9,719 7,046 46,271 7,606 17,360 14,998 6,308
Common childhood diseases . . . . . . . . . . . . . . . 3,031 1,527 1,141 363 – 3,718 1,121 1,377 1,220 –Intestinal virus, unspecified . . . . . . . . . . . . . . . . 5,978 1,264 2,192 1,948 574 8,197 1,297 2,594 2,189 2,116Viral infections, unspecified . . . . . . . . . . . . . . . . 10,638 2,748 3,255 3,720 916 15,108 3,111 5,119 3,739 3,139Other . . . . . . . . . . . . . . . . . . . . . . . . . . . . . . 16,800 1,916 5,640 3,689 5,556 19,249 2,078 8,270 7,849 1,052
Respiratory conditions . . . . . . . . . . . . . . . . . . . 149,168 19,285 33,622 56,560 39,701 196,422 17,886 36,151 76,666 65,719
Common cold . . . . . . . . . . . . . . . . . . . . . . . . 24,989 4,826 6,432 8,655 5,076 37,395 6,043 6,752 13,814 10,786Other acute upper respiratory infections . . . . . . . . 10,672 1,758 3,795 3,971 1,148 20,970 1,394 6,530 8,130 4,916Influenza . . . . . . . . . . . . . . . . . . . . . . . . . . . 80,019 6,862 17,304 35,843 20,009 90,047 4,885 19,696 39,693 25,773Acute bronchitis . . . . . . . . . . . . . . . . . . . . . . . 10,775 1,363 3,341 3,858 2,214 17,146 1,585 1,139 6,981 7,442Pneumonia . . . . . . . . . . . . . . . . . . . . . . . . . . 17,818 3,358 1,477 2,878 10,105 22,176 2,354 1,258 6,156 12,407Other respiratory conditions . . . . . . . . . . . . . . . . 4,895 1,119 1,272 1,354 1,150 8,688 1,625 777 1,892 4,394
Digestive system conditions . . . . . . . . . . . . . . . . 10,993 1,052 1,821 4,495 3,625 17,267 1,312 2,366 5,790 7,799
Dental conditions . . . . . . . . . . . . . . . . . . . . . . 2,018 379 55 1,522 62 2,413 270 465 1,504 174Indigestion, nausea, and vomiting . . . . . . . . . . . . 3,222 217 1,137 884 984 3,916 845 1,240 1,204 626Other digestive conditions . . . . . . . . . . . . . . . . . 5,753 455 629 2,089 2,580 10,937 197 661 3,082 6,998
Injuries . . . . . . . . . . . . . . . . . . . . . . . . . . . . . 56,427 1,233 5,353 30,056 19,785 71,328 681 5,078 28,536 37,033
Fractures and dislocations . . . . . . . . . . . . . . . . . 19,147 – 2,606 8,111 8,429 21,406 242 1,570 5,331 14,263Sprains and strains . . . . . . . . . . . . . . . . . . . . . 13,742 153 1,224 9,086 3,279 17,599 – 866 10,929 5,804Open wounds and lacerations . . . . . . . . . . . . . . 2,001 382 478 1,141 – 2,533 107 891 150 1,385Contusions and superficial injuries . . . . . . . . . . . . 3,647 102 165 2,589 792 8,090 – 1,004 2,850 4,236Other current injuries . . . . . . . . . . . . . . . . . . . . 17,890 597 879 9,129 7,285 21,701 332 747 9,277 11,345
Selected other acute conditions . . . . . . . . . . . . . 28,853 8,608 4,158 6,155 9,933 76,043 7,048 11,181 35,109 22,706
Eye conditions . . . . . . . . . . . . . . . . . . . . . . . . 366 – 68 298 – 216 – – 216 –Acute ear infections . . . . . . . . . . . . . . . . . . . . . 8,446 5,383 2,252 617 194 10,392 5,028 2,687 1,280 1,398Other ear conditions . . . . . . . . . . . . . . . . . . . . 1,224 891 268 – 65 1,467 – 200 875 392Acute urinary conditions . . . . . . . . . . . . . . . . . . 4,219 101 – 129 3,989 12,711 – 887 5,927 5,896Disorders of menstruation . . . . . . . . . . . . . . . . . . . . . . . . . . . . . . . . 1,083 . . . 329 720 35Other disorders of female genital tract . . . . . . . . . . . . . . . . . . . . . . . . 5,814 – 1,011 4,521 281Delivery and other conditions of pregnancy andpuerperium . . . . . . . . . . . . . . . . . . . . . . . . . . . . . . . . . . . . . . . . 18,919 . . . 4,074 14,844 –Skin conditions . . . . . . . . . . . . . . . . . . . . . . . . 3,342 441 – 703 2,198 2,673 213 177 490 1,793Acute musculoskeletal conditions . . . . . . . . . . . . 6,650 – 196 3,012 3,441 16,345 – 60 5,008 11,277Headache, excluding migraine . . . . . . . . . . . . . . 1,520 – 429 1,047 45 2,053 – 733 828 492Fever, unspecified . . . . . . . . . . . . . . . . . . . . . . 3,085 1,791 944 350 – 4,371 1,807 1,022 400 1,143
All other acute conditions . . . . . . . . . . . . . . . . . 16,713 1,356 1,463 4,875 9,020 40,713 3,810 2,803 13,457 20,643
NOTES: The standard errors and relative standard errors (RSE’s) can be computed by using parameter set II of table II and the formula presented in rule 1 of appendix I. An estimate of 55.4million has a 10-percent RSE; of 13.4 million, a 20-percent RSE; and of 6.0 million, a 30-percent RSE.
49
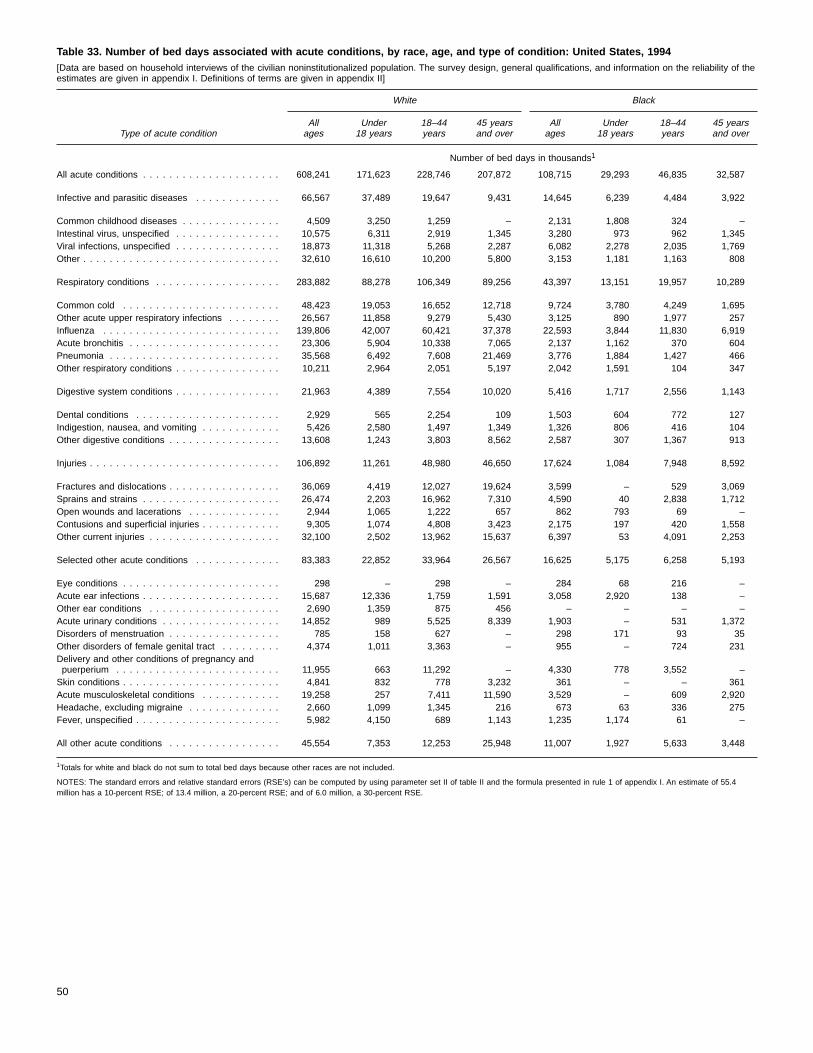
Table 33. Number of bed days associated with acute conditions, by race, age, and type of condition: United States, 1994[Data are based on household interviews of the civilian noninstitutionalized population. The survey design, general qualifications, and information on the reliability of theestimates are given in appendix I. Definitions of terms are given in appendix II]
Type of acute condition
White Black
Allages
Under18 years
18–44years
45 yearsand over
Allages
Under18 years
18–44years
45 yearsand over
Number of bed days in thousands1
All acute conditions . . . . . . . . . . . . . . . . . . . . . 608,241 171,623 228,746 207,872 108,715 29,293 46,835 32,587
Infective and parasitic diseases . . . . . . . . . . . . . 66,567 37,489 19,647 9,431 14,645 6,239 4,484 3,922
Common childhood diseases . . . . . . . . . . . . . . . 4,509 3,250 1,259 – 2,131 1,808 324 –Intestinal virus, unspecified . . . . . . . . . . . . . . . . 10,575 6,311 2,919 1,345 3,280 973 962 1,345Viral infections, unspecified . . . . . . . . . . . . . . . . 18,873 11,318 5,268 2,287 6,082 2,278 2,035 1,769Other . . . . . . . . . . . . . . . . . . . . . . . . . . . . . . 32,610 16,610 10,200 5,800 3,153 1,181 1,163 808
Respiratory conditions . . . . . . . . . . . . . . . . . . . 283,882 88,278 106,349 89,256 43,397 13,151 19,957 10,289
Common cold . . . . . . . . . . . . . . . . . . . . . . . . 48,423 19,053 16,652 12,718 9,724 3,780 4,249 1,695Other acute upper respiratory infections . . . . . . . . 26,567 11,858 9,279 5,430 3,125 890 1,977 257Influenza . . . . . . . . . . . . . . . . . . . . . . . . . . . 139,806 42,007 60,421 37,378 22,593 3,844 11,830 6,919Acute bronchitis . . . . . . . . . . . . . . . . . . . . . . . 23,306 5,904 10,338 7,065 2,137 1,162 370 604Pneumonia . . . . . . . . . . . . . . . . . . . . . . . . . . 35,568 6,492 7,608 21,469 3,776 1,884 1,427 466Other respiratory conditions . . . . . . . . . . . . . . . . 10,211 2,964 2,051 5,197 2,042 1,591 104 347
Digestive system conditions . . . . . . . . . . . . . . . . 21,963 4,389 7,554 10,020 5,416 1,717 2,556 1,143
Dental conditions . . . . . . . . . . . . . . . . . . . . . . 2,929 565 2,254 109 1,503 604 772 127Indigestion, nausea, and vomiting . . . . . . . . . . . . 5,426 2,580 1,497 1,349 1,326 806 416 104Other digestive conditions . . . . . . . . . . . . . . . . . 13,608 1,243 3,803 8,562 2,587 307 1,367 913
Injuries . . . . . . . . . . . . . . . . . . . . . . . . . . . . . 106,892 11,261 48,980 46,650 17,624 1,084 7,948 8,592
Fractures and dislocations . . . . . . . . . . . . . . . . . 36,069 4,419 12,027 19,624 3,599 – 529 3,069Sprains and strains . . . . . . . . . . . . . . . . . . . . . 26,474 2,203 16,962 7,310 4,590 40 2,838 1,712Open wounds and lacerations . . . . . . . . . . . . . . 2,944 1,065 1,222 657 862 793 69 –Contusions and superficial injuries . . . . . . . . . . . . 9,305 1,074 4,808 3,423 2,175 197 420 1,558Other current injuries . . . . . . . . . . . . . . . . . . . . 32,100 2,502 13,962 15,637 6,397 53 4,091 2,253
Selected other acute conditions . . . . . . . . . . . . . 83,383 22,852 33,964 26,567 16,625 5,175 6,258 5,193
Eye conditions . . . . . . . . . . . . . . . . . . . . . . . . 298 – 298 – 284 68 216 –Acute ear infections . . . . . . . . . . . . . . . . . . . . . 15,687 12,336 1,759 1,591 3,058 2,920 138 –Other ear conditions . . . . . . . . . . . . . . . . . . . . 2,690 1,359 875 456 – – – –Acute urinary conditions . . . . . . . . . . . . . . . . . . 14,852 989 5,525 8,339 1,903 – 531 1,372Disorders of menstruation . . . . . . . . . . . . . . . . . 785 158 627 – 298 171 93 35Other disorders of female genital tract . . . . . . . . . 4,374 1,011 3,363 – 955 – 724 231Delivery and other conditions of pregnancy andpuerperium . . . . . . . . . . . . . . . . . . . . . . . . . 11,955 663 11,292 – 4,330 778 3,552 –Skin conditions . . . . . . . . . . . . . . . . . . . . . . . . 4,841 832 778 3,232 361 – – 361Acute musculoskeletal conditions . . . . . . . . . . . . 19,258 257 7,411 11,590 3,529 – 609 2,920Headache, excluding migraine . . . . . . . . . . . . . . 2,660 1,099 1,345 216 673 63 336 275Fever, unspecified . . . . . . . . . . . . . . . . . . . . . . 5,982 4,150 689 1,143 1,235 1,174 61 –
All other acute conditions . . . . . . . . . . . . . . . . . 45,554 7,353 12,253 25,948 11,007 1,927 5,633 3,448
1Totals for white and black do not sum to total bed days because other races are not included.
NOTES: The standard errors and relative standard errors (RSE’s) can be computed by using parameter set II of table II and the formula presented in rule 1 of appendix I. An estimate of 55.4million has a 10-percent RSE; of 13.4 million, a 20-percent RSE; and of 6.0 million, a 30-percent RSE.
50
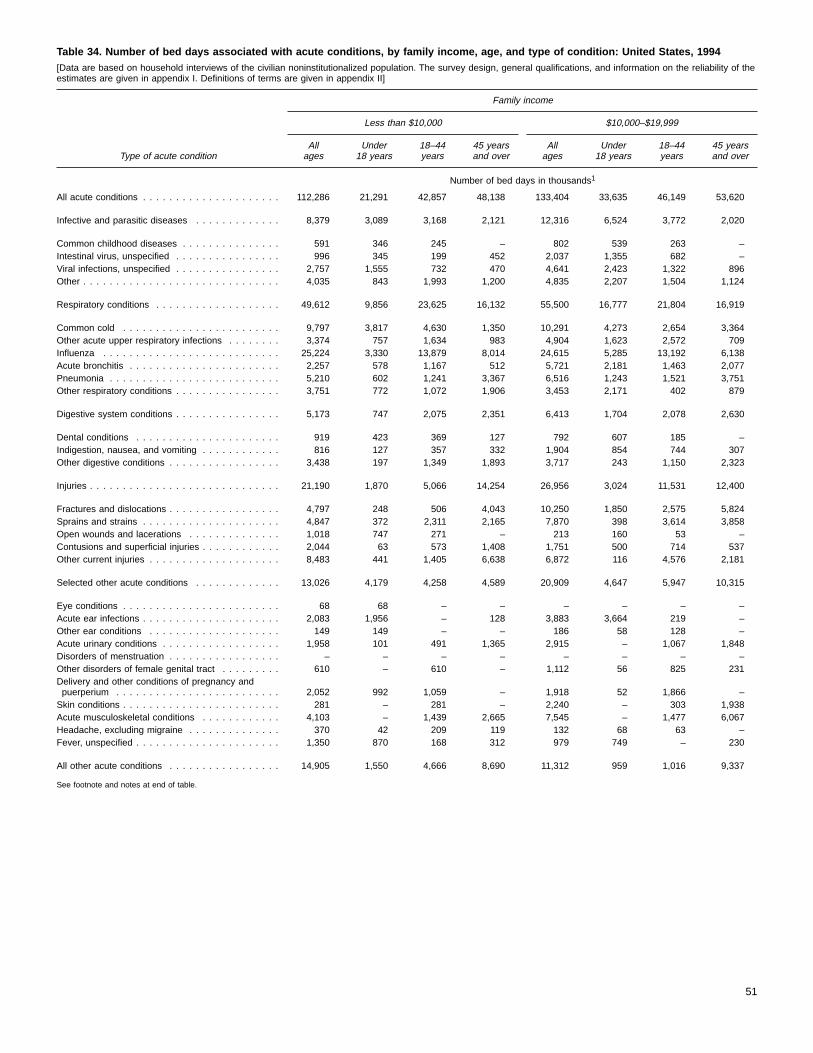
Table 34. Number of bed days associated with acute conditions, by family income, age, and type of condition: United States, 1994[Data are based on household interviews of the civilian noninstitutionalized population. The survey design, general qualifications, and information on the reliability of theestimates are given in appendix I. Definitions of terms are given in appendix II]
Type of acute condition
Family income
Less than $10,000 $10,000–$19,999
Allages
Under18 years
18–44years
45 yearsand over
Allages
Under18 years
18–44years
45 yearsand over
Number of bed days in thousands1
All acute conditions . . . . . . . . . . . . . . . . . . . . . 112,286 21,291 42,857 48,138 133,404 33,635 46,149 53,620
Infective and parasitic diseases . . . . . . . . . . . . . 8,379 3,089 3,168 2,121 12,316 6,524 3,772 2,020
Common childhood diseases . . . . . . . . . . . . . . . 591 346 245 – 802 539 263 –Intestinal virus, unspecified . . . . . . . . . . . . . . . . 996 345 199 452 2,037 1,355 682 –Viral infections, unspecified . . . . . . . . . . . . . . . . 2,757 1,555 732 470 4,641 2,423 1,322 896Other . . . . . . . . . . . . . . . . . . . . . . . . . . . . . . 4,035 843 1,993 1,200 4,835 2,207 1,504 1,124
Respiratory conditions . . . . . . . . . . . . . . . . . . . 49,612 9,856 23,625 16,132 55,500 16,777 21,804 16,919
Common cold . . . . . . . . . . . . . . . . . . . . . . . . 9,797 3,817 4,630 1,350 10,291 4,273 2,654 3,364Other acute upper respiratory infections . . . . . . . . 3,374 757 1,634 983 4,904 1,623 2,572 709Influenza . . . . . . . . . . . . . . . . . . . . . . . . . . . 25,224 3,330 13,879 8,014 24,615 5,285 13,192 6,138Acute bronchitis . . . . . . . . . . . . . . . . . . . . . . . 2,257 578 1,167 512 5,721 2,181 1,463 2,077Pneumonia . . . . . . . . . . . . . . . . . . . . . . . . . . 5,210 602 1,241 3,367 6,516 1,243 1,521 3,751Other respiratory conditions . . . . . . . . . . . . . . . . 3,751 772 1,072 1,906 3,453 2,171 402 879
Digestive system conditions . . . . . . . . . . . . . . . . 5,173 747 2,075 2,351 6,413 1,704 2,078 2,630
Dental conditions . . . . . . . . . . . . . . . . . . . . . . 919 423 369 127 792 607 185 –Indigestion, nausea, and vomiting . . . . . . . . . . . . 816 127 357 332 1,904 854 744 307Other digestive conditions . . . . . . . . . . . . . . . . . 3,438 197 1,349 1,893 3,717 243 1,150 2,323
Injuries . . . . . . . . . . . . . . . . . . . . . . . . . . . . . 21,190 1,870 5,066 14,254 26,956 3,024 11,531 12,400
Fractures and dislocations . . . . . . . . . . . . . . . . . 4,797 248 506 4,043 10,250 1,850 2,575 5,824Sprains and strains . . . . . . . . . . . . . . . . . . . . . 4,847 372 2,311 2,165 7,870 398 3,614 3,858Open wounds and lacerations . . . . . . . . . . . . . . 1,018 747 271 – 213 160 53 –Contusions and superficial injuries . . . . . . . . . . . . 2,044 63 573 1,408 1,751 500 714 537Other current injuries . . . . . . . . . . . . . . . . . . . . 8,483 441 1,405 6,638 6,872 116 4,576 2,181
Selected other acute conditions . . . . . . . . . . . . . 13,026 4,179 4,258 4,589 20,909 4,647 5,947 10,315
Eye conditions . . . . . . . . . . . . . . . . . . . . . . . . 68 68 – – – – – –Acute ear infections . . . . . . . . . . . . . . . . . . . . . 2,083 1,956 – 128 3,883 3,664 219 –Other ear conditions . . . . . . . . . . . . . . . . . . . . 149 149 – – 186 58 128 –Acute urinary conditions . . . . . . . . . . . . . . . . . . 1,958 101 491 1,365 2,915 – 1,067 1,848Disorders of menstruation . . . . . . . . . . . . . . . . . – – – – – – – –Other disorders of female genital tract . . . . . . . . . 610 – 610 – 1,112 56 825 231Delivery and other conditions of pregnancy andpuerperium . . . . . . . . . . . . . . . . . . . . . . . . . 2,052 992 1,059 – 1,918 52 1,866 –Skin conditions . . . . . . . . . . . . . . . . . . . . . . . . 281 – 281 – 2,240 – 303 1,938Acute musculoskeletal conditions . . . . . . . . . . . . 4,103 – 1,439 2,665 7,545 – 1,477 6,067Headache, excluding migraine . . . . . . . . . . . . . . 370 42 209 119 132 68 63 –Fever, unspecified . . . . . . . . . . . . . . . . . . . . . . 1,350 870 168 312 979 749 – 230
All other acute conditions . . . . . . . . . . . . . . . . . 14,905 1,550 4,666 8,690 11,312 959 1,016 9,337
See footnote and notes at end of table.
51

Table 34. Number of bed days associated with acute conditions, by family income, age, and type of condition: United States, 1994—Con.[Data are based on household interviews of the civilian noninstitutionalized population. The survey design, general qualifications, and information on the reliability of theestimates are given in appendix I. Definitions of terms are given in appendix II]
Type of acute condition
Family income
$20,000–$34,999 $35,000 or more
Allages
Under18 years
18–44years
45 yearsand over
Allages
Under18 years
18–44years
45 yearsand over
Number of bed days in thousands1
All acute conditions . . . . . . . . . . . . . . . . . . . . . 149,818 48,873 66,199 34,746 227,494 75,823 89,445 62,226
Infective and parasitic diseases . . . . . . . . . . . . . 18,366 10,841 6,019 1,506 27,740 16,983 7,499 3,258
Common childhood diseases . . . . . . . . . . . . . . . 974 974 – – 2,466 1,715 751 –Intestinal virus, unspecified . . . . . . . . . . . . . . . . 3,586 1,972 1,014 601 4,889 3,025 1,090 774Viral infections, unspecified . . . . . . . . . . . . . . . . 6,054 3,516 2,214 324 7,184 3,996 1,798 1,390Other . . . . . . . . . . . . . . . . . . . . . . . . . . . . . . 7,751 4,378 2,791 581 13,201 8,247 3,860 1,094
Respiratory conditions . . . . . . . . . . . . . . . . . . . 69,920 24,703 27,389 17,828 114,956 38,742 46,275 29,939
Common cold . . . . . . . . . . . . . . . . . . . . . . . . 12,451 4,255 4,472 3,724 21,063 8,051 7,400 5,613Other acute upper respiratory infections . . . . . . . . 7,783 4,095 3,028 660 10,951 5,189 3,875 1,887Influenza . . . . . . . . . . . . . . . . . . . . . . . . . . . 36,349 12,405 15,857 8,087 60,033 21,267 24,797 13,969Acute bronchitis . . . . . . . . . . . . . . . . . . . . . . . 4,062 1,303 1,303 1,456 11,850 2,676 5,788 3,386Pneumonia . . . . . . . . . . . . . . . . . . . . . . . . . . 5,344 1,409 1,922 2,014 9,769 1,343 3,450 4,975Other respiratory conditions . . . . . . . . . . . . . . . . 3,931 1,237 808 1,886 1,290 216 964 109
Digestive system conditions . . . . . . . . . . . . . . . . 3,250 735 1,705 811 7,860 1,765 3,505 2,590
Dental conditions . . . . . . . . . . . . . . . . . . . . . . 430 84 346 – 1,428 55 1,264 109Indigestion, nausea, and vomiting . . . . . . . . . . . . 919 432 314 173 1,757 944 614 199Other digestive conditions . . . . . . . . . . . . . . . . . 1,901 219 1,045 637 4,675 766 1,627 2,281
Injuries . . . . . . . . . . . . . . . . . . . . . . . . . . . . . 26,763 2,528 18,962 5,273 26,843 3,616 9,930 13,297
Fractures and dislocations . . . . . . . . . . . . . . . . . 8,342 1,321 4,577 2,444 5,518 517 1,777 3,224Sprains and strains . . . . . . . . . . . . . . . . . . . . . 7,469 150 6,920 399 7,964 875 4,673 2,416Open wounds and lacerations . . . . . . . . . . . . . . 1,001 474 – 527 1,299 271 897 131Contusions and superficial injuries . . . . . . . . . . . . 2,963 530 2,433 – 3,148 110 947 2,090Other current injuries . . . . . . . . . . . . . . . . . . . . 6,987 52 5,032 1,903 8,914 1,843 1,636 5,436
Selected other acute conditions . . . . . . . . . . . . . 19,374 6,695 8,558 4,121 37,769 12,438 16,058 9,273
Eye conditions . . . . . . . . . . . . . . . . . . . . . . . . 216 – 216 – 148 – 148 –Acute ear infections . . . . . . . . . . . . . . . . . . . . . 4,110 3,583 237 289 7,352 4,905 1,441 1,005Other ear conditions . . . . . . . . . . . . . . . . . . . . 1,169 297 416 456 1,186 855 331 –Acute urinary conditions . . . . . . . . . . . . . . . . . . 2,721 – 1,381 1,340 4,943 103 1,479 3,361Disorders of menstruation . . . . . . . . . . . . . . . . . 361 212 149 – 466 116 315 35Other disorders of female genital tract . . . . . . . . . 1,128 – 1,078 50 2,252 955 1,296 –Delivery and other conditions of pregnancy andpuerperium . . . . . . . . . . . . . . . . . . . . . . . . . 2,979 618 2,360 – 10,557 2,271 8,286 –Skin conditions . . . . . . . . . . . . . . . . . . . . . . . . 1,237 – 608 629 1,513 832 – 681Acute musculoskeletal conditions . . . . . . . . . . . . 3,233 60 1,864 1,309 6,292 101 2,429 3,762Headache, excluding migraine . . . . . . . . . . . . . . 671 375 249 47 945 567 115 263Fever, unspecified . . . . . . . . . . . . . . . . . . . . . . 1,549 1,549 – – 2,115 1,731 217 166
All other acute conditions . . . . . . . . . . . . . . . . . 12,144 3,371 3,566 5,208 12,327 2,280 6,178 3,869
1Totals for income categories do not sum to total bed days because persons with unknown family income are not included.
NOTES: The standard errors and relative standard errors (RSE’s) can be computed by using parameter set II of table II and the formula presented in rule 1 of appendix I. An estimate of 55.4million has a 10-percent RSE; of 13.4 million, a 20-percent RSE; and of 6.0 million, a 30-percent RSE.
52
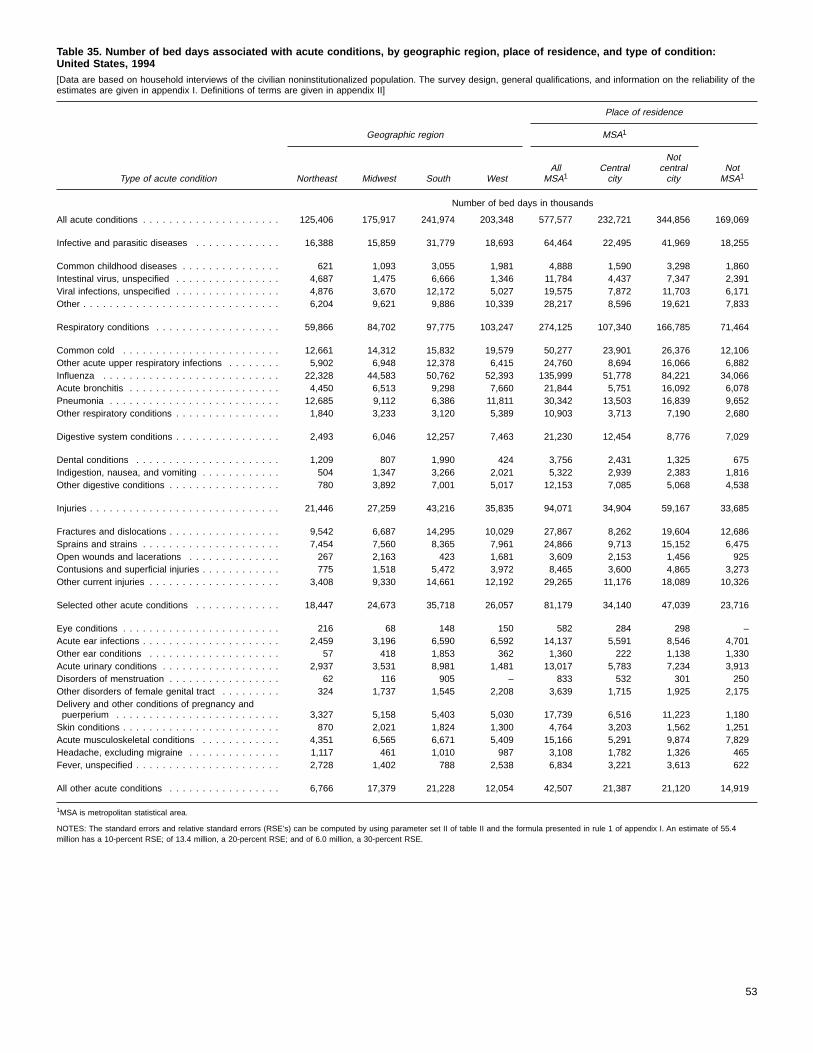
Table 35. Number of bed days associated with acute conditions, by geographic region, place of residence, and type of condition:United States, 1994[Data are based on household interviews of the civilian noninstitutionalized population. The survey design, general qualifications, and information on the reliability of theestimates are given in appendix I. Definitions of terms are given in appendix II]
Type of acute condition
Place of residence
Geographic region MSA1
Northeast Midwest South WestAll
MSA1Centralcity
Notcentralcity
NotMSA1
Number of bed days in thousands
All acute conditions . . . . . . . . . . . . . . . . . . . . . 125,406 175,917 241,974 203,348 577,577 232,721 344,856 169,069
Infective and parasitic diseases . . . . . . . . . . . . . 16,388 15,859 31,779 18,693 64,464 22,495 41,969 18,255
Common childhood diseases . . . . . . . . . . . . . . . 621 1,093 3,055 1,981 4,888 1,590 3,298 1,860Intestinal virus, unspecified . . . . . . . . . . . . . . . . 4,687 1,475 6,666 1,346 11,784 4,437 7,347 2,391Viral infections, unspecified . . . . . . . . . . . . . . . . 4,876 3,670 12,172 5,027 19,575 7,872 11,703 6,171Other . . . . . . . . . . . . . . . . . . . . . . . . . . . . . . 6,204 9,621 9,886 10,339 28,217 8,596 19,621 7,833
Respiratory conditions . . . . . . . . . . . . . . . . . . . 59,866 84,702 97,775 103,247 274,125 107,340 166,785 71,464
Common cold . . . . . . . . . . . . . . . . . . . . . . . . 12,661 14,312 15,832 19,579 50,277 23,901 26,376 12,106Other acute upper respiratory infections . . . . . . . . 5,902 6,948 12,378 6,415 24,760 8,694 16,066 6,882Influenza . . . . . . . . . . . . . . . . . . . . . . . . . . . 22,328 44,583 50,762 52,393 135,999 51,778 84,221 34,066Acute bronchitis . . . . . . . . . . . . . . . . . . . . . . . 4,450 6,513 9,298 7,660 21,844 5,751 16,092 6,078Pneumonia . . . . . . . . . . . . . . . . . . . . . . . . . . 12,685 9,112 6,386 11,811 30,342 13,503 16,839 9,652Other respiratory conditions . . . . . . . . . . . . . . . . 1,840 3,233 3,120 5,389 10,903 3,713 7,190 2,680
Digestive system conditions . . . . . . . . . . . . . . . . 2,493 6,046 12,257 7,463 21,230 12,454 8,776 7,029
Dental conditions . . . . . . . . . . . . . . . . . . . . . . 1,209 807 1,990 424 3,756 2,431 1,325 675Indigestion, nausea, and vomiting . . . . . . . . . . . . 504 1,347 3,266 2,021 5,322 2,939 2,383 1,816Other digestive conditions . . . . . . . . . . . . . . . . . 780 3,892 7,001 5,017 12,153 7,085 5,068 4,538
Injuries . . . . . . . . . . . . . . . . . . . . . . . . . . . . . 21,446 27,259 43,216 35,835 94,071 34,904 59,167 33,685
Fractures and dislocations . . . . . . . . . . . . . . . . . 9,542 6,687 14,295 10,029 27,867 8,262 19,604 12,686Sprains and strains . . . . . . . . . . . . . . . . . . . . . 7,454 7,560 8,365 7,961 24,866 9,713 15,152 6,475Open wounds and lacerations . . . . . . . . . . . . . . 267 2,163 423 1,681 3,609 2,153 1,456 925Contusions and superficial injuries . . . . . . . . . . . . 775 1,518 5,472 3,972 8,465 3,600 4,865 3,273Other current injuries . . . . . . . . . . . . . . . . . . . . 3,408 9,330 14,661 12,192 29,265 11,176 18,089 10,326
Selected other acute conditions . . . . . . . . . . . . . 18,447 24,673 35,718 26,057 81,179 34,140 47,039 23,716
Eye conditions . . . . . . . . . . . . . . . . . . . . . . . . 216 68 148 150 582 284 298 –Acute ear infections . . . . . . . . . . . . . . . . . . . . . 2,459 3,196 6,590 6,592 14,137 5,591 8,546 4,701Other ear conditions . . . . . . . . . . . . . . . . . . . . 57 418 1,853 362 1,360 222 1,138 1,330Acute urinary conditions . . . . . . . . . . . . . . . . . . 2,937 3,531 8,981 1,481 13,017 5,783 7,234 3,913Disorders of menstruation . . . . . . . . . . . . . . . . . 62 116 905 – 833 532 301 250Other disorders of female genital tract . . . . . . . . . 324 1,737 1,545 2,208 3,639 1,715 1,925 2,175Delivery and other conditions of pregnancy andpuerperium . . . . . . . . . . . . . . . . . . . . . . . . . 3,327 5,158 5,403 5,030 17,739 6,516 11,223 1,180Skin conditions . . . . . . . . . . . . . . . . . . . . . . . . 870 2,021 1,824 1,300 4,764 3,203 1,562 1,251Acute musculoskeletal conditions . . . . . . . . . . . . 4,351 6,565 6,671 5,409 15,166 5,291 9,874 7,829Headache, excluding migraine . . . . . . . . . . . . . . 1,117 461 1,010 987 3,108 1,782 1,326 465Fever, unspecified . . . . . . . . . . . . . . . . . . . . . . 2,728 1,402 788 2,538 6,834 3,221 3,613 622
All other acute conditions . . . . . . . . . . . . . . . . . 6,766 17,379 21,228 12,054 42,507 21,387 21,120 14,919
1MSA is metropolitan statistical area.
NOTES: The standard errors and relative standard errors (RSE’s) can be computed by using parameter set II of table II and the formula presented in rule 1 of appendix I. An estimate of 55.4million has a 10-percent RSE; of 13.4 million, a 20-percent RSE; and of 6.0 million, a 30-percent RSE.
53

Table 36. Number of work-loss days associated with acute conditions per 100 currently employed persons 18 years of age and over, byage and type of condition: United States, 1994[Data are based on household interviews of the civilian noninstitutionalized population. The survey design, general qualifications, and information on the reliability of theestimates are given in appendix I. Definitions of terms are given in appendix II]
Type of acute condition
All ages18 yearsand over
18–44 years 45 years and over
Total18–24years
25–44years Total
45–64years
Number of work-loss days per 100 currently employed persons per year
All acute conditions . . . . . . . . . . . . . . . . . . . . . . . . . . . . . 312.2 330.5 308.8 336.1 272.6 283.3
Infective and parasitic diseases . . . . . . . . . . . . . . . . . . . . . 21.6 24.4 35.4 21.7 15.4 16.4
Common childhood diseases . . . . . . . . . . . . . . . . . . . . . . . *2.0 *3.0 *5.4 *2.4 *– *–Intestinal virus, unspecified . . . . . . . . . . . . . . . . . . . . . . . . 5.2 5.6 *5.7 *5.6 *4.4 *4.1Viral infections, unspecified . . . . . . . . . . . . . . . . . . . . . . . . 6.0 6.9 *15.6 *4.7 *4.1 *4.5Other . . . . . . . . . . . . . . . . . . . . . . . . . . . . . . . . . . . . . . 8.3 9.0 *8.7 9.1 *6.9 *7.7
Respiratory conditions . . . . . . . . . . . . . . . . . . . . . . . . . . . 105.3 110.0 99.0 112.8 95.1 98.6
Common cold . . . . . . . . . . . . . . . . . . . . . . . . . . . . . . . . 17.6 19.3 *23.0 18.3 14.0 15.2Other acute upper respiratory infections . . . . . . . . . . . . . . . . 8.8 9.5 *7.7 9.9 *7.2 *7.5Influenza . . . . . . . . . . . . . . . . . . . . . . . . . . . . . . . . . . . 56.4 59.1 54.3 60.3 50.5 52.4Acute bronchitis . . . . . . . . . . . . . . . . . . . . . . . . . . . . . . . 11.0 10.5 *8.5 10.9 12.1 13.0Pneumonia . . . . . . . . . . . . . . . . . . . . . . . . . . . . . . . . . . 8.9 8.4 *1.7 10.1 *10.1 *9.1Other respiratory conditions . . . . . . . . . . . . . . . . . . . . . . . . *2.6 *3.3 *3.7 *3.2 *1.2 *1.4
Digestive system conditions . . . . . . . . . . . . . . . . . . . . . . . . 13.1 13.3 *19.0 11.9 12.7 *10.8
Dental conditions . . . . . . . . . . . . . . . . . . . . . . . . . . . . . . *3.2 *3.9 *5.6 *3.4 *1.6 *1.8Indigestion, nausea, and vomiting . . . . . . . . . . . . . . . . . . . . *2.7 *3.3 *7.2 *2.3 *1.4 *1.4Other digestive conditions . . . . . . . . . . . . . . . . . . . . . . . . . 7.3 6.2 *6.2 *6.1 *9.7 *7.6
Injuries . . . . . . . . . . . . . . . . . . . . . . . . . . . . . . . . . . . . . 115.5 123.2 94.2 130.6 98.9 104.5
Fractures and dislocations . . . . . . . . . . . . . . . . . . . . . . . . . 32.9 29.3 *21.0 31.4 40.6 41.3Sprains and strains . . . . . . . . . . . . . . . . . . . . . . . . . . . . . 30.8 32.9 35.5 32.2 26.2 27.8Open wounds and lacerations . . . . . . . . . . . . . . . . . . . . . . 11.4 15.8 *12.2 16.8 *1.9 *2.1Contusions and superficial injuries . . . . . . . . . . . . . . . . . . . . 14.0 16.2 *7.5 18.3 *9.3 *10.3Other current injuries . . . . . . . . . . . . . . . . . . . . . . . . . . . . 26.5 29.0 *18.0 31.8 21.0 23.0
Selected other acute conditions . . . . . . . . . . . . . . . . . . . . . 34.8 39.0 44.6 37.6 25.8 27.4
Eye conditions . . . . . . . . . . . . . . . . . . . . . . . . . . . . . . . . *0.6 *0.8 *– *1.0 *0.3 *0.4Acute ear infections . . . . . . . . . . . . . . . . . . . . . . . . . . . . . *2.6 *2.4 *3.5 *2.2 *3.0 *3.3Other ear conditions . . . . . . . . . . . . . . . . . . . . . . . . . . . . *0.5 *0.7 *– *0.9 *0.2 *0.2Acute urinary conditions . . . . . . . . . . . . . . . . . . . . . . . . . . 4.4 *3.2 *4.4 *2.9 *7.1 *7.8Disorders of menstruation . . . . . . . . . . . . . . . . . . . . . . . . . *0.6 *0.8 *1.5 *0.6 *0.1 *0.1Other disorders of female genital tract . . . . . . . . . . . . . . . . . *1.9 *2.3 *2.0 *2.3 *1.2 *1.3Delivery and other conditions of pregnancy and puerperium . . . . 7.8 11.4 *11.0 11.5 *– *–Skin conditions . . . . . . . . . . . . . . . . . . . . . . . . . . . . . . . . *1.7 *1.5 *3.7 *0.9 *2.3 *2.5Acute musculoskeletal conditions . . . . . . . . . . . . . . . . . . . . 12.8 14.0 *15.4 13.7 *10.0 *10.1Headache, excluding migraine . . . . . . . . . . . . . . . . . . . . . . *1.4 *1.6 *1.7 *1.5 *1.0 *1.1Fever, unspecified . . . . . . . . . . . . . . . . . . . . . . . . . . . . . . *0.6 *0.5 *1.4 *0.2 *0.7 *0.5
All other acute conditions . . . . . . . . . . . . . . . . . . . . . . . . . 21.9 20.5 *16.6 21.5 24.8 25.7
NOTES: The standard errors and relative standard errors (RSE’s) can be computed by using parameter sets III and X of table II, the frequencies of tables 41 and 78, and the formula presented inrule 4 of appendix I. Estimates for which the numerator has an RSE of more than 30 percent are indicated with an asterisk.
54
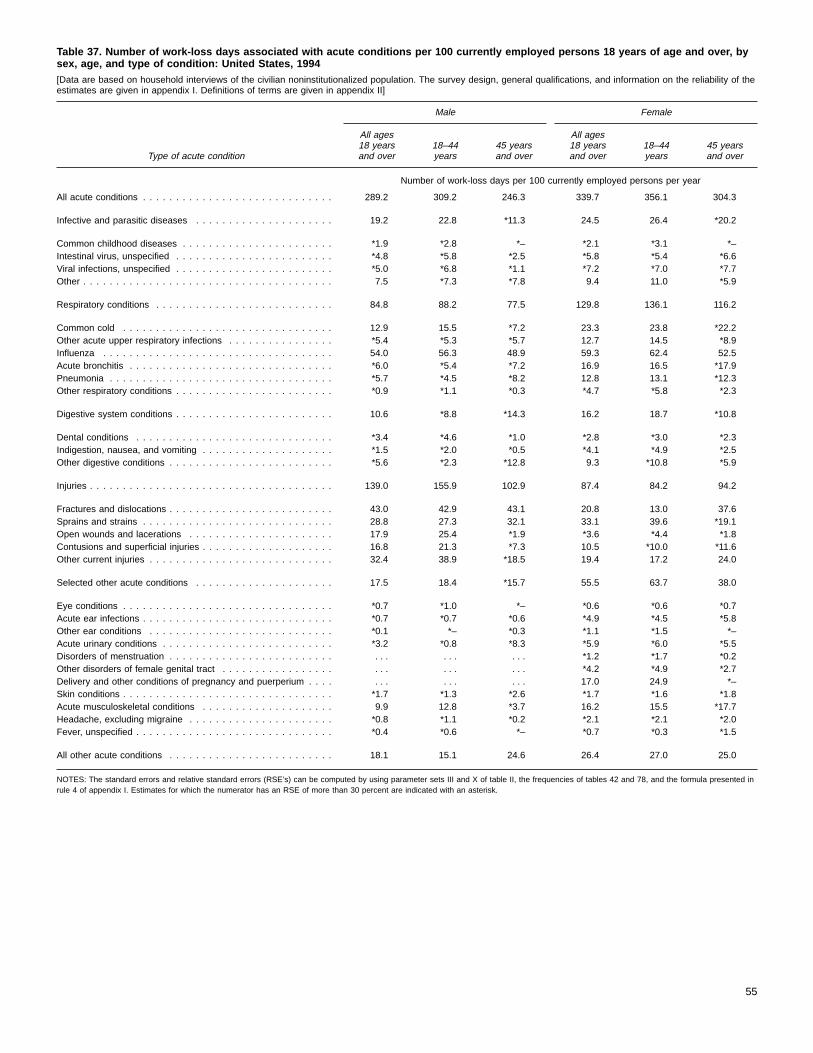
Table 37. Number of work-loss days associated with acute conditions per 100 currently employed persons 18 years of age and over, bysex, age, and type of condition: United States, 1994[Data are based on household interviews of the civilian noninstitutionalized population. The survey design, general qualifications, and information on the reliability of theestimates are given in appendix I. Definitions of terms are given in appendix II]
Type of acute condition
Male Female
All ages18 yearsand over
18–44years
45 yearsand over
All ages18 yearsand over
18–44years
45 yearsand over
Number of work-loss days per 100 currently employed persons per year
All acute conditions . . . . . . . . . . . . . . . . . . . . . . . . . . . . . 289.2 309.2 246.3 339.7 356.1 304.3
Infective and parasitic diseases . . . . . . . . . . . . . . . . . . . . . 19.2 22.8 *11.3 24.5 26.4 *20.2
Common childhood diseases . . . . . . . . . . . . . . . . . . . . . . . *1.9 *2.8 *– *2.1 *3.1 *–Intestinal virus, unspecified . . . . . . . . . . . . . . . . . . . . . . . . *4.8 *5.8 *2.5 *5.8 *5.4 *6.6Viral infections, unspecified . . . . . . . . . . . . . . . . . . . . . . . . *5.0 *6.8 *1.1 *7.2 *7.0 *7.7Other . . . . . . . . . . . . . . . . . . . . . . . . . . . . . . . . . . . . . . 7.5 *7.3 *7.8 9.4 11.0 *5.9
Respiratory conditions . . . . . . . . . . . . . . . . . . . . . . . . . . . 84.8 88.2 77.5 129.8 136.1 116.2
Common cold . . . . . . . . . . . . . . . . . . . . . . . . . . . . . . . . 12.9 15.5 *7.2 23.3 23.8 *22.2Other acute upper respiratory infections . . . . . . . . . . . . . . . . *5.4 *5.3 *5.7 12.7 14.5 *8.9Influenza . . . . . . . . . . . . . . . . . . . . . . . . . . . . . . . . . . . 54.0 56.3 48.9 59.3 62.4 52.5Acute bronchitis . . . . . . . . . . . . . . . . . . . . . . . . . . . . . . . *6.0 *5.4 *7.2 16.9 16.5 *17.9Pneumonia . . . . . . . . . . . . . . . . . . . . . . . . . . . . . . . . . . *5.7 *4.5 *8.2 12.8 13.1 *12.3Other respiratory conditions . . . . . . . . . . . . . . . . . . . . . . . . *0.9 *1.1 *0.3 *4.7 *5.8 *2.3
Digestive system conditions . . . . . . . . . . . . . . . . . . . . . . . . 10.6 *8.8 *14.3 16.2 18.7 *10.8
Dental conditions . . . . . . . . . . . . . . . . . . . . . . . . . . . . . . *3.4 *4.6 *1.0 *2.8 *3.0 *2.3Indigestion, nausea, and vomiting . . . . . . . . . . . . . . . . . . . . *1.5 *2.0 *0.5 *4.1 *4.9 *2.5Other digestive conditions . . . . . . . . . . . . . . . . . . . . . . . . . *5.6 *2.3 *12.8 9.3 *10.8 *5.9
Injuries . . . . . . . . . . . . . . . . . . . . . . . . . . . . . . . . . . . . . 139.0 155.9 102.9 87.4 84.2 94.2
Fractures and dislocations . . . . . . . . . . . . . . . . . . . . . . . . . 43.0 42.9 43.1 20.8 13.0 37.6Sprains and strains . . . . . . . . . . . . . . . . . . . . . . . . . . . . . 28.8 27.3 32.1 33.1 39.6 *19.1Open wounds and lacerations . . . . . . . . . . . . . . . . . . . . . . 17.9 25.4 *1.9 *3.6 *4.4 *1.8Contusions and superficial injuries . . . . . . . . . . . . . . . . . . . . 16.8 21.3 *7.3 10.5 *10.0 *11.6Other current injuries . . . . . . . . . . . . . . . . . . . . . . . . . . . . 32.4 38.9 *18.5 19.4 17.2 24.0
Selected other acute conditions . . . . . . . . . . . . . . . . . . . . . 17.5 18.4 *15.7 55.5 63.7 38.0
Eye conditions . . . . . . . . . . . . . . . . . . . . . . . . . . . . . . . . *0.7 *1.0 *– *0.6 *0.6 *0.7Acute ear infections . . . . . . . . . . . . . . . . . . . . . . . . . . . . . *0.7 *0.7 *0.6 *4.9 *4.5 *5.8Other ear conditions . . . . . . . . . . . . . . . . . . . . . . . . . . . . *0.1 *– *0.3 *1.1 *1.5 *–Acute urinary conditions . . . . . . . . . . . . . . . . . . . . . . . . . . *3.2 *0.8 *8.3 *5.9 *6.0 *5.5Disorders of menstruation . . . . . . . . . . . . . . . . . . . . . . . . . . . . . . . . . . *1.2 *1.7 *0.2Other disorders of female genital tract . . . . . . . . . . . . . . . . . . . . . . . . . . *4.2 *4.9 *2.7Delivery and other conditions of pregnancy and puerperium . . . . . . . . . . . . . 17.0 24.9 *–Skin conditions . . . . . . . . . . . . . . . . . . . . . . . . . . . . . . . . *1.7 *1.3 *2.6 *1.7 *1.6 *1.8Acute musculoskeletal conditions . . . . . . . . . . . . . . . . . . . . 9.9 12.8 *3.7 16.2 15.5 *17.7Headache, excluding migraine . . . . . . . . . . . . . . . . . . . . . . *0.8 *1.1 *0.2 *2.1 *2.1 *2.0Fever, unspecified . . . . . . . . . . . . . . . . . . . . . . . . . . . . . . *0.4 *0.6 *– *0.7 *0.3 *1.5
All other acute conditions . . . . . . . . . . . . . . . . . . . . . . . . . 18.1 15.1 24.6 26.4 27.0 25.0
NOTES: The standard errors and relative standard errors (RSE’s) can be computed by using parameter sets III and X of table II, the frequencies of tables 42 and 78, and the formula presented inrule 4 of appendix I. Estimates for which the numerator has an RSE of more than 30 percent are indicated with an asterisk.
55

Table 38. Number of work-loss days associated with acute conditions per 100 currently employed persons 18 years of age and over, byrace, age, and type of condition: United States, 1994[Data are based on household interviews of the civilian noninstitutionalized population. The survey design, general qualifications, and information on the reliability of theestimates are given in appendix I. Definitions of terms are given in appendix II]
Type of acute condition
White Black
All ages18 yearsand over
18–44years
45 yearsand over
All ages18 yearsand over
18–44years
45 yearsand over
Number of work-loss days per 100 currently employed persons per year
All acute conditions . . . . . . . . . . . . . . . . . . . . . . . . . . . . . 305.0 329.8 253.7 399.6 386.8 435.2
Infective and parasitic diseases . . . . . . . . . . . . . . . . . . . . . 18.8 23.0 *10.0 47.3 *37.7 *74.0
Common childhood diseases . . . . . . . . . . . . . . . . . . . . . . . *1.6 *2.3 *– *6.4 *8.7 *–Intestinal virus, unspecified . . . . . . . . . . . . . . . . . . . . . . . . *4.1 *5.2 *1.8 *12.3 *5.5 *31.1Viral infections, unspecified . . . . . . . . . . . . . . . . . . . . . . . . *4.8 *5.9 *2.6 *16.3 *15.1 *19.8Other . . . . . . . . . . . . . . . . . . . . . . . . . . . . . . . . . . . . . . 8.2 9.5 *5.6 *12.3 *8.4 *23.1
Respiratory conditions . . . . . . . . . . . . . . . . . . . . . . . . . . . 105.0 114.7 84.9 98.1 83.9 137.6
Common cold . . . . . . . . . . . . . . . . . . . . . . . . . . . . . . . . 16.6 19.1 *11.4 *20.3 *16.5 *30.8Other acute upper respiratory infections . . . . . . . . . . . . . . . . 8.6 9.4 *6.9 *9.9 *11.8 *4.7Influenza . . . . . . . . . . . . . . . . . . . . . . . . . . . . . . . . . . . 55.8 61.8 43.2 58.0 52.7 *72.8Acute bronchitis . . . . . . . . . . . . . . . . . . . . . . . . . . . . . . . 12.3 12.1 12.6 *2.7 *0.3 *9.1Pneumonia . . . . . . . . . . . . . . . . . . . . . . . . . . . . . . . . . . 9.8 9.9 *9.5 *5.7 *0.8 *19.4Other respiratory conditions . . . . . . . . . . . . . . . . . . . . . . . . *2.0 *2.4 *1.3 *1.5 *1.8 *0.8
Digestive system conditions . . . . . . . . . . . . . . . . . . . . . . . . 12.2 11.3 13.9 *24.7 *31.3 *6.3
Dental conditions . . . . . . . . . . . . . . . . . . . . . . . . . . . . . . *2.8 *3.4 *1.6 *7.1 *8.8 *2.4Indigestion, nausea, and vomiting . . . . . . . . . . . . . . . . . . . . *2.2 *2.7 *1.2 *6.4 *7.3 *4.0Other digestive conditions . . . . . . . . . . . . . . . . . . . . . . . . . 7.1 *5.2 *11.1 *11.2 *15.2 *–
Injuries . . . . . . . . . . . . . . . . . . . . . . . . . . . . . . . . . . . . . 115.1 123.1 98.5 140.8 149.2 *117.3
Fractures and dislocations . . . . . . . . . . . . . . . . . . . . . . . . . 35.7 33.2 41.0 *13.0 *6.9 *29.8Sprains and strains . . . . . . . . . . . . . . . . . . . . . . . . . . . . . 30.1 31.2 27.8 48.3 58.1 *20.8Open wounds and lacerations . . . . . . . . . . . . . . . . . . . . . . 13.0 18.3 *2.1 *1.6 *2.1 *–Contusions and superficial injuries . . . . . . . . . . . . . . . . . . . . 13.0 15.6 *7.8 *17.5 *14.0 *27.4Other current injuries . . . . . . . . . . . . . . . . . . . . . . . . . . . . 23.3 24.9 19.8 60.4 68.0 *39.2
Selected other acute conditions . . . . . . . . . . . . . . . . . . . . . 32.4 38.2 20.3 57.9 50.5 *78.6
Eye conditions . . . . . . . . . . . . . . . . . . . . . . . . . . . . . . . . *0.5 *0.6 *0.4 *1.6 *2.2 *–Acute ear infections . . . . . . . . . . . . . . . . . . . . . . . . . . . . . *2.9 *2.7 *3.4 *1.0 *1.4 *–Other ear conditions . . . . . . . . . . . . . . . . . . . . . . . . . . . . *0.6 *0.8 *0.2 *– *– *–Acute urinary conditions . . . . . . . . . . . . . . . . . . . . . . . . . . 4.5 *3.7 *6.2 *5.4 *0.6 *18.7Disorders of menstruation . . . . . . . . . . . . . . . . . . . . . . . . . *0.6 *0.9 *– *0.5 *0.3 *1.0Other disorders of female genital tract . . . . . . . . . . . . . . . . . *1.8 *2.7 *– *3.1 *– *11.6Delivery and other conditions of pregnancy and puerperium . . . . 6.4 9.5 *– *16.9 *23.0 *–Skin conditions . . . . . . . . . . . . . . . . . . . . . . . . . . . . . . . . *1.5 *1.3 *1.8 *– *– *–Acute musculoskeletal conditions . . . . . . . . . . . . . . . . . . . . 11.8 13.8 *7.6 *25.2 *21.4 *35.9Headache, excluding migraine . . . . . . . . . . . . . . . . . . . . . . *1.1 *1.7 *– *4.1 *1.5 *11.4Fever, unspecified . . . . . . . . . . . . . . . . . . . . . . . . . . . . . . *0.5 *0.4 *0.8 *– *– *–
All other acute conditions . . . . . . . . . . . . . . . . . . . . . . . . . 21.6 19.5 26.0 *30.9 *34.2 *21.4
NOTES: The standard errors and relative standard errors (RSE’s) can be computed by using parameter sets III and X of table II, the frequencies of tables 43 and 78 and the formula presented inrule 4 of appendix I. Estimates for which the numerator has an RSE of more than 30 percent are indicated with an asterisk.
56

Table 39. Number of work-loss days associated with acute conditions per 100 currently employed persons 18 years of age and over, byfamily income, age, and type of condition: United States, 1994[Data are based on household interviews of the civilian noninstitutionalized population. The survey design, general qualifications, and information on the reliability of theestimates are given in appendix I. Definitions of terms are given in appendix II]
Type of acute condition
Family income
Less than $10,000 $10,000–$24,999 $25,000 or more
All ages18 yearsand over
18–44years
45 yearsand over
All ages18 yearsand over
18–44years
45 yearsand over
All ages18 yearsand over
18–44years
45 yearsand over
Number of work-loss days per 100 currently employed persons per year
All acute conditions . . . . . . . . . . . . . . . . . 499.3 526.9 *387.1 412.3 419.5 393.2 280.5 300.2 240.7
Infective and parasitic diseases . . . . . . . . . *31.1 *38.8 *– 24.3 *23.3 *27.0 19.7 22.8 *13.3
Common childhood diseases . . . . . . . . . . . *6.4 *8.0 *– *1.2 *1.7 *– *1.4 *2.1 *–Intestinal virus, unspecified . . . . . . . . . . . . *– *– *– *4.3 *5.6 *0.8 *4.8 *5.2 *4.0Viral infections, unspecified . . . . . . . . . . . . *14.6 *18.2 *– *7.6 *10.5 *– 6.0 *6.3 *5.4Other . . . . . . . . . . . . . . . . . . . . . . . . . . *10.1 *12.6 *– *11.3 *5.6 *26.2 7.5 9.2 *3.9
Respiratory conditions . . . . . . . . . . . . . . . 173.7 176.4 *162.6 129.4 132.0 122.5 99.4 104.4 89.2
Common cold . . . . . . . . . . . . . . . . . . . . *21.1 *26.3 *– 22.3 *24.8 *15.8 16.6 16.8 *16.2Other acute upper respiratory infections . . . . *3.0 *2.2 *5.8 *10.1 *9.7 *11.1 9.6 11.5 *5.8Influenza . . . . . . . . . . . . . . . . . . . . . . . 111.9 116.5 *93.2 76.0 70.8 89.6 51.0 55.5 42.0Acute bronchitis . . . . . . . . . . . . . . . . . . . *28.5 *27.7 *31.8 *9.5 *11.9 *3.1 10.5 9.1 *13.5Pneumonia . . . . . . . . . . . . . . . . . . . . . . *3.0 *3.7 *– *5.2 *6.4 *2.1 10.0 9.3 *11.4Other respiratory conditions . . . . . . . . . . . . *6.3 *– *31.8 *6.4 *8.5 *0.8 *1.6 *2.2 *0.4
Digestive system conditions . . . . . . . . . . . . *23.8 *29.6 *– 18.6 *22.1 *9.5 11.9 9.9 *16.0
Dental conditions . . . . . . . . . . . . . . . . . . *4.3 *5.3 *– *0.8 *1.1 *– *2.9 *3.6 *1.4Indigestion, nausea, and vomiting . . . . . . . . *4.1 *5.1 *– *5.6 *6.8 *2.3 *2.2 *2.6 *1.4Other digestive conditions . . . . . . . . . . . . . *15.4 *19.2 *– *12.3 *14.2 *7.3 6.9 *3.7 *13.2
Injuries . . . . . . . . . . . . . . . . . . . . . . . . . 167.0 155.2 *214.6 160.9 173.5 127.7 100.3 108.9 82.8
Fractures and dislocations . . . . . . . . . . . . . *19.1 *– *96.9 53.9 51.9 *59.0 26.9 25.0 30.6Sprains and strains . . . . . . . . . . . . . . . . . *50.9 *63.4 *– 41.7 38.6 *49.8 29.0 31.4 24.1Open wounds and lacerations . . . . . . . . . . *13.0 *14.6 *6.3 *16.3 *22.5 *– 11.6 16.0 *2.6Contusions and superficial injuries . . . . . . . . *8.7 *10.8 *– *14.4 *15.1 *12.7 15.5 19.4 *7.6Other current injuries . . . . . . . . . . . . . . . . *75.2 *66.3 *111.4 34.6 45.4 *6.2 17.3 17.1 17.8
Selected other acute conditions . . . . . . . . . *39.2 *46.5 *9.8 44.1 47.2 *36.0 33.6 39.6 21.4
Eye conditions . . . . . . . . . . . . . . . . . . . . *– *– *– *0.6 *– *2.0 *0.7 *1.0 *–Acute ear infections . . . . . . . . . . . . . . . . . *1.2 *1.4 *– *1.4 *– *5.3 *3.4 *3.9 *2.5Other ear conditions . . . . . . . . . . . . . . . . *– *– *– *0.7 *0.6 *1.0 *0.7 *1.0 *–Acute urinary conditions . . . . . . . . . . . . . . *– *– *– *0.7 *0.4 *1.7 *3.7 *3.4 *4.2Disorders of menstruation . . . . . . . . . . . . . *– *– *– *– *– *– *0.6 *0.8 *0.1Other disorders of female genital tract . . . . . *– *– *– *3.4 *4.6 *– *1.9 *1.9 *1.9Delivery and other conditions of pregnancyand puerperium . . . . . . . . . . . . . . . . . . *2.0 *2.5 *– *7.0 *9.6 *– 10.4 15.5 *–Skin conditions . . . . . . . . . . . . . . . . . . . . *– *– *– *3.6 *3.7 *3.5 *1.3 *1.2 *1.3Acute musculoskeletal conditions . . . . . . . . *33.1 *41.3 *– 23.2 *23.4 *22.4 9.8 9.9 *9.4Headache, excluding migraine . . . . . . . . . . *– *– *– *3.2 *4.4 *– *0.8 *0.6 *1.4Fever, unspecified . . . . . . . . . . . . . . . . . . *2.9 *1.3 *9.8 *0.3 *0.4 *– *0.5 *0.4 *0.7
All other acute conditions . . . . . . . . . . . . . *64.5 *80.3 *– 34.9 *21.4 70.5 15.7 14.6 17.9
NOTES: The standard errors and relative standard errors (RSE’s) can be computed by using parameter sets III and X of table II, the frequencies of tables 44 and 78, and the formula presented inrule 4 of appendix I. Estimates for which the numerator has an RSE of more than 30 percent are indicated with an asterisk.
57
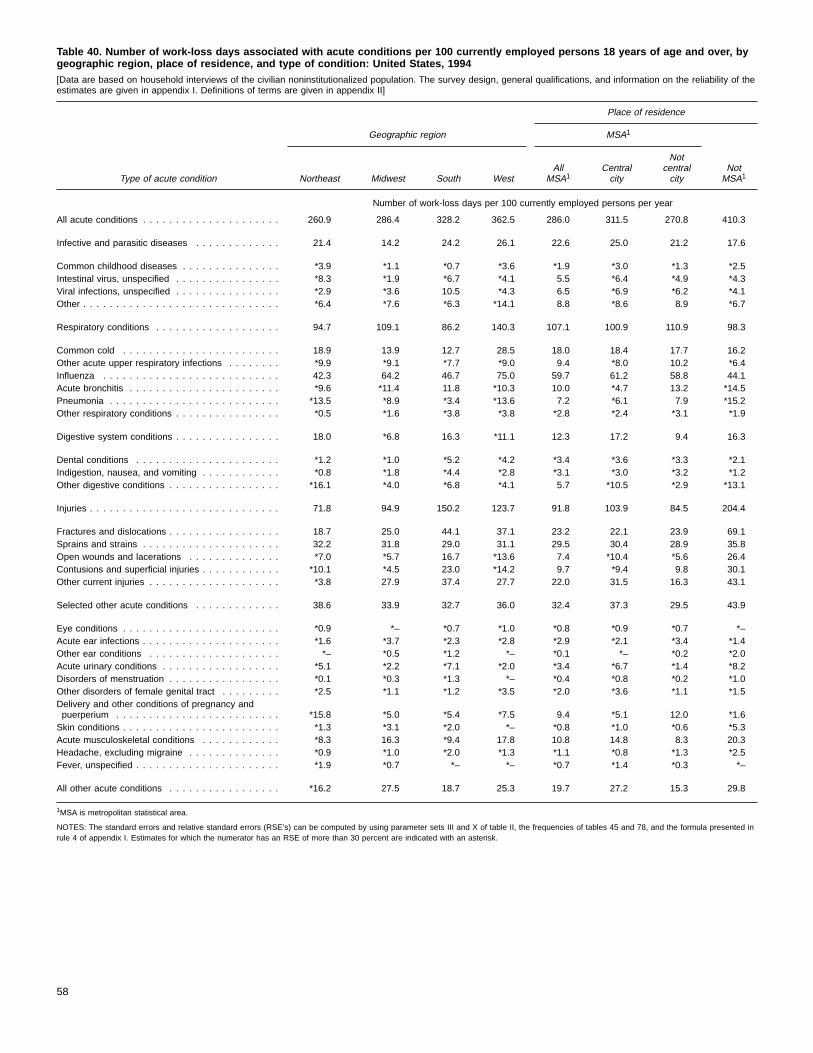
Table 40. Number of work-loss days associated with acute conditions per 100 currently employed persons 18 years of age and over, bygeographic region, place of residence, and type of condition: United States, 1994[Data are based on household interviews of the civilian noninstitutionalized population. The survey design, general qualifications, and information on the reliability of theestimates are given in appendix I. Definitions of terms are given in appendix II]
Type of acute condition
Place of residence
Geographic region MSA1
Northeast Midwest South WestAll
MSA1Centralcity
Notcentralcity
NotMSA1
Number of work-loss days per 100 currently employed persons per year
All acute conditions . . . . . . . . . . . . . . . . . . . . . 260.9 286.4 328.2 362.5 286.0 311.5 270.8 410.3
Infective and parasitic diseases . . . . . . . . . . . . . 21.4 14.2 24.2 26.1 22.6 25.0 21.2 17.6
Common childhood diseases . . . . . . . . . . . . . . . *3.9 *1.1 *0.7 *3.6 *1.9 *3.0 *1.3 *2.5Intestinal virus, unspecified . . . . . . . . . . . . . . . . *8.3 *1.9 *6.7 *4.1 5.5 *6.4 *4.9 *4.3Viral infections, unspecified . . . . . . . . . . . . . . . . *2.9 *3.6 10.5 *4.3 6.5 *6.9 *6.2 *4.1Other . . . . . . . . . . . . . . . . . . . . . . . . . . . . . . *6.4 *7.6 *6.3 *14.1 8.8 *8.6 8.9 *6.7
Respiratory conditions . . . . . . . . . . . . . . . . . . . 94.7 109.1 86.2 140.3 107.1 100.9 110.9 98.3
Common cold . . . . . . . . . . . . . . . . . . . . . . . . 18.9 13.9 12.7 28.5 18.0 18.4 17.7 16.2Other acute upper respiratory infections . . . . . . . . *9.9 *9.1 *7.7 *9.0 9.4 *8.0 10.2 *6.4Influenza . . . . . . . . . . . . . . . . . . . . . . . . . . . 42.3 64.2 46.7 75.0 59.7 61.2 58.8 44.1Acute bronchitis . . . . . . . . . . . . . . . . . . . . . . . *9.6 *11.4 11.8 *10.3 10.0 *4.7 13.2 *14.5Pneumonia . . . . . . . . . . . . . . . . . . . . . . . . . . *13.5 *8.9 *3.4 *13.6 7.2 *6.1 7.9 *15.2Other respiratory conditions . . . . . . . . . . . . . . . . *0.5 *1.6 *3.8 *3.8 *2.8 *2.4 *3.1 *1.9
Digestive system conditions . . . . . . . . . . . . . . . . 18.0 *6.8 16.3 *11.1 12.3 17.2 9.4 16.3
Dental conditions . . . . . . . . . . . . . . . . . . . . . . *1.2 *1.0 *5.2 *4.2 *3.4 *3.6 *3.3 *2.1Indigestion, nausea, and vomiting . . . . . . . . . . . . *0.8 *1.8 *4.4 *2.8 *3.1 *3.0 *3.2 *1.2Other digestive conditions . . . . . . . . . . . . . . . . . *16.1 *4.0 *6.8 *4.1 5.7 *10.5 *2.9 *13.1
Injuries . . . . . . . . . . . . . . . . . . . . . . . . . . . . . 71.8 94.9 150.2 123.7 91.8 103.9 84.5 204.4
Fractures and dislocations . . . . . . . . . . . . . . . . . 18.7 25.0 44.1 37.1 23.2 22.1 23.9 69.1Sprains and strains . . . . . . . . . . . . . . . . . . . . . 32.2 31.8 29.0 31.1 29.5 30.4 28.9 35.8Open wounds and lacerations . . . . . . . . . . . . . . *7.0 *5.7 16.7 *13.6 7.4 *10.4 *5.6 26.4Contusions and superficial injuries . . . . . . . . . . . . *10.1 *4.5 23.0 *14.2 9.7 *9.4 9.8 30.1Other current injuries . . . . . . . . . . . . . . . . . . . . *3.8 27.9 37.4 27.7 22.0 31.5 16.3 43.1
Selected other acute conditions . . . . . . . . . . . . . 38.6 33.9 32.7 36.0 32.4 37.3 29.5 43.9
Eye conditions . . . . . . . . . . . . . . . . . . . . . . . . *0.9 *– *0.7 *1.0 *0.8 *0.9 *0.7 *–Acute ear infections . . . . . . . . . . . . . . . . . . . . . *1.6 *3.7 *2.3 *2.8 *2.9 *2.1 *3.4 *1.4Other ear conditions . . . . . . . . . . . . . . . . . . . . *– *0.5 *1.2 *– *0.1 *– *0.2 *2.0Acute urinary conditions . . . . . . . . . . . . . . . . . . *5.1 *2.2 *7.1 *2.0 *3.4 *6.7 *1.4 *8.2Disorders of menstruation . . . . . . . . . . . . . . . . . *0.1 *0.3 *1.3 *– *0.4 *0.8 *0.2 *1.0Other disorders of female genital tract . . . . . . . . . *2.5 *1.1 *1.2 *3.5 *2.0 *3.6 *1.1 *1.5Delivery and other conditions of pregnancy andpuerperium . . . . . . . . . . . . . . . . . . . . . . . . . *15.8 *5.0 *5.4 *7.5 9.4 *5.1 12.0 *1.6Skin conditions . . . . . . . . . . . . . . . . . . . . . . . . *1.3 *3.1 *2.0 *– *0.8 *1.0 *0.6 *5.3Acute musculoskeletal conditions . . . . . . . . . . . . *8.3 16.3 *9.4 17.8 10.8 14.8 8.3 20.3Headache, excluding migraine . . . . . . . . . . . . . . *0.9 *1.0 *2.0 *1.3 *1.1 *0.8 *1.3 *2.5Fever, unspecified . . . . . . . . . . . . . . . . . . . . . . *1.9 *0.7 *– *– *0.7 *1.4 *0.3 *–
All other acute conditions . . . . . . . . . . . . . . . . . *16.2 27.5 18.7 25.3 19.7 27.2 15.3 29.8
1MSA is metropolitan statistical area.
NOTES: The standard errors and relative standard errors (RSE’s) can be computed by using parameter sets III and X of table II, the frequencies of tables 45 and 78, and the formula presented inrule 4 of appendix I. Estimates for which the numerator has an RSE of more than 30 percent are indicated with an asterisk.
58

Table 41. Number of work-loss days associated with acute conditions for currently employed persons 18 years of age and over, by ageand type of condition: United States, 1994[Data are based on household interviews of the civilian noninstitutionalized population. The survey design, general qualifications, and information on the reliability of theestimates are given in appendix I. Definitions of terms are given in appendix II]
Type of acute condition
All ages18 yearsand over
18–44 years 45 years and over
Total18–24years
25–44years Total
45–64years
Number of work-loss days in thousands
All acute conditions . . . . . . . . . . . . . . . . . . . . . . . . . . . . . 383,759 277,457 52,391 225,066 106,302 99,387
Infective and parasitic diseases . . . . . . . . . . . . . . . . . . . . . 26,511 20,518 6,007 14,511 5,993 5,740
Common childhood diseases . . . . . . . . . . . . . . . . . . . . . . . 2,495 2,495 920 1,575 – –Intestinal virus, unspecified . . . . . . . . . . . . . . . . . . . . . . . . 6,406 4,704 964 3,740 1,703 1,450Viral infections, unspecified . . . . . . . . . . . . . . . . . . . . . . . . 7,364 5,776 2,654 3,123 1,588 1,588Other . . . . . . . . . . . . . . . . . . . . . . . . . . . . . . . . . . . . . . 10,246 7,543 1,470 6,073 2,703 2,703
Respiratory conditions . . . . . . . . . . . . . . . . . . . . . . . . . . . 129,411 92,350 16,791 75,559 37,061 34,573
Common cold . . . . . . . . . . . . . . . . . . . . . . . . . . . . . . . . 21,644 16,181 3,900 12,281 5,463 5,349Other acute upper respiratory infections . . . . . . . . . . . . . . . . 10,760 7,964 1,312 6,652 2,796 2,617Influenza . . . . . . . . . . . . . . . . . . . . . . . . . . . . . . . . . . . 69,320 49,619 9,212 40,406 19,701 18,364Acute bronchitis . . . . . . . . . . . . . . . . . . . . . . . . . . . . . . . 13,488 8,782 1,450 7,332 4,706 4,566Pneumonia . . . . . . . . . . . . . . . . . . . . . . . . . . . . . . . . . . 10,984 7,061 293 6,769 3,922 3,203Other respiratory conditions . . . . . . . . . . . . . . . . . . . . . . . . 3,216 2,742 624 2,119 474 474
Digestive system conditions . . . . . . . . . . . . . . . . . . . . . . . . 16,132 11,191 3,224 7,967 4,941 3,775Dental conditions . . . . . . . . . . . . . . . . . . . . . . . . . . . . . . 3,875 3,247 955 2,292 628 628Indigestion, nausea, and vomiting . . . . . . . . . . . . . . . . . . . . 3,325 2,777 1,217 1,560 548 490Other digestive conditions . . . . . . . . . . . . . . . . . . . . . . . . . 8,931 5,167 1,052 4,115 3,765 2,657
Injuries . . . . . . . . . . . . . . . . . . . . . . . . . . . . . . . . . . . . . 142,009 103,432 15,981 87,451 38,577 36,675
Fractures and dislocations . . . . . . . . . . . . . . . . . . . . . . . . . 40,440 24,602 3,561 21,041 15,838 14,502Sprains and strains . . . . . . . . . . . . . . . . . . . . . . . . . . . . . 37,848 27,626 6,029 21,597 10,221 9,748Open wounds and lacerations . . . . . . . . . . . . . . . . . . . . . . 14,022 13,296 2,062 11,234 727 727Contusions and superficial injuries . . . . . . . . . . . . . . . . . . . . 17,169 13,556 1,279 12,277 3,614 3,614Other current injuries . . . . . . . . . . . . . . . . . . . . . . . . . . . . 32,529 24,352 3,049 21,302 8,178 8,084
Selected other acute conditions . . . . . . . . . . . . . . . . . . . . . 42,825 32,755 7,565 25,191 10,069 9,610
Eye conditions . . . . . . . . . . . . . . . . . . . . . . . . . . . . . . . . 787 661 – 661 126 126Acute ear infections . . . . . . . . . . . . . . . . . . . . . . . . . . . . . 3,195 2,038 587 1,450 1,158 1,158Other ear conditions . . . . . . . . . . . . . . . . . . . . . . . . . . . . 655 591 – 591 65 65Acute urinary conditions . . . . . . . . . . . . . . . . . . . . . . . . . . 5,414 2,663 745 1,918 2,751 2,751Disorders of menstruation . . . . . . . . . . . . . . . . . . . . . . . . . 684 650 253 396 35 35Other disorders of female genital tract . . . . . . . . . . . . . . . . . 2,362 1,889 341 1,549 473 473Delivery and other conditions of pregnancy and puerperium . . . . 9,544 9,544 1,866 7,678 – –Skin conditions . . . . . . . . . . . . . . . . . . . . . . . . . . . . . . . . 2,111 1,228 625 603 883 883Acute musculoskeletal conditions . . . . . . . . . . . . . . . . . . . . 15,682 11,772 2,610 9,162 3,910 3,556Headache, excluding migraine . . . . . . . . . . . . . . . . . . . . . . 1,712 1,313 292 1,021 399 399Fever, unspecified . . . . . . . . . . . . . . . . . . . . . . . . . . . . . . 678 408 245 162 270 166
All other acute conditions . . . . . . . . . . . . . . . . . . . . . . . . . 26,871 17,211 2,823 14,388 9,660 9,013
NOTES: The standard errors and relative standard errors (RSE’s) can be computed by using parameter set III of table II and the formula presented in rule 1 of appendix I. An estimate of 37.6million has a 10-percent RSE; of 9.3 million, a 20-percent RSE; and of 4.2 million, a 30-percent RSE.
59

Table 42. Number of work-loss days associated with acute conditions for currently employed persons 18 years of age and over, by sex,age, and type of condition: United States, 1994[Data are based on household interviews of the civilian noninstitutionalized population. The survey design, general qualifications, and information on the reliability of theestimates are given in appendix I. Definitions of terms are given in appendix II]
Type of acute condition
Male Female
All ages18 yearsand over
18–44years
45 yearsand over
All ages18 yearsand over
18–44years
45 yearsand over
Number of work-loss days in thousands
All acute conditions . . . . . . . . . . . . . . . . . . . . . . . . . . . . . 193,593 141,145 52,448 190,165 136,312 53,854
Infective and parasitic diseases . . . . . . . . . . . . . . . . . . . . . 12,822 10,409 2,413 13,689 10,109 3,580
Common childhood diseases . . . . . . . . . . . . . . . . . . . . . . . 1,299 1,299 – 1,196 1,196 –Intestinal virus, unspecified . . . . . . . . . . . . . . . . . . . . . . . . 3,184 2,651 533 3,222 2,052 1,170Viral infections, unspecified . . . . . . . . . . . . . . . . . . . . . . . . 3,342 3,115 227 4,022 2,661 1,361Other . . . . . . . . . . . . . . . . . . . . . . . . . . . . . . . . . . . . . . 4,997 3,344 1,653 5,249 4,200 1,050
Respiratory conditions . . . . . . . . . . . . . . . . . . . . . . . . . . . 56,766 40,260 16,505 72,646 52,090 20,556
Common cold . . . . . . . . . . . . . . . . . . . . . . . . . . . . . . . . 8,604 7,073 1,531 13,040 9,109 3,931Other acute upper respiratory infections . . . . . . . . . . . . . . . . 3,647 2,429 1,218 7,113 5,536 1,577Influenza . . . . . . . . . . . . . . . . . . . . . . . . . . . . . . . . . . . 36,130 25,713 10,416 33,190 23,905 9,285Acute bronchitis . . . . . . . . . . . . . . . . . . . . . . . . . . . . . . . 4,018 2,478 1,540 9,469 6,304 3,165Pneumonia . . . . . . . . . . . . . . . . . . . . . . . . . . . . . . . . . . 3,794 2,056 1,739 7,189 5,006 2,183Other respiratory conditions . . . . . . . . . . . . . . . . . . . . . . . . 572 512 60 2,644 2,230 414
Digestive system conditions . . . . . . . . . . . . . . . . . . . . . . . . 7,067 4,030 3,037 9,065 7,161 1,904
Dental conditions . . . . . . . . . . . . . . . . . . . . . . . . . . . . . . 2,308 2,095 213 1,568 1,152 415Indigestion, nausea, and vomiting . . . . . . . . . . . . . . . . . . . . 1,009 905 104 2,316 1,872 444Other digestive conditions . . . . . . . . . . . . . . . . . . . . . . . . . 3,750 1,030 2,721 5,181 4,137 1,044
Injuries . . . . . . . . . . . . . . . . . . . . . . . . . . . . . . . . . . . . . 93,092 71,186 21,906 48,916 32,245 16,671
Fractures and dislocations . . . . . . . . . . . . . . . . . . . . . . . . . 28,789 19,608 9,181 11,651 4,995 6,657Sprains and strains . . . . . . . . . . . . . . . . . . . . . . . . . . . . . 19,314 12,472 6,842 18,534 15,154 3,380Open wounds and lacerations . . . . . . . . . . . . . . . . . . . . . . 12,014 11,614 400 2,009 1,682 327Contusions and superficial injuries . . . . . . . . . . . . . . . . . . . . 11,281 9,727 1,554 5,888 3,828 2,060Other current injuries . . . . . . . . . . . . . . . . . . . . . . . . . . . . 21,695 17,765 3,930 10,834 6,586 4,248
Selected other acute conditions . . . . . . . . . . . . . . . . . . . . . 11,732 8,380 3,352 31,093 24,376 6,717
Eye conditions . . . . . . . . . . . . . . . . . . . . . . . . . . . . . . . . 446 446 – 341 216 126Acute ear infections . . . . . . . . . . . . . . . . . . . . . . . . . . . . . 452 325 127 2,743 1,713 1,030Other ear conditions . . . . . . . . . . . . . . . . . . . . . . . . . . . . 65 – 65 591 591 –Acute urinary conditions . . . . . . . . . . . . . . . . . . . . . . . . . . 2,135 365 1,770 3,279 2,298 982Disorders of menstruation . . . . . . . . . . . . . . . . . . . . . . . . . . . . . . . . . . 684 650 35Other disorders of female genital tract . . . . . . . . . . . . . . . . . . . . . . . . . . 2,362 1,889 473Delivery and other conditions of pregnancy and puerperium . . . . . . . . . . . . . 9,544 9,544 –Skin conditions . . . . . . . . . . . . . . . . . . . . . . . . . . . . . . . . 1,167 603 564 944 625 319Acute musculoskeletal conditions . . . . . . . . . . . . . . . . . . . . 6,616 5,835 781 9,066 5,937 3,129Headache, excluding migraine . . . . . . . . . . . . . . . . . . . . . . 558 513 45 1,154 800 354Fever, unspecified . . . . . . . . . . . . . . . . . . . . . . . . . . . . . . 293 293 – 385 114 270
All other acute conditions . . . . . . . . . . . . . . . . . . . . . . . . . 12,114 6,880 5,234 14,758 10,332 4,426
NOTES: The standard errors and relative standard errors (RSE’s) can be computed by using parameter set III of table II and the formula presented in rule 1 of appendix I. An estimate of 37.6million has a 10-percent RSE; of 9.3 million, a 20-percent RSE; and of 4.2 million, a 30-percent RSE.
60

Table 43. Number of work-loss days associated with acute conditions for currently employed persons 18 years of age and over, by race,age, and type of condition: United States, 1994[Data are based on household interviews of the civilian noninstitutionalized population. The survey design, general qualifications, and information on the reliability of theestimates are given in appendix I. Definitions of terms are given in appendix II]
Type of acute condition
White Black
All ages18 yearsand over
18–44years
45 yearsand over
All ages18 yearsand over
18–44years
45 yearsand over
Number of work-loss days in thousands1
All acute conditions . . . . . . . . . . . . . . . . . . . . . . . . . . . . . 317,932 231,731 86,201 52,950 37,706 15,244
Infective and parasitic diseases . . . . . . . . . . . . . . . . . . . . . 19,568 16,167 3,401 6,265 3,673 2,592
Common childhood diseases . . . . . . . . . . . . . . . . . . . . . . . 1,648 1,648 – 847 847 –Intestinal virus, unspecified . . . . . . . . . . . . . . . . . . . . . . . . 4,300 3,688 611 1,631 540 1,091Viral infections, unspecified . . . . . . . . . . . . . . . . . . . . . . . . 5,052 4,157 895 2,163 1,471 692Other . . . . . . . . . . . . . . . . . . . . . . . . . . . . . . . . . . . . . . 8,568 6,674 1,894 1,624 815 808
Respiratory conditions . . . . . . . . . . . . . . . . . . . . . . . . . . . 109,478 80,622 28,856 13,001 8,181 4,820
Common cold . . . . . . . . . . . . . . . . . . . . . . . . . . . . . . . . 17,274 13,415 3,859 2,689 1,610 1,079Other acute upper respiratory infections . . . . . . . . . . . . . . . . 8,941 6,587 2,354 1,315 1,151 164Influenza . . . . . . . . . . . . . . . . . . . . . . . . . . . . . . . . . . . 58,115 43,449 14,666 7,687 5,136 2,551Acute bronchitis . . . . . . . . . . . . . . . . . . . . . . . . . . . . . . . 12,807 8,521 4,286 352 32 320Pneumonia . . . . . . . . . . . . . . . . . . . . . . . . . . . . . . . . . . 10,227 6,983 3,243 757 78 679Other respiratory conditions . . . . . . . . . . . . . . . . . . . . . . . . 2,113 1,667 446 201 174 28
Digestive system conditions . . . . . . . . . . . . . . . . . . . . . . . . 12,681 7,962 4,719 3,276 3,054 222
Dental conditions . . . . . . . . . . . . . . . . . . . . . . . . . . . . . . 2,934 2,389 545 942 858 83Indigestion, nausea, and vomiting . . . . . . . . . . . . . . . . . . . . 2,301 1,892 409 849 711 139Other digestive conditions . . . . . . . . . . . . . . . . . . . . . . . . . 7,447 3,682 3,765 1,485 1,485 –
Injuries . . . . . . . . . . . . . . . . . . . . . . . . . . . . . . . . . . . . . 119,945 86,470 33,475 18,650 14,541 4,109
Fractures and dislocations . . . . . . . . . . . . . . . . . . . . . . . . . 37,223 23,296 13,927 1,719 674 1,045Sprains and strains . . . . . . . . . . . . . . . . . . . . . . . . . . . . . 31,329 21,899 9,430 6,397 5,667 730Open wounds and lacerations . . . . . . . . . . . . . . . . . . . . . . 13,557 12,831 727 208 208 –Contusions and superficial injuries . . . . . . . . . . . . . . . . . . . . 13,586 10,932 2,654 2,323 1,363 960Other current injuries . . . . . . . . . . . . . . . . . . . . . . . . . . . . 24,250 17,512 6,738 8,003 6,630 1,373
Selected other acute conditions . . . . . . . . . . . . . . . . . . . . . 33,724 26,815 6,909 7,672 4,920 2,752
Eye conditions . . . . . . . . . . . . . . . . . . . . . . . . . . . . . . . . 571 446 126 216 216 –Acute ear infections . . . . . . . . . . . . . . . . . . . . . . . . . . . . . 3,057 1,900 1,158 138 138 –Other ear conditions . . . . . . . . . . . . . . . . . . . . . . . . . . . . 655 591 65 – – –Acute urinary conditions . . . . . . . . . . . . . . . . . . . . . . . . . . 4,701 2,603 2,098 714 60 654Disorders of menstruation . . . . . . . . . . . . . . . . . . . . . . . . . 616 616 – 68 33 35Other disorders of female genital tract . . . . . . . . . . . . . . . . . 1,889 1,889 – 406 – 406Delivery and other conditions of pregnancy and puerperium . . . . 6,699 6,699 – 2,241 2,241 –Skin conditions . . . . . . . . . . . . . . . . . . . . . . . . . . . . . . . . 1,536 925 610 – – –Acute musculoskeletal conditions . . . . . . . . . . . . . . . . . . . . 12,272 9,689 2,583 3,341 2,083 1,258Headache, excluding migraine . . . . . . . . . . . . . . . . . . . . . . 1,164 1,164 – 549 150 399Fever, unspecified . . . . . . . . . . . . . . . . . . . . . . . . . . . . . . 564 293 270 – – –
All other acute conditions . . . . . . . . . . . . . . . . . . . . . . . . . 22,536 13,695 8,841 4,088 3,338 750
1Totals for white and black do not sum to total work-loss days because other races are not included.
NOTES: The standard errors and relative standard errors (RSE’s) can be computed by using parameter set III of table II and the formula presented in rule 1 of appendix I. An estimate of 37.6million has a 10-percent RSE; of 9.3 million, a 20-percent RSE; and of 4.2 million, a 30-percent RSE.
61

Table 44. Number of work-loss days associated with acute conditions for currently employed persons 18 years of age and over, byfamily income, age, and type of condition: United States, 1994[Data are based on household interviews of the civilian noninstitutionalized population. The survey design, general qualifications, and information on the reliability of theestimates are given in appendix I. Definitions of terms are given in appendix II]
Type of acute condition
Family income
Less than $10,000 $10,000–$24,999 $25,000 or more
All ages18 yearsand over
18–44years
45 yearsand over
All ages18 yearsand over
18–44years
45 yearsand over
All ages18 yearsand over
18–44years
45 yearsand over
Number of work-loss days in thousands1
All acute conditions . . . . . . . . . . . . . . . . . 26,832 22,729 4,103 93,435 68,952 24,483 211,937 151,756 60,181
Infective and parasitic diseases . . . . . . . . . 1,672 1,672 – 5,514 3,834 1,680 14,865 11,536 3,329
Common childhood diseases . . . . . . . . . . . 344 344 – 272 272 – 1,077 1,077 –Intestinal virus, unspecified . . . . . . . . . . . . – – – 966 917 49 3,617 2,627 990Viral infections, unspecified . . . . . . . . . . . . 785 785 – 1,724 1,724 – 4,529 3,168 1,361Other . . . . . . . . . . . . . . . . . . . . . . . . . . 543 543 – 2,553 921 1,632 5,642 4,664 978
Respiratory conditions . . . . . . . . . . . . . . . 9,334 7,610 1,724 29,330 21,702 7,629 75,068 52,751 22,317
Common cold . . . . . . . . . . . . . . . . . . . . 1,136 1,136 – 5,051 4,068 983 12,508 8,469 4,040Other acute upper respiratory infections . . . . 159 97 62 2,287 1,596 690 7,233 5,788 1,445Influenza . . . . . . . . . . . . . . . . . . . . . . . 6,012 5,024 988 17,218 11,637 5,581 38,565 28,056 10,509Acute bronchitis . . . . . . . . . . . . . . . . . . . 1,530 1,193 337 2,146 1,953 193 7,970 4,592 3,378Pneumonia . . . . . . . . . . . . . . . . . . . . . . 161 161 – 1,182 1,049 132 7,572 4,714 2,858Other respiratory conditions . . . . . . . . . . . . 337 – 337 1,447 1,398 49 1,220 1,132 88
Digestive system conditions . . . . . . . . . . . . 1,279 1,279 – 4,225 3,631 594 9,007 5,008 4,000
Dental conditions . . . . . . . . . . . . . . . . . . 230 230 – 180 180 – 2,170 1,822 347Indigestion, nausea, and vomiting . . . . . . . . 220 220 – 1,259 1,117 142 1,632 1,293 339Other digestive conditions . . . . . . . . . . . . . 830 830 – 2,786 2,334 452 5,206 1,893 3,313
Injuries . . . . . . . . . . . . . . . . . . . . . . . . . 8,972 6,697 2,275 36,471 28,519 7,952 75,750 55,041 20,709
Fractures and dislocations . . . . . . . . . . . . . 1,027 – 1,027 12,212 8,536 3,676 20,312 12,658 7,654Sprains and strains . . . . . . . . . . . . . . . . . 2,737 2,737 – 9,439 6,338 3,101 21,894 15,860 6,035Open wounds and lacerations . . . . . . . . . . 698 631 67 3,705 3,705 – 8,755 8,095 659Contusions and superficial injuries . . . . . . . . 468 468 – 3,270 2,478 792 11,696 9,795 1,901Other current injuries . . . . . . . . . . . . . . . . 4,041 2,861 1,181 7,844 7,461 383 13,093 8,633 4,460
Selected other acute conditions . . . . . . . . . 2,109 2,005 104 9,994 7,754 2,241 25,391 20,040 5,351
Eye conditions . . . . . . . . . . . . . . . . . . . . – – – 126 – 126 511 511 –Acute ear infections . . . . . . . . . . . . . . . . . 62 62 – 327 – 327 2,590 1,976 614Other ear conditions . . . . . . . . . . . . . . . . – – – 163 98 65 492 492 –Acute urinary conditions . . . . . . . . . . . . . . – – – 167 61 106 2,762 1,714 1,048Disorders of menstruation . . . . . . . . . . . . . – – – – – – 428 394 35Other disorders of female genital tract . . . . . – – – 761 761 – 1,432 959 473Delivery and other conditions of pregnancyand puerperium . . . . . . . . . . . . . . . . . . 108 108 – 1,585 1,585 – 7,850 7,850 –
Skin conditions . . . . . . . . . . . . . . . . . . . . – – – 824 603 221 953 625 328Acute musculoskeletal conditions . . . . . . . . 1,781 1,781 – 5,251 3,854 1,397 7,367 5,017 2,350Headache, excluding migraine . . . . . . . . . . – – – 731 731 – 624 286 338Fever, unspecified . . . . . . . . . . . . . . . . . . 158 54 104 60 60 – 383 217 166
All other acute conditions . . . . . . . . . . . . . 3,465 3,465 – 7,900 3,513 4,387 11,856 7,381 4,475
1Totals for income categories do not sum to total work-loss days because persons with unknown family income are not included.
NOTES: The standard errors and relative standard errors (RSE’s) can be computed by using parameter set III of table II and the formula presented in rule 1 of appendix I. An estimate of 37.6million has a 10-percent RSE; of 9.3 million, a 20-percent RSE; and of 4.2 million, a 30-percent RSE.
62
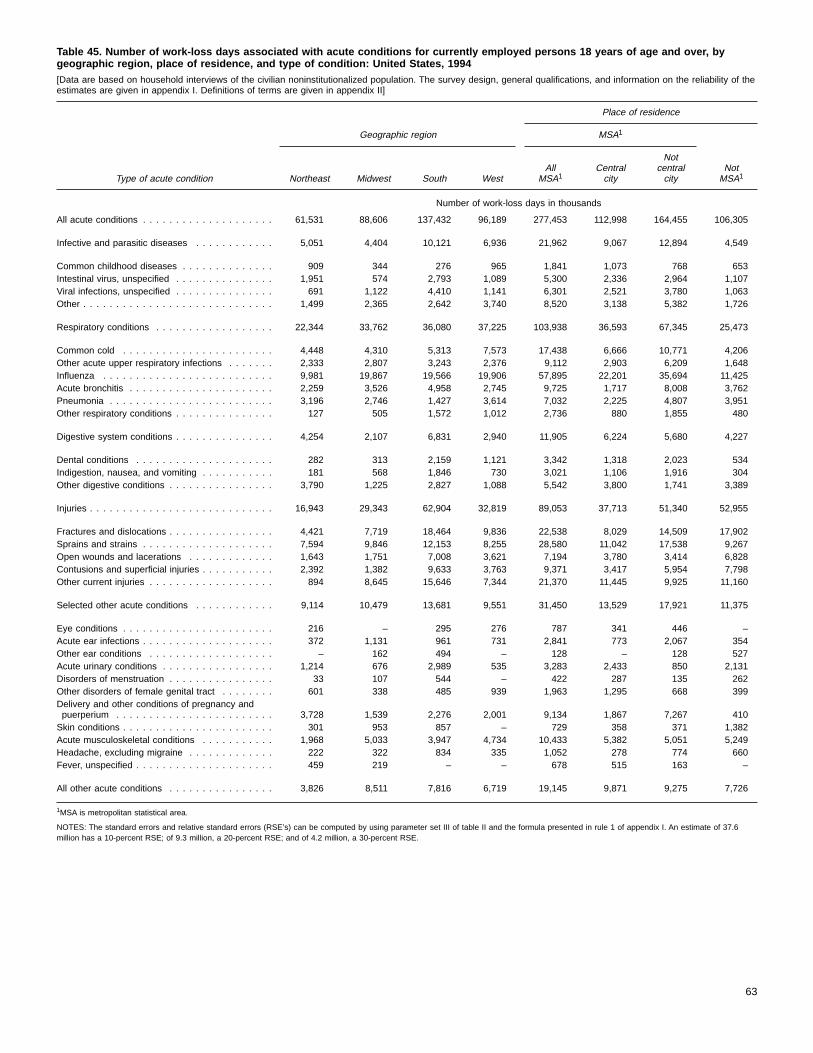
Table 45. Number of work-loss days associated with acute conditions for currently employed persons 18 years of age and over, bygeographic region, place of residence, and type of condition: United States, 1994[Data are based on household interviews of the civilian noninstitutionalized population. The survey design, general qualifications, and information on the reliability of theestimates are given in appendix I. Definitions of terms are given in appendix II]
Type of acute condition
Place of residence
Geographic region MSA1
Northeast Midwest South WestAll
MSA1Centralcity
Notcentralcity
NotMSA1
Number of work-loss days in thousands
All acute conditions . . . . . . . . . . . . . . . . . . . . 61,531 88,606 137,432 96,189 277,453 112,998 164,455 106,305
Infective and parasitic diseases . . . . . . . . . . . . 5,051 4,404 10,121 6,936 21,962 9,067 12,894 4,549
Common childhood diseases . . . . . . . . . . . . . . 909 344 276 965 1,841 1,073 768 653Intestinal virus, unspecified . . . . . . . . . . . . . . . 1,951 574 2,793 1,089 5,300 2,336 2,964 1,107Viral infections, unspecified . . . . . . . . . . . . . . . 691 1,122 4,410 1,141 6,301 2,521 3,780 1,063Other . . . . . . . . . . . . . . . . . . . . . . . . . . . . . 1,499 2,365 2,642 3,740 8,520 3,138 5,382 1,726
Respiratory conditions . . . . . . . . . . . . . . . . . . 22,344 33,762 36,080 37,225 103,938 36,593 67,345 25,473
Common cold . . . . . . . . . . . . . . . . . . . . . . . 4,448 4,310 5,313 7,573 17,438 6,666 10,771 4,206Other acute upper respiratory infections . . . . . . . 2,333 2,807 3,243 2,376 9,112 2,903 6,209 1,648Influenza . . . . . . . . . . . . . . . . . . . . . . . . . . 9,981 19,867 19,566 19,906 57,895 22,201 35,694 11,425Acute bronchitis . . . . . . . . . . . . . . . . . . . . . . 2,259 3,526 4,958 2,745 9,725 1,717 8,008 3,762Pneumonia . . . . . . . . . . . . . . . . . . . . . . . . . 3,196 2,746 1,427 3,614 7,032 2,225 4,807 3,951Other respiratory conditions . . . . . . . . . . . . . . . 127 505 1,572 1,012 2,736 880 1,855 480
Digestive system conditions . . . . . . . . . . . . . . . 4,254 2,107 6,831 2,940 11,905 6,224 5,680 4,227
Dental conditions . . . . . . . . . . . . . . . . . . . . . 282 313 2,159 1,121 3,342 1,318 2,023 534Indigestion, nausea, and vomiting . . . . . . . . . . . 181 568 1,846 730 3,021 1,106 1,916 304Other digestive conditions . . . . . . . . . . . . . . . . 3,790 1,225 2,827 1,088 5,542 3,800 1,741 3,389
Injuries . . . . . . . . . . . . . . . . . . . . . . . . . . . . 16,943 29,343 62,904 32,819 89,053 37,713 51,340 52,955
Fractures and dislocations . . . . . . . . . . . . . . . . 4,421 7,719 18,464 9,836 22,538 8,029 14,509 17,902Sprains and strains . . . . . . . . . . . . . . . . . . . . 7,594 9,846 12,153 8,255 28,580 11,042 17,538 9,267Open wounds and lacerations . . . . . . . . . . . . . 1,643 1,751 7,008 3,621 7,194 3,780 3,414 6,828Contusions and superficial injuries . . . . . . . . . . . 2,392 1,382 9,633 3,763 9,371 3,417 5,954 7,798Other current injuries . . . . . . . . . . . . . . . . . . . 894 8,645 15,646 7,344 21,370 11,445 9,925 11,160
Selected other acute conditions . . . . . . . . . . . . 9,114 10,479 13,681 9,551 31,450 13,529 17,921 11,375
Eye conditions . . . . . . . . . . . . . . . . . . . . . . . 216 – 295 276 787 341 446 –Acute ear infections . . . . . . . . . . . . . . . . . . . . 372 1,131 961 731 2,841 773 2,067 354Other ear conditions . . . . . . . . . . . . . . . . . . . – 162 494 – 128 – 128 527Acute urinary conditions . . . . . . . . . . . . . . . . . 1,214 676 2,989 535 3,283 2,433 850 2,131Disorders of menstruation . . . . . . . . . . . . . . . . 33 107 544 – 422 287 135 262Other disorders of female genital tract . . . . . . . . 601 338 485 939 1,963 1,295 668 399Delivery and other conditions of pregnancy andpuerperium . . . . . . . . . . . . . . . . . . . . . . . . 3,728 1,539 2,276 2,001 9,134 1,867 7,267 410Skin conditions . . . . . . . . . . . . . . . . . . . . . . . 301 953 857 – 729 358 371 1,382Acute musculoskeletal conditions . . . . . . . . . . . 1,968 5,033 3,947 4,734 10,433 5,382 5,051 5,249Headache, excluding migraine . . . . . . . . . . . . . 222 322 834 335 1,052 278 774 660Fever, unspecified . . . . . . . . . . . . . . . . . . . . . 459 219 – – 678 515 163 –
All other acute conditions . . . . . . . . . . . . . . . . 3,826 8,511 7,816 6,719 19,145 9,871 9,275 7,726
1MSA is metropolitan statistical area.
NOTES: The standard errors and relative standard errors (RSE’s) can be computed by using parameter set III of table II and the formula presented in rule 1 of appendix I. An estimate of 37.6million has a 10-percent RSE; of 9.3 million, a 20-percent RSE; and of 4.2 million, a 30-percent RSE.
63
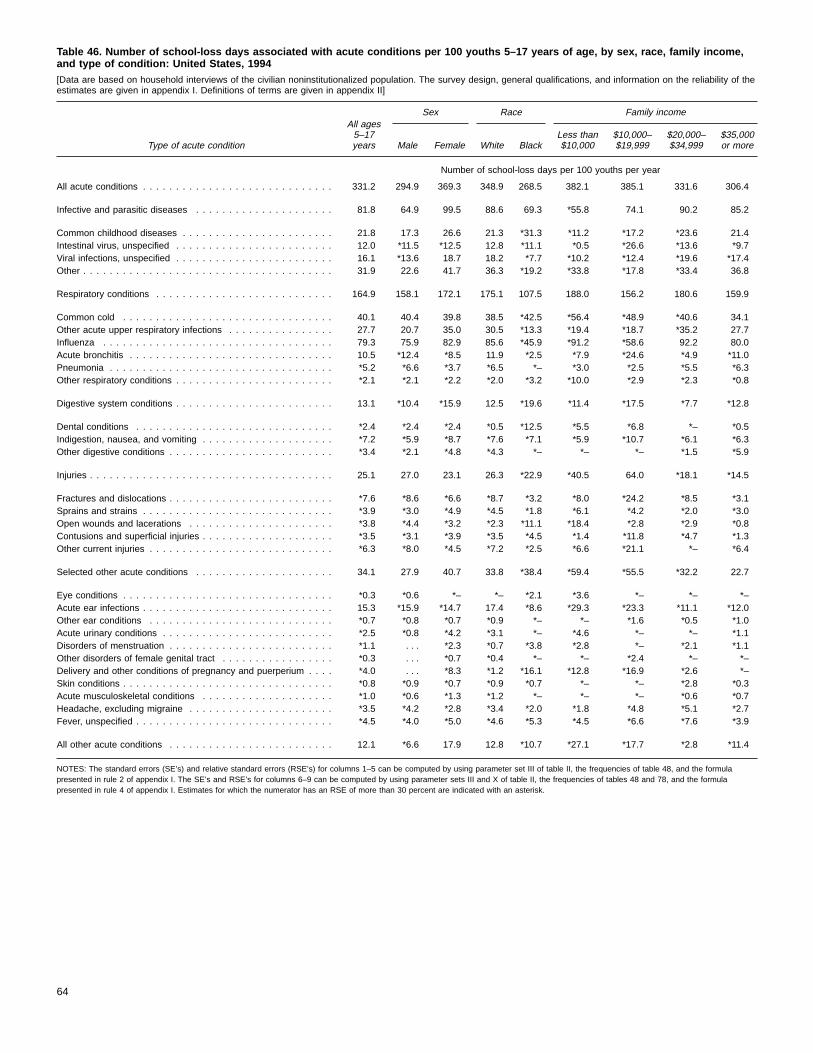
Table 46. Number of school-loss days associated with acute conditions per 100 youths 5–17 years of age, by sex, race, family income,and type of condition: United States, 1994[Data are based on household interviews of the civilian noninstitutionalized population. The survey design, general qualifications, and information on the reliability of theestimates are given in appendix I. Definitions of terms are given in appendix II]
Type of acute condition
All ages5–17years
Sex Race Family income
Male Female White BlackLess than$10,000
$10,000–$19,999
$20,000–$34,999
$35,000or more
Number of school-loss days per 100 youths per year
All acute conditions . . . . . . . . . . . . . . . . . . . . . . . . . . . . . 331.2 294.9 369.3 348.9 268.5 382.1 385.1 331.6 306.4
Infective and parasitic diseases . . . . . . . . . . . . . . . . . . . . . 81.8 64.9 99.5 88.6 69.3 *55.8 74.1 90.2 85.2
Common childhood diseases . . . . . . . . . . . . . . . . . . . . . . . 21.8 17.3 26.6 21.3 *31.3 *11.2 *17.2 *23.6 21.4Intestinal virus, unspecified . . . . . . . . . . . . . . . . . . . . . . . . 12.0 *11.5 *12.5 12.8 *11.1 *0.5 *26.6 *13.6 *9.7Viral infections, unspecified . . . . . . . . . . . . . . . . . . . . . . . . 16.1 *13.6 18.7 18.2 *7.7 *10.2 *12.4 *19.6 *17.4Other . . . . . . . . . . . . . . . . . . . . . . . . . . . . . . . . . . . . . . 31.9 22.6 41.7 36.3 *19.2 *33.8 *17.8 *33.4 36.8
Respiratory conditions . . . . . . . . . . . . . . . . . . . . . . . . . . . 164.9 158.1 172.1 175.1 107.5 188.0 156.2 180.6 159.9
Common cold . . . . . . . . . . . . . . . . . . . . . . . . . . . . . . . . 40.1 40.4 39.8 38.5 *42.5 *56.4 *48.9 *40.6 34.1Other acute upper respiratory infections . . . . . . . . . . . . . . . . 27.7 20.7 35.0 30.5 *13.3 *19.4 *18.7 *35.2 27.7Influenza . . . . . . . . . . . . . . . . . . . . . . . . . . . . . . . . . . . 79.3 75.9 82.9 85.6 *45.9 *91.2 *58.6 92.2 80.0Acute bronchitis . . . . . . . . . . . . . . . . . . . . . . . . . . . . . . . 10.5 *12.4 *8.5 11.9 *2.5 *7.9 *24.6 *4.9 *11.0Pneumonia . . . . . . . . . . . . . . . . . . . . . . . . . . . . . . . . . . *5.2 *6.6 *3.7 *6.5 *– *3.0 *2.5 *5.5 *6.3Other respiratory conditions . . . . . . . . . . . . . . . . . . . . . . . . *2.1 *2.1 *2.2 *2.0 *3.2 *10.0 *2.9 *2.3 *0.8
Digestive system conditions . . . . . . . . . . . . . . . . . . . . . . . . 13.1 *10.4 *15.9 12.5 *19.6 *11.4 *17.5 *7.7 *12.8
Dental conditions . . . . . . . . . . . . . . . . . . . . . . . . . . . . . . *2.4 *2.4 *2.4 *0.5 *12.5 *5.5 *6.8 *– *0.5Indigestion, nausea, and vomiting . . . . . . . . . . . . . . . . . . . . *7.2 *5.9 *8.7 *7.6 *7.1 *5.9 *10.7 *6.1 *6.3Other digestive conditions . . . . . . . . . . . . . . . . . . . . . . . . . *3.4 *2.1 *4.8 *4.3 *– *– *– *1.5 *5.9
Injuries . . . . . . . . . . . . . . . . . . . . . . . . . . . . . . . . . . . . . 25.1 27.0 23.1 26.3 *22.9 *40.5 64.0 *18.1 *14.5
Fractures and dislocations . . . . . . . . . . . . . . . . . . . . . . . . . *7.6 *8.6 *6.6 *8.7 *3.2 *8.0 *24.2 *8.5 *3.1Sprains and strains . . . . . . . . . . . . . . . . . . . . . . . . . . . . . *3.9 *3.0 *4.9 *4.5 *1.8 *6.1 *4.2 *2.0 *3.0Open wounds and lacerations . . . . . . . . . . . . . . . . . . . . . . *3.8 *4.4 *3.2 *2.3 *11.1 *18.4 *2.8 *2.9 *0.8Contusions and superficial injuries . . . . . . . . . . . . . . . . . . . . *3.5 *3.1 *3.9 *3.5 *4.5 *1.4 *11.8 *4.7 *1.3Other current injuries . . . . . . . . . . . . . . . . . . . . . . . . . . . . *6.3 *8.0 *4.5 *7.2 *2.5 *6.6 *21.1 *– *6.4
Selected other acute conditions . . . . . . . . . . . . . . . . . . . . . 34.1 27.9 40.7 33.8 *38.4 *59.4 *55.5 *32.2 22.7
Eye conditions . . . . . . . . . . . . . . . . . . . . . . . . . . . . . . . . *0.3 *0.6 *– *– *2.1 *3.6 *– *– *–Acute ear infections . . . . . . . . . . . . . . . . . . . . . . . . . . . . . 15.3 *15.9 *14.7 17.4 *8.6 *29.3 *23.3 *11.1 *12.0Other ear conditions . . . . . . . . . . . . . . . . . . . . . . . . . . . . *0.7 *0.8 *0.7 *0.9 *– *– *1.6 *0.5 *1.0Acute urinary conditions . . . . . . . . . . . . . . . . . . . . . . . . . . *2.5 *0.8 *4.2 *3.1 *– *4.6 *– *– *1.1Disorders of menstruation . . . . . . . . . . . . . . . . . . . . . . . . . *1.1 . . . *2.3 *0.7 *3.8 *2.8 *– *2.1 *1.1Other disorders of female genital tract . . . . . . . . . . . . . . . . . *0.3 . . . *0.7 *0.4 *– *– *2.4 *– *–Delivery and other conditions of pregnancy and puerperium . . . . *4.0 . . . *8.3 *1.2 *16.1 *12.8 *16.9 *2.6 *–Skin conditions . . . . . . . . . . . . . . . . . . . . . . . . . . . . . . . . *0.8 *0.9 *0.7 *0.9 *0.7 *– *– *2.8 *0.3Acute musculoskeletal conditions . . . . . . . . . . . . . . . . . . . . *1.0 *0.6 *1.3 *1.2 *– *– *– *0.6 *0.7Headache, excluding migraine . . . . . . . . . . . . . . . . . . . . . . *3.5 *4.2 *2.8 *3.4 *2.0 *1.8 *4.8 *5.1 *2.7Fever, unspecified . . . . . . . . . . . . . . . . . . . . . . . . . . . . . . *4.5 *4.0 *5.0 *4.6 *5.3 *4.5 *6.6 *7.6 *3.9
All other acute conditions . . . . . . . . . . . . . . . . . . . . . . . . . 12.1 *6.6 17.9 12.8 *10.7 *27.1 *17.7 *2.8 *11.4
NOTES: The standard errors (SE’s) and relative standard errors (RSE’s) for columns 1–5 can be computed by using parameter set III of table II, the frequencies of table 48, and the formulapresented in rule 2 of appendix I. The SE’s and RSE’s for columns 6–9 can be computed by using parameter sets III and X of table II, the frequencies of tables 48 and 78, and the formulapresented in rule 4 of appendix I. Estimates for which the numerator has an RSE of more than 30 percent are indicated with an asterisk.
64
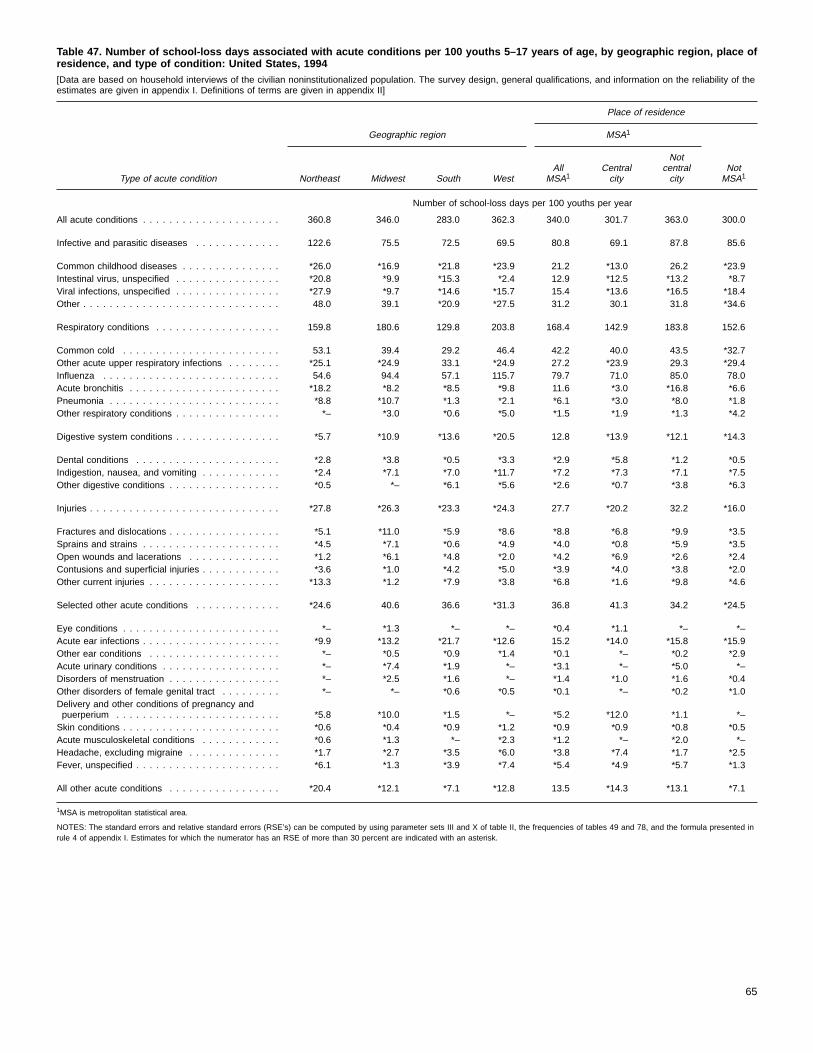
Table 47. Number of school-loss days associated with acute conditions per 100 youths 5–17 years of age, by geographic region, place ofresidence, and type of condition: United States, 1994[Data are based on household interviews of the civilian noninstitutionalized population. The survey design, general qualifications, and information on the reliability of theestimates are given in appendix I. Definitions of terms are given in appendix II]
Type of acute condition
Place of residence
Geographic region MSA1
Northeast Midwest South WestAll
MSA1Centralcity
Notcentralcity
NotMSA1
Number of school-loss days per 100 youths per year
All acute conditions . . . . . . . . . . . . . . . . . . . . . 360.8 346.0 283.0 362.3 340.0 301.7 363.0 300.0
Infective and parasitic diseases . . . . . . . . . . . . . 122.6 75.5 72.5 69.5 80.8 69.1 87.8 85.6
Common childhood diseases . . . . . . . . . . . . . . . *26.0 *16.9 *21.8 *23.9 21.2 *13.0 26.2 *23.9Intestinal virus, unspecified . . . . . . . . . . . . . . . . *20.8 *9.9 *15.3 *2.4 12.9 *12.5 *13.2 *8.7Viral infections, unspecified . . . . . . . . . . . . . . . . *27.9 *9.7 *14.6 *15.7 15.4 *13.6 *16.5 *18.4Other . . . . . . . . . . . . . . . . . . . . . . . . . . . . . . 48.0 39.1 *20.9 *27.5 31.2 30.1 31.8 *34.6
Respiratory conditions . . . . . . . . . . . . . . . . . . . 159.8 180.6 129.8 203.8 168.4 142.9 183.8 152.6
Common cold . . . . . . . . . . . . . . . . . . . . . . . . 53.1 39.4 29.2 46.4 42.2 40.0 43.5 *32.7Other acute upper respiratory infections . . . . . . . . *25.1 *24.9 33.1 *24.9 27.2 *23.9 29.3 *29.4Influenza . . . . . . . . . . . . . . . . . . . . . . . . . . . 54.6 94.4 57.1 115.7 79.7 71.0 85.0 78.0Acute bronchitis . . . . . . . . . . . . . . . . . . . . . . . *18.2 *8.2 *8.5 *9.8 11.6 *3.0 *16.8 *6.6Pneumonia . . . . . . . . . . . . . . . . . . . . . . . . . . *8.8 *10.7 *1.3 *2.1 *6.1 *3.0 *8.0 *1.8Other respiratory conditions . . . . . . . . . . . . . . . . *– *3.0 *0.6 *5.0 *1.5 *1.9 *1.3 *4.2
Digestive system conditions . . . . . . . . . . . . . . . . *5.7 *10.9 *13.6 *20.5 12.8 *13.9 *12.1 *14.3
Dental conditions . . . . . . . . . . . . . . . . . . . . . . *2.8 *3.8 *0.5 *3.3 *2.9 *5.8 *1.2 *0.5Indigestion, nausea, and vomiting . . . . . . . . . . . . *2.4 *7.1 *7.0 *11.7 *7.2 *7.3 *7.1 *7.5Other digestive conditions . . . . . . . . . . . . . . . . . *0.5 *– *6.1 *5.6 *2.6 *0.7 *3.8 *6.3
Injuries . . . . . . . . . . . . . . . . . . . . . . . . . . . . . *27.8 *26.3 *23.3 *24.3 27.7 *20.2 32.2 *16.0
Fractures and dislocations . . . . . . . . . . . . . . . . . *5.1 *11.0 *5.9 *8.6 *8.8 *6.8 *9.9 *3.5Sprains and strains . . . . . . . . . . . . . . . . . . . . . *4.5 *7.1 *0.6 *4.9 *4.0 *0.8 *5.9 *3.5Open wounds and lacerations . . . . . . . . . . . . . . *1.2 *6.1 *4.8 *2.0 *4.2 *6.9 *2.6 *2.4Contusions and superficial injuries . . . . . . . . . . . . *3.6 *1.0 *4.2 *5.0 *3.9 *4.0 *3.8 *2.0Other current injuries . . . . . . . . . . . . . . . . . . . . *13.3 *1.2 *7.9 *3.8 *6.8 *1.6 *9.8 *4.6
Selected other acute conditions . . . . . . . . . . . . . *24.6 40.6 36.6 *31.3 36.8 41.3 34.2 *24.5
Eye conditions . . . . . . . . . . . . . . . . . . . . . . . . *– *1.3 *– *– *0.4 *1.1 *– *–Acute ear infections . . . . . . . . . . . . . . . . . . . . . *9.9 *13.2 *21.7 *12.6 15.2 *14.0 *15.8 *15.9Other ear conditions . . . . . . . . . . . . . . . . . . . . *– *0.5 *0.9 *1.4 *0.1 *– *0.2 *2.9Acute urinary conditions . . . . . . . . . . . . . . . . . . *– *7.4 *1.9 *– *3.1 *– *5.0 *–Disorders of menstruation . . . . . . . . . . . . . . . . . *– *2.5 *1.6 *– *1.4 *1.0 *1.6 *0.4Other disorders of female genital tract . . . . . . . . . *– *– *0.6 *0.5 *0.1 *– *0.2 *1.0Delivery and other conditions of pregnancy andpuerperium . . . . . . . . . . . . . . . . . . . . . . . . . *5.8 *10.0 *1.5 *– *5.2 *12.0 *1.1 *–Skin conditions . . . . . . . . . . . . . . . . . . . . . . . . *0.6 *0.4 *0.9 *1.2 *0.9 *0.9 *0.8 *0.5Acute musculoskeletal conditions . . . . . . . . . . . . *0.6 *1.3 *– *2.3 *1.2 *– *2.0 *–Headache, excluding migraine . . . . . . . . . . . . . . *1.7 *2.7 *3.5 *6.0 *3.8 *7.4 *1.7 *2.5Fever, unspecified . . . . . . . . . . . . . . . . . . . . . . *6.1 *1.3 *3.9 *7.4 *5.4 *4.9 *5.7 *1.3
All other acute conditions . . . . . . . . . . . . . . . . . *20.4 *12.1 *7.1 *12.8 13.5 *14.3 *13.1 *7.1
1MSA is metropolitan statistical area.
NOTES: The standard errors and relative standard errors (RSE’s) can be computed by using parameter sets III and X of table II, the frequencies of tables 49 and 78, and the formula presented inrule 4 of appendix I. Estimates for which the numerator has an RSE of more than 30 percent are indicated with an asterisk.
65
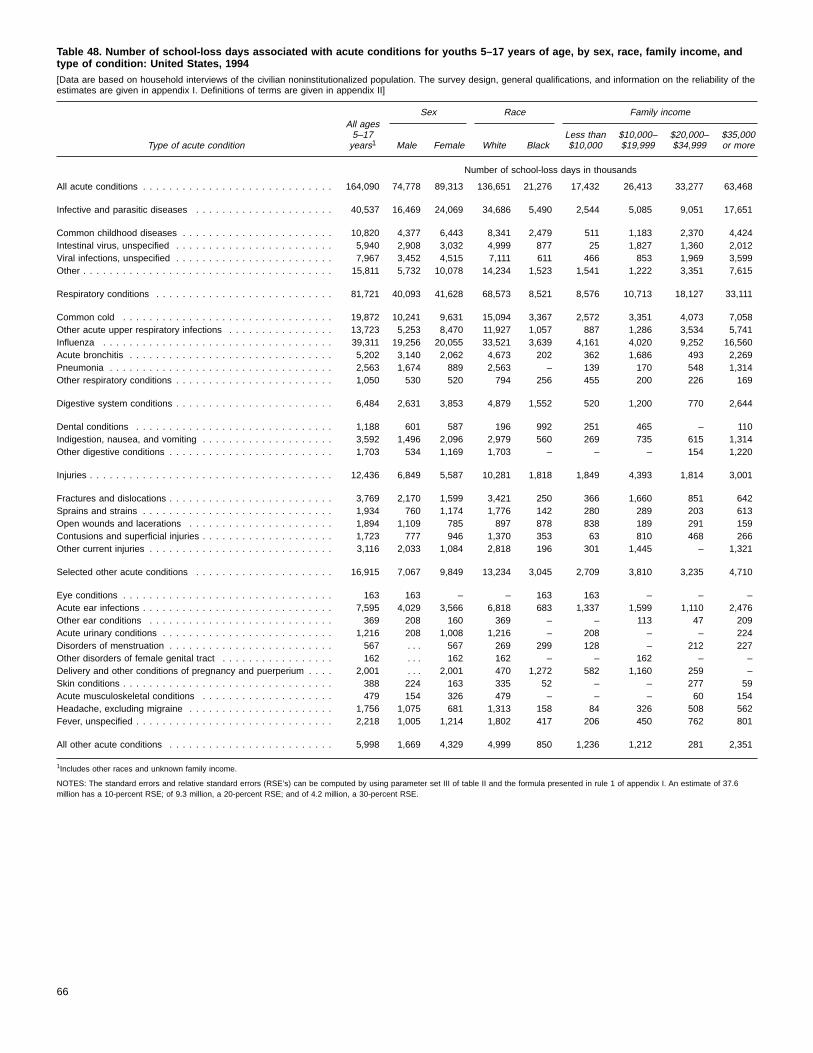
Table 48. Number of school-loss days associated with acute conditions for youths 5–17 years of age, by sex, race, family income, andtype of condition: United States, 1994[Data are based on household interviews of the civilian noninstitutionalized population. The survey design, general qualifications, and information on the reliability of theestimates are given in appendix I. Definitions of terms are given in appendix II]
Type of acute condition
All ages5–17years1
Sex Race Family income
Male Female White BlackLess than$10,000
$10,000–$19,999
$20,000–$34,999
$35,000or more
Number of school-loss days in thousands
All acute conditions . . . . . . . . . . . . . . . . . . . . . . . . . . . . . 164,090 74,778 89,313 136,651 21,276 17,432 26,413 33,277 63,468
Infective and parasitic diseases . . . . . . . . . . . . . . . . . . . . . 40,537 16,469 24,069 34,686 5,490 2,544 5,085 9,051 17,651
Common childhood diseases . . . . . . . . . . . . . . . . . . . . . . . 10,820 4,377 6,443 8,341 2,479 511 1,183 2,370 4,424Intestinal virus, unspecified . . . . . . . . . . . . . . . . . . . . . . . . 5,940 2,908 3,032 4,999 877 25 1,827 1,360 2,012Viral infections, unspecified . . . . . . . . . . . . . . . . . . . . . . . . 7,967 3,452 4,515 7,111 611 466 853 1,969 3,599Other . . . . . . . . . . . . . . . . . . . . . . . . . . . . . . . . . . . . . . 15,811 5,732 10,078 14,234 1,523 1,541 1,222 3,351 7,615
Respiratory conditions . . . . . . . . . . . . . . . . . . . . . . . . . . . 81,721 40,093 41,628 68,573 8,521 8,576 10,713 18,127 33,111
Common cold . . . . . . . . . . . . . . . . . . . . . . . . . . . . . . . . 19,872 10,241 9,631 15,094 3,367 2,572 3,351 4,073 7,058Other acute upper respiratory infections . . . . . . . . . . . . . . . . 13,723 5,253 8,470 11,927 1,057 887 1,286 3,534 5,741Influenza . . . . . . . . . . . . . . . . . . . . . . . . . . . . . . . . . . . 39,311 19,256 20,055 33,521 3,639 4,161 4,020 9,252 16,560Acute bronchitis . . . . . . . . . . . . . . . . . . . . . . . . . . . . . . . 5,202 3,140 2,062 4,673 202 362 1,686 493 2,269Pneumonia . . . . . . . . . . . . . . . . . . . . . . . . . . . . . . . . . . 2,563 1,674 889 2,563 – 139 170 548 1,314Other respiratory conditions . . . . . . . . . . . . . . . . . . . . . . . . 1,050 530 520 794 256 455 200 226 169
Digestive system conditions . . . . . . . . . . . . . . . . . . . . . . . . 6,484 2,631 3,853 4,879 1,552 520 1,200 770 2,644
Dental conditions . . . . . . . . . . . . . . . . . . . . . . . . . . . . . . 1,188 601 587 196 992 251 465 – 110Indigestion, nausea, and vomiting . . . . . . . . . . . . . . . . . . . . 3,592 1,496 2,096 2,979 560 269 735 615 1,314Other digestive conditions . . . . . . . . . . . . . . . . . . . . . . . . . 1,703 534 1,169 1,703 – – – 154 1,220
Injuries . . . . . . . . . . . . . . . . . . . . . . . . . . . . . . . . . . . . . 12,436 6,849 5,587 10,281 1,818 1,849 4,393 1,814 3,001
Fractures and dislocations . . . . . . . . . . . . . . . . . . . . . . . . . 3,769 2,170 1,599 3,421 250 366 1,660 851 642Sprains and strains . . . . . . . . . . . . . . . . . . . . . . . . . . . . . 1,934 760 1,174 1,776 142 280 289 203 613Open wounds and lacerations . . . . . . . . . . . . . . . . . . . . . . 1,894 1,109 785 897 878 838 189 291 159Contusions and superficial injuries . . . . . . . . . . . . . . . . . . . . 1,723 777 946 1,370 353 63 810 468 266Other current injuries . . . . . . . . . . . . . . . . . . . . . . . . . . . . 3,116 2,033 1,084 2,818 196 301 1,445 – 1,321
Selected other acute conditions . . . . . . . . . . . . . . . . . . . . . 16,915 7,067 9,849 13,234 3,045 2,709 3,810 3,235 4,710
Eye conditions . . . . . . . . . . . . . . . . . . . . . . . . . . . . . . . . 163 163 – – 163 163 – – –Acute ear infections . . . . . . . . . . . . . . . . . . . . . . . . . . . . . 7,595 4,029 3,566 6,818 683 1,337 1,599 1,110 2,476Other ear conditions . . . . . . . . . . . . . . . . . . . . . . . . . . . . 369 208 160 369 – – 113 47 209Acute urinary conditions . . . . . . . . . . . . . . . . . . . . . . . . . . 1,216 208 1,008 1,216 – 208 – – 224Disorders of menstruation . . . . . . . . . . . . . . . . . . . . . . . . . 567 . . . 567 269 299 128 – 212 227Other disorders of female genital tract . . . . . . . . . . . . . . . . . 162 . . . 162 162 – – 162 – –Delivery and other conditions of pregnancy and puerperium . . . . 2,001 . . . 2,001 470 1,272 582 1,160 259 –Skin conditions . . . . . . . . . . . . . . . . . . . . . . . . . . . . . . . . 388 224 163 335 52 – – 277 59Acute musculoskeletal conditions . . . . . . . . . . . . . . . . . . . . 479 154 326 479 – – – 60 154Headache, excluding migraine . . . . . . . . . . . . . . . . . . . . . . 1,756 1,075 681 1,313 158 84 326 508 562Fever, unspecified . . . . . . . . . . . . . . . . . . . . . . . . . . . . . . 2,218 1,005 1,214 1,802 417 206 450 762 801
All other acute conditions . . . . . . . . . . . . . . . . . . . . . . . . . 5,998 1,669 4,329 4,999 850 1,236 1,212 281 2,351
1Includes other races and unknown family income.
NOTES: The standard errors and relative standard errors (RSE’s) can be computed by using parameter set III of table II and the formula presented in rule 1 of appendix I. An estimate of 37.6million has a 10-percent RSE; of 9.3 million, a 20-percent RSE; and of 4.2 million, a 30-percent RSE.
66

Table 49. Number of school-loss days associated with acute conditions for youths 5–17 years of age, by geographic region, place ofresidence, and type of condition: United States, 1994[Data are based on household interviews of the civilian noninstitutionalized population. The survey design, general qualifications, and information on the reliability of theestimates are given in appendix I. Definitions of terms are given in appendix II]
Type of acute condition
Place of residence
Geographic region MSA1
Northeast Midwest South WestAll
MSA1Centralcity
Notcentralcity
NotMSA1
Number of school-loss days in thousands
All acute conditions . . . . . . . . . . . . . . . . . . . . . 33,047 42,129 47,406 41,508 131,414 43,792 87,622 32,676
Infective and parasitic diseases . . . . . . . . . . . . . 11,227 9,199 12,148 7,964 31,217 10,035 21,182 9,320
Common childhood diseases . . . . . . . . . . . . . . . 2,377 2,056 3,645 2,742 8,213 1,883 6,330 2,607Intestinal virus, unspecified . . . . . . . . . . . . . . . . 1,905 1,206 2,557 272 4,997 1,818 3,180 943Viral infections, unspecified . . . . . . . . . . . . . . . . 2,551 1,176 2,445 1,794 5,960 1,971 3,989 2,006Other . . . . . . . . . . . . . . . . . . . . . . . . . . . . . . 4,394 4,761 3,500 3,155 12,047 4,363 7,683 3,764
Respiratory conditions . . . . . . . . . . . . . . . . . . . 14,634 21,989 21,746 23,352 65,102 20,743 44,360 16,618
Common cold . . . . . . . . . . . . . . . . . . . . . . . . 4,868 4,793 4,892 5,318 16,309 5,812 10,497 3,562Other acute upper respiratory infections . . . . . . . . 2,299 3,031 5,543 2,849 10,524 3,463 7,062 3,198Influenza . . . . . . . . . . . . . . . . . . . . . . . . . . . 4,997 11,499 9,562 13,253 30,815 10,304 20,511 8,496Acute bronchitis . . . . . . . . . . . . . . . . . . . . . . . 1,667 995 1,423 1,117 4,487 440 4,047 715Pneumonia . . . . . . . . . . . . . . . . . . . . . . . . . . 803 1,300 222 238 2,372 440 1,931 192Other respiratory conditions . . . . . . . . . . . . . . . . – 371 104 576 595 283 312 455
Digestive system conditions . . . . . . . . . . . . . . . . 524 1,323 2,282 2,354 4,930 2,018 2,911 1,554
Dental conditions . . . . . . . . . . . . . . . . . . . . . . 259 465 89 375 1,135 847 288 53Indigestion, nausea, and vomiting . . . . . . . . . . . . 217 859 1,175 1,342 2,775 1,065 1,709 818Other digestive conditions . . . . . . . . . . . . . . . . . 48 – 1,018 637 1,021 107 914 683
Injuries . . . . . . . . . . . . . . . . . . . . . . . . . . . . . 2,544 3,202 3,906 2,783 10,694 2,932 7,762 1,741
Fractures and dislocations . . . . . . . . . . . . . . . . . 469 1,334 982 984 3,390 992 2,398 378Sprains and strains . . . . . . . . . . . . . . . . . . . . . 415 865 95 558 1,550 117 1,433 384Open wounds and lacerations . . . . . . . . . . . . . . 110 747 805 232 1,638 1,005 634 256Contusions and superficial injuries . . . . . . . . . . . . 333 116 703 571 1,499 579 921 223Other current injuries . . . . . . . . . . . . . . . . . . . . 1,216 141 1,322 438 2,616 239 2,376 501
Selected other acute conditions . . . . . . . . . . . . . 2,254 4,942 6,130 3,589 14,242 5,994 8,248 2,673
Eye conditions . . . . . . . . . . . . . . . . . . . . . . . . – 163 – – 163 163 – –Acute ear infections . . . . . . . . . . . . . . . . . . . . . 907 1,606 3,638 1,444 5,859 2,039 3,819 1,736Other ear conditions . . . . . . . . . . . . . . . . . . . . – 55 153 161 55 – 55 314Acute urinary conditions . . . . . . . . . . . . . . . . . . – 904 312 – 1,216 – 1,216 –Disorders of menstruation . . . . . . . . . . . . . . . . . – 306 261 – 523 148 375 45Other disorders of female genital tract . . . . . . . . . – – 107 56 56 – 56 107Delivery and other conditions of pregnancy andpuerperium . . . . . . . . . . . . . . . . . . . . . . . . . 528 1,215 259 – 2,001 1,743 259 –Skin conditions . . . . . . . . . . . . . . . . . . . . . . . . 52 48 154 135 329 128 201 59Acute musculoskeletal conditions . . . . . . . . . . . . 52 161 – 265 479 – 479 –Headache, excluding migraine . . . . . . . . . . . . . . 154 331 589 682 1,486 1,069 418 269Fever, unspecified . . . . . . . . . . . . . . . . . . . . . . 561 153 658 846 2,075 705 1,370 143
All other acute conditions . . . . . . . . . . . . . . . . . 1,865 1,473 1,193 1,467 5,229 2,069 3,160 769
1MSA is metropolitan statistical area.
NOTES: The standard errors and relative standard errors (RSE’s) can be computed by using parameter set III of table II and the formula presented in rule 1 of appendix I. An estimate of 37.6million has a 10-percent RSE; of 9.3 million, a 20-percent RSE; and of 4.2 million, a 30-percent RSE.
67
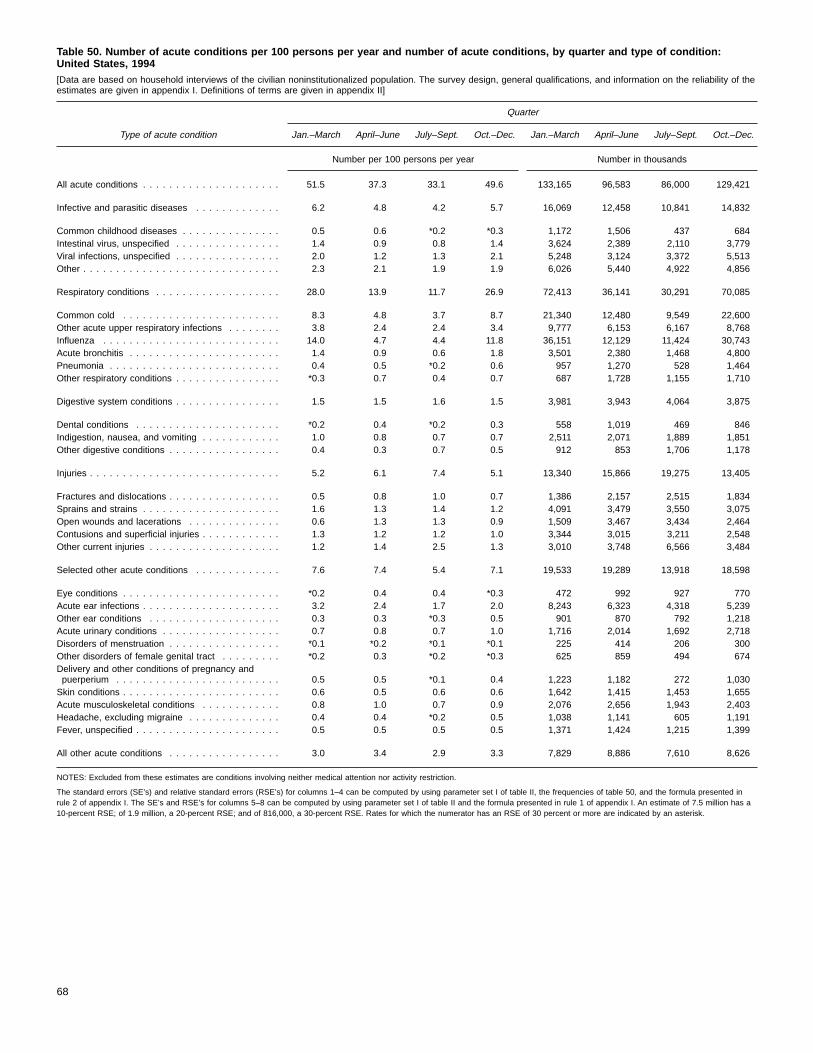
Table 50. Number of acute conditions per 100 persons per year and number of acute conditions, by quarter and type of condition:United States, 1994[Data are based on household interviews of the civilian noninstitutionalized population. The survey design, general qualifications, and information on the reliability of theestimates are given in appendix I. Definitions of terms are given in appendix II]
Type of acute condition
Quarter
Jan.–March April–June July–Sept. Oct.–Dec. Jan.–March April–June July–Sept. Oct.–Dec.
Number per 100 persons per year Number in thousands
All acute conditions . . . . . . . . . . . . . . . . . . . . . 51.5 37.3 33.1 49.6 133,165 96,583 86,000 129,421
Infective and parasitic diseases . . . . . . . . . . . . . 6.2 4.8 4.2 5.7 16,069 12,458 10,841 14,832
Common childhood diseases . . . . . . . . . . . . . . . 0.5 0.6 *0.2 *0.3 1,172 1,506 437 684Intestinal virus, unspecified . . . . . . . . . . . . . . . . 1.4 0.9 0.8 1.4 3,624 2,389 2,110 3,779Viral infections, unspecified . . . . . . . . . . . . . . . . 2.0 1.2 1.3 2.1 5,248 3,124 3,372 5,513Other . . . . . . . . . . . . . . . . . . . . . . . . . . . . . . 2.3 2.1 1.9 1.9 6,026 5,440 4,922 4,856
Respiratory conditions . . . . . . . . . . . . . . . . . . . 28.0 13.9 11.7 26.9 72,413 36,141 30,291 70,085
Common cold . . . . . . . . . . . . . . . . . . . . . . . . 8.3 4.8 3.7 8.7 21,340 12,480 9,549 22,600Other acute upper respiratory infections . . . . . . . . 3.8 2.4 2.4 3.4 9,777 6,153 6,167 8,768Influenza . . . . . . . . . . . . . . . . . . . . . . . . . . . 14.0 4.7 4.4 11.8 36,151 12,129 11,424 30,743Acute bronchitis . . . . . . . . . . . . . . . . . . . . . . . 1.4 0.9 0.6 1.8 3,501 2,380 1,468 4,800Pneumonia . . . . . . . . . . . . . . . . . . . . . . . . . . 0.4 0.5 *0.2 0.6 957 1,270 528 1,464Other respiratory conditions . . . . . . . . . . . . . . . . *0.3 0.7 0.4 0.7 687 1,728 1,155 1,710
Digestive system conditions . . . . . . . . . . . . . . . . 1.5 1.5 1.6 1.5 3,981 3,943 4,064 3,875
Dental conditions . . . . . . . . . . . . . . . . . . . . . . *0.2 0.4 *0.2 0.3 558 1,019 469 846Indigestion, nausea, and vomiting . . . . . . . . . . . . 1.0 0.8 0.7 0.7 2,511 2,071 1,889 1,851Other digestive conditions . . . . . . . . . . . . . . . . . 0.4 0.3 0.7 0.5 912 853 1,706 1,178
Injuries . . . . . . . . . . . . . . . . . . . . . . . . . . . . . 5.2 6.1 7.4 5.1 13,340 15,866 19,275 13,405
Fractures and dislocations . . . . . . . . . . . . . . . . . 0.5 0.8 1.0 0.7 1,386 2,157 2,515 1,834Sprains and strains . . . . . . . . . . . . . . . . . . . . . 1.6 1.3 1.4 1.2 4,091 3,479 3,550 3,075Open wounds and lacerations . . . . . . . . . . . . . . 0.6 1.3 1.3 0.9 1,509 3,467 3,434 2,464Contusions and superficial injuries . . . . . . . . . . . . 1.3 1.2 1.2 1.0 3,344 3,015 3,211 2,548Other current injuries . . . . . . . . . . . . . . . . . . . . 1.2 1.4 2.5 1.3 3,010 3,748 6,566 3,484
Selected other acute conditions . . . . . . . . . . . . . 7.6 7.4 5.4 7.1 19,533 19,289 13,918 18,598
Eye conditions . . . . . . . . . . . . . . . . . . . . . . . . *0.2 0.4 0.4 *0.3 472 992 927 770Acute ear infections . . . . . . . . . . . . . . . . . . . . . 3.2 2.4 1.7 2.0 8,243 6,323 4,318 5,239Other ear conditions . . . . . . . . . . . . . . . . . . . . 0.3 0.3 *0.3 0.5 901 870 792 1,218Acute urinary conditions . . . . . . . . . . . . . . . . . . 0.7 0.8 0.7 1.0 1,716 2,014 1,692 2,718Disorders of menstruation . . . . . . . . . . . . . . . . . *0.1 *0.2 *0.1 *0.1 225 414 206 300Other disorders of female genital tract . . . . . . . . . *0.2 0.3 *0.2 *0.3 625 859 494 674Delivery and other conditions of pregnancy andpuerperium . . . . . . . . . . . . . . . . . . . . . . . . . 0.5 0.5 *0.1 0.4 1,223 1,182 272 1,030Skin conditions . . . . . . . . . . . . . . . . . . . . . . . . 0.6 0.5 0.6 0.6 1,642 1,415 1,453 1,655Acute musculoskeletal conditions . . . . . . . . . . . . 0.8 1.0 0.7 0.9 2,076 2,656 1,943 2,403Headache, excluding migraine . . . . . . . . . . . . . . 0.4 0.4 *0.2 0.5 1,038 1,141 605 1,191Fever, unspecified . . . . . . . . . . . . . . . . . . . . . . 0.5 0.5 0.5 0.5 1,371 1,424 1,215 1,399
All other acute conditions . . . . . . . . . . . . . . . . . 3.0 3.4 2.9 3.3 7,829 8,886 7,610 8,626
NOTES: Excluded from these estimates are conditions involving neither medical attention nor activity restriction.
The standard errors (SE’s) and relative standard errors (RSE’s) for columns 1–4 can be computed by using parameter set I of table II, the frequencies of table 50, and the formula presented inrule 2 of appendix I. The SE’s and RSE’s for columns 5–8 can be computed by using parameter set I of table II and the formula presented in rule 1 of appendix I. An estimate of 7.5 million has a10-percent RSE; of 1.9 million, a 20-percent RSE; and of 816,000, a 30-percent RSE. Rates for which the numerator has an RSE of 30 percent or more are indicated by an asterisk.
68
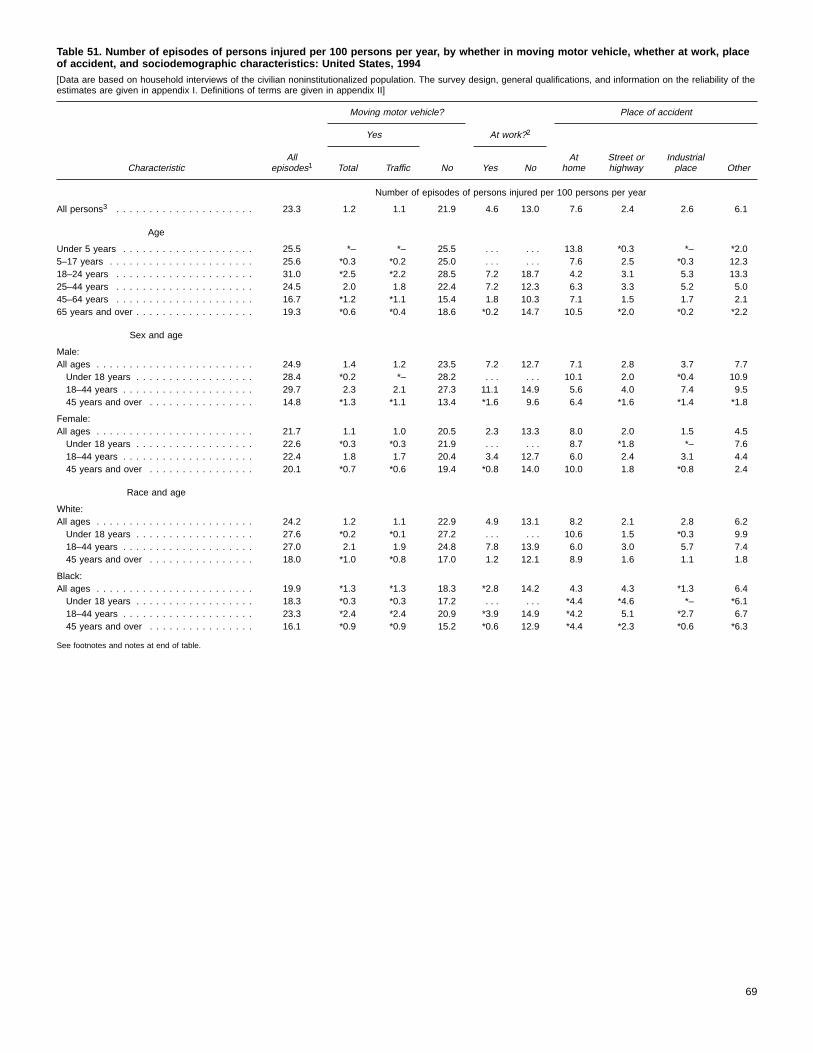
Table 51. Number of episodes of persons injured per 100 persons per year, by whether in moving motor vehicle, whether at work, placeof accident, and sociodemographic characteristics: United States, 1994[Data are based on household interviews of the civilian noninstitutionalized population. The survey design, general qualifications, and information on the reliability of theestimates are given in appendix I. Definitions of terms are given in appendix II]
CharacteristicAll
episodes1
Moving motor vehicle? Place of accident
Yes At work?2
Total Traffic No Yes NoAt
homeStreet orhighway
Industrialplace Other
Number of episodes of persons injured per 100 persons per year
All persons3 . . . . . . . . . . . . . . . . . . . . . 23.3 1.2 1.1 21.9 4.6 13.0 7.6 2.4 2.6 6.1
Age
Under 5 years . . . . . . . . . . . . . . . . . . . . 25.5 *– *– 25.5 . . . . . . 13.8 *0.3 *– *2.05–17 years . . . . . . . . . . . . . . . . . . . . . . 25.6 *0.3 *0.2 25.0 . . . . . . 7.6 2.5 *0.3 12.318–24 years . . . . . . . . . . . . . . . . . . . . . 31.0 *2.5 *2.2 28.5 7.2 18.7 4.2 3.1 5.3 13.325–44 years . . . . . . . . . . . . . . . . . . . . . 24.5 2.0 1.8 22.4 7.2 12.3 6.3 3.3 5.2 5.045–64 years . . . . . . . . . . . . . . . . . . . . . 16.7 *1.2 *1.1 15.4 1.8 10.3 7.1 1.5 1.7 2.165 years and over . . . . . . . . . . . . . . . . . . 19.3 *0.6 *0.4 18.6 *0.2 14.7 10.5 *2.0 *0.2 *2.2
Sex and age
Male:All ages . . . . . . . . . . . . . . . . . . . . . . . . 24.9 1.4 1.2 23.5 7.2 12.7 7.1 2.8 3.7 7.7Under 18 years . . . . . . . . . . . . . . . . . . 28.4 *0.2 *– 28.2 . . . . . . 10.1 2.0 *0.4 10.918–44 years . . . . . . . . . . . . . . . . . . . . 29.7 2.3 2.1 27.3 11.1 14.9 5.6 4.0 7.4 9.545 years and over . . . . . . . . . . . . . . . . 14.8 *1.3 *1.1 13.4 *1.6 9.6 6.4 *1.6 *1.4 *1.8
Female:All ages . . . . . . . . . . . . . . . . . . . . . . . . 21.7 1.1 1.0 20.5 2.3 13.3 8.0 2.0 1.5 4.5Under 18 years . . . . . . . . . . . . . . . . . . 22.6 *0.3 *0.3 21.9 . . . . . . 8.7 *1.8 *– 7.618–44 years . . . . . . . . . . . . . . . . . . . . 22.4 1.8 1.7 20.4 3.4 12.7 6.0 2.4 3.1 4.445 years and over . . . . . . . . . . . . . . . . 20.1 *0.7 *0.6 19.4 *0.8 14.0 10.0 1.8 *0.8 2.4
Race and age
White:All ages . . . . . . . . . . . . . . . . . . . . . . . . 24.2 1.2 1.1 22.9 4.9 13.1 8.2 2.1 2.8 6.2Under 18 years . . . . . . . . . . . . . . . . . . 27.6 *0.2 *0.1 27.2 . . . . . . 10.6 1.5 *0.3 9.918–44 years . . . . . . . . . . . . . . . . . . . . 27.0 2.1 1.9 24.8 7.8 13.9 6.0 3.0 5.7 7.445 years and over . . . . . . . . . . . . . . . . 18.0 *1.0 *0.8 17.0 1.2 12.1 8.9 1.6 1.1 1.8
Black:All ages . . . . . . . . . . . . . . . . . . . . . . . . 19.9 *1.3 *1.3 18.3 *2.8 14.2 4.3 4.3 *1.3 6.4Under 18 years . . . . . . . . . . . . . . . . . . 18.3 *0.3 *0.3 17.2 . . . . . . *4.4 *4.6 *– *6.118–44 years . . . . . . . . . . . . . . . . . . . . 23.3 *2.4 *2.4 20.9 *3.9 14.9 *4.2 5.1 *2.7 6.745 years and over . . . . . . . . . . . . . . . . 16.1 *0.9 *0.9 15.2 *0.6 12.9 *4.4 *2.3 *0.6 *6.3
See footnotes and notes at end of table.
69
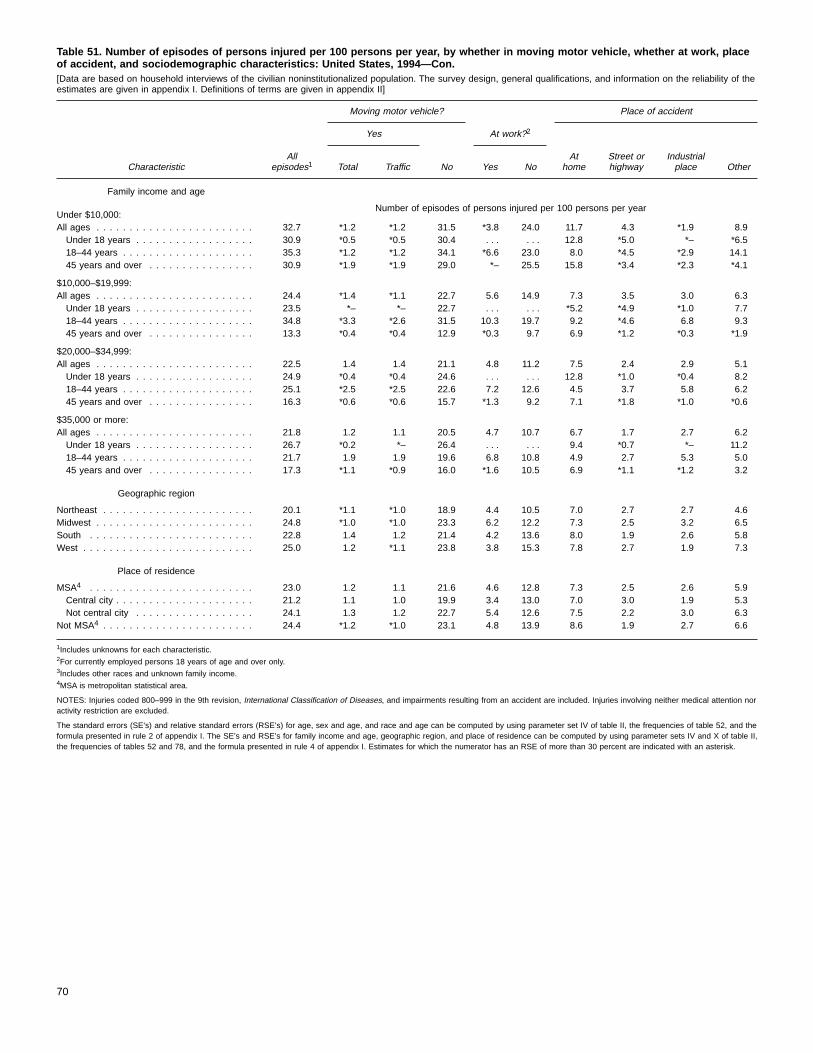
Table 51. Number of episodes of persons injured per 100 persons per year, by whether in moving motor vehicle, whether at work, placeof accident, and sociodemographic characteristics: United States, 1994—Con.[Data are based on household interviews of the civilian noninstitutionalized population. The survey design, general qualifications, and information on the reliability of theestimates are given in appendix I. Definitions of terms are given in appendix II]
CharacteristicAll
episodes1
Moving motor vehicle? Place of accident
Yes At work?2
Total Traffic No Yes NoAt
homeStreet orhighway
Industrialplace Other
Family income and age
Under $10,000:Number of episodes of persons injured per 100 persons per year
All ages . . . . . . . . . . . . . . . . . . . . . . . . 32.7 *1.2 *1.2 31.5 *3.8 24.0 11.7 4.3 *1.9 8.9Under 18 years . . . . . . . . . . . . . . . . . . 30.9 *0.5 *0.5 30.4 . . . . . . 12.8 *5.0 *– *6.518–44 years . . . . . . . . . . . . . . . . . . . . 35.3 *1.2 *1.2 34.1 *6.6 23.0 8.0 *4.5 *2.9 14.145 years and over . . . . . . . . . . . . . . . . 30.9 *1.9 *1.9 29.0 *– 25.5 15.8 *3.4 *2.3 *4.1
$10,000–$19,999:All ages . . . . . . . . . . . . . . . . . . . . . . . . 24.4 *1.4 *1.1 22.7 5.6 14.9 7.3 3.5 3.0 6.3Under 18 years . . . . . . . . . . . . . . . . . . 23.5 *– *– 22.7 . . . . . . *5.2 *4.9 *1.0 7.718–44 years . . . . . . . . . . . . . . . . . . . . 34.8 *3.3 *2.6 31.5 10.3 19.7 9.2 *4.6 6.8 9.345 years and over . . . . . . . . . . . . . . . . 13.3 *0.4 *0.4 12.9 *0.3 9.7 6.9 *1.2 *0.3 *1.9
$20,000–$34,999:All ages . . . . . . . . . . . . . . . . . . . . . . . . 22.5 1.4 1.4 21.1 4.8 11.2 7.5 2.4 2.9 5.1Under 18 years . . . . . . . . . . . . . . . . . . 24.9 *0.4 *0.4 24.6 . . . . . . 12.8 *1.0 *0.4 8.218–44 years . . . . . . . . . . . . . . . . . . . . 25.1 *2.5 *2.5 22.6 7.2 12.6 4.5 3.7 5.8 6.245 years and over . . . . . . . . . . . . . . . . 16.3 *0.6 *0.6 15.7 *1.3 9.2 7.1 *1.8 *1.0 *0.6
$35,000 or more:All ages . . . . . . . . . . . . . . . . . . . . . . . . 21.8 1.2 1.1 20.5 4.7 10.7 6.7 1.7 2.7 6.2Under 18 years . . . . . . . . . . . . . . . . . . 26.7 *0.2 *– 26.4 . . . . . . 9.4 *0.7 *– 11.218–44 years . . . . . . . . . . . . . . . . . . . . 21.7 1.9 1.9 19.6 6.8 10.8 4.9 2.7 5.3 5.045 years and over . . . . . . . . . . . . . . . . 17.3 *1.1 *0.9 16.0 *1.6 10.5 6.9 *1.1 *1.2 3.2
Geographic region
Northeast . . . . . . . . . . . . . . . . . . . . . . . 20.1 *1.1 *1.0 18.9 4.4 10.5 7.0 2.7 2.7 4.6Midwest . . . . . . . . . . . . . . . . . . . . . . . . 24.8 *1.0 *1.0 23.3 6.2 12.2 7.3 2.5 3.2 6.5South . . . . . . . . . . . . . . . . . . . . . . . . . 22.8 1.4 1.2 21.4 4.2 13.6 8.0 1.9 2.6 5.8West . . . . . . . . . . . . . . . . . . . . . . . . . . 25.0 1.2 *1.1 23.8 3.8 15.3 7.8 2.7 1.9 7.3
Place of residence
MSA4 . . . . . . . . . . . . . . . . . . . . . . . . . 23.0 1.2 1.1 21.6 4.6 12.8 7.3 2.5 2.6 5.9Central city . . . . . . . . . . . . . . . . . . . . . 21.2 1.1 1.0 19.9 3.4 13.0 7.0 3.0 1.9 5.3Not central city . . . . . . . . . . . . . . . . . . 24.1 1.3 1.2 22.7 5.4 12.6 7.5 2.2 3.0 6.3
Not MSA4 . . . . . . . . . . . . . . . . . . . . . . . 24.4 *1.2 *1.0 23.1 4.8 13.9 8.6 1.9 2.7 6.6
1Includes unknowns for each characteristic.2For currently employed persons 18 years of age and over only.3Includes other races and unknown family income.4MSA is metropolitan statistical area.
NOTES: Injuries coded 800–999 in the 9th revision, International Classification of Diseases, and impairments resulting from an accident are included. Injuries involving neither medical attention noractivity restriction are excluded.
The standard errors (SE’s) and relative standard errors (RSE’s) for age, sex and age, and race and age can be computed by using parameter set IV of table II, the frequencies of table 52, and theformula presented in rule 2 of appendix I. The SE’s and RSE’s for family income and age, geographic region, and place of residence can be computed by using parameter sets IV and X of table II,the frequencies of tables 52 and 78, and the formula presented in rule 4 of appendix I. Estimates for which the numerator has an RSE of more than 30 percent are indicated with an asterisk.
70
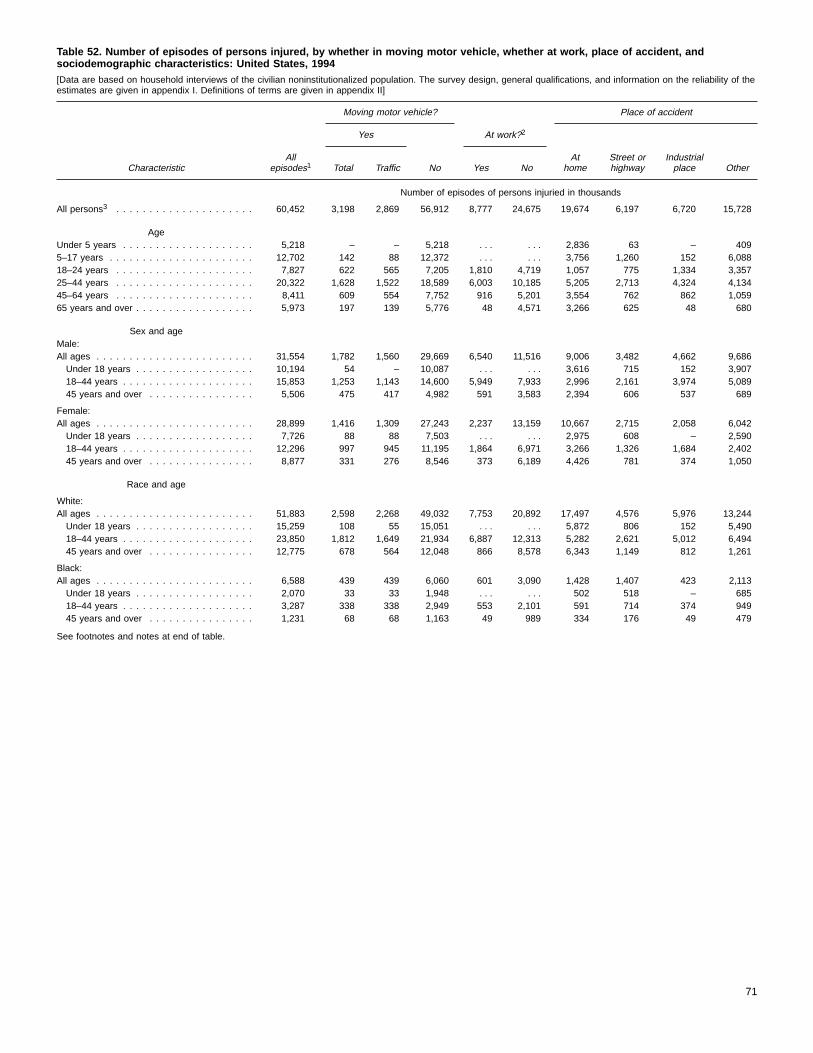
Table 52. Number of episodes of persons injured, by whether in moving motor vehicle, whether at work, place of accident, andsociodemographic characteristics: United States, 1994[Data are based on household interviews of the civilian noninstitutionalized population. The survey design, general qualifications, and information on the reliability of theestimates are given in appendix I. Definitions of terms are given in appendix II]
CharacteristicAll
episodes1
Moving motor vehicle? Place of accident
Yes At work?2
Total Traffic No Yes NoAt
homeStreet orhighway
Industrialplace Other
Number of episodes of persons injuried in thousands
All persons3 . . . . . . . . . . . . . . . . . . . . . 60,452 3,198 2,869 56,912 8,777 24,675 19,674 6,197 6,720 15,728
AgeUnder 5 years . . . . . . . . . . . . . . . . . . . . 5,218 – – 5,218 . . . . . . 2,836 63 – 4095–17 years . . . . . . . . . . . . . . . . . . . . . . 12,702 142 88 12,372 . . . . . . 3,756 1,260 152 6,08818–24 years . . . . . . . . . . . . . . . . . . . . . 7,827 622 565 7,205 1,810 4,719 1,057 775 1,334 3,35725–44 years . . . . . . . . . . . . . . . . . . . . . 20,322 1,628 1,522 18,589 6,003 10,185 5,205 2,713 4,324 4,13445–64 years . . . . . . . . . . . . . . . . . . . . . 8,411 609 554 7,752 916 5,201 3,554 762 862 1,05965 years and over . . . . . . . . . . . . . . . . . . 5,973 197 139 5,776 48 4,571 3,266 625 48 680
Sex and ageMale:All ages . . . . . . . . . . . . . . . . . . . . . . . . 31,554 1,782 1,560 29,669 6,540 11,516 9,006 3,482 4,662 9,686Under 18 years . . . . . . . . . . . . . . . . . . 10,194 54 – 10,087 . . . . . . 3,616 715 152 3,90718–44 years . . . . . . . . . . . . . . . . . . . . 15,853 1,253 1,143 14,600 5,949 7,933 2,996 2,161 3,974 5,08945 years and over . . . . . . . . . . . . . . . . 5,506 475 417 4,982 591 3,583 2,394 606 537 689
Female:All ages . . . . . . . . . . . . . . . . . . . . . . . . 28,899 1,416 1,309 27,243 2,237 13,159 10,667 2,715 2,058 6,042Under 18 years . . . . . . . . . . . . . . . . . . 7,726 88 88 7,503 . . . . . . 2,975 608 – 2,59018–44 years . . . . . . . . . . . . . . . . . . . . 12,296 997 945 11,195 1,864 6,971 3,266 1,326 1,684 2,40245 years and over . . . . . . . . . . . . . . . . 8,877 331 276 8,546 373 6,189 4,426 781 374 1,050
Race and age
White:All ages . . . . . . . . . . . . . . . . . . . . . . . . 51,883 2,598 2,268 49,032 7,753 20,892 17,497 4,576 5,976 13,244Under 18 years . . . . . . . . . . . . . . . . . . 15,259 108 55 15,051 . . . . . . 5,872 806 152 5,49018–44 years . . . . . . . . . . . . . . . . . . . . 23,850 1,812 1,649 21,934 6,887 12,313 5,282 2,621 5,012 6,49445 years and over . . . . . . . . . . . . . . . . 12,775 678 564 12,048 866 8,578 6,343 1,149 812 1,261
Black:All ages . . . . . . . . . . . . . . . . . . . . . . . . 6,588 439 439 6,060 601 3,090 1,428 1,407 423 2,113Under 18 years . . . . . . . . . . . . . . . . . . 2,070 33 33 1,948 . . . . . . 502 518 – 68518–44 years . . . . . . . . . . . . . . . . . . . . 3,287 338 338 2,949 553 2,101 591 714 374 94945 years and over . . . . . . . . . . . . . . . . 1,231 68 68 1,163 49 989 334 176 49 479
See footnotes and notes at end of table.
71

Table 52. Number of episodes of persons injured, by whether in moving motor vehicle, whether at work, place of accident, andsociodemographic characteristics: United States, 1994—Con.[Data are based on household interviews of the civilian noninstitutionalized population. The survey design, general qualifications, and information on the reliability of theestimates are given in appendix I. Definitions of terms are given in appendix II]
CharacteristicAll
episodes1
Moving motor vehicle? Place of accident
Yes At work?2
Total Traffic No Yes NoAt
homeStreet orhighway
Industrialplace Other
Family income and age
Under $10,000:Number of episodes of persons injured in thousands
All ages . . . . . . . . . . . . . . . . . . . . . . . . 7,639 281 281 7,358 621 3,926 2,742 1,013 435 2,070Under 18 years . . . . . . . . . . . . . . . . . . 2,170 33 33 2,137 . . . . . . 903 352 – 45718–44 years . . . . . . . . . . . . . . . . . . . . 3,343 115 115 3,228 621 2,174 755 429 278 1,33245 years and over . . . . . . . . . . . . . . . . 2,126 133 133 1,993 – 1,752 1,083 232 157 280
$10,000–$19,999:All ages . . . . . . . . . . . . . . . . . . . . . . . . 9,077 525 414 8,464 1,516 4,061 2,728 1,306 1,104 2,360Under 18 years . . . . . . . . . . . . . . . . . . 2,379 – – 2,290 . . . . . . 524 494 98 77318–44 years . . . . . . . . . . . . . . . . . . . . 4,992 477 367 4,515 1,481 2,820 1,314 660 972 1,33745 years and over . . . . . . . . . . . . . . . . 1,706 47 47 1,659 35 1,241 890 152 35 250
$20,000–$34,999:All ages . . . . . . . . . . . . . . . . . . . . . . . . 12,164 740 740 11,424 1,918 4,449 4,072 1,303 1,579 2,738Under 18 years . . . . . . . . . . . . . . . . . . 3,606 55 55 3,552 . . . . . . 1,857 140 54 1,18418–44 years . . . . . . . . . . . . . . . . . . . . 5,913 591 591 5,323 1,704 2,958 1,069 865 1,358 1,45945 years and over . . . . . . . . . . . . . . . . 2,645 94 94 2,550 214 1,491 1,146 298 166 95
$35,000 or more:All ages . . . . . . . . . . . . . . . . . . . . . . . . 21,903 1,185 1,076 20,518 3,406 7,724 6,767 1,691 2,664 6,255Under 18 years . . . . . . . . . . . . . . . . . . 7,500 54 – 7,400 . . . . . . 2,647 185 – 3,15318–44 years . . . . . . . . . . . . . . . . . . . . 9,472 814 814 8,553 2,956 4,712 2,154 1,196 2,325 2,18745 years and over . . . . . . . . . . . . . . . . 4,931 317 262 4,564 450 3,012 1,967 310 339 914
Geographic regionNortheast . . . . . . . . . . . . . . . . . . . . . . . 10,196 572 519 9,577 1,650 3,963 3,535 1,375 1,362 2,311Midwest . . . . . . . . . . . . . . . . . . . . . . . . 15,695 662 662 14,737 2,845 5,612 4,594 1,558 2,009 4,082South . . . . . . . . . . . . . . . . . . . . . . . . . 20,113 1,252 1,032 18,861 2,705 8,804 7,045 1,687 2,282 5,128West . . . . . . . . . . . . . . . . . . . . . . . . . . 14,448 712 655 13,736 1,575 6,296 4,499 1,578 1,068 4,206
Place of residence
MSA4 . . . . . . . . . . . . . . . . . . . . . . . . . 46,642 2,506 2,290 43,841 6,770 18,885 14,834 5,149 5,214 11,980Central city . . . . . . . . . . . . . . . . . . . . . 16,829 881 829 15,806 1,972 7,584 5,572 2,371 1,512 4,189Not central city . . . . . . . . . . . . . . . . . . 29,813 1,625 1,461 28,035 4,798 11,300 9,263 2,778 3,702 7,791
Not MSA4 . . . . . . . . . . . . . . . . . . . . . . . 13,810 692 579 13,071 2,007 5,791 4,840 1,048 1,506 3,748
1Includes unknowns for each characteristic.2For currently employed persons 18 years of age and over only.3Includes other races and unknown family income.4MSA is metropolitan statistical area.
NOTES: Injuries coded 800–999 in the 9th Revision, International Classification of Diseases, and impairments resulting from an accident are included. Injuries involving neither medical attentionnor activity restriction are excluded.
The standard errors and relative standard errors (RSE’s) can be computed by using parameter set IV of table II and the formula presented in rule 1 of appendix I. An estimate of 6.6 million has a10-percent RSE; of 1.6 million, a 20-percent RSE; and of 693,000, a 30-percent RSE.
72
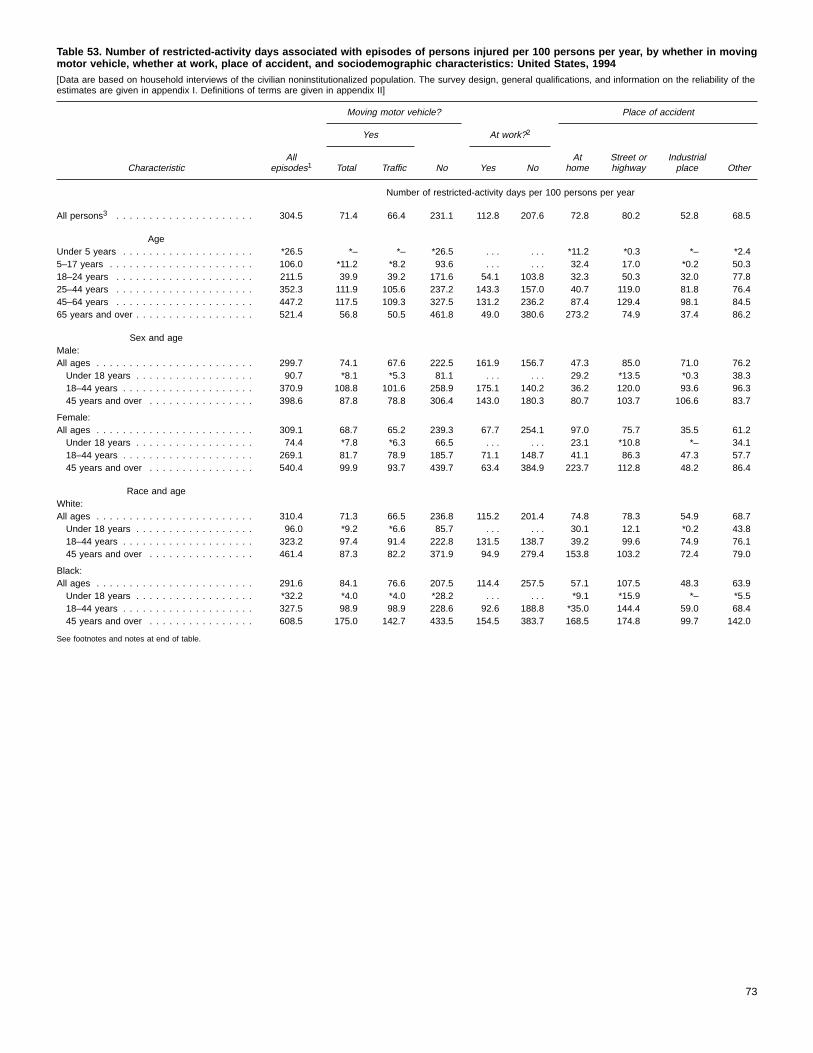
Table 53. Number of restricted-activity days associated with episodes of persons injured per 100 persons per year, by whether in movingmotor vehicle, whether at work, place of accident, and sociodemographic characteristics: United States, 1994[Data are based on household interviews of the civilian noninstitutionalized population. The survey design, general qualifications, and information on the reliability of theestimates are given in appendix I. Definitions of terms are given in appendix II]
CharacteristicAll
episodes1
Moving motor vehicle? Place of accident
Yes At work?2
Total Traffic No Yes NoAt
homeStreet orhighway
Industrialplace Other
Number of restricted-activity days per 100 persons per year
All persons3 . . . . . . . . . . . . . . . . . . . . . 304.5 71.4 66.4 231.1 112.8 207.6 72.8 80.2 52.8 68.5
AgeUnder 5 years . . . . . . . . . . . . . . . . . . . . *26.5 *– *– *26.5 . . . . . . *11.2 *0.3 *– *2.45–17 years . . . . . . . . . . . . . . . . . . . . . . 106.0 *11.2 *8.2 93.6 . . . . . . 32.4 17.0 *0.2 50.318–24 years . . . . . . . . . . . . . . . . . . . . . 211.5 39.9 39.2 171.6 54.1 103.8 32.3 50.3 32.0 77.825–44 years . . . . . . . . . . . . . . . . . . . . . 352.3 111.9 105.6 237.2 143.3 157.0 40.7 119.0 81.8 76.445–64 years . . . . . . . . . . . . . . . . . . . . . 447.2 117.5 109.3 327.5 131.2 236.2 87.4 129.4 98.1 84.565 years and over . . . . . . . . . . . . . . . . . . 521.4 56.8 50.5 461.8 49.0 380.6 273.2 74.9 37.4 86.2
Sex and ageMale:All ages . . . . . . . . . . . . . . . . . . . . . . . . 299.7 74.1 67.6 222.5 161.9 156.7 47.3 85.0 71.0 76.2Under 18 years . . . . . . . . . . . . . . . . . . 90.7 *8.1 *5.3 81.1 . . . . . . 29.2 *13.5 *0.3 38.318–44 years . . . . . . . . . . . . . . . . . . . . 370.9 108.8 101.6 258.9 175.1 140.2 36.2 120.0 93.6 96.345 years and over . . . . . . . . . . . . . . . . 398.6 87.8 78.8 306.4 143.0 180.3 80.7 103.7 106.6 83.7
Female:All ages . . . . . . . . . . . . . . . . . . . . . . . . 309.1 68.7 65.2 239.3 67.7 254.1 97.0 75.7 35.5 61.2Under 18 years . . . . . . . . . . . . . . . . . . 74.4 *7.8 *6.3 66.5 . . . . . . 23.1 *10.8 *– 34.118–44 years . . . . . . . . . . . . . . . . . . . . 269.1 81.7 78.9 185.7 71.1 148.7 41.1 86.3 47.3 57.745 years and over . . . . . . . . . . . . . . . . 540.4 99.9 93.7 439.7 63.4 384.9 223.7 112.8 48.2 86.4
Race and ageWhite:All ages . . . . . . . . . . . . . . . . . . . . . . . . 310.4 71.3 66.5 236.8 115.2 201.4 74.8 78.3 54.9 68.7Under 18 years . . . . . . . . . . . . . . . . . . 96.0 *9.2 *6.6 85.7 . . . . . . 30.1 12.1 *0.2 43.818–44 years . . . . . . . . . . . . . . . . . . . . 323.2 97.4 91.4 222.8 131.5 138.7 39.2 99.6 74.9 76.145 years and over . . . . . . . . . . . . . . . . 461.4 87.3 82.2 371.9 94.9 279.4 153.8 103.2 72.4 79.0
Black:All ages . . . . . . . . . . . . . . . . . . . . . . . . 291.6 84.1 76.6 207.5 114.4 257.5 57.1 107.5 48.3 63.9Under 18 years . . . . . . . . . . . . . . . . . . *32.2 *4.0 *4.0 *28.2 . . . . . . *9.1 *15.9 *– *5.518–44 years . . . . . . . . . . . . . . . . . . . . 327.5 98.9 98.9 228.6 92.6 188.8 *35.0 144.4 59.0 68.445 years and over . . . . . . . . . . . . . . . . 608.5 175.0 142.7 433.5 154.5 383.7 168.5 174.8 99.7 142.0
See footnotes and notes at end of table.
73

Table 53. Number of restricted-activity days associated with episodes of persons injured per 100 persons per year, by whether in movingmotor vehicle, whether at work, place of accident, and sociodemographic characteristics: United States, 1994—Con.[Data are based on household interviews of the civilian noninstitutionalized population. The survey design, general qualifications, and information on the reliability of theestimates are given in appendix I. Definitions of terms are given in appendix II]
CharacteristicAll
episodes1
Moving motor vehicle? Place of accident
Yes At work?2
Total Traffic No Yes NoAt
homeStreet orhighway
Industrialplace Other
Family income and age
Under $10,000:Number of restricted-activity days per 100 persons per year
All ages . . . . . . . . . . . . . . . . . . . . . . . . 549.0 97.8 91.9 449.6 179.9 432.1 148.6 135.1 75.1 145.6Under 18 years . . . . . . . . . . . . . . . . . . 90.1 *15.0 *8.1 *75.1 . . . . . . *31.7 *21.1 *– *28.418–44 years . . . . . . . . . . . . . . . . . . . . 517.3 103.9 103.3 413.4 139.6 264.3 70.9 160.1 *60.8 179.445 years and over . . . . . . . . . . . . . . . . 1061.9 174.2 162.1 882.3 235.3 662.8 375.1 217.4 171.6 218.8
$10,000–$19,999:All ages . . . . . . . . . . . . . . . . . . . . . . . . 474.0 114.4 104.6 359.7 162.5 328.2 119.1 127.7 83.7 96.7Under 18 years . . . . . . . . . . . . . . . . . . 119.7 *15.2 *15.2 104.5 . . . . . . *22.9 *41.8 *1.0 *45.618–44 years . . . . . . . . . . . . . . . . . . . . 501.0 107.9 93.3 393.2 184.4 215.8 94.2 108.0 123.8 119.145 years and over . . . . . . . . . . . . . . . . 723.1 199.8 187.9 523.3 137.9 454.0 222.6 217.5 104.1 111.9
$20,000–$34,999:All ages . . . . . . . . . . . . . . . . . . . . . . . . 340.0 100.8 97.7 237.2 175.3 183.0 62.0 107.6 62.8 75.1Under 18 years . . . . . . . . . . . . . . . . . . 94.8 *9.0 *9.0 85.9 . . . . . . *29.8 *10.1 *– 46.418–44 years . . . . . . . . . . . . . . . . . . . . 447.8 186.0 184.7 257.0 235.1 151.3 *22.5 201.9 102.3 83.545 years and over . . . . . . . . . . . . . . . . 402.3 59.0 50.8 343.4 88.4 229.0 148.0 57.6 61.5 88.4
$35,000 or more:All ages . . . . . . . . . . . . . . . . . . . . . . . . 180.4 36.5 34.0 143.0 65.5 120.2 42.0 40.5 30.3 47.4Under 18 years . . . . . . . . . . . . . . . . . . 76.3 *4.9 *1.4 71.3 . . . . . . 28.9 *1.8 *– 37.118–44 years . . . . . . . . . . . . . . . . . . . . 173.5 47.9 44.8 125.4 58.4 94.1 26.5 50.1 39.5 44.745 years and over . . . . . . . . . . . . . . . . 293.3 50.1 49.7 240.2 76.2 160.2 78.5 63.8 46.2 61.7
Geographic region
Northeast . . . . . . . . . . . . . . . . . . . . . . . 267.9 42.2 40.2 225.6 88.8 182.5 75.8 55.8 49.8 59.4Midwest . . . . . . . . . . . . . . . . . . . . . . . . 237.8 47.1 43.3 189.8 84.0 145.9 56.1 55.4 40.4 57.6South . . . . . . . . . . . . . . . . . . . . . . . . . 342.8 100.4 94.6 241.2 152.9 224.6 83.7 105.8 65.6 63.7West . . . . . . . . . . . . . . . . . . . . . . . . . . 351.3 79.1 71.5 265.9 103.7 272.8 71.9 89.9 49.4 95.6
Place of residence
MSA4 . . . . . . . . . . . . . . . . . . . . . . . . . 293.7 59.0 53.4 232.8 106.6 202.8 70.5 67.7 56.8 70.3Central city . . . . . . . . . . . . . . . . . . . . . 292.5 60.3 57.8 229.8 102.3 216.8 67.4 77.8 47.1 76.0Not central city . . . . . . . . . . . . . . . . . . 294.5 58.2 50.6 234.8 109.4 193.8 72.5 61.2 63.0 66.6
Not MSA4 . . . . . . . . . . . . . . . . . . . . . . . 343.4 115.6 112.8 225.1 134.4 224.3 81.1 125.3 38.6 61.9
1Includes unknowns for each characteristic.2For currently employed persons 18 years of age and over only.3Includes other races and unknown family income.4MSA is metropolitan statistical area.
NOTES: The standard errors (SE’s) and relative standard errors (RSE’s) for age, sex and age, and race and age can be computed by using parameter set II of table II, the frequencies of table 54,and the formula presented in rule 2 of appendix I. The SE’s and RSE’s for family income and age, geographic region, and place of residence can be computed by using parameter Sets II and X oftable II, the frequencies of tables 54 and 78, and the formula presented in rule 4 of appendix I. Estimates for which the numerator has an RSE of more than 30 percent are indicated with anasterisk.
74
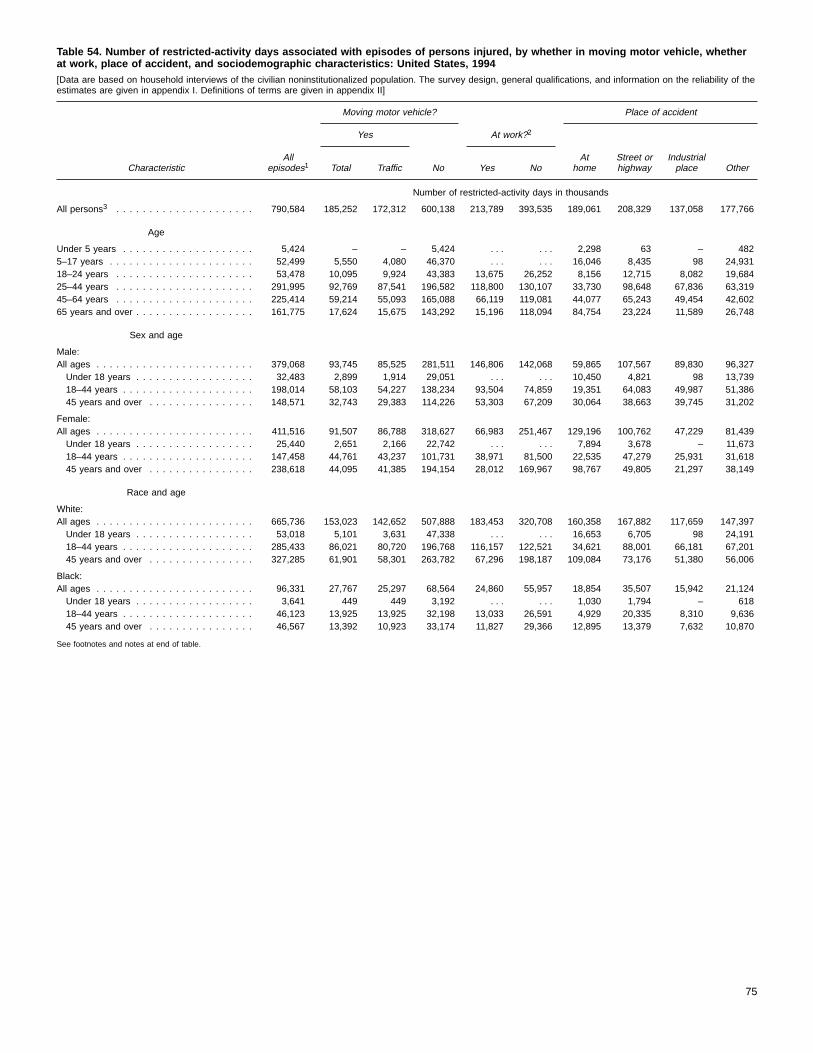
Table 54. Number of restricted-activity days associated with episodes of persons injured, by whether in moving motor vehicle, whetherat work, place of accident, and sociodemographic characteristics: United States, 1994[Data are based on household interviews of the civilian noninstitutionalized population. The survey design, general qualifications, and information on the reliability of theestimates are given in appendix I. Definitions of terms are given in appendix II]
CharacteristicAll
episodes1
Moving motor vehicle? Place of accident
Yes At work?2
Total Traffic No Yes NoAt
homeStreet orhighway
Industrialplace Other
Number of restricted-activity days in thousands
All persons3 . . . . . . . . . . . . . . . . . . . . . 790,584 185,252 172,312 600,138 213,789 393,535 189,061 208,329 137,058 177,766
Age
Under 5 years . . . . . . . . . . . . . . . . . . . . 5,424 – – 5,424 . . . . . . 2,298 63 – 4825–17 years . . . . . . . . . . . . . . . . . . . . . . 52,499 5,550 4,080 46,370 . . . . . . 16,046 8,435 98 24,93118–24 years . . . . . . . . . . . . . . . . . . . . . 53,478 10,095 9,924 43,383 13,675 26,252 8,156 12,715 8,082 19,68425–44 years . . . . . . . . . . . . . . . . . . . . . 291,995 92,769 87,541 196,582 118,800 130,107 33,730 98,648 67,836 63,31945–64 years . . . . . . . . . . . . . . . . . . . . . 225,414 59,214 55,093 165,088 66,119 119,081 44,077 65,243 49,454 42,60265 years and over . . . . . . . . . . . . . . . . . . 161,775 17,624 15,675 143,292 15,196 118,094 84,754 23,224 11,589 26,748
Sex and age
Male:All ages . . . . . . . . . . . . . . . . . . . . . . . . 379,068 93,745 85,525 281,511 146,806 142,068 59,865 107,567 89,830 96,327Under 18 years . . . . . . . . . . . . . . . . . . 32,483 2,899 1,914 29,051 . . . . . . 10,450 4,821 98 13,73918–44 years . . . . . . . . . . . . . . . . . . . . 198,014 58,103 54,227 138,234 93,504 74,859 19,351 64,083 49,987 51,38645 years and over . . . . . . . . . . . . . . . . 148,571 32,743 29,383 114,226 53,303 67,209 30,064 38,663 39,745 31,202
Female:All ages . . . . . . . . . . . . . . . . . . . . . . . . 411,516 91,507 86,788 318,627 66,983 251,467 129,196 100,762 47,229 81,439Under 18 years . . . . . . . . . . . . . . . . . . 25,440 2,651 2,166 22,742 . . . . . . 7,894 3,678 – 11,67318–44 years . . . . . . . . . . . . . . . . . . . . 147,458 44,761 43,237 101,731 38,971 81,500 22,535 47,279 25,931 31,61845 years and over . . . . . . . . . . . . . . . . 238,618 44,095 41,385 194,154 28,012 169,967 98,767 49,805 21,297 38,149
Race and age
White:All ages . . . . . . . . . . . . . . . . . . . . . . . . 665,736 153,023 142,652 507,888 183,453 320,708 160,358 167,882 117,659 147,397Under 18 years . . . . . . . . . . . . . . . . . . 53,018 5,101 3,631 47,338 . . . . . . 16,653 6,705 98 24,19118–44 years . . . . . . . . . . . . . . . . . . . . 285,433 86,021 80,720 196,768 116,157 122,521 34,621 88,001 66,181 67,20145 years and over . . . . . . . . . . . . . . . . 327,285 61,901 58,301 263,782 67,296 198,187 109,084 73,176 51,380 56,006
Black:All ages . . . . . . . . . . . . . . . . . . . . . . . . 96,331 27,767 25,297 68,564 24,860 55,957 18,854 35,507 15,942 21,124Under 18 years . . . . . . . . . . . . . . . . . . 3,641 449 449 3,192 . . . . . . 1,030 1,794 – 61818–44 years . . . . . . . . . . . . . . . . . . . . 46,123 13,925 13,925 32,198 13,033 26,591 4,929 20,335 8,310 9,63645 years and over . . . . . . . . . . . . . . . . 46,567 13,392 10,923 33,174 11,827 29,366 12,895 13,379 7,632 10,870
See footnotes and notes at end of table.
75

Table 54. Number of restricted-activity days associated with episodes of persons injured, by whether in moving motor vehicle, whetherat work, place of accident, and sociodemographic characteristics: United States, 1994—Con.[Data are based on household interviews of the civilian noninstitutionalized population. The survey design, general qualifications, and information on the reliability of theestimates are given in appendix I. Definitions of terms are given in appendix II]
CharacteristicAll
episodes1
Moving motor vehicle? Place of accident
Yes At work?2
Total Traffic No Yes NoAt
homeStreet orhighway
Industrialplace Other
Family income and age
Under $10,000:Number of restricted-activity days in thousands
All ages . . . . . . . . . . . . . . . . . . . . . . . . 128,269 22,860 21,482 105,040 29,382 70,569 34,726 31,573 17,545 34,011Under 18 years . . . . . . . . . . . . . . . . . . 6,337 1,054 568 5,283 . . . . . . 2,232 1,486 – 1,99818–44 years . . . . . . . . . . . . . . . . . . . . 48,927 9,831 9,770 39,096 13,207 24,999 6,707 15,141 5,749 16,97145 years and over . . . . . . . . . . . . . . . . 73,005 11,975 11,143 60,661 16,175 45,570 25,787 14,946 11,797 15,042
$10,000–$19,999:All ages . . . . . . . . . . . . . . . . . . . . . . . . 176,683 42,629 38,998 134,054 44,139 89,163 44,376 47,606 31,198 36,038Under 18 years . . . . . . . . . . . . . . . . . . 12,089 1,534 1,534 10,555 . . . . . . 2,311 4,219 98 4,60518–44 years . . . . . . . . . . . . . . . . . . . . 71,883 15,475 13,379 56,408 26,463 30,961 13,521 15,497 17,759 17,08545 years and over . . . . . . . . . . . . . . . . 92,712 25,620 24,085 67,092 17,675 58,201 28,544 27,890 13,342 14,347
$20,000–$34,999:All ages . . . . . . . . . . . . . . . . . . . . . . . . 184,189 54,582 52,947 128,470 69,605 72,669 33,580 58,276 34,026 40,662Under 18 years . . . . . . . . . . . . . . . . . . 13,707 1,294 1,294 12,413 . . . . . . 4,310 1,461 – 6,70118–44 years . . . . . . . . . . . . . . . . . . . . 105,297 43,735 43,420 60,425 55,277 35,567 5,292 47,486 24,062 19,63145 years and over . . . . . . . . . . . . . . . . 65,185 9,553 8,233 55,631 14,328 37,102 23,978 9,329 9,964 14,329
$35,000 or more:All ages . . . . . . . . . . . . . . . . . . . . . . . . 180,958 36,611 34,133 143,390 47,294 86,863 42,089 40,624 30,435 47,590Under 18 years . . . . . . . . . . . . . . . . . . 21,401 1,371 386 19,984 . . . . . . 8,094 504 – 10,41918–44 years . . . . . . . . . . . . . . . . . . . . 75,817 20,950 19,567 54,814 25,545 41,117 11,594 21,911 17,242 19,54245 years and over . . . . . . . . . . . . . . . . 83,740 14,290 14,179 68,592 21,750 45,746 22,400 18,209 13,194 17,628
Geographic region
Northeast . . . . . . . . . . . . . . . . . . . . . . . 135,565 21,358 20,370 114,161 33,428 68,653 38,355 28,224 25,212 30,061Midwest . . . . . . . . . . . . . . . . . . . . . . . . 150,411 29,776 27,399 120,050 38,796 67,368 35,494 35,031 25,537 36,445South . . . . . . . . . . . . . . . . . . . . . . . . . 301,925 88,466 83,316 212,493 98,858 145,159 73,712 93,228 57,780 56,112West . . . . . . . . . . . . . . . . . . . . . . . . . . 202,683 45,652 41,228 153,434 42,707 112,355 41,499 51,846 28,529 55,149
Place of residence
MSA4 . . . . . . . . . . . . . . . . . . . . . . . . . 596,398 119,871 108,509 472,834 157,689 299,915 143,172 137,444 115,254 142,756Central city . . . . . . . . . . . . . . . . . . . . . 232,534 47,979 45,922 182,740 59,640 126,311 53,609 61,829 37,427 60,410Not central city . . . . . . . . . . . . . . . . . . 363,864 71,892 62,586 290,094 98,048 173,603 89,563 75,616 77,826 82,346
Not MSA4 . . . . . . . . . . . . . . . . . . . . . . . 194,186 65,381 63,803 127,304 56,100 93,620 45,889 70,884 21,805 35,010
1Includes unknowns for each characteristic.2For currently employed persons 18 years of age and over only.3Includes other races and unknown family income.4MSA is metropolitan statistical area.
NOTES: The standard errors and relative standard errors (RSE’s) can be computed by using parameter set II of table II and the formula presented in rule 1 of appendix I. An estimate of 55.4million has a 10-percent RSE; of 13.4 million, a 20-percent RSE; and of 6.0 million, a 30-percent RSE.
76
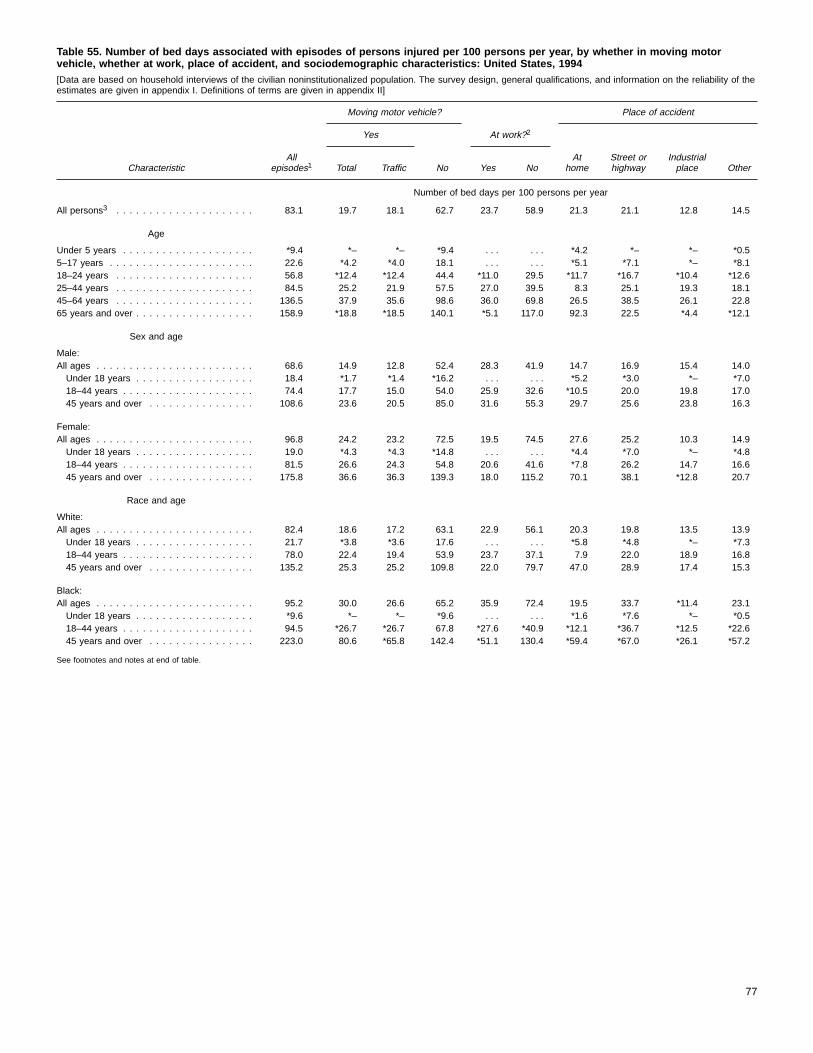
Table 55. Number of bed days associated with episodes of persons injured per 100 persons per year, by whether in moving motorvehicle, whether at work, place of accident, and sociodemographic characteristics: United States, 1994[Data are based on household interviews of the civilian noninstitutionalized population. The survey design, general qualifications, and information on the reliability of theestimates are given in appendix I. Definitions of terms are given in appendix II]
CharacteristicAll
episodes1
Moving motor vehicle? Place of accident
Yes At work?2
Total Traffic No Yes NoAt
homeStreet orhighway
Industrialplace Other
Number of bed days per 100 persons per year
All persons3 . . . . . . . . . . . . . . . . . . . . . 83.1 19.7 18.1 62.7 23.7 58.9 21.3 21.1 12.8 14.5
Age
Under 5 years . . . . . . . . . . . . . . . . . . . . *9.4 *– *– *9.4 . . . . . . *4.2 *– *– *0.55–17 years . . . . . . . . . . . . . . . . . . . . . . 22.6 *4.2 *4.0 18.1 . . . . . . *5.1 *7.1 *– *8.118–24 years . . . . . . . . . . . . . . . . . . . . . 56.8 *12.4 *12.4 44.4 *11.0 29.5 *11.7 *16.7 *10.4 *12.625–44 years . . . . . . . . . . . . . . . . . . . . . 84.5 25.2 21.9 57.5 27.0 39.5 8.3 25.1 19.3 18.145–64 years . . . . . . . . . . . . . . . . . . . . . 136.5 37.9 35.6 98.6 36.0 69.8 26.5 38.5 26.1 22.865 years and over . . . . . . . . . . . . . . . . . . 158.9 *18.8 *18.5 140.1 *5.1 117.0 92.3 22.5 *4.4 *12.1
Sex and age
Male:All ages . . . . . . . . . . . . . . . . . . . . . . . . 68.6 14.9 12.8 52.4 28.3 41.9 14.7 16.9 15.4 14.0Under 18 years . . . . . . . . . . . . . . . . . . 18.4 *1.7 *1.4 *16.2 . . . . . . *5.2 *3.0 *– *7.018–44 years . . . . . . . . . . . . . . . . . . . . 74.4 17.7 15.0 54.0 25.9 32.6 *10.5 20.0 19.8 17.045 years and over . . . . . . . . . . . . . . . . 108.6 23.6 20.5 85.0 31.6 55.3 29.7 25.6 23.8 16.3
Female:All ages . . . . . . . . . . . . . . . . . . . . . . . . 96.8 24.2 23.2 72.5 19.5 74.5 27.6 25.2 10.3 14.9Under 18 years . . . . . . . . . . . . . . . . . . 19.0 *4.3 *4.3 *14.8 . . . . . . *4.4 *7.0 *– *4.818–44 years . . . . . . . . . . . . . . . . . . . . 81.5 26.6 24.3 54.8 20.6 41.6 *7.8 26.2 14.7 16.645 years and over . . . . . . . . . . . . . . . . 175.8 36.6 36.3 139.3 18.0 115.2 70.1 38.1 *12.8 20.7
Race and age
White:All ages . . . . . . . . . . . . . . . . . . . . . . . . 82.4 18.6 17.2 63.1 22.9 56.1 20.3 19.8 13.5 13.9Under 18 years . . . . . . . . . . . . . . . . . . 21.7 *3.8 *3.6 17.6 . . . . . . *5.8 *4.8 *– *7.318–44 years . . . . . . . . . . . . . . . . . . . . 78.0 22.4 19.4 53.9 23.7 37.1 7.9 22.0 18.9 16.845 years and over . . . . . . . . . . . . . . . . 135.2 25.3 25.2 109.8 22.0 79.7 47.0 28.9 17.4 15.3
Black:All ages . . . . . . . . . . . . . . . . . . . . . . . . 95.2 30.0 26.6 65.2 35.9 72.4 19.5 33.7 *11.4 23.1Under 18 years . . . . . . . . . . . . . . . . . . *9.6 *– *– *9.6 . . . . . . *1.6 *7.6 *– *0.518–44 years . . . . . . . . . . . . . . . . . . . . 94.5 *26.7 *26.7 67.8 *27.6 *40.9 *12.1 *36.7 *12.5 *22.645 years and over . . . . . . . . . . . . . . . . 223.0 80.6 *65.8 142.4 *51.1 130.4 *59.4 *67.0 *26.1 *57.2
See footnotes and notes at end of table.
77

Table 55. Number of bed days associated with episodes of persons injured per 100 persons per year, by whether in moving motorvehicle, whether at work, place of accident, and sociodemographic characteristics: United States, 1994—Con.[Data are based on household interviews of the civilian noninstitutionalized population. The survey design, general qualifications, and information on the reliability of theestimates are given in appendix I. Definitions of terms are given in appendix II]
CharacteristicAll
episodes1
Moving motor vehicle? Place of accident
Yes At work?2
Total Traffic No Yes NoAt
homeStreet orhighway
Industrialplace Other
Family income and age
Under $10,000:Number of bed days per 100 persons per year
All ages . . . . . . . . . . . . . . . . . . . . . . . . 187.7 42.7 39.0 145.0 63.1 147.4 52.4 51.8 *25.6 37.5Under 18 years . . . . . . . . . . . . . . . . . . *25.9 *– *– *25.9 . . . . . . *4.4 *12.1 *– *4.618–44 years . . . . . . . . . . . . . . . . . . . . 143.4 *38.9 *38.6 104.5 *43.8 75.8 *23.1 *61.0 *17.1 *28.045 years and over . . . . . . . . . . . . . . . . 414.0 91.6 *79.5 322.4 89.5 246.0 141.8 *79.5 *63.3 *84.4
$10,000–$19,999:All ages . . . . . . . . . . . . . . . . . . . . . . . . 138.2 34.9 31.7 103.3 45.9 83.0 29.6 37.0 23.9 22.1Under 18 years . . . . . . . . . . . . . . . . . . *31.5 *7.9 *7.9 *23.6 . . . . . . *3.7 *12.2 *– *12.518–44 years . . . . . . . . . . . . . . . . . . . . 139.8 *31.0 *24.0 108.8 49.3 46.1 *16.7 *30.0 *31.7 *35.645 years and over . . . . . . . . . . . . . . . . 220.6 60.7 59.1 159.9 *42.0 124.3 64.3 64.3 *34.1 *14.6
$20,000–$34,999:All ages . . . . . . . . . . . . . . . . . . . . . . . . 72.6 17.3 16.8 55.3 23.0 49.3 17.4 17.3 12.1 14.7Under 18 years . . . . . . . . . . . . . . . . . . *18.8 *6.6 *6.6 *12.1 . . . . . . *7.4 *7.1 *– *3.918–44 years . . . . . . . . . . . . . . . . . . . . 91.5 26.2 *25.5 65.3 27.7 47.6 *9.6 26.4 *22.9 *21.545 years and over . . . . . . . . . . . . . . . . 93.0 *13.8 *13.2 79.2 *16.3 51.8 37.7 *13.2 *7.3 *14.5
$35,000 or more:All ages . . . . . . . . . . . . . . . . . . . . . . . . 43.4 9.1 8.1 34.3 11.8 28.1 9.7 9.3 6.1 8.9Under 18 years . . . . . . . . . . . . . . . . . . *14.6 *1.2 *0.8 *13.4 . . . . . . *3.8 *0.8 *– *5.318–44 years . . . . . . . . . . . . . . . . . . . . 35.7 *11.1 *9.5 24.5 *7.9 20.5 *4.5 *10.6 *7.8 *9.145 years and over . . . . . . . . . . . . . . . . 83.4 *13.7 *13.3 69.7 *17.7 39.6 23.6 *15.6 *9.7 *12.2
Geographic region
Northeast . . . . . . . . . . . . . . . . . . . . . . . 63.1 13.3 13.3 49.8 *12.8 49.0 20.0 17.0 *6.8 *11.4Midwest . . . . . . . . . . . . . . . . . . . . . . . . 74.1 18.1 16.5 55.6 26.5 46.6 18.2 20.1 10.4 13.9South . . . . . . . . . . . . . . . . . . . . . . . . . 94.3 24.2 22.3 70.1 31.0 70.0 24.4 24.5 19.6 15.3West . . . . . . . . . . . . . . . . . . . . . . . . . . 93.3 20.0 17.6 70.8 18.9 64.2 21.1 20.8 *10.1 16.4
Place of residence
MSA4 . . . . . . . . . . . . . . . . . . . . . . . . . 80.4 18.9 16.9 61.4 23.9 56.4 19.5 19.5 13.8 15.0Central city . . . . . . . . . . . . . . . . . . . . . 81.9 18.4 17.1 63.3 30.2 54.1 16.4 21.6 16.0 18.0Not central city . . . . . . . . . . . . . . . . . . 79.4 19.2 16.9 60.1 19.8 57.9 21.5 18.1 12.3 13.1
Not MSA4 . . . . . . . . . . . . . . . . . . . . . . . 92.7 22.5 22.3 67.7 22.8 67.7 27.6 27.1 *9.2 12.4
1Includes unknowns for each characteristic.2For currently employed persons 18 years of age and over only.3Includes other races and unknown family income.4MSA is metropolitan statistical area.
NOTES: The standard errors (SE’s) and relative standard errors (RSE’s) for age, sex and age, and race and age for columns 1–4 and 7–10 can be computed by using parameter set II of table II,the frequencies of table 56, and the formula presented in rule 2 of appendix I. The SE’s and RSE’s for columns 5 and 6 can be computed by using parameter sets II and X of table II, thefrequencies of tables 56 and 78, and the formula presented in rule 4 of appendix I. The SE’s and RSE’s for family income and age, geographic region, and place of residence can be computed byusing parameter sets II and X of table II, the frequencies of tables 56 and 78, and the formula presented in rule 4 of appendix I. Estimates for which the numerator has an RSE of more than 30percent are indicated with an asterisk.
78
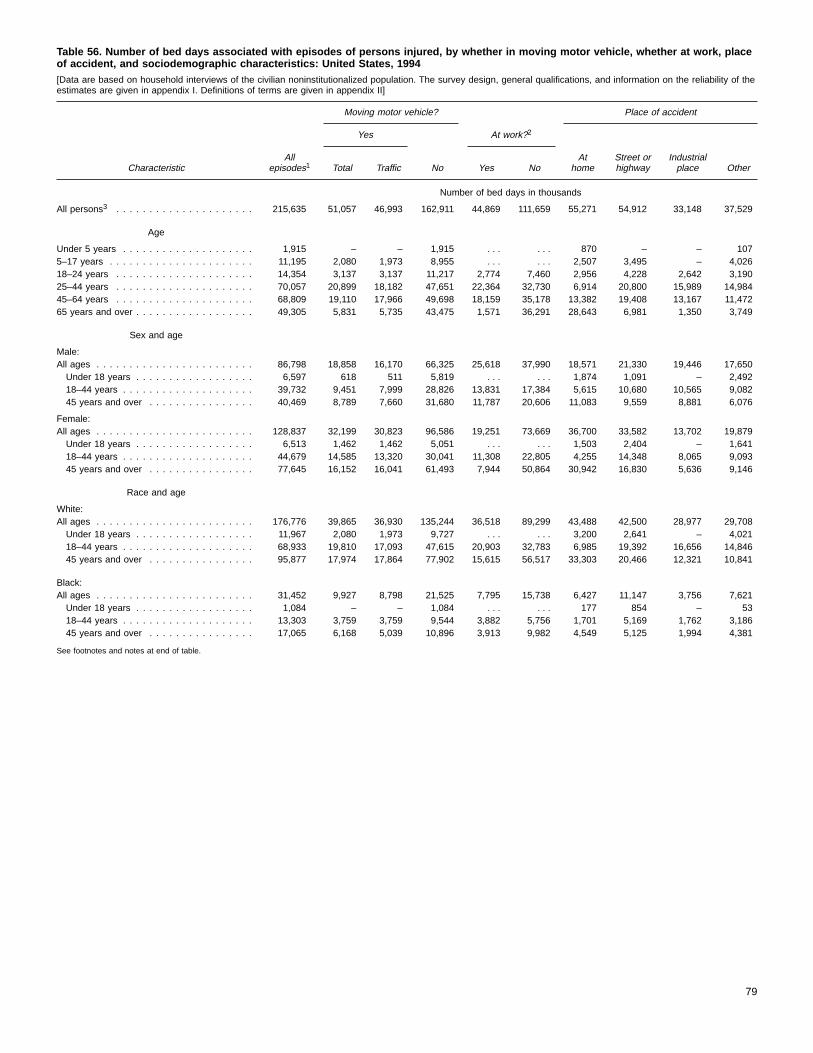
Table 56. Number of bed days associated with episodes of persons injured, by whether in moving motor vehicle, whether at work, placeof accident, and sociodemographic characteristics: United States, 1994[Data are based on household interviews of the civilian noninstitutionalized population. The survey design, general qualifications, and information on the reliability of theestimates are given in appendix I. Definitions of terms are given in appendix II]
CharacteristicAll
episodes1
Moving motor vehicle? Place of accident
Yes At work?2
Total Traffic No Yes NoAt
homeStreet orhighway
Industrialplace Other
Number of bed days in thousands
All persons3 . . . . . . . . . . . . . . . . . . . . . 215,635 51,057 46,993 162,911 44,869 111,659 55,271 54,912 33,148 37,529
Age
Under 5 years . . . . . . . . . . . . . . . . . . . . 1,915 – – 1,915 . . . . . . 870 – – 1075–17 years . . . . . . . . . . . . . . . . . . . . . . 11,195 2,080 1,973 8,955 . . . . . . 2,507 3,495 – 4,02618–24 years . . . . . . . . . . . . . . . . . . . . . 14,354 3,137 3,137 11,217 2,774 7,460 2,956 4,228 2,642 3,19025–44 years . . . . . . . . . . . . . . . . . . . . . 70,057 20,899 18,182 47,651 22,364 32,730 6,914 20,800 15,989 14,98445–64 years . . . . . . . . . . . . . . . . . . . . . 68,809 19,110 17,966 49,698 18,159 35,178 13,382 19,408 13,167 11,47265 years and over . . . . . . . . . . . . . . . . . . 49,305 5,831 5,735 43,475 1,571 36,291 28,643 6,981 1,350 3,749
Sex and age
Male:All ages . . . . . . . . . . . . . . . . . . . . . . . . 86,798 18,858 16,170 66,325 25,618 37,990 18,571 21,330 19,446 17,650Under 18 years . . . . . . . . . . . . . . . . . . 6,597 618 511 5,819 . . . . . . 1,874 1,091 – 2,49218–44 years . . . . . . . . . . . . . . . . . . . . 39,732 9,451 7,999 28,826 13,831 17,384 5,615 10,680 10,565 9,08245 years and over . . . . . . . . . . . . . . . . 40,469 8,789 7,660 31,680 11,787 20,606 11,083 9,559 8,881 6,076
Female:All ages . . . . . . . . . . . . . . . . . . . . . . . . 128,837 32,199 30,823 96,586 19,251 73,669 36,700 33,582 13,702 19,879Under 18 years . . . . . . . . . . . . . . . . . . 6,513 1,462 1,462 5,051 . . . . . . 1,503 2,404 – 1,64118–44 years . . . . . . . . . . . . . . . . . . . . 44,679 14,585 13,320 30,041 11,308 22,805 4,255 14,348 8,065 9,09345 years and over . . . . . . . . . . . . . . . . 77,645 16,152 16,041 61,493 7,944 50,864 30,942 16,830 5,636 9,146
Race and age
White:All ages . . . . . . . . . . . . . . . . . . . . . . . . 176,776 39,865 36,930 135,244 36,518 89,299 43,488 42,500 28,977 29,708Under 18 years . . . . . . . . . . . . . . . . . . 11,967 2,080 1,973 9,727 . . . . . . 3,200 2,641 – 4,02118–44 years . . . . . . . . . . . . . . . . . . . . 68,933 19,810 17,093 47,615 20,903 32,783 6,985 19,392 16,656 14,84645 years and over . . . . . . . . . . . . . . . . 95,877 17,974 17,864 77,902 15,615 56,517 33,303 20,466 12,321 10,841
Black:All ages . . . . . . . . . . . . . . . . . . . . . . . . 31,452 9,927 8,798 21,525 7,795 15,738 6,427 11,147 3,756 7,621Under 18 years . . . . . . . . . . . . . . . . . . 1,084 – – 1,084 . . . . . . 177 854 – 5318–44 years . . . . . . . . . . . . . . . . . . . . 13,303 3,759 3,759 9,544 3,882 5,756 1,701 5,169 1,762 3,18645 years and over . . . . . . . . . . . . . . . . 17,065 6,168 5,039 10,896 3,913 9,982 4,549 5,125 1,994 4,381
See footnotes and notes at end of table.
79

Table 56. Number of bed days associated with episodes of persons injured, by whether in moving motor vehicle, whether at work, placeof accident, and sociodemographic characteristics: United States, 1994—Con.[Data are based on household interviews of the civilian noninstitutionalized population. The survey design, general qualifications, and information on the reliability of theestimates are given in appendix I. Definitions of terms are given in appendix II]
CharacteristicAll
episodes1
Moving motor vehicle? Place of accident
Yes At work?2
Total Traffic No Yes NoAt
homeStreet orhighway
Industrialplace Other
Family income and age
Under $10,000:Number of bed days in thousands
All ages . . . . . . . . . . . . . . . . . . . . . . . . 43,848 9,976 9,114 33,872 10,298 24,077 12,249 12,092 5,975 8,771Under 18 years . . . . . . . . . . . . . . . . . . 1,821 – – 1,821 . . . . . . 311 854 – 32318–44 years . . . . . . . . . . . . . . . . . . . . 13,565 3,680 3,650 9,885 4,144 7,167 2,187 5,774 1,621 2,64745 years and over . . . . . . . . . . . . . . . . 28,461 6,295 5,464 22,166 6,154 16,910 9,750 5,464 4,354 5,801
$10,000–$19,999:All ages . . . . . . . . . . . . . . . . . . . . . . . . 51,513 13,013 11,817 38,500 12,469 22,544 11,016 13,792 8,916 8,239Under 18 years . . . . . . . . . . . . . . . . . . 3,182 795 795 2,388 . . . . . . 377 1,236 – 1,25818–44 years . . . . . . . . . . . . . . . . . . . . 20,053 4,441 3,447 15,612 7,078 6,609 2,400 4,307 4,550 5,10445 years and over . . . . . . . . . . . . . . . . 28,278 7,778 7,576 20,500 5,390 15,935 8,240 8,250 4,366 1,877
$20,000–$34,999:All ages . . . . . . . . . . . . . . . . . . . . . . . . 39,307 9,361 9,096 29,947 9,145 19,573 9,421 9,378 6,570 7,968Under 18 years . . . . . . . . . . . . . . . . . . 2,712 958 958 1,754 . . . . . . 1,071 1,024 – 56518–44 years . . . . . . . . . . . . . . . . . . . . 21,522 6,168 5,999 15,355 6,507 11,185 2,246 6,214 5,385 5,05545 years and over . . . . . . . . . . . . . . . . 15,073 2,235 2,140 12,838 2,638 8,387 6,104 2,140 1,185 2,349
$35,000 or more:All ages . . . . . . . . . . . . . . . . . . . . . . . . 43,510 9,083 8,172 34,375 8,504 20,275 9,777 9,328 6,164 8,960Under 18 years . . . . . . . . . . . . . . . . . . 4,086 328 221 3,759 . . . . . . 1,078 221 – 1,48418–44 years . . . . . . . . . . . . . . . . . . . . 15,608 4,836 4,143 10,720 3,448 8,967 1,953 4,652 3,404 3,98245 years and over . . . . . . . . . . . . . . . . 23,815 3,919 3,809 19,896 5,055 11,307 6,747 4,455 2,760 3,494
Geographic region
Northeast . . . . . . . . . . . . . . . . . . . . . . . 31,916 6,725 6,725 25,192 4,834 18,421 10,108 8,627 3,420 5,775Midwest . . . . . . . . . . . . . . . . . . . . . . . . 46,844 11,461 10,460 35,171 12,241 21,530 11,492 12,706 6,594 8,770South . . . . . . . . . . . . . . . . . . . . . . . . . 83,052 21,334 19,639 61,718 20,014 45,269 21,495 21,556 17,291 13,515West . . . . . . . . . . . . . . . . . . . . . . . . . . 53,822 11,537 10,168 40,830 7,780 26,440 12,177 12,024 5,842 9,469
Place of residence
MSA4 . . . . . . . . . . . . . . . . . . . . . . . . . 163,207 38,344 34,390 124,651 35,363 83,384 39,656 39,602 27,943 30,518Central city . . . . . . . . . . . . . . . . . . . . . 65,125 14,637 13,566 50,329 17,608 31,503 13,051 17,176 12,704 14,332Not central city . . . . . . . . . . . . . . . . . . 98,082 23,707 20,824 74,323 17,755 51,881 26,605 22,426 15,240 16,186
Not MSA4 . . . . . . . . . . . . . . . . . . . . . . . 52,428 12,713 12,602 38,260 9,506 28,275 15,616 15,310 5,204 7,011
1Includes unknowns for each characteristic.2For currently employed persons 18 years of age and over only.3Includes other races and unknown family income.4MSA is metropolitan statistical area.
NOTES: The standard errors and relative standard errors (RSE’s) can be computed by using parameter set II of table II and the formula presented in rule 1 of appendix I. An estimate of 55.4million has a 10-percent RSE; of 13.4 million, a 20-percent RSE; and of 6.0 million, a 30-percent RSE.
80
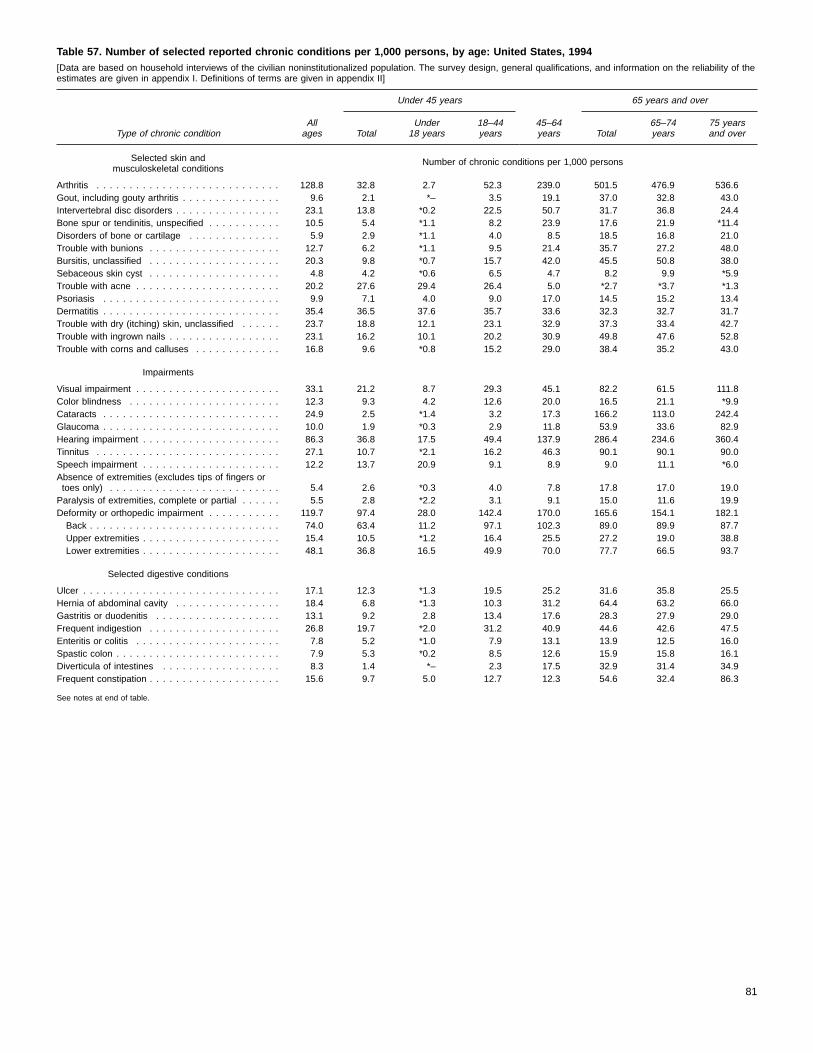
Table 57. Number of selected reported chronic conditions per 1,000 persons, by age: United States, 1994[Data are based on household interviews of the civilian noninstitutionalized population. The survey design, general qualifications, and information on the reliability of theestimates are given in appendix I. Definitions of terms are given in appendix II]
Type of chronic conditionAllages
Under 45 years
45–64years
65 years and over
TotalUnder18 years
18–44years Total
65–74years
75 yearsand over
Selected skin andmusculoskeletal conditions
Number of chronic conditions per 1,000 persons
Arthritis . . . . . . . . . . . . . . . . . . . . . . . . . . . . 128.8 32.8 2.7 52.3 239.0 501.5 476.9 536.6Gout, including gouty arthritis . . . . . . . . . . . . . . . 9.6 2.1 *– 3.5 19.1 37.0 32.8 43.0Intervertebral disc disorders . . . . . . . . . . . . . . . . 23.1 13.8 *0.2 22.5 50.7 31.7 36.8 24.4Bone spur or tendinitis, unspecified . . . . . . . . . . . 10.5 5.4 *1.1 8.2 23.9 17.6 21.9 *11.4Disorders of bone or cartilage . . . . . . . . . . . . . . 5.9 2.9 *1.1 4.0 8.5 18.5 16.8 21.0Trouble with bunions . . . . . . . . . . . . . . . . . . . . 12.7 6.2 *1.1 9.5 21.4 35.7 27.2 48.0Bursitis, unclassified . . . . . . . . . . . . . . . . . . . . 20.3 9.8 *0.7 15.7 42.0 45.5 50.8 38.0Sebaceous skin cyst . . . . . . . . . . . . . . . . . . . . 4.8 4.2 *0.6 6.5 4.7 8.2 9.9 *5.9Trouble with acne . . . . . . . . . . . . . . . . . . . . . . 20.2 27.6 29.4 26.4 5.0 *2.7 *3.7 *1.3Psoriasis . . . . . . . . . . . . . . . . . . . . . . . . . . . 9.9 7.1 4.0 9.0 17.0 14.5 15.2 13.4Dermatitis . . . . . . . . . . . . . . . . . . . . . . . . . . . 35.4 36.5 37.6 35.7 33.6 32.3 32.7 31.7Trouble with dry (itching) skin, unclassified . . . . . . 23.7 18.8 12.1 23.1 32.9 37.3 33.4 42.7Trouble with ingrown nails . . . . . . . . . . . . . . . . . 23.1 16.2 10.1 20.2 30.9 49.8 47.6 52.8Trouble with corns and calluses . . . . . . . . . . . . . 16.8 9.6 *0.8 15.2 29.0 38.4 35.2 43.0
Impairments
Visual impairment . . . . . . . . . . . . . . . . . . . . . . 33.1 21.2 8.7 29.3 45.1 82.2 61.5 111.8Color blindness . . . . . . . . . . . . . . . . . . . . . . . 12.3 9.3 4.2 12.6 20.0 16.5 21.1 *9.9Cataracts . . . . . . . . . . . . . . . . . . . . . . . . . . . 24.9 2.5 *1.4 3.2 17.3 166.2 113.0 242.4Glaucoma . . . . . . . . . . . . . . . . . . . . . . . . . . . 10.0 1.9 *0.3 2.9 11.8 53.9 33.6 82.9Hearing impairment . . . . . . . . . . . . . . . . . . . . . 86.3 36.8 17.5 49.4 137.9 286.4 234.6 360.4Tinnitus . . . . . . . . . . . . . . . . . . . . . . . . . . . . 27.1 10.7 *2.1 16.2 46.3 90.1 90.1 90.0Speech impairment . . . . . . . . . . . . . . . . . . . . . 12.2 13.7 20.9 9.1 8.9 9.0 11.1 *6.0Absence of extremities (excludes tips of fingers ortoes only) . . . . . . . . . . . . . . . . . . . . . . . . . . 5.4 2.6 *0.3 4.0 7.8 17.8 17.0 19.0Paralysis of extremities, complete or partial . . . . . . 5.5 2.8 *2.2 3.1 9.1 15.0 11.6 19.9Deformity or orthopedic impairment . . . . . . . . . . . 119.7 97.4 28.0 142.4 170.0 165.6 154.1 182.1Back . . . . . . . . . . . . . . . . . . . . . . . . . . . . . 74.0 63.4 11.2 97.1 102.3 89.0 89.9 87.7Upper extremities . . . . . . . . . . . . . . . . . . . . . 15.4 10.5 *1.2 16.4 25.5 27.2 19.0 38.8Lower extremities . . . . . . . . . . . . . . . . . . . . . 48.1 36.8 16.5 49.9 70.0 77.7 66.5 93.7
Selected digestive conditions
Ulcer . . . . . . . . . . . . . . . . . . . . . . . . . . . . . . 17.1 12.3 *1.3 19.5 25.2 31.6 35.8 25.5Hernia of abdominal cavity . . . . . . . . . . . . . . . . 18.4 6.8 *1.3 10.3 31.2 64.4 63.2 66.0Gastritis or duodenitis . . . . . . . . . . . . . . . . . . . 13.1 9.2 2.8 13.4 17.6 28.3 27.9 29.0Frequent indigestion . . . . . . . . . . . . . . . . . . . . 26.8 19.7 *2.0 31.2 40.9 44.6 42.6 47.5Enteritis or colitis . . . . . . . . . . . . . . . . . . . . . . 7.8 5.2 *1.0 7.9 13.1 13.9 12.5 16.0Spastic colon . . . . . . . . . . . . . . . . . . . . . . . . . 7.9 5.3 *0.2 8.5 12.6 15.9 15.8 16.1Diverticula of intestines . . . . . . . . . . . . . . . . . . 8.3 1.4 *– 2.3 17.5 32.9 31.4 34.9Frequent constipation . . . . . . . . . . . . . . . . . . . . 15.6 9.7 5.0 12.7 12.3 54.6 32.4 86.3
See notes at end of table.
81

Table 57. Number of selected reported chronic conditions per 1,000 persons, by age: United States, 1994—Con.[Data are based on household interviews of the civilian noninstitutionalized population. The survey design, general qualifications, and information on the reliability of theestimates are given in appendix I. Definitions of terms are given in appendix II]
Type of chronic conditionAllages
Under 45 years
45–64years
65 years and over
TotalUnder
18 years18–44years Total
65–74years
75 yearsand over
Selected conditions of thegenitourinary, nervous, endocrine, metabolic,
and blood and blood-forming systemsNumber of chronic conditions per 1,000 persons
Goiter or other disorders of the thyroid . . . . . . . . . 17.4 8.5 *0.2 13.8 29.9 48.1 47.4 49.0Diabetes . . . . . . . . . . . . . . . . . . . . . . . . . . . . 29.9 8.1 *1.4 12.4 63.1 101.2 101.6 100.8Anemias . . . . . . . . . . . . . . . . . . . . . . . . . . . . 18.0 17.6 12.2 21.2 17.6 20.4 16.7 25.7Epilepsy . . . . . . . . . . . . . . . . . . . . . . . . . . . . 5.4 5.5 4.7 6.0 4.7 5.7 *5.9 *5.4Migraine headache . . . . . . . . . . . . . . . . . . . . . 43.4 44.5 16.1 62.9 52.5 21.8 24.2 18.2Neuralgia or neuritis, unspecified . . . . . . . . . . . . 2.2 0.9 *– 1.5 3.7 6.9 *5.9 *8.4Kidney trouble . . . . . . . . . . . . . . . . . . . . . . . . 13.5 10.9 3.4 15.8 17.2 22.4 14.7 33.5Bladder disorders . . . . . . . . . . . . . . . . . . . . . . 14.4 9.3 4.4 12.5 16.9 39.7 36.2 44.7Diseases of prostate . . . . . . . . . . . . . . . . . . . . 10.2 1.8 *– 2.9 13.7 52.7 47.0 60.8Disease of female genital organs . . . . . . . . . . . . 19.5 19.5 3.6 29.9 26.4 7.7 9.1 *5.7
Selected circulatory conditions
Rheumatic fever with or without heart disease . . . . 8.0 5.3 *1.4 7.8 12.4 16.1 18.6 12.4Heart disease . . . . . . . . . . . . . . . . . . . . . . . . 85.8 30.1 18.1 37.9 135.7 324.9 281.2 387.3Ischemic heart disease . . . . . . . . . . . . . . . . . 30.8 2.5 *0.1 4.1 56.4 151.8 134.0 177.3Heart rhythm disorders . . . . . . . . . . . . . . . . . 34.4 21.2 13.9 25.9 47.6 88.9 74.5 109.5Tachycardia or rapid heart . . . . . . . . . . . . . . 9.7 3.9 *1.4 5.6 15.4 34.0 28.2 42.4Heart murmurs . . . . . . . . . . . . . . . . . . . . . 17.2 15.0 12.1 16.9 22.7 21.1 18.9 24.2Other and unspecified heart rhythm disorders . . 7.4 2.2 *0.5 3.4 9.6 33.8 27.4 43.0
Other selected diseases of heart,excluding hypertension . . . . . . . . . . . . . . . . 20.6 6.4 4.0 7.9 31.6 84.1 72.8 100.4
High blood pressure (hypertension) . . . . . . . . . . . 108.8 32.2 2.7 51.3 222.3 364.0 347.2 388.0Cerebrovascular disease . . . . . . . . . . . . . . . . . 11.5 1.6 *0.9 2.0 18.2 57.4 40.7 81.2Hardening of the arteries . . . . . . . . . . . . . . . . . 8.6 *0.2 *– *0.4 11.1 52.9 38.0 74.1Varicose veins of lower extremities . . . . . . . . . . . 28.0 13.5 *– 22.2 50.5 74.7 75.0 74.2Hemorrhoids . . . . . . . . . . . . . . . . . . . . . . . . . 35.9 24.0 *0.4 39.3 62.1 61.7 61.7 61.6
Selected respiratory conditions
Chronic bronchitis . . . . . . . . . . . . . . . . . . . . . . 54.0 50.1 55.3 46.7 63.9 60.5 62.3 57.9Asthma . . . . . . . . . . . . . . . . . . . . . . . . . . . . 56.1 58.6 69.1 51.7 50.8 50.5 52.4 47.8Hay fever or allergic rhinitis without asthma . . . . . . 100.7 98.6 60.5 123.3 120.8 80.0 86.6 70.5Chronic sinusitis . . . . . . . . . . . . . . . . . . . . . . . 134.4 118.7 65.1 153.3 179.9 151.1 150.1 152.5Deviated nasal septum . . . . . . . . . . . . . . . . . . . 7.8 5.6 *0.8 8.7 13.4 11.6 16.2 *5.0Chronic disease of tonsils or adenoids . . . . . . . . . 11.3 15.5 23.1 10.6 *3.0 *0.4 *0.7 *–Emphysema . . . . . . . . . . . . . . . . . . . . . . . . . 7.8 *0.7 *– *1.1 9.9 45.5 47.1 43.4
NOTES: The standard errors and relative standard errors (RSE’s) can be computed by using parameter set V of table II, the frequencies of table 62, and the formula presented in rule 2 ofappendix I. Estimates for which the numerator has an RSE of more than 30 percent are indicated with an asterisk.
82
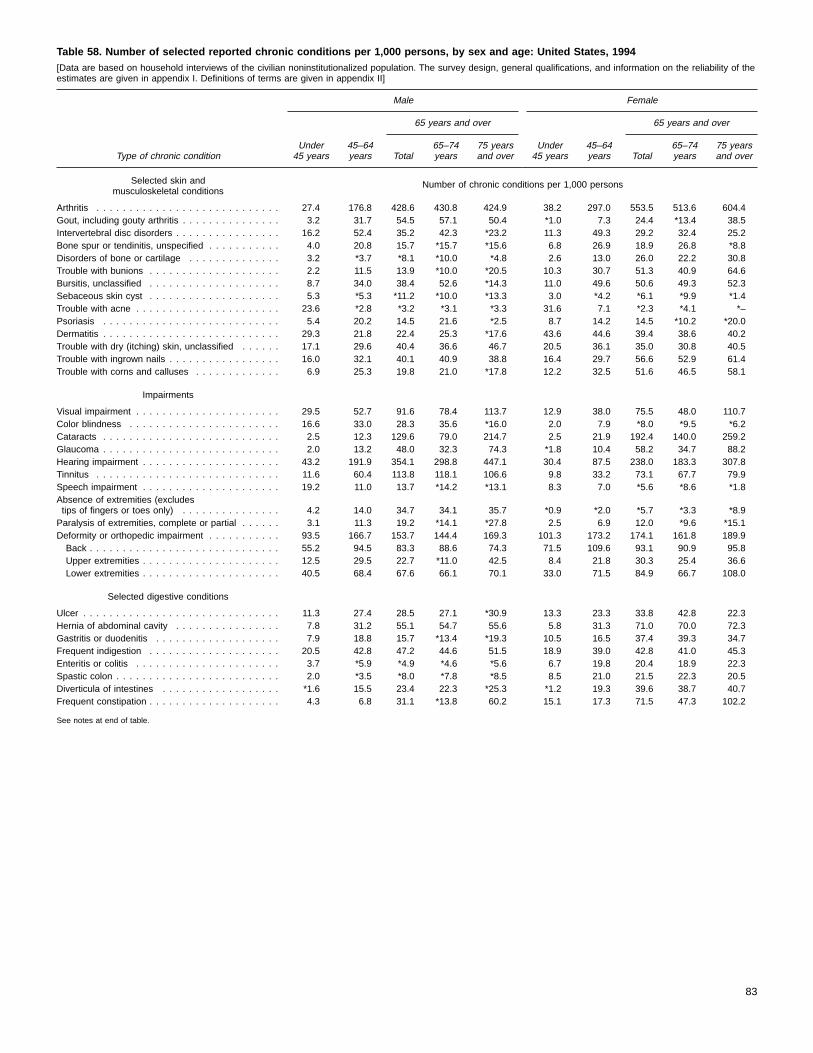
Table 58. Number of selected reported chronic conditions per 1,000 persons, by sex and age: United States, 1994[Data are based on household interviews of the civilian noninstitutionalized population. The survey design, general qualifications, and information on the reliability of theestimates are given in appendix I. Definitions of terms are given in appendix II]
Type of chronic condition
Male Female
Under45 years
45–64years
65 years and over
Under45 years
45–64years
65 years and over
Total65–74years
75 yearsand over Total
65–74years
75 yearsand over
Selected skin andmusculoskeletal conditions
Number of chronic conditions per 1,000 persons
Arthritis . . . . . . . . . . . . . . . . . . . . . . . . . . . . 27.4 176.8 428.6 430.8 424.9 38.2 297.0 553.5 513.6 604.4Gout, including gouty arthritis . . . . . . . . . . . . . . . 3.2 31.7 54.5 57.1 50.4 *1.0 7.3 24.4 *13.4 38.5Intervertebral disc disorders . . . . . . . . . . . . . . . . 16.2 52.4 35.2 42.3 *23.2 11.3 49.3 29.2 32.4 25.2Bone spur or tendinitis, unspecified . . . . . . . . . . . 4.0 20.8 15.7 *15.7 *15.6 6.8 26.9 18.9 26.8 *8.8Disorders of bone or cartilage . . . . . . . . . . . . . . 3.2 *3.7 *8.1 *10.0 *4.8 2.6 13.0 26.0 22.2 30.8Trouble with bunions . . . . . . . . . . . . . . . . . . . . 2.2 11.5 13.9 *10.0 *20.5 10.3 30.7 51.3 40.9 64.6Bursitis, unclassified . . . . . . . . . . . . . . . . . . . . 8.7 34.0 38.4 52.6 *14.3 11.0 49.6 50.6 49.3 52.3Sebaceous skin cyst . . . . . . . . . . . . . . . . . . . . 5.3 *5.3 *11.2 *10.0 *13.3 3.0 *4.2 *6.1 *9.9 *1.4Trouble with acne . . . . . . . . . . . . . . . . . . . . . . 23.6 *2.8 *3.2 *3.1 *3.3 31.6 7.1 *2.3 *4.1 *–Psoriasis . . . . . . . . . . . . . . . . . . . . . . . . . . . 5.4 20.2 14.5 21.6 *2.5 8.7 14.2 14.5 *10.2 *20.0Dermatitis . . . . . . . . . . . . . . . . . . . . . . . . . . . 29.3 21.8 22.4 25.3 *17.6 43.6 44.6 39.4 38.6 40.2Trouble with dry (itching) skin, unclassified . . . . . . 17.1 29.6 40.4 36.6 46.7 20.5 36.1 35.0 30.8 40.5Trouble with ingrown nails . . . . . . . . . . . . . . . . . 16.0 32.1 40.1 40.9 38.8 16.4 29.7 56.6 52.9 61.4Trouble with corns and calluses . . . . . . . . . . . . . 6.9 25.3 19.8 21.0 *17.8 12.2 32.5 51.6 46.5 58.1
Impairments
Visual impairment . . . . . . . . . . . . . . . . . . . . . . 29.5 52.7 91.6 78.4 113.7 12.9 38.0 75.5 48.0 110.7Color blindness . . . . . . . . . . . . . . . . . . . . . . . 16.6 33.0 28.3 35.6 *16.0 2.0 7.9 *8.0 *9.5 *6.2Cataracts . . . . . . . . . . . . . . . . . . . . . . . . . . . 2.5 12.3 129.6 79.0 214.7 2.5 21.9 192.4 140.0 259.2Glaucoma . . . . . . . . . . . . . . . . . . . . . . . . . . . 2.0 13.2 48.0 32.3 74.3 *1.8 10.4 58.2 34.7 88.2Hearing impairment . . . . . . . . . . . . . . . . . . . . . 43.2 191.9 354.1 298.8 447.1 30.4 87.5 238.0 183.3 307.8Tinnitus . . . . . . . . . . . . . . . . . . . . . . . . . . . . 11.6 60.4 113.8 118.1 106.6 9.8 33.2 73.1 67.7 79.9Speech impairment . . . . . . . . . . . . . . . . . . . . . 19.2 11.0 13.7 *14.2 *13.1 8.3 7.0 *5.6 *8.6 *1.8Absence of extremities (excludestips of fingers or toes only) . . . . . . . . . . . . . . . 4.2 14.0 34.7 34.1 35.7 *0.9 *2.0 *5.7 *3.3 *8.9Paralysis of extremities, complete or partial . . . . . . 3.1 11.3 19.2 *14.1 *27.8 2.5 6.9 12.0 *9.6 *15.1Deformity or orthopedic impairment . . . . . . . . . . . 93.5 166.7 153.7 144.4 169.3 101.3 173.2 174.1 161.8 189.9Back . . . . . . . . . . . . . . . . . . . . . . . . . . . . . 55.2 94.5 83.3 88.6 74.3 71.5 109.6 93.1 90.9 95.8Upper extremities . . . . . . . . . . . . . . . . . . . . . 12.5 29.5 22.7 *11.0 42.5 8.4 21.8 30.3 25.4 36.6Lower extremities . . . . . . . . . . . . . . . . . . . . . 40.5 68.4 67.6 66.1 70.1 33.0 71.5 84.9 66.7 108.0
Selected digestive conditions
Ulcer . . . . . . . . . . . . . . . . . . . . . . . . . . . . . . 11.3 27.4 28.5 27.1 *30.9 13.3 23.3 33.8 42.8 22.3Hernia of abdominal cavity . . . . . . . . . . . . . . . . 7.8 31.2 55.1 54.7 55.6 5.8 31.3 71.0 70.0 72.3Gastritis or duodenitis . . . . . . . . . . . . . . . . . . . 7.9 18.8 15.7 *13.4 *19.3 10.5 16.5 37.4 39.3 34.7Frequent indigestion . . . . . . . . . . . . . . . . . . . . 20.5 42.8 47.2 44.6 51.5 18.9 39.0 42.8 41.0 45.3Enteritis or colitis . . . . . . . . . . . . . . . . . . . . . . 3.7 *5.9 *4.9 *4.6 *5.6 6.7 19.8 20.4 18.9 22.3Spastic colon . . . . . . . . . . . . . . . . . . . . . . . . . 2.0 *3.5 *8.0 *7.8 *8.5 8.5 21.0 21.5 22.3 20.5Diverticula of intestines . . . . . . . . . . . . . . . . . . *1.6 15.5 23.4 22.3 *25.3 *1.2 19.3 39.6 38.7 40.7Frequent constipation . . . . . . . . . . . . . . . . . . . . 4.3 6.8 31.1 *13.8 60.2 15.1 17.3 71.5 47.3 102.2
See notes at end of table.
83

Table 58. Number of selected reported chronic conditions per 1,000 persons, by sex and age: United States, 1994—Con.[Data are based on household interviews of the civilian noninstitutionalized population. The survey design, general qualifications, and information on the reliability of theestimates are given in appendix I. Definitions of terms are given in appendix II]
Type of chronic condition
Male Female
Under45 years
45–64years
65 years and over
Under45 years
45–64years
65 years and over
Total65–74years
75 yearsand over Total
65–74years
75 yearsand over
Selected conditions of thegenitourinary, nervous, endocrine, metabolic,
and blood and blood-forming systemsNumber of chronic conditions per 1,000 persons
Goiter or other disorders of the thyroid . . . . . . . . . 2.4 7.8 22.0 *13.1 36.9 14.6 50.5 66.7 74.8 56.2Diabetes . . . . . . . . . . . . . . . . . . . . . . . . . . . . 7.3 63.3 107.3 102.4 115.6 8.9 63.0 96.9 101.0 91.8Anemias . . . . . . . . . . . . . . . . . . . . . . . . . . . . 6.0 *4.5 *11.4 *7.3 *18.5 29.3 29.9 26.8 24.3 30.1Epilepsy . . . . . . . . . . . . . . . . . . . . . . . . . . . . 5.7 *5.6 *8.0 *5.5 *12.0 5.3 *3.8 *4.0 *6.2 *1.3Migraine headache . . . . . . . . . . . . . . . . . . . . . 22.0 24.2 12.7 *17.1 *5.2 67.1 78.9 28.2 29.9 26.2Neuralgia or neuritis, unspecified . . . . . . . . . . . . *0.2 *2.0 *7.3 *4.4 *12.2 *1.6 *5.4 *6.6 *7.1 *6.0Kidney trouble . . . . . . . . . . . . . . . . . . . . . . . . 5.3 16.3 23.2 *16.1 35.1 16.6 18.0 21.9 *13.5 32.6Bladder disorders . . . . . . . . . . . . . . . . . . . . . . 2.8 *5.4 22.3 *15.4 33.8 15.9 27.7 52.1 52.8 51.3Diseases of prostate . . . . . . . . . . . . . . . . . . . . 3.5 28.3 126.5 105.8 161.2 . . . . . . . . . . . . . . .Disease of female genital organs . . . . . . . . . . . . . . . . . . . . . . . . . . . 39.1 51.1 13.3 16.4 *9.2
Selected circulatory conditions
Rheumatic fever with or without heart disease . . . . 2.9 8.5 *10.8 *12.5 *7.9 7.7 16.0 19.8 23.6 *15.2Heart disease . . . . . . . . . . . . . . . . . . . . . . . . 27.0 162.0 360.5 319.3 429.9 33.1 111.0 299.4 250.8 361.4Ischemic heart disease . . . . . . . . . . . . . . . . . 3.8 81.9 191.8 183.4 205.8 *1.3 32.5 123.3 94.5 160.1Heart rhythm disorders . . . . . . . . . . . . . . . . . 16.5 41.8 78.8 63.7 104.1 25.8 53.1 96.2 83.1 112.8Tachycardia or rapid heart . . . . . . . . . . . . . . 3.0 14.4 27.4 27.1 *27.8 4.8 16.3 38.7 29.0 51.2Heart murmurs . . . . . . . . . . . . . . . . . . . . . 11.5 15.8 15.2 *15.3 *14.9 18.5 29.0 25.3 21.8 29.8Other and unspecified heart rhythm disorders . . 2.0 11.6 36.3 21.3 61.4 2.5 7.7 32.1 32.3 31.8
Other selected diseases of heart, excludinghypertension . . . . . . . . . . . . . . . . . . . . . . . 6.8 38.3 89.9 72.1 119.7 6.0 25.4 80.0 73.3 88.7
High blood pressure (hypertension) . . . . . . . . . . . 31.9 220.0 319.5 307.7 339.2 32.4 224.5 395.8 378.7 417.5Cerebrovascular disease . . . . . . . . . . . . . . . . . *1.3 20.4 53.1 39.6 75.9 1.9 16.2 60.5 41.6 84.4Hardening of the arteries . . . . . . . . . . . . . . . . . *0.4 14.0 69.1 47.2 105.8 *– 8.4 41.3 30.7 55.1Varicose veins of lower extremities . . . . . . . . . . . 3.7 17.8 42.3 32.5 58.5 23.3 81.0 97.9 109.0 83.8Hemorrhoids . . . . . . . . . . . . . . . . . . . . . . . . . 19.1 68.7 56.9 51.0 66.6 29.0 55.8 65.1 70.2 58.6
Selected respiratory conditions
Chronic bronchitis . . . . . . . . . . . . . . . . . . . . . . 43.6 43.8 51.5 41.7 68.0 56.5 82.7 67.0 79.0 51.7Asthma . . . . . . . . . . . . . . . . . . . . . . . . . . . . 57.1 32.3 50.9 39.3 70.3 60.0 68.0 50.2 62.8 34.1Hay fever or allergic rhinitis without asthma . . . . . . 98.0 107.3 71.1 79.6 56.6 99.2 133.4 86.3 92.2 78.8Chronic sinusitis . . . . . . . . . . . . . . . . . . . . . . . 101.9 147.5 116.5 118.2 113.9 135.5 210.2 175.7 175.5 176.1Deviated nasal septum . . . . . . . . . . . . . . . . . . . 4.3 14.5 16.3 22.3 *6.2 6.8 12.3 *8.2 *11.3 *4.3Chronic disease of tonsils or adenoids . . . . . . . . . 11.7 *1.6 *– *– *– 19.3 *4.2 *0.7 *1.2 *–Emphysema . . . . . . . . . . . . . . . . . . . . . . . . . *1.2 10.3 67.9 59.9 81.3 *0.1 9.5 29.6 36.7 20.4
NOTES: The standard errors and relative standard errors (RSE’s) can be computed by using parameter set V of table II, the frequencies of table 63, and the formula presented in rule 2 ofappendix I. Estimates for which the numerator has an RSE of more than 30 percent are indicated with an asterisk.
84
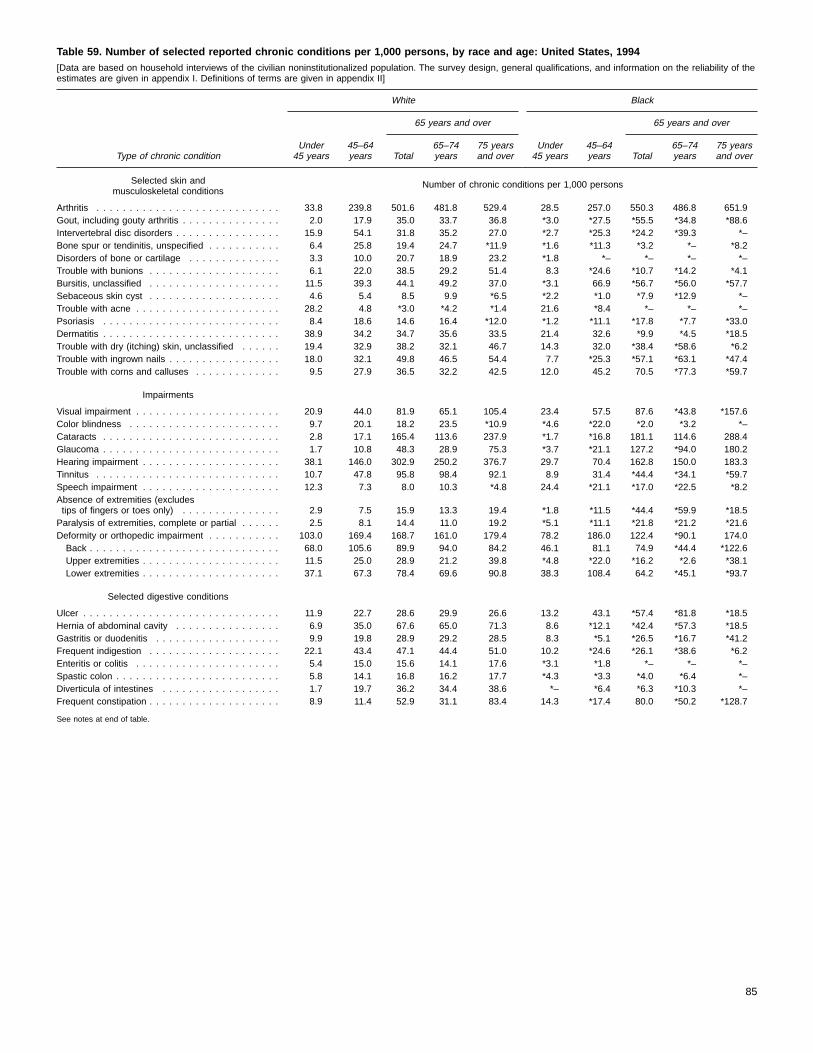
Table 59. Number of selected reported chronic conditions per 1,000 persons, by race and age: United States, 1994[Data are based on household interviews of the civilian noninstitutionalized population. The survey design, general qualifications, and information on the reliability of theestimates are given in appendix I. Definitions of terms are given in appendix II]
Type of chronic condition
White Black
Under45 years
45–64years
65 years and over
Under45 years
45–64years
65 years and over
Total65–74years
75 yearsand over Total
65–74years
75 yearsand over
Selected skin andmusculoskeletal conditions
Number of chronic conditions per 1,000 persons
Arthritis . . . . . . . . . . . . . . . . . . . . . . . . . . . . 33.8 239.8 501.6 481.8 529.4 28.5 257.0 550.3 486.8 651.9Gout, including gouty arthritis . . . . . . . . . . . . . . . 2.0 17.9 35.0 33.7 36.8 *3.0 *27.5 *55.5 *34.8 *88.6Intervertebral disc disorders . . . . . . . . . . . . . . . . 15.9 54.1 31.8 35.2 27.0 *2.7 *25.3 *24.2 *39.3 *–Bone spur or tendinitis, unspecified . . . . . . . . . . . 6.4 25.8 19.4 24.7 *11.9 *1.6 *11.3 *3.2 *– *8.2Disorders of bone or cartilage . . . . . . . . . . . . . . 3.3 10.0 20.7 18.9 23.2 *1.8 *– *– *– *–Trouble with bunions . . . . . . . . . . . . . . . . . . . . 6.1 22.0 38.5 29.2 51.4 8.3 *24.6 *10.7 *14.2 *4.1Bursitis, unclassified . . . . . . . . . . . . . . . . . . . . 11.5 39.3 44.1 49.2 37.0 *3.1 66.9 *56.7 *56.0 *57.7Sebaceous skin cyst . . . . . . . . . . . . . . . . . . . . 4.6 5.4 8.5 9.9 *6.5 *2.2 *1.0 *7.9 *12.9 *–Trouble with acne . . . . . . . . . . . . . . . . . . . . . . 28.2 4.8 *3.0 *4.2 *1.4 21.6 *8.4 *– *– *–Psoriasis . . . . . . . . . . . . . . . . . . . . . . . . . . . 8.4 18.6 14.6 16.4 *12.0 *1.2 *11.1 *17.8 *7.7 *33.0Dermatitis . . . . . . . . . . . . . . . . . . . . . . . . . . . 38.9 34.2 34.7 35.6 33.5 21.4 32.6 *9.9 *4.5 *18.5Trouble with dry (itching) skin, unclassified . . . . . . 19.4 32.9 38.2 32.1 46.7 14.3 32.0 *38.4 *58.6 *6.2Trouble with ingrown nails . . . . . . . . . . . . . . . . . 18.0 32.1 49.8 46.5 54.4 7.7 *25.3 *57.1 *63.1 *47.4Trouble with corns and calluses . . . . . . . . . . . . . 9.5 27.9 36.5 32.2 42.5 12.0 45.2 70.5 *77.3 *59.7
Impairments
Visual impairment . . . . . . . . . . . . . . . . . . . . . . 20.9 44.0 81.9 65.1 105.4 23.4 57.5 87.6 *43.8 *157.6Color blindness . . . . . . . . . . . . . . . . . . . . . . . 9.7 20.1 18.2 23.5 *10.9 *4.6 *22.0 *2.0 *3.2 *–Cataracts . . . . . . . . . . . . . . . . . . . . . . . . . . . 2.8 17.1 165.4 113.6 237.9 *1.7 *16.8 181.1 114.6 288.4Glaucoma . . . . . . . . . . . . . . . . . . . . . . . . . . . 1.7 10.8 48.3 28.9 75.3 *3.7 *21.1 127.2 *94.0 180.2Hearing impairment . . . . . . . . . . . . . . . . . . . . . 38.1 146.0 302.9 250.2 376.7 29.7 70.4 162.8 150.0 183.3Tinnitus . . . . . . . . . . . . . . . . . . . . . . . . . . . . 10.7 47.8 95.8 98.4 92.1 8.9 31.4 *44.4 *34.1 *59.7Speech impairment . . . . . . . . . . . . . . . . . . . . . 12.3 7.3 8.0 10.3 *4.8 24.4 *21.1 *17.0 *22.5 *8.2Absence of extremities (excludestips of fingers or toes only) . . . . . . . . . . . . . . . 2.9 7.5 15.9 13.3 19.4 *1.8 *11.5 *44.4 *59.9 *18.5Paralysis of extremities, complete or partial . . . . . . 2.5 8.1 14.4 11.0 19.2 *5.1 *11.1 *21.8 *21.2 *21.6Deformity or orthopedic impairment . . . . . . . . . . . 103.0 169.4 168.7 161.0 179.4 78.2 186.0 122.4 *90.1 174.0Back . . . . . . . . . . . . . . . . . . . . . . . . . . . . . 68.0 105.6 89.9 94.0 84.2 46.1 81.1 74.9 *44.4 *122.6Upper extremities . . . . . . . . . . . . . . . . . . . . . 11.5 25.0 28.9 21.2 39.8 *4.8 *22.0 *16.2 *2.6 *38.1Lower extremities . . . . . . . . . . . . . . . . . . . . . 37.1 67.3 78.4 69.6 90.8 38.3 108.4 64.2 *45.1 *93.7
Selected digestive conditions
Ulcer . . . . . . . . . . . . . . . . . . . . . . . . . . . . . . 11.9 22.7 28.6 29.9 26.6 13.2 43.1 *57.4 *81.8 *18.5Hernia of abdominal cavity . . . . . . . . . . . . . . . . 6.9 35.0 67.6 65.0 71.3 8.6 *12.1 *42.4 *57.3 *18.5Gastritis or duodenitis . . . . . . . . . . . . . . . . . . . 9.9 19.8 28.9 29.2 28.5 8.3 *5.1 *26.5 *16.7 *41.2Frequent indigestion . . . . . . . . . . . . . . . . . . . . 22.1 43.4 47.1 44.4 51.0 10.2 *24.6 *26.1 *38.6 *6.2Enteritis or colitis . . . . . . . . . . . . . . . . . . . . . . 5.4 15.0 15.6 14.1 17.6 *3.1 *1.8 *– *– *–Spastic colon . . . . . . . . . . . . . . . . . . . . . . . . . 5.8 14.1 16.8 16.2 17.7 *4.3 *3.3 *4.0 *6.4 *–Diverticula of intestines . . . . . . . . . . . . . . . . . . 1.7 19.7 36.2 34.4 38.6 *– *6.4 *6.3 *10.3 *–Frequent constipation . . . . . . . . . . . . . . . . . . . . 8.9 11.4 52.9 31.1 83.4 14.3 *17.4 80.0 *50.2 *128.7
See notes at end of table.
85
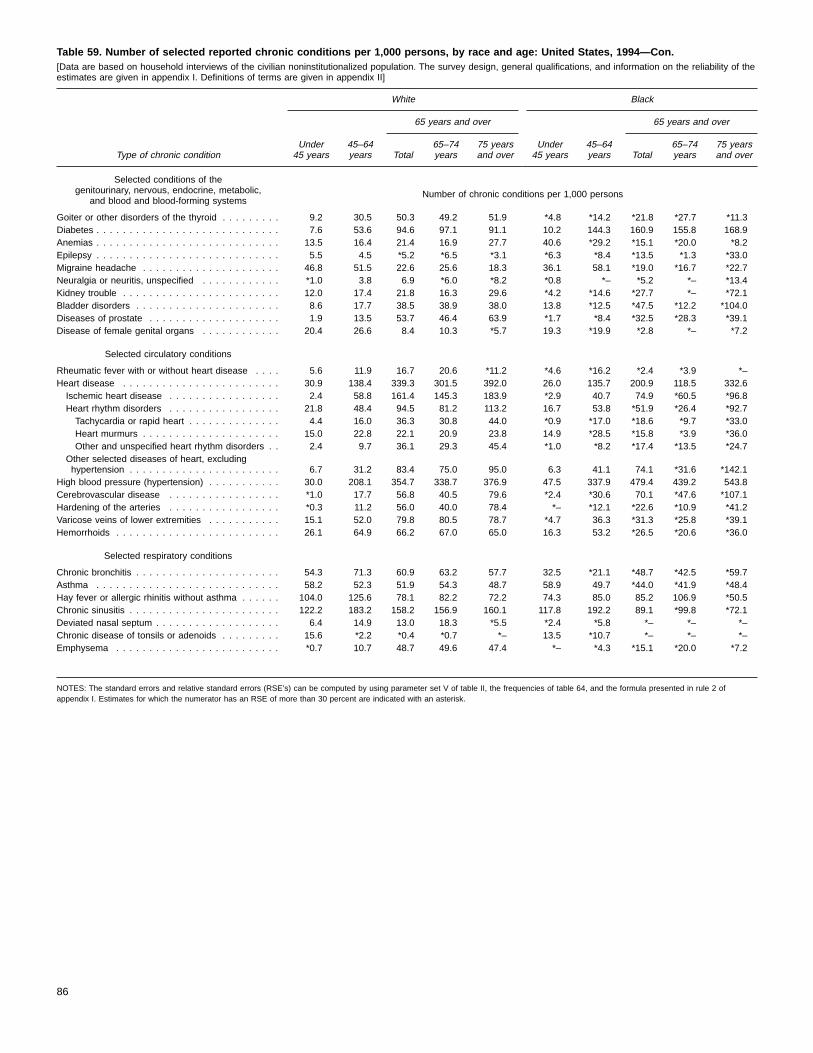
Table 59. Number of selected reported chronic conditions per 1,000 persons, by race and age: United States, 1994—Con.[Data are based on household interviews of the civilian noninstitutionalized population. The survey design, general qualifications, and information on the reliability of theestimates are given in appendix I. Definitions of terms are given in appendix II]
Type of chronic condition
White Black
Under45 years
45–64years
65 years and over
Under45 years
45–64years
65 years and over
Total65–74years
75 yearsand over Total
65–74years
75 yearsand over
Selected conditions of thegenitourinary, nervous, endocrine, metabolic,
and blood and blood-forming systemsNumber of chronic conditions per 1,000 persons
Goiter or other disorders of the thyroid . . . . . . . . . 9.2 30.5 50.3 49.2 51.9 *4.8 *14.2 *21.8 *27.7 *11.3Diabetes . . . . . . . . . . . . . . . . . . . . . . . . . . . . 7.6 53.6 94.6 97.1 91.1 10.2 144.3 160.9 155.8 168.9Anemias . . . . . . . . . . . . . . . . . . . . . . . . . . . . 13.5 16.4 21.4 16.9 27.7 40.6 *29.2 *15.1 *20.0 *8.2Epilepsy . . . . . . . . . . . . . . . . . . . . . . . . . . . . 5.5 4.5 *5.2 *6.5 *3.1 *6.3 *8.4 *13.5 *1.3 *33.0Migraine headache . . . . . . . . . . . . . . . . . . . . . 46.8 51.5 22.6 25.6 18.3 36.1 58.1 *19.0 *16.7 *22.7Neuralgia or neuritis, unspecified . . . . . . . . . . . . *1.0 3.8 6.9 *6.0 *8.2 *0.8 *– *5.2 *– *13.4Kidney trouble . . . . . . . . . . . . . . . . . . . . . . . . 12.0 17.4 21.8 16.3 29.6 *4.2 *14.6 *27.7 *– *72.1Bladder disorders . . . . . . . . . . . . . . . . . . . . . . 8.6 17.7 38.5 38.9 38.0 13.8 *12.5 *47.5 *12.2 *104.0Diseases of prostate . . . . . . . . . . . . . . . . . . . . 1.9 13.5 53.7 46.4 63.9 *1.7 *8.4 *32.5 *28.3 *39.1Disease of female genital organs . . . . . . . . . . . . 20.4 26.6 8.4 10.3 *5.7 19.3 *19.9 *2.8 *– *7.2
Selected circulatory conditions
Rheumatic fever with or without heart disease . . . . 5.6 11.9 16.7 20.6 *11.2 *4.6 *16.2 *2.4 *3.9 *–Heart disease . . . . . . . . . . . . . . . . . . . . . . . . 30.9 138.4 339.3 301.5 392.0 26.0 135.7 200.9 118.5 332.6Ischemic heart disease . . . . . . . . . . . . . . . . . 2.4 58.8 161.4 145.3 183.9 *2.9 40.7 74.9 *60.5 *96.8Heart rhythm disorders . . . . . . . . . . . . . . . . . 21.8 48.4 94.5 81.2 113.2 16.7 53.8 *51.9 *26.4 *92.7Tachycardia or rapid heart . . . . . . . . . . . . . . 4.4 16.0 36.3 30.8 44.0 *0.9 *17.0 *18.6 *9.7 *33.0Heart murmurs . . . . . . . . . . . . . . . . . . . . . 15.0 22.8 22.1 20.9 23.8 14.9 *28.5 *15.8 *3.9 *36.0Other and unspecified heart rhythm disorders . . 2.4 9.7 36.1 29.3 45.4 *1.0 *8.2 *17.4 *13.5 *24.7
Other selected diseases of heart, excludinghypertension . . . . . . . . . . . . . . . . . . . . . . . 6.7 31.2 83.4 75.0 95.0 6.3 41.1 74.1 *31.6 *142.1
High blood pressure (hypertension) . . . . . . . . . . . 30.0 208.1 354.7 338.7 376.9 47.5 337.9 479.4 439.2 543.8Cerebrovascular disease . . . . . . . . . . . . . . . . . *1.0 17.7 56.8 40.5 79.6 *2.4 *30.6 70.1 *47.6 *107.1Hardening of the arteries . . . . . . . . . . . . . . . . . *0.3 11.2 56.0 40.0 78.4 *– *12.1 *22.6 *10.9 *41.2Varicose veins of lower extremities . . . . . . . . . . . 15.1 52.0 79.8 80.5 78.7 *4.7 36.3 *31.3 *25.8 *39.1Hemorrhoids . . . . . . . . . . . . . . . . . . . . . . . . . 26.1 64.9 66.2 67.0 65.0 16.3 53.2 *26.5 *20.6 *36.0
Selected respiratory conditions
Chronic bronchitis . . . . . . . . . . . . . . . . . . . . . . 54.3 71.3 60.9 63.2 57.7 32.5 *21.1 *48.7 *42.5 *59.7Asthma . . . . . . . . . . . . . . . . . . . . . . . . . . . . 58.2 52.3 51.9 54.3 48.7 58.9 49.7 *44.0 *41.9 *48.4Hay fever or allergic rhinitis without asthma . . . . . . 104.0 125.6 78.1 82.2 72.2 74.3 85.0 85.2 106.9 *50.5Chronic sinusitis . . . . . . . . . . . . . . . . . . . . . . . 122.2 183.2 158.2 156.9 160.1 117.8 192.2 89.1 *99.8 *72.1Deviated nasal septum . . . . . . . . . . . . . . . . . . . 6.4 14.9 13.0 18.3 *5.5 *2.4 *5.8 *– *– *–Chronic disease of tonsils or adenoids . . . . . . . . . 15.6 *2.2 *0.4 *0.7 *– 13.5 *10.7 *– *– *–Emphysema . . . . . . . . . . . . . . . . . . . . . . . . . *0.7 10.7 48.7 49.6 47.4 *– *4.3 *15.1 *20.0 *7.2
NOTES: The standard errors and relative standard errors (RSE’s) can be computed by using parameter set V of table II, the frequencies of table 64, and the formula presented in rule 2 ofappendix I. Estimates for which the numerator has an RSE of more than 30 percent are indicated with an asterisk.
86
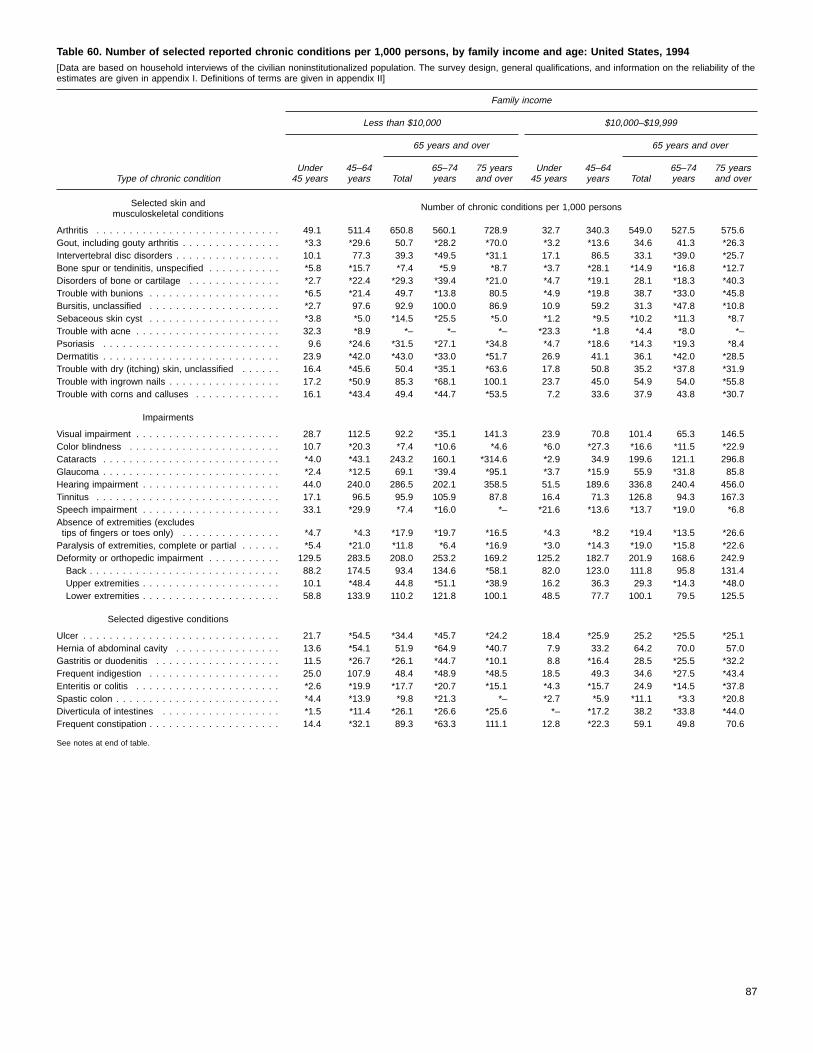
Table 60. Number of selected reported chronic conditions per 1,000 persons, by family income and age: United States, 1994[Data are based on household interviews of the civilian noninstitutionalized population. The survey design, general qualifications, and information on the reliability of theestimates are given in appendix I. Definitions of terms are given in appendix II]
Type of chronic condition
Family income
Less than $10,000 $10,000–$19,999
Under45 years
45–64years
65 years and over
Under45 years
45–64years
65 years and over
Total65–74years
75 yearsand over Total
65–74years
75 yearsand over
Selected skin andmusculoskeletal conditions
Number of chronic conditions per 1,000 persons
Arthritis . . . . . . . . . . . . . . . . . . . . . . . . . . . . 49.1 511.4 650.8 560.1 728.9 32.7 340.3 549.0 527.5 575.6Gout, including gouty arthritis . . . . . . . . . . . . . . . *3.3 *29.6 50.7 *28.2 *70.0 *3.2 *13.6 34.6 41.3 *26.3Intervertebral disc disorders . . . . . . . . . . . . . . . . 10.1 77.3 39.3 *49.5 *31.1 17.1 86.5 33.1 *39.0 *25.7Bone spur or tendinitis, unspecified . . . . . . . . . . . *5.8 *15.7 *7.4 *5.9 *8.7 *3.7 *28.1 *14.9 *16.8 *12.7Disorders of bone or cartilage . . . . . . . . . . . . . . *2.7 *22.4 *29.3 *39.4 *21.0 *4.7 *19.1 28.1 *18.3 *40.3Trouble with bunions . . . . . . . . . . . . . . . . . . . . *6.5 *21.4 49.7 *13.8 80.5 *4.9 *19.8 38.7 *33.0 *45.8Bursitis, unclassified . . . . . . . . . . . . . . . . . . . . *2.7 97.6 92.9 100.0 86.9 10.9 59.2 31.3 *47.8 *10.8Sebaceous skin cyst . . . . . . . . . . . . . . . . . . . . *3.8 *5.0 *14.5 *25.5 *5.0 *1.2 *9.5 *10.2 *11.3 *8.7Trouble with acne . . . . . . . . . . . . . . . . . . . . . . 32.3 *8.9 *– *– *– *23.3 *1.8 *4.4 *8.0 *–Psoriasis . . . . . . . . . . . . . . . . . . . . . . . . . . . 9.6 *24.6 *31.5 *27.1 *34.8 *4.7 *18.6 *14.3 *19.3 *8.4Dermatitis . . . . . . . . . . . . . . . . . . . . . . . . . . . 23.9 *42.0 *43.0 *33.0 *51.7 26.9 41.1 36.1 *42.0 *28.5Trouble with dry (itching) skin, unclassified . . . . . . 16.4 *45.6 50.4 *35.1 *63.6 17.8 50.8 35.2 *37.8 *31.9Trouble with ingrown nails . . . . . . . . . . . . . . . . . 17.2 *50.9 85.3 *68.1 100.1 23.7 45.0 54.9 54.0 *55.8Trouble with corns and calluses . . . . . . . . . . . . . 16.1 *43.4 49.4 *44.7 *53.5 7.2 33.6 37.9 43.8 *30.7
Impairments
Visual impairment . . . . . . . . . . . . . . . . . . . . . . 28.7 112.5 92.2 *35.1 141.3 23.9 70.8 101.4 65.3 146.5Color blindness . . . . . . . . . . . . . . . . . . . . . . . 10.7 *20.3 *7.4 *10.6 *4.6 *6.0 *27.3 *16.6 *11.5 *22.9Cataracts . . . . . . . . . . . . . . . . . . . . . . . . . . . *4.0 *43.1 243.2 160.1 *314.6 *2.9 34.9 199.6 121.1 296.8Glaucoma . . . . . . . . . . . . . . . . . . . . . . . . . . . *2.4 *12.5 69.1 *39.4 *95.1 *3.7 *15.9 55.9 *31.8 85.8Hearing impairment . . . . . . . . . . . . . . . . . . . . . 44.0 240.0 286.5 202.1 358.5 51.5 189.6 336.8 240.4 456.0Tinnitus . . . . . . . . . . . . . . . . . . . . . . . . . . . . 17.1 96.5 95.9 105.9 87.8 16.4 71.3 126.8 94.3 167.3Speech impairment . . . . . . . . . . . . . . . . . . . . . 33.1 *29.9 *7.4 *16.0 *– *21.6 *13.6 *13.7 *19.0 *6.8Absence of extremities (excludestips of fingers or toes only) . . . . . . . . . . . . . . . *4.7 *4.3 *17.9 *19.7 *16.5 *4.3 *8.2 *19.4 *13.5 *26.6Paralysis of extremities, complete or partial . . . . . . *5.4 *21.0 *11.8 *6.4 *16.9 *3.0 *14.3 *19.0 *15.8 *22.6Deformity or orthopedic impairment . . . . . . . . . . . 129.5 283.5 208.0 253.2 169.2 125.2 182.7 201.9 168.6 242.9Back . . . . . . . . . . . . . . . . . . . . . . . . . . . . . 88.2 174.5 93.4 134.6 *58.1 82.0 123.0 111.8 95.8 131.4Upper extremities . . . . . . . . . . . . . . . . . . . . . 10.1 *48.4 44.8 *51.1 *38.9 16.2 36.3 29.3 *14.3 *48.0Lower extremities . . . . . . . . . . . . . . . . . . . . . 58.8 133.9 110.2 121.8 100.1 48.5 77.7 100.1 79.5 125.5
Selected digestive conditions
Ulcer . . . . . . . . . . . . . . . . . . . . . . . . . . . . . . 21.7 *54.5 *34.4 *45.7 *24.2 18.4 *25.9 25.2 *25.5 *25.1Hernia of abdominal cavity . . . . . . . . . . . . . . . . 13.6 *54.1 51.9 *64.9 *40.7 7.9 33.2 64.2 70.0 57.0Gastritis or duodenitis . . . . . . . . . . . . . . . . . . . 11.5 *26.7 *26.1 *44.7 *10.1 8.8 *16.4 28.5 *25.5 *32.2Frequent indigestion . . . . . . . . . . . . . . . . . . . . 25.0 107.9 48.4 *48.9 *48.5 18.5 49.3 34.6 *27.5 *43.4Enteritis or colitis . . . . . . . . . . . . . . . . . . . . . . *2.6 *19.9 *17.7 *20.7 *15.1 *4.3 *15.7 24.9 *14.5 *37.8Spastic colon . . . . . . . . . . . . . . . . . . . . . . . . . *4.4 *13.9 *9.8 *21.3 *– *2.7 *5.9 *11.1 *3.3 *20.8Diverticula of intestines . . . . . . . . . . . . . . . . . . *1.5 *11.4 *26.1 *26.6 *25.6 *– *17.2 38.2 *33.8 *44.0Frequent constipation . . . . . . . . . . . . . . . . . . . . 14.4 *32.1 89.3 *63.3 111.1 12.8 *22.3 59.1 49.8 70.6
See notes at end of table.
87

Table 60. Number of selected reported chronic conditions per 1,000 persons, by family income and age: United States, 1994—Con.[Data are based on household interviews of the civilian noninstitutionalized population. The survey design, general qualifications, and information on the reliability of theestimates are given in appendix I. Definitions of terms are given in appendix II]
Type of chronic condition
Family income
Less than $10,000 $10,000–$19,999
Under45 years
45–64years
65 years and over
Under45 years
45–64years
65 years and over
Total65–74years
75 yearsand over Total
65–74years
75 yearsand over
Selected conditions of thegenitourinary, nervous, endocrine, metabolic,
and blood and blood-forming systemsNumber of chronic conditions per 1,000 persons
Goiter or other disorders of the thyroid . . . . . . . . . *8.4 *31.0 60.5 *73.4 *49.4 *4.1 49.5 54.5 53.5 55.8Diabetes . . . . . . . . . . . . . . . . . . . . . . . . . . . . *7.0 144.6 134.3 128.7 138.5 13.5 95.8 111.8 111.3 112.1Anemias . . . . . . . . . . . . . . . . . . . . . . . . . . . . 45.6 *20.7 *17.0 *15.4 *18.3 26.4 *26.1 23.5 *27.3 *18.9Epilepsy . . . . . . . . . . . . . . . . . . . . . . . . . . . . *5.7 *8.2 *7.6 *– *14.2 11.4 *13.8 *7.2 *6.5 *8.1Migraine headache . . . . . . . . . . . . . . . . . . . . . 68.2 68.0 *30.5 *27.7 *32.9 43.8 64.0 23.9 *28.0 *18.9Neuralgia or neuritis, unspecified . . . . . . . . . . . . *2.7 *10.0 *18.4 *12.8 *23.3 *0.7 *2.3 *9.3 *12.3 *5.6Kidney trouble . . . . . . . . . . . . . . . . . . . . . . . . 17.3 *33.8 *31.5 *20.2 *41.2 19.0 38.1 53.4 *37.5 72.8Bladder disorders . . . . . . . . . . . . . . . . . . . . . . 13.6 *39.5 64.2 *27.7 95.1 14.4 *20.7 42.2 46.8 *36.6Diseases of prostate . . . . . . . . . . . . . . . . . . . . *– *15.0 *12.0 *4.8 *17.8 *2.4 *14.5 55.2 50.5 61.0Disease of female genital organs . . . . . . . . . . . . 26.9 *36.0 *5.9 *5.3 *6.4 20.5 35.4 *6.0 *6.0 *5.9
Selected circulatory conditions
Rheumatic fever with or without heart disease . . . . *2.7 *26.7 *12.8 *13.3 *12.3 *5.3 *10.4 *20.1 *33.0 *4.0Heart disease . . . . . . . . . . . . . . . . . . . . . . . . 50.2 312.0 476.5 463.8 487.0 38.6 161.9 307.4 315.2 298.0Ischemic heart disease . . . . . . . . . . . . . . . . . *3.4 104.3 217.4 217.0 218.1 *1.7 78.3 150.0 152.1 147.5Heart rhythm disorders . . . . . . . . . . . . . . . . . 39.7 116.5 136.7 133.0 139.9 30.0 42.9 79.2 72.0 87.7Tachycardia or rapid heart . . . . . . . . . . . . . . *7.4 57.0 57.3 *61.2 *54.0 *4.9 *12.7 29.8 *20.0 *41.8Heart murmurs . . . . . . . . . . . . . . . . . . . . . 28.1 *46.3 *24.8 *28.7 *21.5 21.1 *11.8 *14.1 *9.3 *20.1Other and unspecified heart rhythm disorders . . *4.2 *13.2 54.6 *43.1 *64.5 *3.9 *18.6 35.2 42.8 *25.7
Other selected diseases of heart, excludinghypertension . . . . . . . . . . . . . . . . . . . . . . . *7.1 91.2 122.4 114.4 128.9 6.9 40.8 78.3 91.0 62.6
High blood pressure (hypertension) . . . . . . . . . . . 40.1 373.6 524.7 555.9 497.9 35.3 219.5 351.6 344.7 360.3Cerebrovascular disease . . . . . . . . . . . . . . . . . *2.3 77.3 86.8 *74.5 97.4 *1.5 *22.7 70.0 51.0 93.6Hardening of the arteries . . . . . . . . . . . . . . . . . *– *17.1 85.1 *61.7 105.2 *– *20.0 49.5 *38.3 63.5Varicose veins of lower extremities . . . . . . . . . . . 11.7 86.5 96.6 89.4 102.9 20.7 80.1 91.1 96.3 84.3Hemorrhoids . . . . . . . . . . . . . . . . . . . . . . . . . 16.4 83.0 81.1 *76.6 84.6 26.4 84.4 70.6 79.3 59.5
Selected respiratory conditions
Chronic bronchitis . . . . . . . . . . . . . . . . . . . . . . 62.8 89.4 75.7 *70.7 80.0 40.8 63.8 60.5 67.3 52.0Asthma . . . . . . . . . . . . . . . . . . . . . . . . . . . . 84.0 80.8 56.8 *47.3 *64.9 59.6 62.6 43.9 41.5 *46.8Hay fever or allergic rhinitis without asthma . . . . . . 76.1 100.1 81.9 92.0 73.2 83.7 90.3 61.6 67.3 54.5Chronic sinusitis . . . . . . . . . . . . . . . . . . . . . . . 105.8 182.7 175.3 175.0 175.6 113.3 172.8 175.5 164.3 189.3Deviated nasal septum . . . . . . . . . . . . . . . . . . . *4.2 *6.4 *8.9 *12.8 *5.5 *3.4 *15.7 *10.0 *18.0 *–Chronic disease of tonsils or adenoids . . . . . . . . . 24.7 *7.1 *– *– *– 12.6 *3.9 *– *– *–Emphysema . . . . . . . . . . . . . . . . . . . . . . . . . *0.8 *53.4 49.2 *70.7 *31.1 *0.5 *12.3 51.2 68.8 *29.4
See notes at end of table.
88

Table 60. Number of selected reported chronic conditions per 1,000 persons, by family income and age: United States, 1994—Con.[Data are based on household interviews of the civilian noninstitutionalized population. The survey design, general qualifications, and information on the reliability of theestimates are given in appendix I. Definitions of terms are given in appendix II]
Type of chronic condition
Family income
$20,000–$34,999 $35,000 or more
Under45 years
45–64years
65 years and over
Under45 years
45–64years
65 years and over
Total65–74years
75 yearsand over Total
65–74years
75 yearsand over
Selected skin andmusculoskeletal conditions
Number of chronic conditions per 1,000 persons
Arthritis . . . . . . . . . . . . . . . . . . . . . . . . . . . . 44.0 257.3 508.7 513.6 498.7 24.1 183.2 415.9 410.7 428.0Gout, including gouty arthritis . . . . . . . . . . . . . . . *2.2 24.3 54.4 50.1 *62.3 *1.2 16.7 35.4 *31.1 *45.2Intervertebral disc disorders . . . . . . . . . . . . . . . . 17.1 50.3 37.7 46.3 *20.9 12.3 43.9 *26.4 *23.9 *32.3Bone spur or tendinitis, unspecified . . . . . . . . . . . 5.3 18.1 *20.5 *22.5 *16.6 6.9 23.8 *28.9 *31.4 *23.2Disorders of bone or cartilage . . . . . . . . . . . . . . *2.4 *5.2 *17.5 *26.5 *– 3.2 7.9 *9.1 *7.8 *11.6Trouble with bunions . . . . . . . . . . . . . . . . . . . . 8.4 23.9 *20.6 *19.6 *22.7 6.4 19.7 45.8 52.0 *31.6Bursitis, unclassified . . . . . . . . . . . . . . . . . . . . 11.5 33.8 60.4 66.1 *49.3 11.7 39.7 *30.9 *29.7 *32.9Sebaceous skin cyst . . . . . . . . . . . . . . . . . . . . 4.2 *5.3 *8.2 *7.0 *10.5 6.2 *3.4 *10.9 *12.2 *7.1Trouble with acne . . . . . . . . . . . . . . . . . . . . . . 28.7 *6.2 *1.5 *2.2 *– 31.6 *4.1 *8.2 *6.9 *10.3Psoriasis . . . . . . . . . . . . . . . . . . . . . . . . . . . 6.5 *15.6 *8.8 *10.1 *6.1 8.6 13.5 *11.7 *16.7 *–Dermatitis . . . . . . . . . . . . . . . . . . . . . . . . . . . 34.3 32.0 40.9 *32.4 *57.5 48.4 31.4 *24.5 *27.2 *18.1Trouble with dry (itching) skin, unclassified . . . . . . 23.2 32.7 41.7 47.7 *30.1 20.2 32.9 31.5 *23.9 *49.1Trouble with ingrown nails . . . . . . . . . . . . . . . . . 21.0 25.3 56.7 60.5 *49.3 14.1 27.1 41.6 *40.6 *43.9Trouble with corns and calluses . . . . . . . . . . . . . 12.4 19.1 49.1 53.3 *41.0 8.6 30.1 *27.4 *15.0 *56.8
Impairments
Visual impairment . . . . . . . . . . . . . . . . . . . . . . 26.0 47.4 78.9 60.5 114.6 18.2 32.6 80.8 64.2 119.4Color blindness . . . . . . . . . . . . . . . . . . . . . . . 10.4 18.6 *16.6 *25.2 *– 10.1 20.9 *28.9 *34.5 *16.1Cataracts . . . . . . . . . . . . . . . . . . . . . . . . . . . *1.6 26.2 166.0 117.8 259.4 2.9 8.4 135.0 103.9 207.2Glaucoma . . . . . . . . . . . . . . . . . . . . . . . . . . . *2.6 *9.2 59.6 40.0 97.6 *1.4 11.4 53.0 *29.2 107.8Hearing impairment . . . . . . . . . . . . . . . . . . . . . 40.6 129.2 318.6 281.3 391.0 33.5 124.9 273.7 219.8 399.0Tinnitus . . . . . . . . . . . . . . . . . . . . . . . . . . . . 9.3 47.4 102.2 108.8 88.9 10.1 41.2 73.4 80.3 *57.5Speech impairment . . . . . . . . . . . . . . . . . . . . . 8.6 *15.3 *11.0 *13.9 *5.2 9.7 *4.0 *11.1 *7.8 *18.7Absence of extremities (excludestips of fingers or toes only) . . . . . . . . . . . . . . . *2.7 *16.4 *13.6 *12.6 *15.7 *2.0 *5.6 *28.7 *25.8 *35.5Paralysis of extremities, complete or partial . . . . . . *3.5 19.0 *15.9 *12.1 *23.1 *1.7 *3.3 *15.7 *12.8 *22.6Deformity or orthopedic impairment . . . . . . . . . . . 94.0 196.7 164.8 156.7 180.5 98.2 144.9 146.9 126.4 195.0Back . . . . . . . . . . . . . . . . . . . . . . . . . . . . . 63.2 124.6 102.1 108.2 90.2 61.5 77.0 74.2 60.9 105.9Upper extremities . . . . . . . . . . . . . . . . . . . . . 11.1 27.8 26.0 *13.0 *51.0 10.5 21.8 31.9 *23.3 *51.0Lower extremities . . . . . . . . . . . . . . . . . . . . . 32.2 81.1 67.5 57.6 86.7 36.7 58.2 63.5 57.0 *78.8
Selected digestive conditions
Ulcer . . . . . . . . . . . . . . . . . . . . . . . . . . . . . . 12.3 33.4 39.3 38.0 *41.4 9.5 17.0 *2.7 *3.9 *–Hernia of abdominal cavity . . . . . . . . . . . . . . . . 6.7 35.8 90.3 94.2 83.3 4.3 29.0 58.1 49.7 *78.1Gastritis or duodenitis . . . . . . . . . . . . . . . . . . . 12.0 25.1 43.6 *28.1 73.7 8.8 15.5 *28.7 *31.4 *22.6Frequent indigestion . . . . . . . . . . . . . . . . . . . . 25.8 49.1 78.8 72.6 90.7 18.6 29.2 32.6 *30.6 *37.4Enteritis or colitis . . . . . . . . . . . . . . . . . . . . . . 7.6 *9.4 *9.5 *11.0 *6.5 5.3 14.7 *11.1 *15.8 *–Spastic colon . . . . . . . . . . . . . . . . . . . . . . . . . 5.8 *11.4 *19.0 *14.8 *27.0 7.0 12.4 *23.9 *27.8 *14.8Diverticula of intestines . . . . . . . . . . . . . . . . . . *1.3 19.7 37.4 42.7 *27.0 *1.8 18.3 36.1 *25.0 *61.3Frequent constipation . . . . . . . . . . . . . . . . . . . . 10.6 *13.2 28.3 *24.1 *37.1 7.6 8.2 44.1 *19.2 *102.0
See notes at end of table.
89

Table 60. Number of selected reported chronic conditions per 1,000 persons, by family income and age: United States, 1994—Con.[Data are based on household interviews of the civilian noninstitutionalized population. The survey design, general qualifications, and information on the reliability of theestimates are given in appendix I. Definitions of terms are given in appendix II]
Type of chronic condition
Family income
$20,000–$34,999 $35,000 or more
Under45 years
45–64years
65 years and over
Under45 years
45–64years
65 years and over
Total65–74years
75 yearsand over Total
65–74years
75 yearsand over
Selected conditions of thegenitourinary, nervous, endocrine, metabolic,
and blood and blood-forming systemsNumber of chronic conditions per 1,000 persons
Goiter or other disorders of the thyroid . . . . . . . . . 9.6 26.4 42.0 36.9 *51.4 10.3 33.6 47.2 53.3 *33.6Diabetes . . . . . . . . . . . . . . . . . . . . . . . . . . . . 6.6 57.8 87.5 99.2 *65.0 6.7 47.2 80.2 72.0 *98.8Anemias . . . . . . . . . . . . . . . . . . . . . . . . . . . . 13.4 *12.4 *17.9 *7.2 *38.8 10.9 19.3 *29.3 *25.0 *38.7Epilepsy . . . . . . . . . . . . . . . . . . . . . . . . . . . . 5.5 *3.2 *1.8 *– *5.2 3.5 *3.0 *11.7 *16.7 *–Migraine headache . . . . . . . . . . . . . . . . . . . . . 47.2 50.3 *20.6 *28.6 *5.2 41.6 50.7 *29.7 *28.1 *17.4Neuralgia or neuritis, unspecified . . . . . . . . . . . . *0.9 *– *5.0 *4.9 *5.2 *0.4 *5.2 *5.1 *3.9 *8.4Kidney trouble . . . . . . . . . . . . . . . . . . . . . . . . 8.3 *16.7 *6.7 *4.7 *10.0 8.5 11.4 *8.2 *8.6 *7.7Bladder disorders . . . . . . . . . . . . . . . . . . . . . . 12.9 *16.3 30.3 *30.6 *29.6 5.5 16.2 35.0 *43.3 *15.5Diseases of prostate . . . . . . . . . . . . . . . . . . . . *1.4 *3.5 48.1 37.1 69.7 *2.0 18.5 109.4 99.2 132.3Disease of female genital organs . . . . . . . . . . . . 19.6 20.0 *7.0 *10.6 *– 20.2 29.4 *6.8 *6.1 *8.4
Selected circulatory conditions
Rheumatic fever with or without heart disease . . . . 4.8 19.8 29.8 *26.8 *35.7 6.5 9.8 *12.4 *14.4 *7.1Heart disease . . . . . . . . . . . . . . . . . . . . . . . . 25.4 198.4 349.1 246.0 548.8 29.3 100.0 308.5 262.0 416.4Ischemic heart disease . . . . . . . . . . . . . . . . . *2.9 74.4 186.5 125.0 306.0 2.5 41.9 135.6 132.3 143.3Heart rhythm disorders . . . . . . . . . . . . . . . . . 15.2 66.0 89.3 67.0 132.5 21.2 40.7 100.6 70.3 171.1Tachycardia or rapid heart . . . . . . . . . . . . . . *3.8 27.1 34.7 *20.5 *62.3 3.6 10.0 40.0 *27.5 *69.1Heart murmurs . . . . . . . . . . . . . . . . . . . . . 10.2 31.5 30.9 *25.6 *41.4 15.4 21.7 *21.6 *19.4 *26.5Other and unspecified heart rhythm disorders . . *1.3 *7.5 23.7 *21.1 *28.8 *2.2 9.0 39.0 *23.3 *75.5
Other selected diseases of heart, excludinghypertension . . . . . . . . . . . . . . . . . . . . . . . 7.3 57.9 73.3 54.0 110.7 5.6 17.4 72.5 59.7 *102.0
High blood pressure (hypertension) . . . . . . . . . . . 32.6 239.5 371.9 315.3 481.7 31.8 209.6 326.1 337.6 299.5Cerebrovascular disease . . . . . . . . . . . . . . . . . *2.4 25.7 50.4 *30.8 88.5 *0.6 8.2 31.9 *28.9 *38.7Hardening of the arteries . . . . . . . . . . . . . . . . . *– 21.0 43.6 36.9 *56.7 *0.2 7.0 65.9 47.8 107.8Varicose veins of lower extremities . . . . . . . . . . . 17.6 42.6 74.0 71.7 78.5 11.7 45.8 47.6 48.6 *45.2Hemorrhoids . . . . . . . . . . . . . . . . . . . . . . . . . 30.1 78.5 60.8 58.5 *65.4 27.1 55.5 81.0 80.0 *83.3
Selected respiratory conditions
Chronic bronchitis . . . . . . . . . . . . . . . . . . . . . . 56.2 70.7 66.2 69.3 *60.2 51.5 62.9 52.6 49.5 *60.0Asthma . . . . . . . . . . . . . . . . . . . . . . . . . . . . 55.0 50.9 57.4 61.4 *49.7 50.9 49.4 43.1 45.3 *38.1Hay fever or allergic rhinitis without asthma . . . . . . 97.4 119.2 85.9 94.9 *68.4 122.1 145.8 100.6 92.5 119.4Chronic sinusitis . . . . . . . . . . . . . . . . . . . . . . . 135.8 197.4 147.8 166.4 111.6 121.3 177.0 125.7 140.9 *90.4Deviated nasal septum . . . . . . . . . . . . . . . . . . . 8.0 *7.3 *11.6 *15.1 *4.8 5.9 17.0 *22.3 *25.3 *14.8Chronic disease of tonsils or adenoids . . . . . . . . . 16.1 *5.4 *– *– *– 16.6 *2.4 *– *– *–Emphysema . . . . . . . . . . . . . . . . . . . . . . . . . *1.0 *6.4 43.5 38.2 *53.6 *– *6.2 41.0 *31.4 *63.9
NOTES: The standard errors and relative standard errors (RSE’s) can be computed by using parameter set V of table II, the frequencies of tables 65 and 78, and the formula presented in rule 4 ofappendix I. Estimates for which the numerator has an RSE of more than 30 percent are indicated with an asterisk.
90
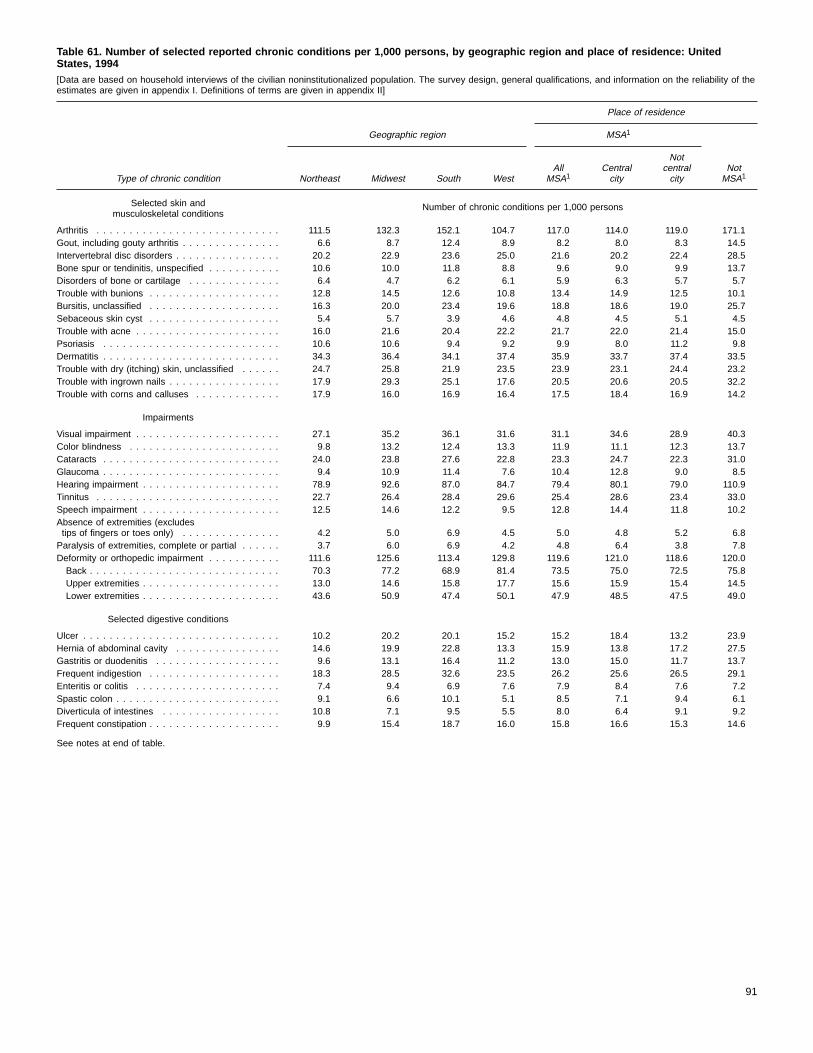
Table 61. Number of selected reported chronic conditions per 1,000 persons, by geographic region and place of residence: UnitedStates, 1994[Data are based on household interviews of the civilian noninstitutionalized population. The survey design, general qualifications, and information on the reliability of theestimates are given in appendix I. Definitions of terms are given in appendix II]
Type of chronic condition
Place of residence
Geographic region MSA1
Northeast Midwest South WestAll
MSA1Centralcity
Notcentralcity
NotMSA1
Selected skin andmusculoskeletal conditions
Number of chronic conditions per 1,000 persons
Arthritis . . . . . . . . . . . . . . . . . . . . . . . . . . . . 111.5 132.3 152.1 104.7 117.0 114.0 119.0 171.1Gout, including gouty arthritis . . . . . . . . . . . . . . . 6.6 8.7 12.4 8.9 8.2 8.0 8.3 14.5Intervertebral disc disorders . . . . . . . . . . . . . . . . 20.2 22.9 23.6 25.0 21.6 20.2 22.4 28.5Bone spur or tendinitis, unspecified . . . . . . . . . . . 10.6 10.0 11.8 8.8 9.6 9.0 9.9 13.7Disorders of bone or cartilage . . . . . . . . . . . . . . 6.4 4.7 6.2 6.1 5.9 6.3 5.7 5.7Trouble with bunions . . . . . . . . . . . . . . . . . . . . 12.8 14.5 12.6 10.8 13.4 14.9 12.5 10.1Bursitis, unclassified . . . . . . . . . . . . . . . . . . . . 16.3 20.0 23.4 19.6 18.8 18.6 19.0 25.7Sebaceous skin cyst . . . . . . . . . . . . . . . . . . . . 5.4 5.7 3.9 4.6 4.8 4.5 5.1 4.5Trouble with acne . . . . . . . . . . . . . . . . . . . . . . 16.0 21.6 20.4 22.2 21.7 22.0 21.4 15.0Psoriasis . . . . . . . . . . . . . . . . . . . . . . . . . . . 10.6 10.6 9.4 9.2 9.9 8.0 11.2 9.8Dermatitis . . . . . . . . . . . . . . . . . . . . . . . . . . . 34.3 36.4 34.1 37.4 35.9 33.7 37.4 33.5Trouble with dry (itching) skin, unclassified . . . . . . 24.7 25.8 21.9 23.5 23.9 23.1 24.4 23.2Trouble with ingrown nails . . . . . . . . . . . . . . . . . 17.9 29.3 25.1 17.6 20.5 20.6 20.5 32.2Trouble with corns and calluses . . . . . . . . . . . . . 17.9 16.0 16.9 16.4 17.5 18.4 16.9 14.2
Impairments
Visual impairment . . . . . . . . . . . . . . . . . . . . . . 27.1 35.2 36.1 31.6 31.1 34.6 28.9 40.3Color blindness . . . . . . . . . . . . . . . . . . . . . . . 9.8 13.2 12.4 13.3 11.9 11.1 12.3 13.7Cataracts . . . . . . . . . . . . . . . . . . . . . . . . . . . 24.0 23.8 27.6 22.8 23.3 24.7 22.3 31.0Glaucoma . . . . . . . . . . . . . . . . . . . . . . . . . . . 9.4 10.9 11.4 7.6 10.4 12.8 9.0 8.5Hearing impairment . . . . . . . . . . . . . . . . . . . . . 78.9 92.6 87.0 84.7 79.4 80.1 79.0 110.9Tinnitus . . . . . . . . . . . . . . . . . . . . . . . . . . . . 22.7 26.4 28.4 29.6 25.4 28.6 23.4 33.0Speech impairment . . . . . . . . . . . . . . . . . . . . . 12.5 14.6 12.2 9.5 12.8 14.4 11.8 10.2Absence of extremities (excludestips of fingers or toes only) . . . . . . . . . . . . . . . 4.2 5.0 6.9 4.5 5.0 4.8 5.2 6.8Paralysis of extremities, complete or partial . . . . . . 3.7 6.0 6.9 4.2 4.8 6.4 3.8 7.8Deformity or orthopedic impairment . . . . . . . . . . . 111.6 125.6 113.4 129.8 119.6 121.0 118.6 120.0Back . . . . . . . . . . . . . . . . . . . . . . . . . . . . . 70.3 77.2 68.9 81.4 73.5 75.0 72.5 75.8Upper extremities . . . . . . . . . . . . . . . . . . . . . 13.0 14.6 15.8 17.7 15.6 15.9 15.4 14.5Lower extremities . . . . . . . . . . . . . . . . . . . . . 43.6 50.9 47.4 50.1 47.9 48.5 47.5 49.0
Selected digestive conditions
Ulcer . . . . . . . . . . . . . . . . . . . . . . . . . . . . . . 10.2 20.2 20.1 15.2 15.2 18.4 13.2 23.9Hernia of abdominal cavity . . . . . . . . . . . . . . . . 14.6 19.9 22.8 13.3 15.9 13.8 17.2 27.5Gastritis or duodenitis . . . . . . . . . . . . . . . . . . . 9.6 13.1 16.4 11.2 13.0 15.0 11.7 13.7Frequent indigestion . . . . . . . . . . . . . . . . . . . . 18.3 28.5 32.6 23.5 26.2 25.6 26.5 29.1Enteritis or colitis . . . . . . . . . . . . . . . . . . . . . . 7.4 9.4 6.9 7.6 7.9 8.4 7.6 7.2Spastic colon . . . . . . . . . . . . . . . . . . . . . . . . . 9.1 6.6 10.1 5.1 8.5 7.1 9.4 6.1Diverticula of intestines . . . . . . . . . . . . . . . . . . 10.8 7.1 9.5 5.5 8.0 6.4 9.1 9.2Frequent constipation . . . . . . . . . . . . . . . . . . . . 9.9 15.4 18.7 16.0 15.8 16.6 15.3 14.6
See notes at end of table.
91

Table 61. Number of selected reported chronic conditions per 1,000 persons, by geographic region and place of residence: UnitedStates, 1994—Con.[Data are based on household interviews of the civilian noninstitutionalized population. The survey design, general qualifications, and information on the reliability of theestimates are given in appendix I. Definitions of terms are given in appendix II]
Type of chronic condition
Place of residence
Geographic region MSA1
Northeast Midwest South WestAll
MSA1Centralcity
Notcentralcity
NotMSA1
Selected conditions of thegenitourinary, nervous, endocrine, metabolic,
and blood and blood-forming systemsNumber of chronic conditions per 1,000 persons
Goiter or other disorders of the thyroid . . . . . . . . . 19.0 17.9 16.1 17.3 16.5 15.7 17.0 20.5Diabetes . . . . . . . . . . . . . . . . . . . . . . . . . . . . 31.1 30.6 34.3 21.4 26.7 28.1 25.8 41.4Anemias . . . . . . . . . . . . . . . . . . . . . . . . . . . . 20.1 20.2 16.4 16.0 18.3 21.2 16.4 16.9Epilepsy . . . . . . . . . . . . . . . . . . . . . . . . . . . . 4.9 5.6 6.2 4.4 5.1 5.9 4.5 6.5Migraine headache . . . . . . . . . . . . . . . . . . . . . 37.4 47.7 43.6 43.4 41.2 37.6 43.6 51.0Neuralgia or neuritis, unspecified . . . . . . . . . . . . *1.7 2.5 2.4 *1.9 2.3 2.1 2.4 *1.9Kidney trouble . . . . . . . . . . . . . . . . . . . . . . . . 9.2 13.3 16.2 13.6 11.8 12.6 11.3 19.7Bladder disorders . . . . . . . . . . . . . . . . . . . . . . 10.7 10.8 17.4 17.2 14.3 14.6 14.1 15.0Diseases of prostate . . . . . . . . . . . . . . . . . . . . 8.8 8.7 11.8 10.5 9.4 10.3 8.8 13.0Diseases of female genital organs . . . . . . . . . . . . 19.4 23.6 18.4 16.6 19.7 18.1 20.7 18.7
Selected circulatory conditions
Rheumatic fever with or without heart disease . . . . 6.4 8.6 9.0 6.9 8.2 7.1 8.9 7.1Heart disease . . . . . . . . . . . . . . . . . . . . . . . . 80.4 85.9 94.4 77.4 77.2 73.8 79.4 116.8Ischemic heart disease . . . . . . . . . . . . . . . . . 30.0 32.5 31.6 28.6 26.4 23.6 28.2 46.7Heart rhythm disorders . . . . . . . . . . . . . . . . . 32.1 32.2 39.7 30.8 32.1 31.0 32.8 42.7Tachycardia or rapid heart . . . . . . . . . . . . . . 8.5 6.8 14.0 7.4 8.1 6.2 9.3 15.6Heart murmurs . . . . . . . . . . . . . . . . . . . . . 17.2 16.5 18.0 16.9 17.2 17.8 16.8 17.4Other and unspecified heart rhythm disorders . . 6.4 8.9 7.6 6.5 6.8 7.0 6.7 9.6
Other selected diseases of heart, excludinghypertension . . . . . . . . . . . . . . . . . . . . . . . 18.3 21.2 23.1 18.0 18.7 19.1 18.4 27.5
High blood pressure (hypertension) . . . . . . . . . . . 102.7 112.9 120.5 91.5 102.1 102.6 101.8 132.5Cerebrovascular disease . . . . . . . . . . . . . . . . . 8.7 12.4 13.1 10.4 10.7 12.5 9.5 14.4Hardening of the arteries . . . . . . . . . . . . . . . . . 8.1 9.5 8.6 8.1 8.4 6.6 9.5 9.4Varicose veins of lower extremities . . . . . . . . . . . 25.0 31.8 24.1 32.3 26.5 22.3 29.1 33.3Hemorrhoids . . . . . . . . . . . . . . . . . . . . . . . . . 30.3 40.6 37.2 33.7 33.5 30.9 35.1 44.6
Selected respiratory conditions
Chronic bronchitis . . . . . . . . . . . . . . . . . . . . . . 49.6 59.1 51.2 56.5 51.7 49.0 53.4 62.2Asthma . . . . . . . . . . . . . . . . . . . . . . . . . . . . 59.2 52.2 55.0 59.4 56.5 62.2 52.8 54.6Hay fever or allergic rhinitis without asthma . . . . . . 90.2 85.2 106.3 118.3 103.5 108.2 100.5 90.6Chronic sinusitis . . . . . . . . . . . . . . . . . . . . . . . 87.2 156.4 171.8 94.7 127.2 121.2 131.1 160.3Deviated nasal septum . . . . . . . . . . . . . . . . . . . 11.7 4.9 5.8 10.7 8.1 8.6 7.7 6.9Chronic disease of tonsils or adenoids . . . . . . . . . 11.9 9.2 12.8 10.7 10.9 9.7 11.6 12.6Emphysema . . . . . . . . . . . . . . . . . . . . . . . . . 7.0 10.8 7.3 6.0 6.5 7.5 5.9 12.5
1MSA is metropolitan statistical area.
NOTES: The standard errors and relative standard errors (RSE’s) can be computed by using parameter set V of table II, the frequencies of tables 66 and 78, and the formula presented in rule 4 ofappendix I. Estimates for which the numerator has an RSE of more than 30 percent are indicated with an asterisk.
92
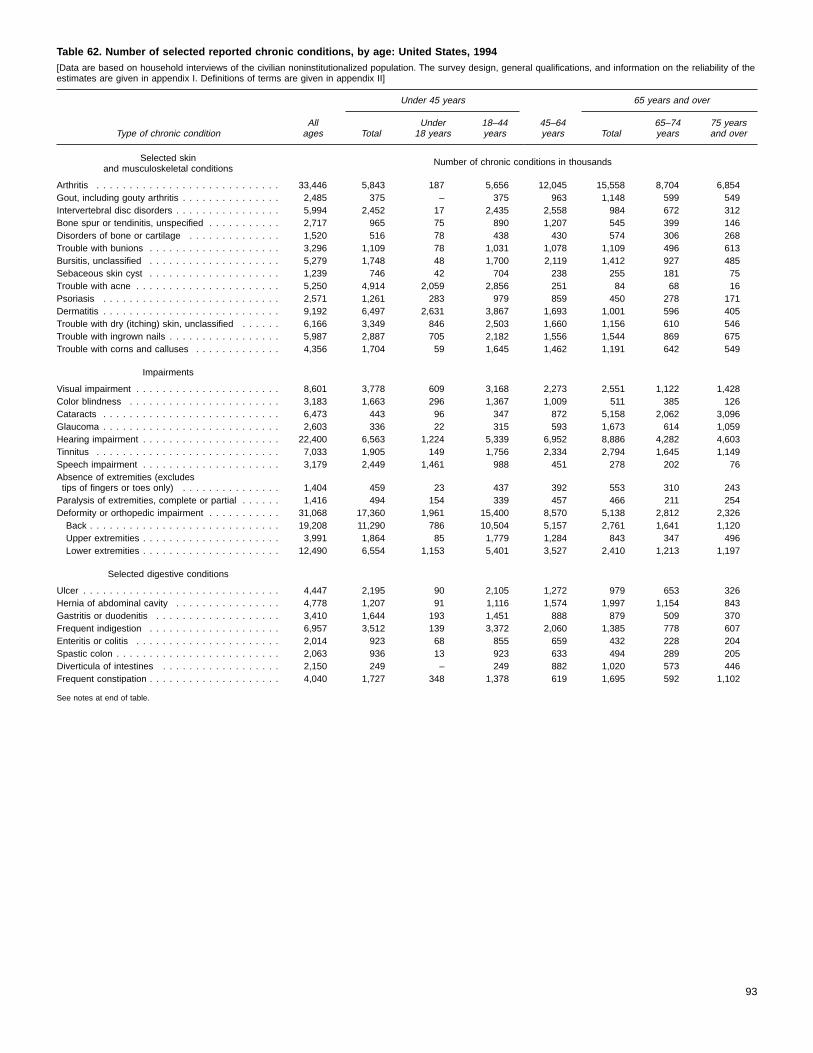
Table 62. Number of selected reported chronic conditions, by age: United States, 1994[Data are based on household interviews of the civilian noninstitutionalized population. The survey design, general qualifications, and information on the reliability of theestimates are given in appendix I. Definitions of terms are given in appendix II]
Type of chronic conditionAllages
Under 45 years
45–64years
65 years and over
TotalUnder
18 years18–44years Total
65–74years
75 yearsand over
Selected skinand musculoskeletal conditions
Number of chronic conditions in thousands
Arthritis . . . . . . . . . . . . . . . . . . . . . . . . . . . . 33,446 5,843 187 5,656 12,045 15,558 8,704 6,854Gout, including gouty arthritis . . . . . . . . . . . . . . . 2,485 375 – 375 963 1,148 599 549Intervertebral disc disorders . . . . . . . . . . . . . . . . 5,994 2,452 17 2,435 2,558 984 672 312Bone spur or tendinitis, unspecified . . . . . . . . . . . 2,717 965 75 890 1,207 545 399 146Disorders of bone or cartilage . . . . . . . . . . . . . . 1,520 516 78 438 430 574 306 268Trouble with bunions . . . . . . . . . . . . . . . . . . . . 3,296 1,109 78 1,031 1,078 1,109 496 613Bursitis, unclassified . . . . . . . . . . . . . . . . . . . . 5,279 1,748 48 1,700 2,119 1,412 927 485Sebaceous skin cyst . . . . . . . . . . . . . . . . . . . . 1,239 746 42 704 238 255 181 75Trouble with acne . . . . . . . . . . . . . . . . . . . . . . 5,250 4,914 2,059 2,856 251 84 68 16Psoriasis . . . . . . . . . . . . . . . . . . . . . . . . . . . 2,571 1,261 283 979 859 450 278 171Dermatitis . . . . . . . . . . . . . . . . . . . . . . . . . . . 9,192 6,497 2,631 3,867 1,693 1,001 596 405Trouble with dry (itching) skin, unclassified . . . . . . 6,166 3,349 846 2,503 1,660 1,156 610 546Trouble with ingrown nails . . . . . . . . . . . . . . . . . 5,987 2,887 705 2,182 1,556 1,544 869 675Trouble with corns and calluses . . . . . . . . . . . . . 4,356 1,704 59 1,645 1,462 1,191 642 549
Impairments
Visual impairment . . . . . . . . . . . . . . . . . . . . . . 8,601 3,778 609 3,168 2,273 2,551 1,122 1,428Color blindness . . . . . . . . . . . . . . . . . . . . . . . 3,183 1,663 296 1,367 1,009 511 385 126Cataracts . . . . . . . . . . . . . . . . . . . . . . . . . . . 6,473 443 96 347 872 5,158 2,062 3,096Glaucoma . . . . . . . . . . . . . . . . . . . . . . . . . . . 2,603 336 22 315 593 1,673 614 1,059Hearing impairment . . . . . . . . . . . . . . . . . . . . . 22,400 6,563 1,224 5,339 6,952 8,886 4,282 4,603Tinnitus . . . . . . . . . . . . . . . . . . . . . . . . . . . . 7,033 1,905 149 1,756 2,334 2,794 1,645 1,149Speech impairment . . . . . . . . . . . . . . . . . . . . . 3,179 2,449 1,461 988 451 278 202 76Absence of extremities (excludestips of fingers or toes only) . . . . . . . . . . . . . . . 1,404 459 23 437 392 553 310 243Paralysis of extremities, complete or partial . . . . . . 1,416 494 154 339 457 466 211 254Deformity or orthopedic impairment . . . . . . . . . . . 31,068 17,360 1,961 15,400 8,570 5,138 2,812 2,326Back . . . . . . . . . . . . . . . . . . . . . . . . . . . . . 19,208 11,290 786 10,504 5,157 2,761 1,641 1,120Upper extremities . . . . . . . . . . . . . . . . . . . . . 3,991 1,864 85 1,779 1,284 843 347 496Lower extremities . . . . . . . . . . . . . . . . . . . . . 12,490 6,554 1,153 5,401 3,527 2,410 1,213 1,197
Selected digestive conditions
Ulcer . . . . . . . . . . . . . . . . . . . . . . . . . . . . . . 4,447 2,195 90 2,105 1,272 979 653 326Hernia of abdominal cavity . . . . . . . . . . . . . . . . 4,778 1,207 91 1,116 1,574 1,997 1,154 843Gastritis or duodenitis . . . . . . . . . . . . . . . . . . . 3,410 1,644 193 1,451 888 879 509 370Frequent indigestion . . . . . . . . . . . . . . . . . . . . 6,957 3,512 139 3,372 2,060 1,385 778 607Enteritis or colitis . . . . . . . . . . . . . . . . . . . . . . 2,014 923 68 855 659 432 228 204Spastic colon . . . . . . . . . . . . . . . . . . . . . . . . . 2,063 936 13 923 633 494 289 205Diverticula of intestines . . . . . . . . . . . . . . . . . . 2,150 249 – 249 882 1,020 573 446Frequent constipation . . . . . . . . . . . . . . . . . . . . 4,040 1,727 348 1,378 619 1,695 592 1,102
See notes at end of table.
93

Table 62. Number of selected reported chronic conditions, by age: United States, 1994—Con.[Data are based on household interviews of the civilian noninstitutionalized population. The survey design, general qualifications, and information on the reliability of theestimates are given in appendix I. Definitions of terms are given in appendix II]
Type of chronic conditionAllages
Under 45 years
45–64years
65 years and over
TotalUnder18 years
18–44years Total
65–74years
75 yearsand over
Selected conditions of thegenitourinary, nervous, endocrine, metabolic,
and blood and blood-forming systemsNumber of chronic conditions in thousands
Goiter or other disorders of the thyroid . . . . . . . . . 4,509 1,512 14 1,498 1,506 1,491 865 626Diabetes . . . . . . . . . . . . . . . . . . . . . . . . . . . . 7,766 1,443 97 1,346 3,182 3,141 1,855 1,287Anemias . . . . . . . . . . . . . . . . . . . . . . . . . . . . 4,664 3,143 854 2,288 889 633 305 328Epilepsy . . . . . . . . . . . . . . . . . . . . . . . . . . . . 1,396 983 331 652 236 177 108 69Migraine headache . . . . . . . . . . . . . . . . . . . . . 11,256 7,933 1,127 6,807 2,647 675 442 233Neuralgia or neuritis, unspecified . . . . . . . . . . . . 566 162 – 162 189 215 108 107Kidney trouble . . . . . . . . . . . . . . . . . . . . . . . . 3,512 1,949 238 1,712 867 696 268 428Bladder disorders . . . . . . . . . . . . . . . . . . . . . . 3,747 1,664 311 1,353 852 1,231 660 571Diseases of prostate . . . . . . . . . . . . . . . . . . . . 2,641 316 – 316 689 1,636 858 777Diseases of female genital organs . . . . . . . . . . . . 5,052 3,480 249 3,231 1,332 240 166 73
Selected circulatory conditions
Rheumatic fever with or without heart disease . . . . 2,066 944 95 849 623 499 340 159Heart disease . . . . . . . . . . . . . . . . . . . . . . . . 22,279 5,362 1,265 4,097 6,838 10,080 5,133 4,946Ischemic heart disease . . . . . . . . . . . . . . . . . 8,004 451 10 440 2,842 4,711 2,446 2,265Heart rhythm disorders . . . . . . . . . . . . . . . . . 8,934 3,774 976 2,798 2,401 2,759 1,359 1,399Tachycardia or rapid heart . . . . . . . . . . . . . . 2,529 698 95 603 776 1,055 514 541Heart murmurs . . . . . . . . . . . . . . . . . . . . . 4,472 2,676 844 1,832 1,142 654 345 309Other and unspecified heart rhythm disorders . . 1,933 400 37 363 483 1,050 501 549
Other selected diseases of heart, excludinghypertension . . . . . . . . . . . . . . . . . . . . . . . 5,342 1,138 279 859 1,595 2,610 1,328 1,282
High blood pressure (hypertension) . . . . . . . . . . . 28,236 5,737 189 5,549 11,206 11,293 6,338 4,955Cerebrovascular disease . . . . . . . . . . . . . . . . . 2,978 279 60 219 919 1,780 743 1,037Hardening of the arteries . . . . . . . . . . . . . . . . . 2,239 39 – 39 559 1,641 694 947Varicose veins of lower extremities . . . . . . . . . . . 7,260 2,398 – 2,398 2,545 2,317 1,369 948Hemorrhoids . . . . . . . . . . . . . . . . . . . . . . . . . 9,321 4,280 25 4,255 3,128 1,914 1,126 787
Selected respiratory conditions
Chronic bronchitis . . . . . . . . . . . . . . . . . . . . . . 14,021 8,920 3,873 5,047 3,223 1,878 1,138 739Asthma . . . . . . . . . . . . . . . . . . . . . . . . . . . . 14,562 10,435 4,837 5,598 2,561 1,566 956 610Hay fever or allergic rhinitis without asthma . . . . . . 26,146 17,575 4,236 13,339 6,089 2,481 1,581 900Chronic sinusitis . . . . . . . . . . . . . . . . . . . . . . . 34,902 21,147 4,562 16,586 9,067 4,687 2,739 1,948Deviated nasal septum . . . . . . . . . . . . . . . . . . . 2,028 993 56 938 674 360 296 64Chronic disease of tonsils or adenoids . . . . . . . . . 2,925 2,762 1,615 1,148 150 12 12 –Emphysema . . . . . . . . . . . . . . . . . . . . . . . . . 2,028 117 – 117 497 1,413 859 554
NOTES: The standard errors and relative standard errors (RSE’s) can be computed by using parameter set V of table II and the formula presented in rule 1 of appendix I. An estimate of 1.5million has a 10-percent RSE; of 357,000, a 20-percent RSE; and of 159,000, a 30-percent RSE.
94
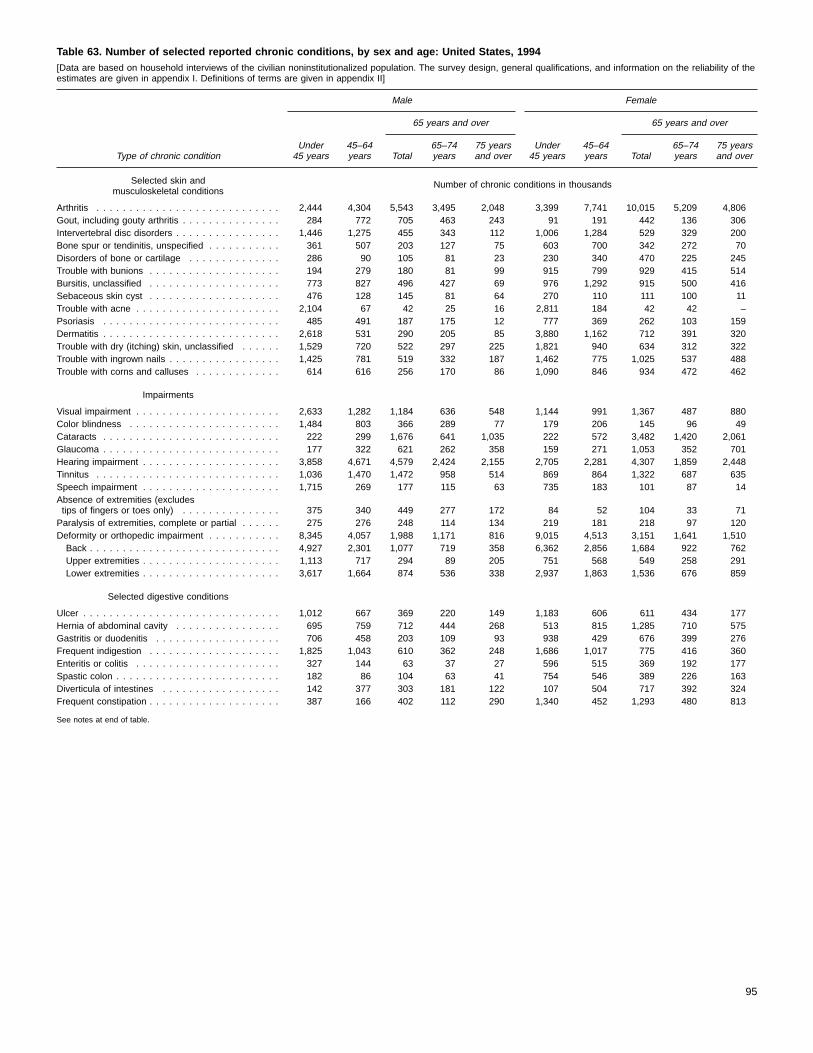
Table 63. Number of selected reported chronic conditions, by sex and age: United States, 1994[Data are based on household interviews of the civilian noninstitutionalized population. The survey design, general qualifications, and information on the reliability of theestimates are given in appendix I. Definitions of terms are given in appendix II]
Type of chronic condition
Male Female
Under45 years
45–64years
65 years and over 65 years and over
Total65–74years
75 yearsand over
Under45 years
45–64years Total
65–74years
75 yearsand over
Selected skin andmusculoskeletal conditions
Number of chronic conditions in thousands
Arthritis . . . . . . . . . . . . . . . . . . . . . . . . . . . . 2,444 4,304 5,543 3,495 2,048 3,399 7,741 10,015 5,209 4,806Gout, including gouty arthritis . . . . . . . . . . . . . . . 284 772 705 463 243 91 191 442 136 306Intervertebral disc disorders . . . . . . . . . . . . . . . . 1,446 1,275 455 343 112 1,006 1,284 529 329 200Bone spur or tendinitis, unspecified . . . . . . . . . . . 361 507 203 127 75 603 700 342 272 70Disorders of bone or cartilage . . . . . . . . . . . . . . 286 90 105 81 23 230 340 470 225 245Trouble with bunions . . . . . . . . . . . . . . . . . . . . 194 279 180 81 99 915 799 929 415 514Bursitis, unclassified . . . . . . . . . . . . . . . . . . . . 773 827 496 427 69 976 1,292 915 500 416Sebaceous skin cyst . . . . . . . . . . . . . . . . . . . . 476 128 145 81 64 270 110 111 100 11Trouble with acne . . . . . . . . . . . . . . . . . . . . . . 2,104 67 42 25 16 2,811 184 42 42 –Psoriasis . . . . . . . . . . . . . . . . . . . . . . . . . . . 485 491 187 175 12 777 369 262 103 159Dermatitis . . . . . . . . . . . . . . . . . . . . . . . . . . . 2,618 531 290 205 85 3,880 1,162 712 391 320Trouble with dry (itching) skin, unclassified . . . . . . 1,529 720 522 297 225 1,821 940 634 312 322Trouble with ingrown nails . . . . . . . . . . . . . . . . . 1,425 781 519 332 187 1,462 775 1,025 537 488Trouble with corns and calluses . . . . . . . . . . . . . 614 616 256 170 86 1,090 846 934 472 462
Impairments
Visual impairment . . . . . . . . . . . . . . . . . . . . . . 2,633 1,282 1,184 636 548 1,144 991 1,367 487 880Color blindness . . . . . . . . . . . . . . . . . . . . . . . 1,484 803 366 289 77 179 206 145 96 49Cataracts . . . . . . . . . . . . . . . . . . . . . . . . . . . 222 299 1,676 641 1,035 222 572 3,482 1,420 2,061Glaucoma . . . . . . . . . . . . . . . . . . . . . . . . . . . 177 322 621 262 358 159 271 1,053 352 701Hearing impairment . . . . . . . . . . . . . . . . . . . . . 3,858 4,671 4,579 2,424 2,155 2,705 2,281 4,307 1,859 2,448Tinnitus . . . . . . . . . . . . . . . . . . . . . . . . . . . . 1,036 1,470 1,472 958 514 869 864 1,322 687 635Speech impairment . . . . . . . . . . . . . . . . . . . . . 1,715 269 177 115 63 735 183 101 87 14Absence of extremities (excludestips of fingers or toes only) . . . . . . . . . . . . . . . 375 340 449 277 172 84 52 104 33 71Paralysis of extremities, complete or partial . . . . . . 275 276 248 114 134 219 181 218 97 120Deformity or orthopedic impairment . . . . . . . . . . . 8,345 4,057 1,988 1,171 816 9,015 4,513 3,151 1,641 1,510Back . . . . . . . . . . . . . . . . . . . . . . . . . . . . . 4,927 2,301 1,077 719 358 6,362 2,856 1,684 922 762Upper extremities . . . . . . . . . . . . . . . . . . . . . 1,113 717 294 89 205 751 568 549 258 291Lower extremities . . . . . . . . . . . . . . . . . . . . . 3,617 1,664 874 536 338 2,937 1,863 1,536 676 859
Selected digestive conditions
Ulcer . . . . . . . . . . . . . . . . . . . . . . . . . . . . . . 1,012 667 369 220 149 1,183 606 611 434 177Hernia of abdominal cavity . . . . . . . . . . . . . . . . 695 759 712 444 268 513 815 1,285 710 575Gastritis or duodenitis . . . . . . . . . . . . . . . . . . . 706 458 203 109 93 938 429 676 399 276Frequent indigestion . . . . . . . . . . . . . . . . . . . . 1,825 1,043 610 362 248 1,686 1,017 775 416 360Enteritis or colitis . . . . . . . . . . . . . . . . . . . . . . 327 144 63 37 27 596 515 369 192 177Spastic colon . . . . . . . . . . . . . . . . . . . . . . . . . 182 86 104 63 41 754 546 389 226 163Diverticula of intestines . . . . . . . . . . . . . . . . . . 142 377 303 181 122 107 504 717 392 324Frequent constipation . . . . . . . . . . . . . . . . . . . . 387 166 402 112 290 1,340 452 1,293 480 813
See notes at end of table.
95

Table 63. Number of selected reported chronic conditions, by sex and age: United States, 1994—Con.[Data are based on household interviews of the civilian noninstitutionalized population. The survey design, general qualifications, and information on the reliability of theestimates are given in appendix I. Definitions of terms are given in appendix II]
Type of chronic condition
Male Female
Under45 years
45–64years
65 years and over 65 years and over
Total65–74years
75 yearsand over
Under45 years
45–64years Total
65–74years
75 yearsand over
Selected conditions of thegenitourinary, nervous, endocrine, metabolic,
and blood and blood-forming systemsNumber of chronic conditions in thousands
Goiter or other disorders of the thyroid . . . . . . . . . 215 190 284 106 178 1,297 1,316 1,206 759 447Diabetes . . . . . . . . . . . . . . . . . . . . . . . . . . . . 651 1,541 1,388 831 557 792 1,641 1,754 1,024 730Anemias . . . . . . . . . . . . . . . . . . . . . . . . . . . . 533 110 148 59 89 2,610 779 485 246 239Epilepsy . . . . . . . . . . . . . . . . . . . . . . . . . . . . 511 136 104 45 58 472 100 73 63 10Migraine headache . . . . . . . . . . . . . . . . . . . . . 1,962 590 164 139 25 5,972 2,057 511 303 208Neuralgia or neuritis, unspecified . . . . . . . . . . . . 18 49 95 36 59 145 140 120 72 48Kidney trouble . . . . . . . . . . . . . . . . . . . . . . . . 469 396 300 131 169 1,481 470 396 137 259Bladder disorders . . . . . . . . . . . . . . . . . . . . . . 252 131 288 125 163 1,412 721 943 535 408Diseases of prostate . . . . . . . . . . . . . . . . . . . . 316 689 1,636 858 777 . . . . . . . . . . . . . . .Diseases of female genital organs . . . . . . . . . . . . . . . . . . . . . . . . . . . 3,480 1,332 240 166 73
Selected circulatory conditions
Rheumatic fever with or without heart disease . . . . 256 206 140 101 38 687 417 359 239 121Heart disease . . . . . . . . . . . . . . . . . . . . . . . . 2,413 3,944 4,662 2,590 2,072 2,949 2,894 5,418 2,544 2,874Ischemic heart disease . . . . . . . . . . . . . . . . . 336 1,994 2,480 1,488 992 115 847 2,231 958 1,273Heart rhythm disorders . . . . . . . . . . . . . . . . . 1,473 1,018 1,019 517 502 2,300 1,384 1,740 843 897Tachycardia or rapid heart . . . . . . . . . . . . . . 271 350 354 220 134 427 426 701 294 407Heart murmurs . . . . . . . . . . . . . . . . . . . . . 1,028 385 197 124 72 1,648 757 457 221 237Other and unspecified heart rhythm disorders . . 174 283 469 173 296 225 201 581 328 253
Other selected diseases of heart, excludinghypertension . . . . . . . . . . . . . . . . . . . . . . . 604 932 1,162 585 577 534 663 1,448 743 705
High blood pressure (hypertension) . . . . . . . . . . . 2,850 5,356 4,132 2,496 1,635 2,887 5,851 7,161 3,841 3,320Cerebrovascular disease . . . . . . . . . . . . . . . . . 114 496 687 321 366 165 423 1,094 422 671Hardening of the arteries . . . . . . . . . . . . . . . . . 39 340 893 383 510 – 219 748 311 438Varicose veins of lower extremities . . . . . . . . . . . 329 434 547 264 282 2,069 2,110 1,771 1,105 666Hemorrhoids . . . . . . . . . . . . . . . . . . . . . . . . . 1,701 1,672 736 414 321 2,579 1,455 1,178 712 466
Selected respiratory conditions
Chronic bronchitis . . . . . . . . . . . . . . . . . . . . . . 3,892 1,066 666 338 328 5,028 2,156 1,212 801 411Asthma . . . . . . . . . . . . . . . . . . . . . . . . . . . . 5,097 787 658 319 339 5,338 1,773 908 637 271Hay fever or allergic rhinitis without asthma . . . . . . 8,744 2,613 919 646 273 8,831 3,477 1,562 935 627Chronic sinusitis . . . . . . . . . . . . . . . . . . . . . . . 9,094 3,591 1,507 959 549 12,053 5,477 3,180 1,780 1,400Deviated nasal septum . . . . . . . . . . . . . . . . . . . 387 353 211 181 30 606 321 149 115 34Chronic disease of tonsils or adenoids . . . . . . . . . 1,045 40 – – – 1,717 110 12 12 –Emphysema . . . . . . . . . . . . . . . . . . . . . . . . . 104 250 878 486 392 13 248 535 372 162
NOTES: The standard errors and relative standard errors (RSE’s) can be computed by using parameter set V of table II and the formula presented in rule 1 of appendix I. An estimate of 1.5million has a 10-percent RSE; of 357,000, a 20-percent RSE; and of 159,000, a 30-percent RSE.
96

Table 64. Number of selected reported chronic conditions, by race and age: United States, 1994[Data are based on household interviews of the civilian noninstitutionalized population. The survey design, general qualifications, and information on the reliability of theestimates are given in appendix I. Definitions of terms are given in appendix II]
Type of chronic condition
White Black
Under45 years
45–64years
65 years and over 65 years and over
Total65–74years
75 yearsand over
Under45 years
45–64years Total
65–74years
75 yearsand over
Selected skin andmusculoskeletal conditions
Number of chronic conditions in thousands1
Arthritis . . . . . . . . . . . . . . . . . . . . . . . . . . . . 4,852 10,355 13,920 7,798 6,122 723 1,318 1,389 756 633Gout, including gouty arthritis . . . . . . . . . . . . . . . 288 775 971 545 426 75 141 140 54 86Intervertebral disc disorders . . . . . . . . . . . . . . . . 2,279 2,335 882 570 312 68 130 61 61 –Bone spur or tendinitis, unspecified . . . . . . . . . . . 925 1,112 537 399 138 40 58 8 – 8Disorders of bone or cartilage . . . . . . . . . . . . . . 470 430 574 306 268 46 – – – –Trouble with bunions . . . . . . . . . . . . . . . . . . . . 881 952 1,068 473 595 210 126 27 22 4Bursitis, unclassified . . . . . . . . . . . . . . . . . . . . 1,652 1,699 1,224 796 428 79 343 143 87 56Sebaceous skin cyst . . . . . . . . . . . . . . . . . . . . 655 233 236 161 75 57 5 20 20 –Trouble with acne . . . . . . . . . . . . . . . . . . . . . . 4,046 209 84 68 16 547 43 – – –Psoriasis . . . . . . . . . . . . . . . . . . . . . . . . . . . 1,207 802 405 266 139 30 57 45 12 32Dermatitis . . . . . . . . . . . . . . . . . . . . . . . . . . . 5,589 1,478 963 576 387 544 167 25 7 18Trouble with dry (itching) skin, unclassified . . . . . . 2,782 1,420 1,060 519 540 364 164 97 91 6Trouble with ingrown nails . . . . . . . . . . . . . . . . . 2,579 1,386 1,382 753 629 195 130 144 98 46Trouble with corns and calluses . . . . . . . . . . . . . 1,357 1,204 1,012 521 491 304 232 178 120 58
Impairments
Visual impairment . . . . . . . . . . . . . . . . . . . . . . 3,004 1,898 2,274 1,054 1,219 595 295 221 68 153Color blindness . . . . . . . . . . . . . . . . . . . . . . . 1,398 869 506 380 126 118 113 5 5 –Cataracts . . . . . . . . . . . . . . . . . . . . . . . . . . . 401 739 4,590 1,839 2,751 42 86 457 178 280Glaucoma . . . . . . . . . . . . . . . . . . . . . . . . . . . 242 467 1,339 468 871 95 108 321 146 175Hearing impairment . . . . . . . . . . . . . . . . . . . . . 5,470 6,305 8,406 4,050 4,357 753 361 411 233 178Tinnitus . . . . . . . . . . . . . . . . . . . . . . . . . . . . 1,539 2,063 2,657 1,592 1,065 227 161 112 53 58Speech impairment . . . . . . . . . . . . . . . . . . . . . 1,765 317 222 167 55 620 108 43 35 8Absence of extremities (excludestips of fingers or toes only) . . . . . . . . . . . . . . . 414 323 441 216 224 45 59 112 93 18Paralysis of extremities, complete or partial . . . . . . 363 348 400 178 222 130 57 55 33 21Deformity or orthopedic impairment . . . . . . . . . . . 14,789 7,317 4,680 2,605 2,075 1,985 954 309 140 169Back . . . . . . . . . . . . . . . . . . . . . . . . . . . . . 9,756 4,559 2,495 1,522 974 1,170 416 189 69 119Upper extremities . . . . . . . . . . . . . . . . . . . . . 1,658 1,079 802 343 460 121 113 41 4 37Lower extremities . . . . . . . . . . . . . . . . . . . . . 5,331 2,904 2,176 1,126 1,050 972 556 162 70 91
Selected digestive conditions
Ulcer . . . . . . . . . . . . . . . . . . . . . . . . . . . . . . 1,711 981 793 484 308 336 221 145 127 18Hernia of abdominal cavity . . . . . . . . . . . . . . . . 988 1,512 1,877 1,052 825 219 62 107 89 18Gastritis or duodenitis . . . . . . . . . . . . . . . . . . . 1,418 856 801 472 330 211 26 67 26 40Frequent indigestion . . . . . . . . . . . . . . . . . . . . 3,172 1,873 1,307 718 590 260 126 66 60 6Enteritis or colitis . . . . . . . . . . . . . . . . . . . . . . 776 649 432 228 204 79 9 – – –Spastic colon . . . . . . . . . . . . . . . . . . . . . . . . . 828 610 466 262 205 108 17 10 10 –Diverticula of intestines . . . . . . . . . . . . . . . . . . 240 849 1,004 557 446 – 33 16 16 –Frequent constipation . . . . . . . . . . . . . . . . . . . . 1,278 493 1,468 504 964 362 89 202 78 125
See footnote and notes at end of table.
97
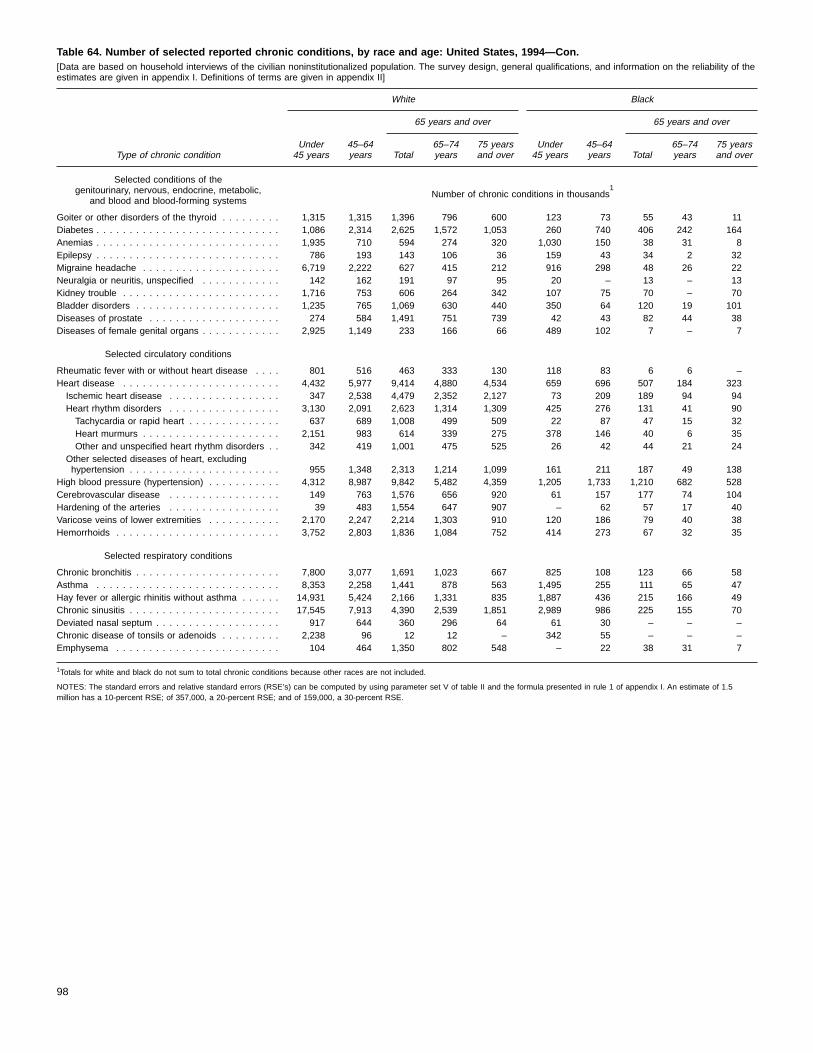
Table 64. Number of selected reported chronic conditions, by race and age: United States, 1994—Con.[Data are based on household interviews of the civilian noninstitutionalized population. The survey design, general qualifications, and information on the reliability of theestimates are given in appendix I. Definitions of terms are given in appendix II]
Type of chronic condition
White Black
Under45 years
45–64years
65 years and over 65 years and over
Total65–74years
75 yearsand over
Under45 years
45–64years Total
65–74years
75 yearsand over
Selected conditions of thegenitourinary, nervous, endocrine, metabolic,
and blood and blood-forming systemsNumber of chronic conditions in thousands
1
Goiter or other disorders of the thyroid . . . . . . . . . 1,315 1,315 1,396 796 600 123 73 55 43 11Diabetes . . . . . . . . . . . . . . . . . . . . . . . . . . . . 1,086 2,314 2,625 1,572 1,053 260 740 406 242 164Anemias . . . . . . . . . . . . . . . . . . . . . . . . . . . . 1,935 710 594 274 320 1,030 150 38 31 8Epilepsy . . . . . . . . . . . . . . . . . . . . . . . . . . . . 786 193 143 106 36 159 43 34 2 32Migraine headache . . . . . . . . . . . . . . . . . . . . . 6,719 2,222 627 415 212 916 298 48 26 22Neuralgia or neuritis, unspecified . . . . . . . . . . . . 142 162 191 97 95 20 – 13 – 13Kidney trouble . . . . . . . . . . . . . . . . . . . . . . . . 1,716 753 606 264 342 107 75 70 – 70Bladder disorders . . . . . . . . . . . . . . . . . . . . . . 1,235 765 1,069 630 440 350 64 120 19 101Diseases of prostate . . . . . . . . . . . . . . . . . . . . 274 584 1,491 751 739 42 43 82 44 38Diseases of female genital organs . . . . . . . . . . . . 2,925 1,149 233 166 66 489 102 7 – 7
Selected circulatory conditions
Rheumatic fever with or without heart disease . . . . 801 516 463 333 130 118 83 6 6 –Heart disease . . . . . . . . . . . . . . . . . . . . . . . . 4,432 5,977 9,414 4,880 4,534 659 696 507 184 323Ischemic heart disease . . . . . . . . . . . . . . . . . 347 2,538 4,479 2,352 2,127 73 209 189 94 94Heart rhythm disorders . . . . . . . . . . . . . . . . . 3,130 2,091 2,623 1,314 1,309 425 276 131 41 90Tachycardia or rapid heart . . . . . . . . . . . . . . 637 689 1,008 499 509 22 87 47 15 32Heart murmurs . . . . . . . . . . . . . . . . . . . . . 2,151 983 614 339 275 378 146 40 6 35Other and unspecified heart rhythm disorders . . 342 419 1,001 475 525 26 42 44 21 24
Other selected diseases of heart, excludinghypertension . . . . . . . . . . . . . . . . . . . . . . . 955 1,348 2,313 1,214 1,099 161 211 187 49 138
High blood pressure (hypertension) . . . . . . . . . . . 4,312 8,987 9,842 5,482 4,359 1,205 1,733 1,210 682 528Cerebrovascular disease . . . . . . . . . . . . . . . . . 149 763 1,576 656 920 61 157 177 74 104Hardening of the arteries . . . . . . . . . . . . . . . . . 39 483 1,554 647 907 – 62 57 17 40Varicose veins of lower extremities . . . . . . . . . . . 2,170 2,247 2,214 1,303 910 120 186 79 40 38Hemorrhoids . . . . . . . . . . . . . . . . . . . . . . . . . 3,752 2,803 1,836 1,084 752 414 273 67 32 35
Selected respiratory conditions
Chronic bronchitis . . . . . . . . . . . . . . . . . . . . . . 7,800 3,077 1,691 1,023 667 825 108 123 66 58Asthma . . . . . . . . . . . . . . . . . . . . . . . . . . . . 8,353 2,258 1,441 878 563 1,495 255 111 65 47Hay fever or allergic rhinitis without asthma . . . . . . 14,931 5,424 2,166 1,331 835 1,887 436 215 166 49Chronic sinusitis . . . . . . . . . . . . . . . . . . . . . . . 17,545 7,913 4,390 2,539 1,851 2,989 986 225 155 70Deviated nasal septum . . . . . . . . . . . . . . . . . . . 917 644 360 296 64 61 30 – – –Chronic disease of tonsils or adenoids . . . . . . . . . 2,238 96 12 12 – 342 55 – – –Emphysema . . . . . . . . . . . . . . . . . . . . . . . . . 104 464 1,350 802 548 – 22 38 31 7
1Totals for white and black do not sum to total chronic conditions because other races are not included.
NOTES: The standard errors and relative standard errors (RSE’s) can be computed by using parameter set V of table II and the formula presented in rule 1 of appendix I. An estimate of 1.5million has a 10-percent RSE; of 357,000, a 20-percent RSE; and of 159,000, a 30-percent RSE.
98

Table 65. Number of selected reported chronic conditions, by family income and age: United States, 1994[Data are based on household interviews of the civilian noninstitutionalized population. The survey design, general qualifications, and information on the reliability of theestimates are given in appendix I. Definitions of terms are given in appendix II]
Type of chronic condition
Family income
Less than $10,000 $10,000–$19,999
Under45 years
45–64years
65 years and over
Under45 years
45–64years
65 years and over
Total65–74years
75 yearsand over Total
65–74years
75 yearsand over
Selected skin andmusculoskeletal conditions
Number of chronic conditions in thousands1
Arthritis . . . . . . . . . . . . . . . . . . . . . . . . . . . . 810 1,436 2,647 1,053 1,594 799 1,904 3,967 2,109 1,858Gout, including gouty arthritis . . . . . . . . . . . . . . . 55 83 206 53 153 79 76 250 165 85Intervertebral disc disorders . . . . . . . . . . . . . . . . 166 217 160 93 68 419 484 239 156 83Bone spur or tendinitis, unspecified . . . . . . . . . . . 95 44 30 11 19 91 157 108 67 41Disorders of bone or cartilage . . . . . . . . . . . . . . 44 63 119 74 46 115 107 203 73 130Trouble with bunions . . . . . . . . . . . . . . . . . . . . 107 60 202 26 176 119 111 280 132 148Bursitis, unclassified . . . . . . . . . . . . . . . . . . . . 44 274 378 188 190 267 331 226 191 35Sebaceous skin cyst . . . . . . . . . . . . . . . . . . . . 63 14 59 48 11 29 53 74 45 28Trouble with acne . . . . . . . . . . . . . . . . . . . . . . 533 25 – – – 569 10 32 32 –Psoriasis . . . . . . . . . . . . . . . . . . . . . . . . . . . 159 69 128 51 76 114 104 103 77 27Dermatitis . . . . . . . . . . . . . . . . . . . . . . . . . . . 394 118 175 62 113 658 230 261 168 92Trouble with dry (itching) skin, unclassified . . . . . . 270 128 205 66 139 434 284 254 151 103Trouble with ingrown nails . . . . . . . . . . . . . . . . . 284 143 347 128 219 579 252 397 216 180Trouble with corns and calluses . . . . . . . . . . . . . 266 122 201 84 117 175 188 274 175 99
Impairments
Visual impairment . . . . . . . . . . . . . . . . . . . . . . 474 316 375 66 309 585 396 733 261 473Color blindness . . . . . . . . . . . . . . . . . . . . . . . 177 57 30 20 10 147 153 120 46 74Cataracts . . . . . . . . . . . . . . . . . . . . . . . . . . . 66 121 989 301 688 71 195 1,442 484 958Glaucoma . . . . . . . . . . . . . . . . . . . . . . . . . . . 40 35 281 74 208 90 89 404 127 277Hearing impairment . . . . . . . . . . . . . . . . . . . . . 725 674 1,165 380 784 1,259 1,061 2,434 961 1,472Tinnitus . . . . . . . . . . . . . . . . . . . . . . . . . . . . 282 271 390 199 192 402 399 916 377 540Speech impairment . . . . . . . . . . . . . . . . . . . . . 545 84 30 30 – 529 76 99 76 22Absence of extremities (excludestips of fingers or toes only) . . . . . . . . . . . . . . . 77 12 73 37 36 106 46 140 54 86Paralysis of extremities, complete or partial . . . . . . 89 59 48 12 37 74 80 137 63 73Deformity or orthopedic impairment . . . . . . . . . . . 2,136 796 846 476 370 3,060 1,022 1,459 674 784Back . . . . . . . . . . . . . . . . . . . . . . . . . . . . . 1,455 490 380 253 127 2,004 688 808 383 424Upper extremities . . . . . . . . . . . . . . . . . . . . . 167 136 182 96 85 397 203 212 57 155Lower extremities . . . . . . . . . . . . . . . . . . . . . 970 376 448 229 219 1,187 435 723 318 405
Selected digestive conditions
Ulcer . . . . . . . . . . . . . . . . . . . . . . . . . . . . . . 357 153 140 86 53 450 145 182 102 81Hernia of abdominal cavity . . . . . . . . . . . . . . . . 225 152 211 122 89 192 186 464 280 184Gastritis or duodenitis . . . . . . . . . . . . . . . . . . . 190 75 106 84 22 216 92 206 102 104Frequent indigestion . . . . . . . . . . . . . . . . . . . . 413 303 197 92 106 453 276 250 110 140Enteritis or colitis . . . . . . . . . . . . . . . . . . . . . . 43 56 72 39 33 106 88 180 58 122Spastic colon . . . . . . . . . . . . . . . . . . . . . . . . . 73 39 40 40 – 67 33 80 13 67Diverticula of intestines . . . . . . . . . . . . . . . . . . 25 32 106 50 56 – 96 276 135 142Frequent constipation . . . . . . . . . . . . . . . . . . . . 238 90 363 119 243 312 125 427 199 228
See footnote and notes at end of table.
99
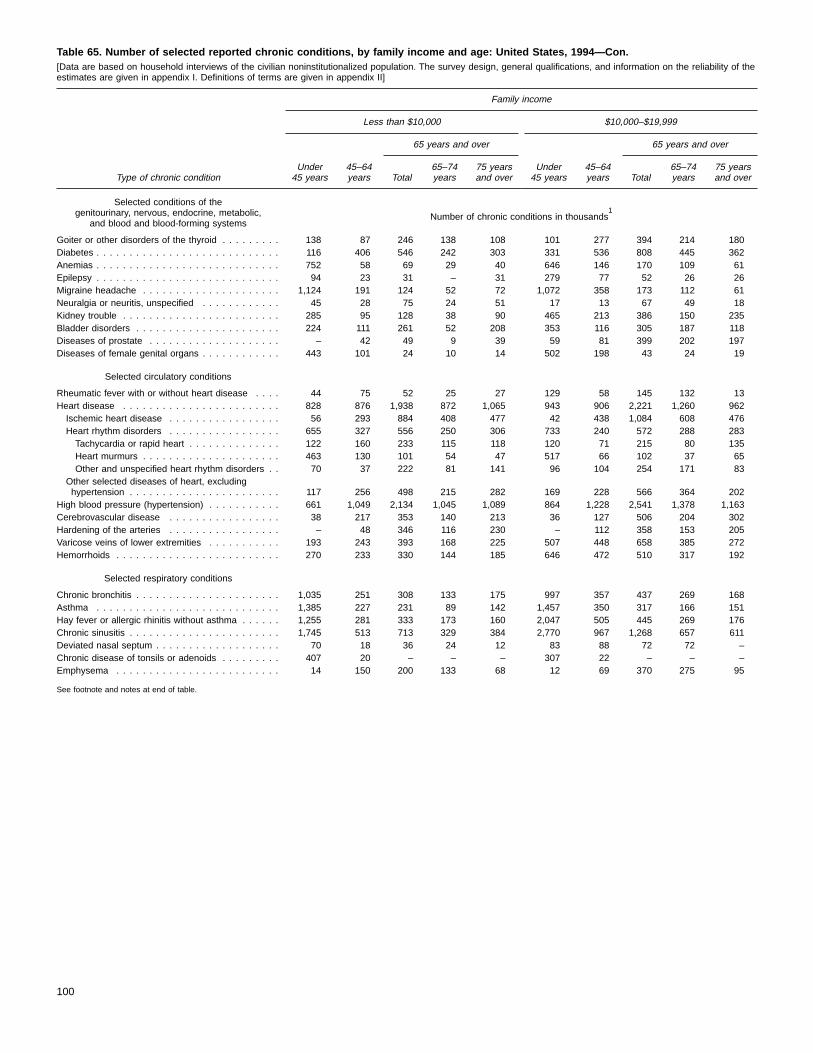
Table 65. Number of selected reported chronic conditions, by family income and age: United States, 1994—Con.[Data are based on household interviews of the civilian noninstitutionalized population. The survey design, general qualifications, and information on the reliability of theestimates are given in appendix I. Definitions of terms are given in appendix II]
Type of chronic condition
Family income
Less than $10,000 $10,000–$19,999
Under45 years
45–64years
65 years and over
Under45 years
45–64years
65 years and over
Total65–74years
75 yearsand over Total
65–74years
75 yearsand over
Selected conditions of thegenitourinary, nervous, endocrine, metabolic,
and blood and blood-forming systemsNumber of chronic conditions in thousands
1
Goiter or other disorders of the thyroid . . . . . . . . . 138 87 246 138 108 101 277 394 214 180Diabetes . . . . . . . . . . . . . . . . . . . . . . . . . . . . 116 406 546 242 303 331 536 808 445 362Anemias . . . . . . . . . . . . . . . . . . . . . . . . . . . . 752 58 69 29 40 646 146 170 109 61Epilepsy . . . . . . . . . . . . . . . . . . . . . . . . . . . . 94 23 31 – 31 279 77 52 26 26Migraine headache . . . . . . . . . . . . . . . . . . . . . 1,124 191 124 52 72 1,072 358 173 112 61Neuralgia or neuritis, unspecified . . . . . . . . . . . . 45 28 75 24 51 17 13 67 49 18Kidney trouble . . . . . . . . . . . . . . . . . . . . . . . . 285 95 128 38 90 465 213 386 150 235Bladder disorders . . . . . . . . . . . . . . . . . . . . . . 224 111 261 52 208 353 116 305 187 118Diseases of prostate . . . . . . . . . . . . . . . . . . . . – 42 49 9 39 59 81 399 202 197Diseases of female genital organs . . . . . . . . . . . . 443 101 24 10 14 502 198 43 24 19
Selected circulatory conditions
Rheumatic fever with or without heart disease . . . . 44 75 52 25 27 129 58 145 132 13Heart disease . . . . . . . . . . . . . . . . . . . . . . . . 828 876 1,938 872 1,065 943 906 2,221 1,260 962Ischemic heart disease . . . . . . . . . . . . . . . . . 56 293 884 408 477 42 438 1,084 608 476Heart rhythm disorders . . . . . . . . . . . . . . . . . 655 327 556 250 306 733 240 572 288 283Tachycardia or rapid heart . . . . . . . . . . . . . . 122 160 233 115 118 120 71 215 80 135Heart murmurs . . . . . . . . . . . . . . . . . . . . . 463 130 101 54 47 517 66 102 37 65Other and unspecified heart rhythm disorders . . 70 37 222 81 141 96 104 254 171 83
Other selected diseases of heart, excludinghypertension . . . . . . . . . . . . . . . . . . . . . . . 117 256 498 215 282 169 228 566 364 202
High blood pressure (hypertension) . . . . . . . . . . . 661 1,049 2,134 1,045 1,089 864 1,228 2,541 1,378 1,163Cerebrovascular disease . . . . . . . . . . . . . . . . . 38 217 353 140 213 36 127 506 204 302Hardening of the arteries . . . . . . . . . . . . . . . . . – 48 346 116 230 – 112 358 153 205Varicose veins of lower extremities . . . . . . . . . . . 193 243 393 168 225 507 448 658 385 272Hemorrhoids . . . . . . . . . . . . . . . . . . . . . . . . . 270 233 330 144 185 646 472 510 317 192
Selected respiratory conditions
Chronic bronchitis . . . . . . . . . . . . . . . . . . . . . . 1,035 251 308 133 175 997 357 437 269 168Asthma . . . . . . . . . . . . . . . . . . . . . . . . . . . . 1,385 227 231 89 142 1,457 350 317 166 151Hay fever or allergic rhinitis without asthma . . . . . . 1,255 281 333 173 160 2,047 505 445 269 176Chronic sinusitis . . . . . . . . . . . . . . . . . . . . . . . 1,745 513 713 329 384 2,770 967 1,268 657 611Deviated nasal septum . . . . . . . . . . . . . . . . . . . 70 18 36 24 12 83 88 72 72 –Chronic disease of tonsils or adenoids . . . . . . . . . 407 20 – – – 307 22 – – –Emphysema . . . . . . . . . . . . . . . . . . . . . . . . . 14 150 200 133 68 12 69 370 275 95
See footnote and notes at end of table.
100
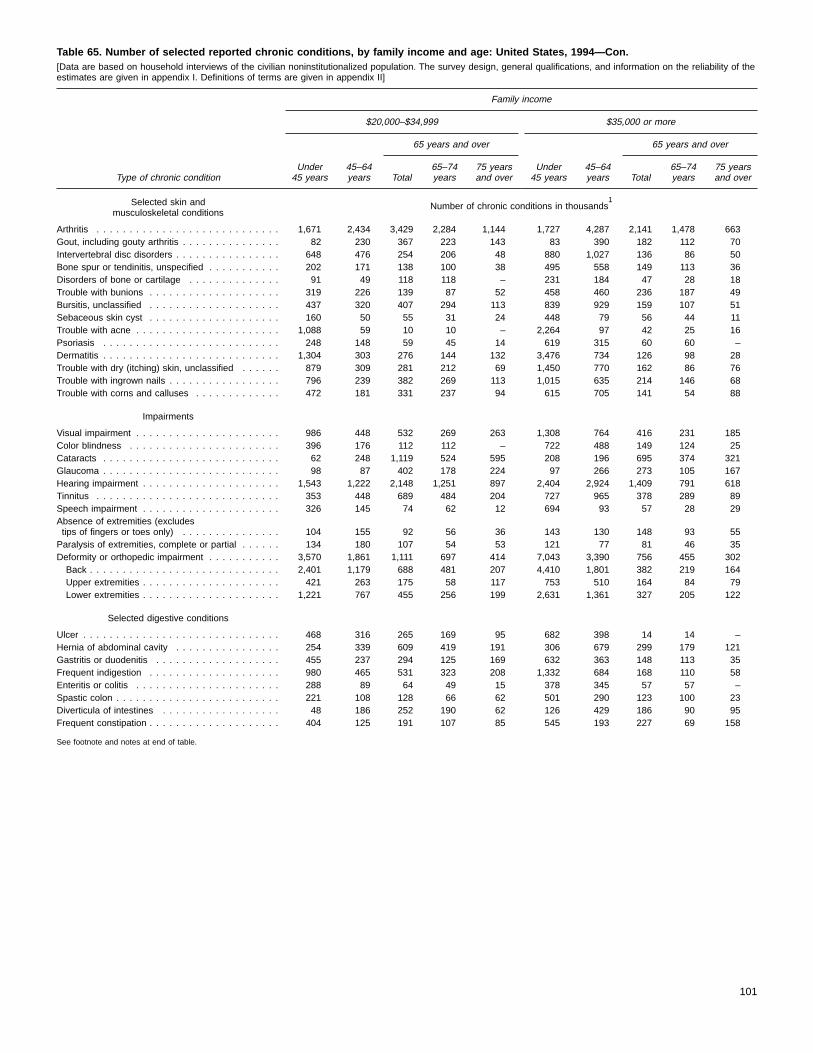
Table 65. Number of selected reported chronic conditions, by family income and age: United States, 1994—Con.[Data are based on household interviews of the civilian noninstitutionalized population. The survey design, general qualifications, and information on the reliability of theestimates are given in appendix I. Definitions of terms are given in appendix II]
Type of chronic condition
Family income
$20,000–$34,999 $35,000 or more
Under45 years
45–64years
65 years and over
Under45 years
45–64years
65 years and over
Total65–74years
75 yearsand over Total
65–74years
75 yearsand over
Selected skin andmusculoskeletal conditions
Number of chronic conditions in thousands1
Arthritis . . . . . . . . . . . . . . . . . . . . . . . . . . . . 1,671 2,434 3,429 2,284 1,144 1,727 4,287 2,141 1,478 663Gout, including gouty arthritis . . . . . . . . . . . . . . . 82 230 367 223 143 83 390 182 112 70Intervertebral disc disorders . . . . . . . . . . . . . . . . 648 476 254 206 48 880 1,027 136 86 50Bone spur or tendinitis, unspecified . . . . . . . . . . . 202 171 138 100 38 495 558 149 113 36Disorders of bone or cartilage . . . . . . . . . . . . . . 91 49 118 118 – 231 184 47 28 18Trouble with bunions . . . . . . . . . . . . . . . . . . . . 319 226 139 87 52 458 460 236 187 49Bursitis, unclassified . . . . . . . . . . . . . . . . . . . . 437 320 407 294 113 839 929 159 107 51Sebaceous skin cyst . . . . . . . . . . . . . . . . . . . . 160 50 55 31 24 448 79 56 44 11Trouble with acne . . . . . . . . . . . . . . . . . . . . . . 1,088 59 10 10 – 2,264 97 42 25 16Psoriasis . . . . . . . . . . . . . . . . . . . . . . . . . . . 248 148 59 45 14 619 315 60 60 –Dermatitis . . . . . . . . . . . . . . . . . . . . . . . . . . . 1,304 303 276 144 132 3,476 734 126 98 28Trouble with dry (itching) skin, unclassified . . . . . . 879 309 281 212 69 1,450 770 162 86 76Trouble with ingrown nails . . . . . . . . . . . . . . . . . 796 239 382 269 113 1,015 635 214 146 68Trouble with corns and calluses . . . . . . . . . . . . . 472 181 331 237 94 615 705 141 54 88
Impairments
Visual impairment . . . . . . . . . . . . . . . . . . . . . . 986 448 532 269 263 1,308 764 416 231 185Color blindness . . . . . . . . . . . . . . . . . . . . . . . 396 176 112 112 – 722 488 149 124 25Cataracts . . . . . . . . . . . . . . . . . . . . . . . . . . . 62 248 1,119 524 595 208 196 695 374 321Glaucoma . . . . . . . . . . . . . . . . . . . . . . . . . . . 98 87 402 178 224 97 266 273 105 167Hearing impairment . . . . . . . . . . . . . . . . . . . . . 1,543 1,222 2,148 1,251 897 2,404 2,924 1,409 791 618Tinnitus . . . . . . . . . . . . . . . . . . . . . . . . . . . . 353 448 689 484 204 727 965 378 289 89Speech impairment . . . . . . . . . . . . . . . . . . . . . 326 145 74 62 12 694 93 57 28 29Absence of extremities (excludestips of fingers or toes only) . . . . . . . . . . . . . . . 104 155 92 56 36 143 130 148 93 55Paralysis of extremities, complete or partial . . . . . . 134 180 107 54 53 121 77 81 46 35Deformity or orthopedic impairment . . . . . . . . . . . 3,570 1,861 1,111 697 414 7,043 3,390 756 455 302Back . . . . . . . . . . . . . . . . . . . . . . . . . . . . . 2,401 1,179 688 481 207 4,410 1,801 382 219 164Upper extremities . . . . . . . . . . . . . . . . . . . . . 421 263 175 58 117 753 510 164 84 79Lower extremities . . . . . . . . . . . . . . . . . . . . . 1,221 767 455 256 199 2,631 1,361 327 205 122
Selected digestive conditions
Ulcer . . . . . . . . . . . . . . . . . . . . . . . . . . . . . . 468 316 265 169 95 682 398 14 14 –Hernia of abdominal cavity . . . . . . . . . . . . . . . . 254 339 609 419 191 306 679 299 179 121Gastritis or duodenitis . . . . . . . . . . . . . . . . . . . 455 237 294 125 169 632 363 148 113 35Frequent indigestion . . . . . . . . . . . . . . . . . . . . 980 465 531 323 208 1,332 684 168 110 58Enteritis or colitis . . . . . . . . . . . . . . . . . . . . . . 288 89 64 49 15 378 345 57 57 –Spastic colon . . . . . . . . . . . . . . . . . . . . . . . . . 221 108 128 66 62 501 290 123 100 23Diverticula of intestines . . . . . . . . . . . . . . . . . . 48 186 252 190 62 126 429 186 90 95Frequent constipation . . . . . . . . . . . . . . . . . . . . 404 125 191 107 85 545 193 227 69 158
See footnote and notes at end of table.
101

Table 65. Number of selected reported chronic conditions, by family income and age: United States, 1994—Con.[Data are based on household interviews of the civilian noninstitutionalized population. The survey design, general qualifications, and information on the reliability of theestimates are given in appendix I. Definitions of terms are given in appendix II]
Type of chronic condition
Family income
$20,000–$34,999 $35,000 or more
Under45 years
45–64years
65 years and over
Under45 years
45–64years
65 years and over
Total65–74years
75 yearsand over Total
65–74years
75 yearsand over
Selected conditions of thegenitourinary, nervous, endocrine, metabolic,
and blood and blood-forming systemsNumber of chronic conditions in thousands
1
Goiter or other disorders of the thyroid . . . . . . . . . 365 250 283 164 118 742 786 243 192 52Diabetes . . . . . . . . . . . . . . . . . . . . . . . . . . . . 252 547 590 441 149 483 1,104 413 259 153Anemias . . . . . . . . . . . . . . . . . . . . . . . . . . . . 510 117 121 32 89 782 451 151 90 60Epilepsy . . . . . . . . . . . . . . . . . . . . . . . . . . . . 208 30 12 – 12 249 71 60 60 –Migraine headache . . . . . . . . . . . . . . . . . . . . . 1,791 476 139 127 12 2,986 1,187 127 101 27Neuralgia or neuritis, unspecified . . . . . . . . . . . . 35 – 34 22 12 29 122 26 14 13Kidney trouble . . . . . . . . . . . . . . . . . . . . . . . . 316 158 45 21 23 613 267 42 31 12Bladder disorders . . . . . . . . . . . . . . . . . . . . . . 489 154 204 136 68 397 378 180 156 24Diseases of prostate . . . . . . . . . . . . . . . . . . . . 54 33 324 165 160 144 433 563 357 205Diseases of female genital organs . . . . . . . . . . . . 746 189 47 47 – 1,447 689 35 22 13
Selected circulatory conditions
Rheumatic fever with or without heart disease . . . . 182 187 201 119 82 463 230 64 52 11Heart disease . . . . . . . . . . . . . . . . . . . . . . . . 964 1,877 2,353 1,094 1,259 2,101 2,341 1,588 943 645Ischemic heart disease . . . . . . . . . . . . . . . . . 109 704 1,257 556 702 181 981 698 476 222Heart rhythm disorders . . . . . . . . . . . . . . . . . 579 624 602 298 304 1,520 952 518 253 265Tachycardia or rapid heart . . . . . . . . . . . . . . 145 256 234 91 143 261 234 206 99 107Heart murmurs . . . . . . . . . . . . . . . . . . . . . 386 298 208 114 95 1,104 507 111 70 41Other and unspecified heart rhythm disorders . . 48 71 160 94 66 156 210 201 84 117
Other selected diseases of heart, excludinghypertension . . . . . . . . . . . . . . . . . . . . . . . 276 548 494 240 254 400 408 373 215 158
High blood pressure (hypertension) . . . . . . . . . . . 1,239 2,266 2,507 1,402 1,105 2,283 4,905 1,679 1,215 464Cerebrovascular disease . . . . . . . . . . . . . . . . . 92 243 340 137 203 46 193 164 104 60Hardening of the arteries . . . . . . . . . . . . . . . . . – 199 294 164 130 12 164 339 172 167Varicose veins of lower extremities . . . . . . . . . . . 669 403 499 319 180 836 1,072 245 175 70Hemorrhoids . . . . . . . . . . . . . . . . . . . . . . . . . 1,142 743 410 260 150 1,941 1,298 417 288 129
Selected respiratory conditions
Chronic bronchitis . . . . . . . . . . . . . . . . . . . . . . 2,135 669 446 308 138 3,696 1,471 271 178 93Asthma . . . . . . . . . . . . . . . . . . . . . . . . . . . . 2,088 482 387 273 114 3,649 1,155 222 163 59Hay fever or allergic rhinitis without asthma . . . . . . 3,697 1,128 579 422 157 8,762 3,411 518 333 185Chronic sinusitis . . . . . . . . . . . . . . . . . . . . . . . 5,155 1,868 996 740 256 8,704 4,142 647 507 140Deviated nasal septum . . . . . . . . . . . . . . . . . . . 304 69 78 67 11 425 399 115 91 23Chronic disease of tonsils or adenoids . . . . . . . . . 611 51 – – – 1,193 57 – – –Emphysema . . . . . . . . . . . . . . . . . . . . . . . . . 37 61 293 170 123 – 144 211 113 99
1Totals for income categories do not sum to total chronic conditions because persons with unknown family income are not included.
NOTES: The standard errors and relative standard errors (RSE’s) can be computed by using parameter set V of table II and the formula presented in rule 1 of appendix I. An estimate of 1.5million has a 10-percent RSE; of 357,000, a 20-percent RSE; and of 159,000, a 30-percent RSE.
102
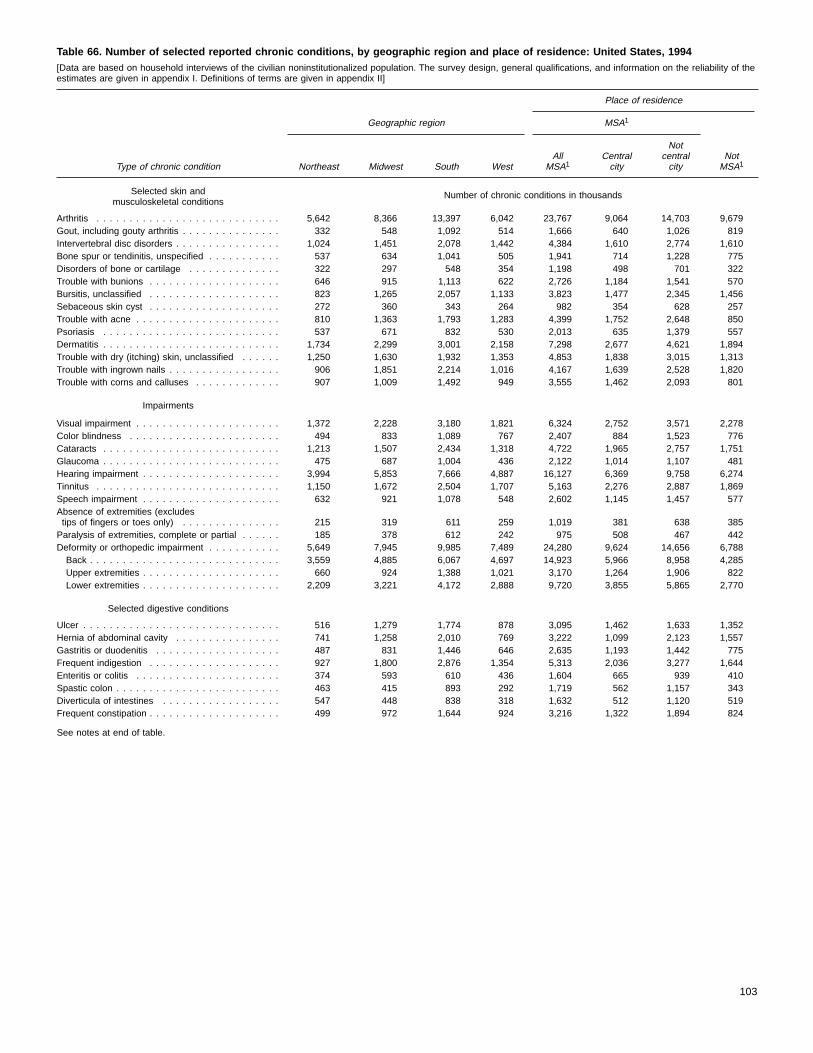
Table 66. Number of selected reported chronic conditions, by geographic region and place of residence: United States, 1994[Data are based on household interviews of the civilian noninstitutionalized population. The survey design, general qualifications, and information on the reliability of theestimates are given in appendix I. Definitions of terms are given in appendix II]
Type of chronic condition
Place of residence
Geographic region MSA1
Northeast Midwest South WestAll
MSA1Centralcity
Notcentralcity
NotMSA1
Selected skin andmusculoskeletal conditions
Number of chronic conditions in thousands
Arthritis . . . . . . . . . . . . . . . . . . . . . . . . . . . . 5,642 8,366 13,397 6,042 23,767 9,064 14,703 9,679Gout, including gouty arthritis . . . . . . . . . . . . . . . 332 548 1,092 514 1,666 640 1,026 819Intervertebral disc disorders . . . . . . . . . . . . . . . . 1,024 1,451 2,078 1,442 4,384 1,610 2,774 1,610Bone spur or tendinitis, unspecified . . . . . . . . . . . 537 634 1,041 505 1,941 714 1,228 775Disorders of bone or cartilage . . . . . . . . . . . . . . 322 297 548 354 1,198 498 701 322Trouble with bunions . . . . . . . . . . . . . . . . . . . . 646 915 1,113 622 2,726 1,184 1,541 570Bursitis, unclassified . . . . . . . . . . . . . . . . . . . . 823 1,265 2,057 1,133 3,823 1,477 2,345 1,456Sebaceous skin cyst . . . . . . . . . . . . . . . . . . . . 272 360 343 264 982 354 628 257Trouble with acne . . . . . . . . . . . . . . . . . . . . . . 810 1,363 1,793 1,283 4,399 1,752 2,648 850Psoriasis . . . . . . . . . . . . . . . . . . . . . . . . . . . 537 671 832 530 2,013 635 1,379 557Dermatitis . . . . . . . . . . . . . . . . . . . . . . . . . . . 1,734 2,299 3,001 2,158 7,298 2,677 4,621 1,894Trouble with dry (itching) skin, unclassified . . . . . . 1,250 1,630 1,932 1,353 4,853 1,838 3,015 1,313Trouble with ingrown nails . . . . . . . . . . . . . . . . . 906 1,851 2,214 1,016 4,167 1,639 2,528 1,820Trouble with corns and calluses . . . . . . . . . . . . . 907 1,009 1,492 949 3,555 1,462 2,093 801
Impairments
Visual impairment . . . . . . . . . . . . . . . . . . . . . . 1,372 2,228 3,180 1,821 6,324 2,752 3,571 2,278Color blindness . . . . . . . . . . . . . . . . . . . . . . . 494 833 1,089 767 2,407 884 1,523 776Cataracts . . . . . . . . . . . . . . . . . . . . . . . . . . . 1,213 1,507 2,434 1,318 4,722 1,965 2,757 1,751Glaucoma . . . . . . . . . . . . . . . . . . . . . . . . . . . 475 687 1,004 436 2,122 1,014 1,107 481Hearing impairment . . . . . . . . . . . . . . . . . . . . . 3,994 5,853 7,666 4,887 16,127 6,369 9,758 6,274Tinnitus . . . . . . . . . . . . . . . . . . . . . . . . . . . . 1,150 1,672 2,504 1,707 5,163 2,276 2,887 1,869Speech impairment . . . . . . . . . . . . . . . . . . . . . 632 921 1,078 548 2,602 1,145 1,457 577Absence of extremities (excludestips of fingers or toes only) . . . . . . . . . . . . . . . 215 319 611 259 1,019 381 638 385Paralysis of extremities, complete or partial . . . . . . 185 378 612 242 975 508 467 442Deformity or orthopedic impairment . . . . . . . . . . . 5,649 7,945 9,985 7,489 24,280 9,624 14,656 6,788Back . . . . . . . . . . . . . . . . . . . . . . . . . . . . . 3,559 4,885 6,067 4,697 14,923 5,966 8,958 4,285Upper extremities . . . . . . . . . . . . . . . . . . . . . 660 924 1,388 1,021 3,170 1,264 1,906 822Lower extremities . . . . . . . . . . . . . . . . . . . . . 2,209 3,221 4,172 2,888 9,720 3,855 5,865 2,770
Selected digestive conditions
Ulcer . . . . . . . . . . . . . . . . . . . . . . . . . . . . . . 516 1,279 1,774 878 3,095 1,462 1,633 1,352Hernia of abdominal cavity . . . . . . . . . . . . . . . . 741 1,258 2,010 769 3,222 1,099 2,123 1,557Gastritis or duodenitis . . . . . . . . . . . . . . . . . . . 487 831 1,446 646 2,635 1,193 1,442 775Frequent indigestion . . . . . . . . . . . . . . . . . . . . 927 1,800 2,876 1,354 5,313 2,036 3,277 1,644Enteritis or colitis . . . . . . . . . . . . . . . . . . . . . . 374 593 610 436 1,604 665 939 410Spastic colon . . . . . . . . . . . . . . . . . . . . . . . . . 463 415 893 292 1,719 562 1,157 343Diverticula of intestines . . . . . . . . . . . . . . . . . . 547 448 838 318 1,632 512 1,120 519Frequent constipation . . . . . . . . . . . . . . . . . . . . 499 972 1,644 924 3,216 1,322 1,894 824
See notes at end of table.
103
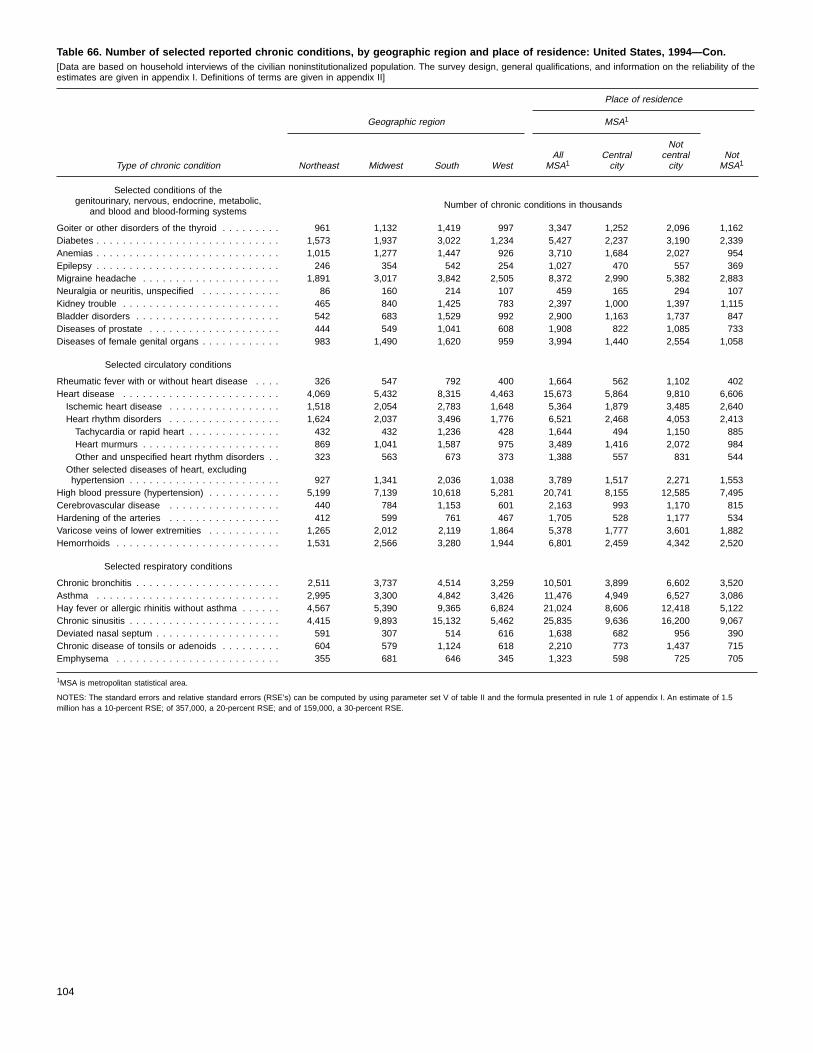
Table 66. Number of selected reported chronic conditions, by geographic region and place of residence: United States, 1994—Con.[Data are based on household interviews of the civilian noninstitutionalized population. The survey design, general qualifications, and information on the reliability of theestimates are given in appendix I. Definitions of terms are given in appendix II]
Type of chronic condition
Place of residence
Geographic region MSA1
Northeast Midwest South WestAll
MSA1Centralcity
Notcentralcity
NotMSA1
Selected conditions of thegenitourinary, nervous, endocrine, metabolic,
and blood and blood-forming systemsNumber of chronic conditions in thousands
Goiter or other disorders of the thyroid . . . . . . . . . 961 1,132 1,419 997 3,347 1,252 2,096 1,162Diabetes . . . . . . . . . . . . . . . . . . . . . . . . . . . . 1,573 1,937 3,022 1,234 5,427 2,237 3,190 2,339Anemias . . . . . . . . . . . . . . . . . . . . . . . . . . . . 1,015 1,277 1,447 926 3,710 1,684 2,027 954Epilepsy . . . . . . . . . . . . . . . . . . . . . . . . . . . . 246 354 542 254 1,027 470 557 369Migraine headache . . . . . . . . . . . . . . . . . . . . . 1,891 3,017 3,842 2,505 8,372 2,990 5,382 2,883Neuralgia or neuritis, unspecified . . . . . . . . . . . . 86 160 214 107 459 165 294 107Kidney trouble . . . . . . . . . . . . . . . . . . . . . . . . 465 840 1,425 783 2,397 1,000 1,397 1,115Bladder disorders . . . . . . . . . . . . . . . . . . . . . . 542 683 1,529 992 2,900 1,163 1,737 847Diseases of prostate . . . . . . . . . . . . . . . . . . . . 444 549 1,041 608 1,908 822 1,085 733Diseases of female genital organs . . . . . . . . . . . . 983 1,490 1,620 959 3,994 1,440 2,554 1,058
Selected circulatory conditions
Rheumatic fever with or without heart disease . . . . 326 547 792 400 1,664 562 1,102 402Heart disease . . . . . . . . . . . . . . . . . . . . . . . . 4,069 5,432 8,315 4,463 15,673 5,864 9,810 6,606Ischemic heart disease . . . . . . . . . . . . . . . . . 1,518 2,054 2,783 1,648 5,364 1,879 3,485 2,640Heart rhythm disorders . . . . . . . . . . . . . . . . . 1,624 2,037 3,496 1,776 6,521 2,468 4,053 2,413Tachycardia or rapid heart . . . . . . . . . . . . . . 432 432 1,236 428 1,644 494 1,150 885Heart murmurs . . . . . . . . . . . . . . . . . . . . . 869 1,041 1,587 975 3,489 1,416 2,072 984Other and unspecified heart rhythm disorders . . 323 563 673 373 1,388 557 831 544
Other selected diseases of heart, excludinghypertension . . . . . . . . . . . . . . . . . . . . . . . 927 1,341 2,036 1,038 3,789 1,517 2,271 1,553
High blood pressure (hypertension) . . . . . . . . . . . 5,199 7,139 10,618 5,281 20,741 8,155 12,585 7,495Cerebrovascular disease . . . . . . . . . . . . . . . . . 440 784 1,153 601 2,163 993 1,170 815Hardening of the arteries . . . . . . . . . . . . . . . . . 412 599 761 467 1,705 528 1,177 534Varicose veins of lower extremities . . . . . . . . . . . 1,265 2,012 2,119 1,864 5,378 1,777 3,601 1,882Hemorrhoids . . . . . . . . . . . . . . . . . . . . . . . . . 1,531 2,566 3,280 1,944 6,801 2,459 4,342 2,520
Selected respiratory conditions
Chronic bronchitis . . . . . . . . . . . . . . . . . . . . . . 2,511 3,737 4,514 3,259 10,501 3,899 6,602 3,520Asthma . . . . . . . . . . . . . . . . . . . . . . . . . . . . 2,995 3,300 4,842 3,426 11,476 4,949 6,527 3,086Hay fever or allergic rhinitis without asthma . . . . . . 4,567 5,390 9,365 6,824 21,024 8,606 12,418 5,122Chronic sinusitis . . . . . . . . . . . . . . . . . . . . . . . 4,415 9,893 15,132 5,462 25,835 9,636 16,200 9,067Deviated nasal septum . . . . . . . . . . . . . . . . . . . 591 307 514 616 1,638 682 956 390Chronic disease of tonsils or adenoids . . . . . . . . . 604 579 1,124 618 2,210 773 1,437 715Emphysema . . . . . . . . . . . . . . . . . . . . . . . . . 355 681 646 345 1,323 598 725 705
1MSA is metropolitan statistical area.
NOTES: The standard errors and relative standard errors (RSE’s) can be computed by using parameter set V of table II and the formula presented in rule 1 of appendix I. An estimate of 1.5million has a 10-percent RSE; of 357,000, a 20-percent RSE; and of 159,000, a 30-percent RSE.
104

Table 67. Percent distribution of persons by degree of activity limitation due to chronic conditions, according to sociodemographiccharacteristics: United States, 1994[Data are based on household interviews of the civilian noninstitutionalized population. The survey design, general qualifications, and information on the reliability of theestimates are given in appendix I. Definitions of terms are given in appendix II]
Characteristic
Degree of activity limitation
Allpersons
With noactivitylimitation
Withactivitylimitation
Withlimitationin majoractivity
Unableto carryon majoractivity
Limitedin amountor kindof majoractivity
Limited,but notin majoractivity
Percent distribution
All persons1 . . . . . . . . . . . . . . . . . . . . . . . . . 100.0 85.0 15.0 10.3 4.6 5.7 4.7
Age
Under 18 years . . . . . . . . . . . . . . . . . . . . . . . 100.0 93.3 6.7 4.9 0.7 4.2 1.818–44 years . . . . . . . . . . . . . . . . . . . . . . . . . 100.0 89.7 10.3 7.1 3.2 3.9 3.145–64 years . . . . . . . . . . . . . . . . . . . . . . . . . 100.0 77.4 22.6 17.1 9.2 7.9 5.565 years and over . . . . . . . . . . . . . . . . . . . . . . 100.0 61.8 38.2 22.6 10.7 11.9 15.665–69 years . . . . . . . . . . . . . . . . . . . . . . . . 100.0 63.3 36.7 29.3 16.7 12.6 7.370 years and over . . . . . . . . . . . . . . . . . . . . 100.0 61.1 38.9 19.5 8.1 11.5 19.3
Sex and age
Male:All ages . . . . . . . . . . . . . . . . . . . . . . . . . . . . 100.0 85.6 14.4 10.1 4.8 5.3 4.3Under 18 years . . . . . . . . . . . . . . . . . . . . . . 100.0 92.1 7.9 6.0 0.8 5.2 1.918–44 years . . . . . . . . . . . . . . . . . . . . . . . . 100.0 89.8 10.2 7.4 3.7 3.7 2.845–64 years . . . . . . . . . . . . . . . . . . . . . . . . 100.0 78.7 21.3 16.8 9.9 6.9 4.665–69 years . . . . . . . . . . . . . . . . . . . . . . . . 100.0 62.3 37.7 32.4 20.9 11.6 5.370 years and over . . . . . . . . . . . . . . . . . . . . 100.0 63.5 36.5 14.5 6.5 7.9 22.0
Female:All ages . . . . . . . . . . . . . . . . . . . . . . . . . . . . 100.0 84.3 15.7 10.5 4.4 6.1 5.2Under 18 years . . . . . . . . . . . . . . . . . . . . . . 100.0 94.4 5.6 3.8 0.7 3.2 1.718–44 years . . . . . . . . . . . . . . . . . . . . . . . . 100.0 89.7 10.3 6.9 2.8 4.1 3.545–64 years . . . . . . . . . . . . . . . . . . . . . . . . 100.0 76.1 23.9 17.4 8.6 8.8 6.465–69 years . . . . . . . . . . . . . . . . . . . . . . . . 100.0 64.2 35.8 26.8 13.3 13.5 9.070 years and over . . . . . . . . . . . . . . . . . . . . 100.0 59.5 40.5 22.9 9.1 13.9 17.5
Race and age
White:All ages . . . . . . . . . . . . . . . . . . . . . . . . . . . . 100.0 84.9 15.1 10.2 4.4 5.8 4.9Under 18 years . . . . . . . . . . . . . . . . . . . . . . 100.0 93.6 6.4 4.7 0.7 4.0 1.718–44 years . . . . . . . . . . . . . . . . . . . . . . . . 100.0 89.8 10.2 6.9 2.9 4.0 3.345–64 years . . . . . . . . . . . . . . . . . . . . . . . . 100.0 78.1 21.9 16.3 8.5 7.8 5.665–69 years . . . . . . . . . . . . . . . . . . . . . . . . 100.0 64.5 35.5 28.4 15.7 12.7 7.270 years and over . . . . . . . . . . . . . . . . . . . . 100.0 61.6 38.4 18.9 7.8 11.1 19.5
Black:All ages . . . . . . . . . . . . . . . . . . . . . . . . . . . . 100.0 83.7 16.3 12.5 6.3 6.2 3.8Under 18 years . . . . . . . . . . . . . . . . . . . . . . 100.0 91.2 8.8 6.7 1.0 5.7 2.118–44 years . . . . . . . . . . . . . . . . . . . . . . . . 100.0 88.5 11.5 9.0 5.2 3.8 2.545–64 years . . . . . . . . . . . . . . . . . . . . . . . . 100.0 69.3 30.7 25.3 15.8 9.5 5.365–69 years . . . . . . . . . . . . . . . . . . . . . . . . 100.0 50.5 49.5 40.4 27.6 12.7 9.170 years and over . . . . . . . . . . . . . . . . . . . . 100.0 53.4 46.6 27.8 11.5 16.2 18.8
See footnote and notes at end of table.
105

Table 67. Percent distribution of persons by degree of activity limitation due to chronic conditions according to sociodemographiccharacteristics: United States, 1994—Con.[Data are based on household interviews of the civilian noninstitutionalized population. The survey design, general qualifications, and information on the reliability of theestimates are given in appendix I. Definitions of terms are given in appendix II]
Characteristic
Degree of activity limitation
Allpersons
With noactivitylimitation
Withactivitylimitation
Withlimitationin majoractivity
Unableto carryon majoractivity
Limitedin amountor kindof majoractivity
Limited,but notin majoractivity
Family income and age
Under $10,000:Percent distribution
All ages . . . . . . . . . . . . . . . . . . . . . . . . . . . . 100.0 72.0 28.0 21.1 11.2 9.9 6.9Under 18 years . . . . . . . . . . . . . . . . . . . . . . 100.0 88.9 11.1 8.8 1.6 7.3 2.218–44 years . . . . . . . . . . . . . . . . . . . . . . . . 100.0 79.2 20.8 15.9 9.1 6.8 4.945–64 years . . . . . . . . . . . . . . . . . . . . . . . . 100.0 40.5 59.5 52.7 37.4 15.3 6.865–69 years . . . . . . . . . . . . . . . . . . . . . . . . 100.0 43.4 56.6 46.1 31.1 15.0 10.470 years and over . . . . . . . . . . . . . . . . . . . . 100.0 49.0 51.1 28.6 10.1 18.5 22.5
$10,000–$19,999:All ages . . . . . . . . . . . . . . . . . . . . . . . . . . . . 100.0 78.9 21.1 15.0 7.3 7.7 6.2Under 18 years . . . . . . . . . . . . . . . . . . . . . . 100.0 91.6 8.4 6.7 1.0 5.7 1.718–44 years . . . . . . . . . . . . . . . . . . . . . . . . 100.0 85.9 14.1 10.8 5.5 5.3 3.245–64 years . . . . . . . . . . . . . . . . . . . . . . . . 100.0 63.0 37.0 30.9 18.8 12.1 6.165–69 years . . . . . . . . . . . . . . . . . . . . . . . . 100.0 57.4 42.6 35.3 21.2 14.1 7.370 years and over . . . . . . . . . . . . . . . . . . . . 100.0 59.9 40.0 17.8 6.9 10.9 22.3
$20,000–$34,999:All ages . . . . . . . . . . . . . . . . . . . . . . . . . . . . 100.0 85.2 14.8 10.1 4.1 6.0 4.7Under 18 years . . . . . . . . . . . . . . . . . . . . . . 100.0 93.5 6.5 4.7 0.6 4.1 1.818–44 years . . . . . . . . . . . . . . . . . . . . . . . . 100.0 90.0 10.0 6.8 2.5 4.3 3.245–64 years . . . . . . . . . . . . . . . . . . . . . . . . 100.0 75.0 25.0 19.0 9.0 10.0 6.065–69 years . . . . . . . . . . . . . . . . . . . . . . . . 100.0 64.7 35.2 28.8 15.4 13.3 6.570 years and over . . . . . . . . . . . . . . . . . . . . 100.0 65.1 34.9 15.8 7.0 8.8 19.1
$35,000 or more:All ages . . . . . . . . . . . . . . . . . . . . . . . . . . . . 100.0 90.6 9.4 5.8 1.9 3.9 3.6Under 18 years . . . . . . . . . . . . . . . . . . . . . . 100.0 94.7 5.3 3.5 0.4 3.1 1.818–44 years . . . . . . . . . . . . . . . . . . . . . . . . 100.0 92.8 7.2 4.2 1.3 2.9 3.045–64 years . . . . . . . . . . . . . . . . . . . . . . . . 100.0 85.9 14.1 8.9 3.3 5.6 5.265–69 years . . . . . . . . . . . . . . . . . . . . . . . . 100.0 73.4 26.6 19.8 8.9 11.0 6.870 years and over . . . . . . . . . . . . . . . . . . . . 100.0 67.3 32.7 16.1 7.1 9.0 16.6
Geographic region
Northeast . . . . . . . . . . . . . . . . . . . . . . . . . . . 100.0 85.7 14.3 10.0 4.3 5.6 4.3Midwest . . . . . . . . . . . . . . . . . . . . . . . . . . . . 100.0 85.4 14.6 9.9 3.9 6.0 4.6South . . . . . . . . . . . . . . . . . . . . . . . . . . . . . 100.0 83.9 16.1 11.3 5.3 6.0 4.8West . . . . . . . . . . . . . . . . . . . . . . . . . . . . . . 100.0 85.3 14.7 9.6 4.6 5.0 5.0
Place of residence
MSA2 . . . . . . . . . . . . . . . . . . . . . . . . . . . . . 100.0 85.7 14.3 9.9 4.4 5.5 4.5Central city . . . . . . . . . . . . . . . . . . . . . . . . . 100.0 84.2 15.8 11.3 5.4 5.9 4.5Not central city . . . . . . . . . . . . . . . . . . . . . . 100.0 86.6 13.4 8.9 3.8 5.2 4.5
Not MSA2 . . . . . . . . . . . . . . . . . . . . . . . . . . . 100.0 82.4 17.6 12.0 5.4 6.6 5.6
1Includes other races and unknown family income.2MSA is metropolitan statistical area.
NOTES: The standard errors (SE’s) and relative standard errors (RSE’s) for age, sex and age, and race and age can be computed by using parameter set X of table II, the frequencies of table 68,and the formula presented in rule 2 of appendix I. The SE’s and RSE’s for family income and age, geographic region, and place of residence can be computed by using parameter set X of table II,the frequencies of table 68, and the formula presented in rule 3 of appendix I.
106

Table 68. Number of persons by degree of activity limitation due to chronic conditions and sociodemographic characteristics: UnitedStates, 1994[Data are based on household interviews of the civilian noninstitutionalized population. The survey design, general qualifications, and information on the reliability of theestimates are given in appendix I. Definitions of terms are given in appendix II]
Characteristic
Degree of activity limitation
Allpersons
With noactivitylimitation
Withactivitylimitation
Withlimitationin majoractivity
Unableto carryon majoractivity
Limitedin amountor kindof majoractivity
Limited,but notin majoractivity
Number in thousands
All persons1 . . . . . . . . . . . . . . . . . . . . . . . . . 259,634 220,575 39,059 26,796 11,993 14,803 12,262
Age
Under 18 years . . . . . . . . . . . . . . . . . . . . . . . 70,025 65,314 4,711 3,448 519 2,929 1,26318–44 years . . . . . . . . . . . . . . . . . . . . . . . . . 108,178 97,084 11,094 7,708 3,488 4,220 3,38645–64 years . . . . . . . . . . . . . . . . . . . . . . . . . 50,405 38,998 11,407 8,628 4,652 3,976 2,77965 years and over . . . . . . . . . . . . . . . . . . . . . . 31,026 19,179 11,847 7,013 3,335 3,678 4,83465–69 years . . . . . . . . . . . . . . . . . . . . . . . . 9,685 6,134 3,551 2,842 1,617 1,225 71070 years and over . . . . . . . . . . . . . . . . . . . . 21,340 13,045 8,295 4,171 1,718 2,453 4,124
Sex and age
Male:All ages . . . . . . . . . . . . . . . . . . . . . . . . . . . . 126,494 108,288 18,206 12,811 6,106 6,705 5,395Under 18 years . . . . . . . . . . . . . . . . . . . . . . 35,832 33,019 2,813 2,133 287 1,846 68018–44 years . . . . . . . . . . . . . . . . . . . . . . . . 53,387 47,957 5,430 3,945 1,949 1,996 1,48545–64 years . . . . . . . . . . . . . . . . . . . . . . . . 24,344 19,155 5,189 4,081 2,402 1,679 1,10865–69 years . . . . . . . . . . . . . . . . . . . . . . . . 4,354 2,712 1,643 1,411 908 503 23270 years and over . . . . . . . . . . . . . . . . . . . . 8,577 5,445 3,132 1,242 561 681 1,890
Female:All ages . . . . . . . . . . . . . . . . . . . . . . . . . . . . 133,139 112,287 20,853 13,985 5,887 8,098 6,868Under 18 years . . . . . . . . . . . . . . . . . . . . . . 34,194 32,295 1,898 1,315 232 1,083 58318–44 years . . . . . . . . . . . . . . . . . . . . . . . . 54,791 49,127 5,664 3,763 1,539 2,224 1,90245–64 years . . . . . . . . . . . . . . . . . . . . . . . . 26,061 19,843 6,218 4,547 2,250 2,296 1,67165–69 years . . . . . . . . . . . . . . . . . . . . . . . . 5,331 3,422 1,909 1,431 709 722 47870 years and over . . . . . . . . . . . . . . . . . . . . 12,763 7,599 5,163 2,929 1,157 1,773 2,234
Race and age
White:All ages . . . . . . . . . . . . . . . . . . . . . . . . . . . . 214,496 182,092 32,404 21,793 9,437 12,357 10,611Under 18 years . . . . . . . . . . . . . . . . . . . . . . 55,239 51,678 3,561 2,595 388 2,207 96618–44 years . . . . . . . . . . . . . . . . . . . . . . . . 88,326 79,353 8,973 6,086 2,532 3,554 2,88745–64 years . . . . . . . . . . . . . . . . . . . . . . . . 43,182 33,717 9,465 7,053 3,681 3,372 2,41165–69 years . . . . . . . . . . . . . . . . . . . . . . . . 8,562 5,522 3,041 2,428 1,344 1,085 61370 years and over . . . . . . . . . . . . . . . . . . . . 19,187 11,823 7,364 3,631 1,492 2,139 3,733
Black:All ages . . . . . . . . . . . . . . . . . . . . . . . . . . . . 33,035 27,639 5,396 4,135 2,089 2,046 1,261Under 18 years . . . . . . . . . . . . . . . . . . . . . . 11,300 10,303 996 755 113 643 24118–44 years . . . . . . . . . . . . . . . . . . . . . . . . 14,082 12,456 1,626 1,273 739 534 35345–64 years . . . . . . . . . . . . . . . . . . . . . . . . 5,129 3,555 1,573 1,300 811 489 27365–69 years . . . . . . . . . . . . . . . . . . . . . . . . 842 425 417 340 232 107 7770 years and over . . . . . . . . . . . . . . . . . . . . 1,682 899 783 467 194 272 317
See footnote and notes at end of table.
107

Table 68. Number of persons by degree of activity limitation due to chronic conditions and sociodemographic characteristics: UnitedStates, 1994—Con.[Data are based on household interviews of the civilian noninstitutionalized population. The survey design, general qualifications, and information on the reliability of theestimates are given in appendix I. Definitions of terms are given in appendix II]
Characteristic
Degree of activity limitation
Allpersons
With noactivitylimitation
Withactivitylimitation
Withlimitationin majoractivity
Unableto carryon majoractivity
Limitedin amountor kindof majoractivity
Limited,but notin majoractivity
Family income and age
Under $10,000:Number in thousands
All ages . . . . . . . . . . . . . . . . . . . . . . . . . . . . 23,363 16,818 6,544 4,924 2,618 2,306 1,620Under 18 years . . . . . . . . . . . . . . . . . . . . . . 7,030 6,250 779 622 112 511 15718–44 years . . . . . . . . . . . . . . . . . . . . . . . . 9,458 7,490 1,968 1,502 859 643 46745–64 years . . . . . . . . . . . . . . . . . . . . . . . . 2,808 1,138 1,671 1,479 1,049 431 19165–69 years . . . . . . . . . . . . . . . . . . . . . . . . 900 391 509 415 280 135 9470 years and over . . . . . . . . . . . . . . . . . . . . 3,166 1,550 1,617 905 319 587 712
$10,000–$19,999:All ages . . . . . . . . . . . . . . . . . . . . . . . . . . . . 37,271 29,393 7,877 5,573 2,717 2,856 2,304Under 18 years . . . . . . . . . . . . . . . . . . . . . . 10,103 9,253 850 674 103 571 17618–44 years . . . . . . . . . . . . . . . . . . . . . . . . 14,347 12,331 2,016 1,552 794 758 46445–64 years . . . . . . . . . . . . . . . . . . . . . . . . 5,595 3,526 2,069 1,729 1,051 678 34065–69 years . . . . . . . . . . . . . . . . . . . . . . . . 1,897 1,089 808 670 403 267 13870 years and over . . . . . . . . . . . . . . . . . . . . 5,330 3,195 2,134 949 367 582 1,186
$20,000–$34,999:All ages . . . . . . . . . . . . . . . . . . . . . . . . . . . . 54,171 46,164 8,007 5,465 2,216 3,249 2,542Under 18 years . . . . . . . . . . . . . . . . . . . . . . 14,454 13,519 936 682 88 594 25418–44 years . . . . . . . . . . . . . . . . . . . . . . . . 23,514 21,167 2,347 1,603 596 1,007 74445–64 years . . . . . . . . . . . . . . . . . . . . . . . . 9,461 7,096 2,365 1,800 855 945 56665–69 years . . . . . . . . . . . . . . . . . . . . . . . . 2,438 1,578 859 701 376 325 15870 years and over . . . . . . . . . . . . . . . . . . . . 4,304 2,804 1,500 679 300 379 820
$35,000 or more:All ages . . . . . . . . . . . . . . . . . . . . . . . . . . . . 100,302 90,854 9,448 5,806 1,872 3,934 3,642Under 18 years . . . . . . . . . . . . . . . . . . . . . . 28,046 26,569 1,477 978 121 857 50018–44 years . . . . . . . . . . . . . . . . . . . . . . . . 43,705 40,575 3,130 1,840 584 1,256 1,29045–64 years . . . . . . . . . . . . . . . . . . . . . . . . 23,402 20,114 3,288 2,081 765 1,316 1,20665–69 years . . . . . . . . . . . . . . . . . . . . . . . . 2,145 1,574 570 425 190 235 14670 years and over . . . . . . . . . . . . . . . . . . . . 3,004 2,021 982 483 212 271 500
Geographic region
Northeast . . . . . . . . . . . . . . . . . . . . . . . . . . . 50,610 43,392 7,218 5,041 2,199 2,841 2,177Midwest . . . . . . . . . . . . . . . . . . . . . . . . . . . . 63,238 54,028 9,210 6,289 2,475 3,815 2,921South . . . . . . . . . . . . . . . . . . . . . . . . . . . . . 88,088 73,914 14,174 9,918 4,657 5,261 4,256West . . . . . . . . . . . . . . . . . . . . . . . . . . . . . . 57,697 49,241 8,457 5,548 2,662 2,886 2,909
Place of residence
MSA2 . . . . . . . . . . . . . . . . . . . . . . . . . . . . . 203,079 173,959 29,120 20,014 8,930 11,084 9,106Central city . . . . . . . . . . . . . . . . . . . . . . . . . 79,510 66,925 12,585 8,988 4,276 4,712 3,597Not central city . . . . . . . . . . . . . . . . . . . . . . 123,570 107,035 16,535 11,026 4,654 6,372 5,510
Not MSA2 . . . . . . . . . . . . . . . . . . . . . . . . . . . 56,554 46,616 9,938 6,782 3,063 3,719 3,156
1Includes other races and unknown family income.2MSA is metropolitan statistical area.
NOTES: The standard errors and relative standard errors (RSE’s) can be computed by using parameter set X of table II and the formula presented in rule 1 of appendix I. An estimate of 384,000has a 10-percent RSE; of 96,000, a 20-percent RSE; and of 43,000, a 30-percent RSE.
108

Table 69. Number of days per person per year and number of days of activity restriction due to acute and chronic conditions, by type ofrestriction and sociodemographic characteristics: United States, 1994[Data are based on household interviews of the civilian noninstitutionalized population. The survey design, general qualifications, and information on the reliability of theestimates are given in appendix I. Definitions of terms are given in appendix II]
Characteristic
Type of restriction
Alltypes
Beddisability
Work orschool loss1
Alltypes
Beddisability
Work orschool loss1
Number of days per person Number of days in thousands
All persons2 . . . . . . . . . . . . . . . . . . . . . . . . . 16.0 6.2 5.0 4,142,587 1,602,711 866,929
Age
Under 5 years . . . . . . . . . . . . . . . . . . . . . . . . 10.0 4.5 . . . 204,255 91,483 . . .5–17 years . . . . . . . . . . . . . . . . . . . . . . . . . . 8.6 3.4 4.5 426,347 168,898 224,81418 years and over . . . . . . . . . . . . . . . . . . . . . . 18.5 7.1 5.2 3,511,985 1,342,330 642,11518–24 years . . . . . . . . . . . . . . . . . . . . . . . . 9.6 3.9 4.1 243,520 97,692 68,80825–44 years . . . . . . . . . . . . . . . . . . . . . . . . 13.5 4.8 5.0 1,122,933 395,735 333,62945–64 years . . . . . . . . . . . . . . . . . . . . . . . . 21.3 8.0 6.2 1,073,017 400,900 216,70965 years and over . . . . . . . . . . . . . . . . . . . . 34.6 14.4 5.9 1,072,514 448,003 22,969
Sex and age
Male:All ages . . . . . . . . . . . . . . . . . . . . . . . . . . . . 13.6 4.9 4.5 1,722,895 623,041 414,529Under 5 years . . . . . . . . . . . . . . . . . . . . . . . 9.6 4.3 . . . 100,559 45,451 . . .5–17 years . . . . . . . . . . . . . . . . . . . . . . . . . 8.0 3.0 4.1 203,309 77,095 104,01518 years and over . . . . . . . . . . . . . . . . . . . . 15.7 5.5 4.6 1,419,028 500,495 310,51418–24 years . . . . . . . . . . . . . . . . . . . . . . 8.2 3.1 3.7 102,631 38,997 33,26625–44 years . . . . . . . . . . . . . . . . . . . . . . 11.4 3.6 4.2 463,929 147,373 153,05645–64 years . . . . . . . . . . . . . . . . . . . . . . 18.6 6.5 5.8 453,362 157,284 110,88965 years and over . . . . . . . . . . . . . . . . . . . 30.9 12.1 6.0 399,105 156,840 13,303
Female:All ages . . . . . . . . . . . . . . . . . . . . . . . . . . . . 18.2 7.4 5.6 2,419,692 979,670 452,400Under 5 years . . . . . . . . . . . . . . . . . . . . . . . 10.4 4.6 . . . 103,696 46,032 . . .5–17 years . . . . . . . . . . . . . . . . . . . . . . . . . 9.2 3.8 5.0 223,039 91,804 120,79918 years and over . . . . . . . . . . . . . . . . . . . . 21.2 8.5 5.9 2,092,957 841,834 331,60118–24 years . . . . . . . . . . . . . . . . . . . . . . 11.1 4.6 4.5 140,889 58,695 35,54225–44 years . . . . . . . . . . . . . . . . . . . . . . 15.7 5.9 5.9 659,004 248,362 180,57345–64 years . . . . . . . . . . . . . . . . . . . . . . 23.8 9.3 6.6 619,655 243,615 105,82065 years and over . . . . . . . . . . . . . . . . . . . 37.2 16.1 5.7 673,409 291,163 9,666
Race and age
White:All ages . . . . . . . . . . . . . . . . . . . . . . . . . . . . 15.7 5.9 4.9 3,375,104 1,263,995 704,814Under 5 years . . . . . . . . . . . . . . . . . . . . . . . 10.6 4.5 . . . 169,618 72,309 . . .5–17 years . . . . . . . . . . . . . . . . . . . . . . . . . 9.0 3.5 4.6 351,049 138,365 180,67518 years and over . . . . . . . . . . . . . . . . . . . . 17.9 6.6 5.0 2,854,437 1,053,321 524,13918–24 years . . . . . . . . . . . . . . . . . . . . . . 9.6 3.7 3.9 193,065 73,836 54,70125–44 years . . . . . . . . . . . . . . . . . . . . . . 13.0 4.4 4.8 885,370 300,897 270,30045–64 years . . . . . . . . . . . . . . . . . . . . . . 19.9 7.2 5.9 859,304 309,465 177,90065 years and over . . . . . . . . . . . . . . . . . . . 33.0 13.3 5.9 916,698 369,123 21,238
Black:All ages . . . . . . . . . . . . . . . . . . . . . . . . . . . . 18.4 8.4 6.0 607,636 276,958 127,918Under 5 years . . . . . . . . . . . . . . . . . . . . . . . 8.1 4.7 . . . 27,347 15,793 . . .5–17 years . . . . . . . . . . . . . . . . . . . . . . . . . 7.5 3.0 4.5 59,105 23,643 35,94418 years and over . . . . . . . . . . . . . . . . . . . . 24.0 10.9 6.9 521,184 237,522 91,97418–24 years . . . . . . . . . . . . . . . . . . . . . . 10.9 5.4 5.9 40,079 19,685 11,54825–44 years . . . . . . . . . . . . . . . . . . . . . . 17.1 7.2 6.0 178,310 75,277 47,11745–64 years . . . . . . . . . . . . . . . . . . . . . . 33.9 14.8 9.9 173,903 76,144 32,27365 years and over . . . . . . . . . . . . . . . . . . . 51.1 26.3 *4.0 128,892 66,416 1,037
See footnotes and notes at end of table.
109

Table 69. Number of days per person per year and number of days of activity restriction due to acute and chronic conditions, by type ofrestriction and sociodemographic characteristics: United States, 1994—Con.[Data are based on household interviews of the civilian noninstitutionalized population. The survey design, general qualifications, and information on the reliability of theestimates are given in appendix I. Definitions of terms are given in appendix II]
Characteristic
Type of restriction
Alltypes
Beddisability
Work orschool loss1
Alltypes
Beddisability
Work orschool loss1
Family income and age
Less than $10,000:Number of days per person Number of days in thousands
All ages . . . . . . . . . . . . . . . . . . . . . . . . . . . . 29.1 12.0 7.1 680,864 279,494 70,944Under 5 years . . . . . . . . . . . . . . . . . . . . . . . 10.0 4.3 . . . 24,557 10,508 . . .5–17 years . . . . . . . . . . . . . . . . . . . . . . . . . 11.4 4.5 6.4 51,974 20,687 29,33618 years and over . . . . . . . . . . . . . . . . . . . . 37.0 15.2 7.7 604,333 248,299 41,60818–24 years . . . . . . . . . . . . . . . . . . . . . . 13.6 5.2 5.4 58,043 22,216 11,05525–44 years . . . . . . . . . . . . . . . . . . . . . . 29.8 12.7 8.8 155,231 66,075 19,91845–64 years . . . . . . . . . . . . . . . . . . . . . . 68.9 28.7 11.8 193,508 80,718 9,85265 years and over . . . . . . . . . . . . . . . . . . . 48.6 19.5 *3.5 197,550 79,289 784
$10,000–$19,999:All ages . . . . . . . . . . . . . . . . . . . . . . . . . . . . 21.5 8.4 6.8 801,490 311,908 140,512Under 5 years . . . . . . . . . . . . . . . . . . . . . . . 9.1 5.2 . . . 29,477 16,806 . . .5–17 years . . . . . . . . . . . . . . . . . . . . . . . . . 9.4 3.4 5.1 64,404 23,095 34,78718 years and over . . . . . . . . . . . . . . . . . . . . 26.0 10.0 7.7 707,610 272,006 105,72518–24 years . . . . . . . . . . . . . . . . . . . . . . 12.2 4.8 6.2 52,986 20,661 17,54425–44 years . . . . . . . . . . . . . . . . . . . . . . 20.0 6.9 7.7 200,212 69,321 55,47545–64 years . . . . . . . . . . . . . . . . . . . . . . 34.6 13.8 9.1 193,338 77,074 26,85965 years and over . . . . . . . . . . . . . . . . . . . 36.1 14.5 7.7 261,073 104,950 5,848
$20,000–$34,999:All ages . . . . . . . . . . . . . . . . . . . . . . . . . . . . 15.2 5.5 5.4 824,682 300,618 199,565Under 5 years . . . . . . . . . . . . . . . . . . . . . . . 10.0 4.3 . . . 44,212 18,912 . . .5–17 years . . . . . . . . . . . . . . . . . . . . . . . . . 8.8 3.7 4.4 88,719 36,949 44,50718 years and over . . . . . . . . . . . . . . . . . . . . 17.4 6.2 5.8 691,751 244,757 155,05818–24 years . . . . . . . . . . . . . . . . . . . . . . 9.6 4.0 4.2 47,261 19,546 15,65225–44 years . . . . . . . . . . . . . . . . . . . . . . 13.7 4.5 5.6 255,436 82,884 87,54645–64 years . . . . . . . . . . . . . . . . . . . . . . 20.3 7.0 7.2 192,049 66,463 45,59565 years and over . . . . . . . . . . . . . . . . . . . 29.2 11.3 6.7 197,005 75,865 6,265
$35,000 or more:All ages . . . . . . . . . . . . . . . . . . . . . . . . . . . . 10.5 3.8 4.3 1,050,754 381,081 337,143Under 5 years . . . . . . . . . . . . . . . . . . . . . . . 10.0 3.7 . . . 73,682 27,210 . . .5–17 years . . . . . . . . . . . . . . . . . . . . . . . . . 7.9 3.0 4.0 164,277 62,858 83,25418 years and over . . . . . . . . . . . . . . . . . . . . 11.2 4.0 4.4 812,796 291,012 253,89018–24 years . . . . . . . . . . . . . . . . . . . . . . 6.6 3.2 2.6 48,358 23,571 14,54025–44 years . . . . . . . . . . . . . . . . . . . . . . 9.4 3.1 4.1 341,338 111,698 132,12845–64 years . . . . . . . . . . . . . . . . . . . . . . 12.9 4.4 5.3 301,160 101,888 100,50565 years and over . . . . . . . . . . . . . . . . . . . 23.7 10.5 5.8 121,940 53,856 6,717
Geographic region
Northeast . . . . . . . . . . . . . . . . . . . . . . . . . . . 15.9 5.9 5.0 803,445 296,801 162,866Midwest . . . . . . . . . . . . . . . . . . . . . . . . . . . . 13.9 5.3 4.8 879,302 337,799 208,257South . . . . . . . . . . . . . . . . . . . . . . . . . . . . . 16.4 6.8 4.9 1,442,558 599,846 287,205West . . . . . . . . . . . . . . . . . . . . . . . . . . . . . . 17.6 6.4 5.5 1,017,282 368,263 208,601
Place of residence
MSA3 . . . . . . . . . . . . . . . . . . . . . . . . . . . . . 15.7 6.2 5.0 3,186,720 1,253,548 682,974Central city . . . . . . . . . . . . . . . . . . . . . . . . . 16.8 6.8 5.3 1,332,647 544,507 269,235Not central city . . . . . . . . . . . . . . . . . . . . . . 15.0 5.7 4.9 1,854,074 709,042 413,739
Not MSA3 . . . . . . . . . . . . . . . . . . . . . . . . . . . 16.9 6.2 5.0 955,866 349,163 183,955
1Sum of school-loss days for children 5–17 years of age and work-loss days for currently employed persons 18 years of age and over. School-loss days are shown for the age group 5–17 years;work-loss days are shown for the age group 18 years and over and each older age group.
2Includes other races and unknown family income.3MSA is metropolitan statistical area.
NOTES: The standard errors (SE’s) and relative standard errors (RSE’s) for age, sex and age, and race and age for columns 1 and 2 can be computed by using parameter set II of table II, thefrequencies of table 69, and the formula presented in rule 2 of appendix I. The SE’s and RSE’s for family income and age, geographic region, and place of residence for columns 1 and 2 can becomputed by using parameter sets II and X of table II, the frequencies of tables 69 and 78, and the formula presented in rule 4 of appendix I. The SE’s and RSE’s for column 3 (workloss) can becomputed by using parameter sets III and X of table II, the frequencies of tables 69 and 78, and the formula presented in rule 4 of appendix I. The SE’s and RSE’s for age, sex and age, and raceand age for column 3 (school loss) can be computed by using parameter set III of table II, the frequencies of table 69, and the formula presented in rule 2 of appendix I. The SE’s and RSE’s forfamily income and age, geographic region, and place of residence for column 3 (school loss) can be computed by using parameter sets III and X of table II, the frequencies of tables 69 and 78,and the formula presented in rule 4 of appendix I. The SE’s and RSE’s for columns 4 and 5 can be computed by using parameter set II of table II and the formula presented in rule 1 of appendix I.The SE’s and RSE’s for column 6 can be computed by using parameter set III of table II and the formula presented in rule 1 of appendix I. For restricted-activity and bed days, an estimate of 55.4million has an RSE of 10 percent; 13.4 million, of 20 percent; and 6.0 million, of 30 percent. For work- or school-loss days, an estimate of 37.6 million has an RSE of 10 percent; 9.3 million, of 20percent; and 4.2 million, of 30 percent. Rates for which the numerator has an RSE of more than 30 percent are indicated with an asterisk.
110

Table 70. Number of persons and percent distribution by respondent-assessed health status, according to sociodemographiccharacteristics: United States, 1994[Data are based on household interviews of the civilian noninstitutionalized population. The survey design, general qualifications, and information on the reliability of theestimates are given in appendix I. Definitions of terms are given in appendix II]
Characteristic
Respondent-assessed health status
Allpersons1
Allhealth
statuses2 Excellent Very good Good Fair Poor
Number inthousands Percent distribution
All persons3 . . . . . . . . . . . . . . . . . . . . . . . . . 259,634 100.0 37.9 28.5 23.4 7.3 2.9
Age
Under 5 years . . . . . . . . . . . . . . . . . . . . . . . . 20,480 100.0 53.4 27.3 16.4 2.5 0.45–17 years . . . . . . . . . . . . . . . . . . . . . . . . . . 49,545 100.0 51.2 27.3 18.4 2.6 0.418–24 years . . . . . . . . . . . . . . . . . . . . . . . . . 25,285 100.0 43.0 31.5 21.1 3.7 0.625–44 years . . . . . . . . . . . . . . . . . . . . . . . . . 82,893 100.0 38.8 31.1 22.6 5.7 1.845–64 years . . . . . . . . . . . . . . . . . . . . . . . . . 50,405 100.0 28.4 27.7 27.3 11.4 5.265 years and over . . . . . . . . . . . . . . . . . . . . . . 31,026 100.0 15.7 23.0 33.4 18.4 9.6
Sex and age
Male:All ages . . . . . . . . . . . . . . . . . . . . . . . . . . . . 126,494 100.0 40.8 28.3 21.7 6.4 2.7Under 5 years . . . . . . . . . . . . . . . . . . . . . . . 10,471 100.0 52.8 28.1 15.8 2.8 0.45–17 years . . . . . . . . . . . . . . . . . . . . . . . . . 25,360 100.0 52.1 27.1 17.9 2.5 0.518–24 years . . . . . . . . . . . . . . . . . . . . . . . . 12,571 100.0 47.6 30.4 18.9 2.8 0.325–44 years . . . . . . . . . . . . . . . . . . . . . . . . 40,816 100.0 42.3 30.5 20.7 4.8 1.745–64 years . . . . . . . . . . . . . . . . . . . . . . . . 24,344 100.0 30.9 28.1 25.6 10.3 5.065 years and over . . . . . . . . . . . . . . . . . . . . 12,932 100.0 16.7 22.6 32.2 18.3 10.2
Female:All ages . . . . . . . . . . . . . . . . . . . . . . . . . . . . 133,139 100.0 35.2 28.7 25.0 8.1 3.0Under 5 years . . . . . . . . . . . . . . . . . . . . . . . 10,009 100.0 54.0 26.5 16.9 2.3 *0.35–17 years . . . . . . . . . . . . . . . . . . . . . . . . . 24,185 100.0 50.3 27.5 19.0 2.8 0.418–24 years . . . . . . . . . . . . . . . . . . . . . . . . 12,714 100.0 38.4 32.6 23.4 4.6 1.025–44 years . . . . . . . . . . . . . . . . . . . . . . . . 42,076 100.0 35.5 31.7 24.5 6.5 1.845–64 years . . . . . . . . . . . . . . . . . . . . . . . . 26,061 100.0 26.0 27.4 28.9 12.4 5.365 years and over . . . . . . . . . . . . . . . . . . . . 18,094 100.0 14.9 23.3 34.2 18.4 9.1
Race and age
White:All ages . . . . . . . . . . . . . . . . . . . . . . . . . . . . 214,496 100.0 39.0 29.0 22.5 6.8 2.7Under 5 years . . . . . . . . . . . . . . . . . . . . . . . 16,074 100.0 55.0 27.6 14.9 2.2 0.35–17 years . . . . . . . . . . . . . . . . . . . . . . . . . 39,165 100.0 53.4 27.6 16.4 2.3 0.418–24 years . . . . . . . . . . . . . . . . . . . . . . . . 20,051 100.0 44.6 31.9 19.7 3.3 0.525–44 years . . . . . . . . . . . . . . . . . . . . . . . . 68,275 100.0 40.2 31.9 21.4 4.9 1.645–64 years . . . . . . . . . . . . . . . . . . . . . . . . 43,182 100.0 30.1 28.5 26.5 10.3 4.665 years and over . . . . . . . . . . . . . . . . . . . . 27,749 100.0 16.2 23.7 33.6 17.6 9.0
Black:All ages . . . . . . . . . . . . . . . . . . . . . . . . . . . . 33,035 100.0 31.9 25.2 28.4 10.5 4.0Under 5 years . . . . . . . . . . . . . . . . . . . . . . . 3,376 100.0 46.6 25.6 23.2 4.0 *0.65–17 years . . . . . . . . . . . . . . . . . . . . . . . . . 7,924 100.0 41.7 25.8 27.4 4.4 0.818–24 years . . . . . . . . . . . . . . . . . . . . . . . . 3,665 100.0 36.6 28.7 27.4 5.8 1.425–44 years . . . . . . . . . . . . . . . . . . . . . . . . 10,417 100.0 31.0 27.4 28.9 10.0 2.745–64 years . . . . . . . . . . . . . . . . . . . . . . . . 5,129 100.0 16.4 21.2 32.2 20.2 10.065 years and over . . . . . . . . . . . . . . . . . . . . 2,524 100.0 10.4 16.3 30.4 26.6 16.2
See footnotes and notes at end of table.
111

Table 70. Number of persons and percent distribution by respondent-assessed health status, according to sociodemographiccharacteristics: United States, 1994—Con.[Data are based on household interviews of the civilian noninstitutionalized population. The survey design, general qualifications, and information on the reliability of theestimates are given in appendix I. Definitions of terms are given in appendix II]
Characteristic
Respondent-assessed health status
Allpersons1
Allhealth
statuses2 Excellent Very good Good Fair Poor
Family income and age
Under $10,000:
Number inthousands Percent distribution
All ages . . . . . . . . . . . . . . . . . . . . . . . . . . . . 23,363 100.0 25.5 23.6 29.0 14.1 7.8Under 5 years . . . . . . . . . . . . . . . . . . . . . . . 2,467 100.0 42.1 24.8 27.6 4.6 *0.95–17 years . . . . . . . . . . . . . . . . . . . . . . . . . 4,562 100.0 36.6 24.9 31.3 5.9 1.318–24 years . . . . . . . . . . . . . . . . . . . . . . . . 4,257 100.0 34.7 35.3 22.6 6.4 *1.025–44 years . . . . . . . . . . . . . . . . . . . . . . . . 5,201 100.0 21.2 22.0 33.1 16.6 7.145–64 years . . . . . . . . . . . . . . . . . . . . . . . . 2,808 100.0 8.6 13.9 26.0 28.6 22.965 years and over . . . . . . . . . . . . . . . . . . . . 4,067 100.0 10.7 17.8 30.8 23.9 16.8
$10,000–$19,999:All ages . . . . . . . . . . . . . . . . . . . . . . . . . . . . 37,271 100.0 28.4 26.1 29.4 11.2 4.9Under 5 years . . . . . . . . . . . . . . . . . . . . . . . 3,244 100.0 44.4 29.8 21.4 3.9 *0.55–17 years . . . . . . . . . . . . . . . . . . . . . . . . . 6,859 100.0 40.9 27.4 26.4 4.6 0.618–24 years . . . . . . . . . . . . . . . . . . . . . . . . 4,341 100.0 37.0 30.6 26.5 4.5 1.325–44 years . . . . . . . . . . . . . . . . . . . . . . . . 10,006 100.0 27.5 28.1 31.2 10.0 3.245–64 years . . . . . . . . . . . . . . . . . . . . . . . . 5,595 100.0 18.1 21.0 30.3 19.7 11.065 years and over . . . . . . . . . . . . . . . . . . . . 7,226 100.0 13.6 21.6 34.4 19.6 10.8
$20,000–$34,999:All ages . . . . . . . . . . . . . . . . . . . . . . . . . . . . 54,171 100.0 35.3 29.9 25.5 7.1 2.2Under 5 years . . . . . . . . . . . . . . . . . . . . . . . 4,420 100.0 53.7 26.7 17.1 2.3 *0.25–17 years . . . . . . . . . . . . . . . . . . . . . . . . . 10,035 100.0 47.0 30.3 20.1 2.3 *0.318–24 years . . . . . . . . . . . . . . . . . . . . . . . . 4,900 100.0 42.5 32.5 21.5 3.1 *0.425–44 years . . . . . . . . . . . . . . . . . . . . . . . . 18,615 100.0 36.0 32.3 25.1 5.3 1.345–64 years . . . . . . . . . . . . . . . . . . . . . . . . 9,461 100.0 22.7 28.3 31.5 13.1 4.565 years and over . . . . . . . . . . . . . . . . . . . . 6,741 100.0 16.4 25.5 34.7 16.8 6.6
$35,000 or more:All ages . . . . . . . . . . . . . . . . . . . . . . . . . . . . 100,302 100.0 47.9 30.2 17.5 3.5 0.9Under 5 years . . . . . . . . . . . . . . . . . . . . . . . 7,335 100.0 62.4 27.2 9.1 1.2 *0.25–17 years . . . . . . . . . . . . . . . . . . . . . . . . . 20,711 100.0 61.7 26.2 10.8 1.2 *0.218–24 years . . . . . . . . . . . . . . . . . . . . . . . . 7,373 100.0 52.6 30.5 14.9 1.8 *0.225–44 years . . . . . . . . . . . . . . . . . . . . . . . . 36,332 100.0 47.1 32.7 17.0 2.7 0.645–64 years . . . . . . . . . . . . . . . . . . . . . . . . 23,402 100.0 36.7 31.3 24.5 6.2 1.465 years and over . . . . . . . . . . . . . . . . . . . . 5,148 100.0 22.5 26.9 32.7 12.8 5.1
Geographic region
Northeast . . . . . . . . . . . . . . . . . . . . . . . . . . . 50,610 100.0 38.9 29.6 22.5 6.8 2.2Midwest . . . . . . . . . . . . . . . . . . . . . . . . . . . . 63,238 100.0 38.3 30.0 22.6 6.7 2.4South . . . . . . . . . . . . . . . . . . . . . . . . . . . . . 88,088 100.0 36.7 27.1 24.3 8.2 3.8West . . . . . . . . . . . . . . . . . . . . . . . . . . . . . . 57,697 100.0 38.5 28.1 23.8 7.0 2.6
Place of residence
MSA4 . . . . . . . . . . . . . . . . . . . . . . . . . . . . . 203,079 100.0 38.7 28.6 23.1 7.0 2.6Central city . . . . . . . . . . . . . . . . . . . . . . . . . 79,510 100.0 34.5 28.9 25.3 8.3 3.0Not central city . . . . . . . . . . . . . . . . . . . . . . 123,570 100.0 41.4 28.4 21.7 6.2 2.3
Not MSA4 . . . . . . . . . . . . . . . . . . . . . . . . . . . 56,554 100.0 35.0 28.3 24.4 8.3 4.0
1Includes unknown health status.2Excludes unknown health status.3Includes other races and unknown family income.4MSA is metropolitan statistical area.
NOTES: The standard errors (SE’s) and relative standard errors (RSE’s) for family income and age, geographic region, and place of residence for column 1 can be computed by using parameterset X of table II and the formula presented in rule 1 of appendix I. The SE’s and RSE’s for age, sex and age, and race and age for columns 3–7 can be computed by using parameter set X oftable II, the frequencies of table 70, and the formula presented in rule 2 of appendix I. The SE’s and RSE’s for family income and age, geographic region, and place of residence for columns 3–7can be computed by using parameter set X of table II, the frequencies of table 70, and the formula presented in rule 3 of appendix I. An estimate of 384,000 has a 10-percent RSE; of 96,000, a20-percent RSE; and of 43,000, a 30-percent RSE. Estimates for which the numerator has an RSE of more than 30 percent are indicated with an asterisk.
112

Table 71. Number per person per year and number of physician contacts, by place of contact and sociodemographic characteristics:United States, 1994[Data are based on household interviews of the civilian noninstitutionalized population. The survey design, general qualifications, and information on the reliability of theestimates are given in appendix I. Definitions of terms are given in appendix II]
Characteristic
Place of contact
Allplaces1 Telephone Office Hospital Other
Allplaces1 Telephone Office Hospital Other
Number per person per year2 Number in thousands2
All persons3 . . . . . . . . . . . . . . . . . . . . . . . . . 6.1 0.8 3.4 0.8 1.1 1,581,640 197,524 877,815 208,060 286,851
Age
Under 5 years . . . . . . . . . . . . . . . . . . . . . . . . 6.8 1.0 4.0 0.9 0.9 138,403 21,162 81,292 17,465 17,4205–17 years . . . . . . . . . . . . . . . . . . . . . . . . . . 3.5 0.4 2.0 0.5 0.4 172,037 21,730 101,475 25,437 22,24718–24 years . . . . . . . . . . . . . . . . . . . . . . . . . 3.9 0.4 2.1 0.6 0.8 98,390 9,866 52,873 14,830 20,20725–44 years . . . . . . . . . . . . . . . . . . . . . . . . . 5.5 0.8 3.1 0.7 0.9 451,816 62,661 253,672 60,129 71,99345–64 years . . . . . . . . . . . . . . . . . . . . . . . . . 7.3 1.0 4.0 1.1 1.1 370,426 52,001 202,280 55,080 57,91665–74 years . . . . . . . . . . . . . . . . . . . . . . . . . 10.3 1.0 5.7 1.2 2.4 188,340 17,573 103,724 22,307 43,56675 years and over . . . . . . . . . . . . . . . . . . . . . . 12.7 1.0 6.5 1.0 4.2 162,227 12,531 82,499 12,811 53,503
Sex and age
Male:All ages . . . . . . . . . . . . . . . . . . . . . . . . . . . . 5.2 0.6 2.8 0.8 0.9 652,021 72,808 356,327 99,792 118,496Under 18 years . . . . . . . . . . . . . . . . . . . . . . 4.5 0.6 2.6 0.7 0.6 160,076 20,716 94,580 23,367 20,63518–44 years . . . . . . . . . . . . . . . . . . . . . . . . 3.7 0.4 2.0 0.6 0.8 200,019 21,491 104,703 30,169 41,45745–64 years . . . . . . . . . . . . . . . . . . . . . . . . 6.3 0.8 3.4 1.2 0.9 154,312 19,446 82,486 29,449 22,09065 years and over . . . . . . . . . . . . . . . . . . . . 10.6 0.9 5.8 1.3 2.7 137,615 11,155 74,558 16,807 34,315
Female:All ages . . . . . . . . . . . . . . . . . . . . . . . . . . . . 7.0 0.9 3.9 0.8 1.3 929,619 124,716 521,487 108,267 168,355Under 18 years . . . . . . . . . . . . . . . . . . . . . . 4.4 0.6 2.6 0.6 0.6 150,364 22,176 88,187 19,535 19,03218–44 years . . . . . . . . . . . . . . . . . . . . . . . . 6.4 0.9 3.7 0.8 0.9 350,187 51,036 201,842 44,790 50,74345–64 years . . . . . . . . . . . . . . . . . . . . . . . . 8.3 1.2 4.6 1.0 1.4 216,114 32,555 119,794 25,631 35,82665 years and over . . . . . . . . . . . . . . . . . . . . 11.8 1.0 6.2 1.0 3.5 212,952 18,949 111,665 18,311 62,754
Race and age
White:All ages . . . . . . . . . . . . . . . . . . . . . . . . . . . . 6.3 0.8 3.6 0.8 1.1 1,349,712 178,178 768,003 163,355 230,703Under 18 years . . . . . . . . . . . . . . . . . . . . . . 4.7 0.7 2.8 0.6 0.6 259,274 38,081 157,015 31,947 30,39318–44 years . . . . . . . . . . . . . . . . . . . . . . . . 5.2 0.7 3.0 0.6 0.8 457,689 63,758 263,260 57,163 70,36345–64 years . . . . . . . . . . . . . . . . . . . . . . . . 7.4 1.1 4.1 1.0 1.1 318,523 47,642 177,681 44,167 46,08165 years and over . . . . . . . . . . . . . . . . . . . . 11.3 1.0 6.1 1.1 3.0 314,225 28,697 170,047 30,079 83,866
Black:All ages . . . . . . . . . . . . . . . . . . . . . . . . . . . . 5.4 0.4 2.5 1.1 1.4 178,612 13,714 83,626 34,961 44,678Under 18 years . . . . . . . . . . . . . . . . . . . . . . 3.5 0.3 1.7 0.8 0.7 39,253 3,131 19,600 8,573 7,68618–44 years . . . . . . . . . . . . . . . . . . . . . . . . 5.0 0.5 2.3 1.0 1.2 69,807 6,484 32,441 13,934 16,24345–64 years . . . . . . . . . . . . . . . . . . . . . . . . 7.7 0.6 3.7 1.7 1.7 39,348 3,023 18,733 8,521 8,92165 years and over . . . . . . . . . . . . . . . . . . . . 12.0 *0.4 5.1 1.6 4.7 30,204 1,076 12,851 3,933 11,828
Family income and age
Under $10,000:All ages . . . . . . . . . . . . . . . . . . . . . . . . . . . . 8.1 0.9 3.3 1.5 2.4 189,434 21,984 76,933 33,931 55,435Under 18 years . . . . . . . . . . . . . . . . . . . . . . 4.9 0.5 2.2 1.3 0.9 34,155 3,848 15,270 8,885 6,01318–44 years . . . . . . . . . . . . . . . . . . . . . . . . 6.7 0.8 2.4 1.3 2.2 63,121 7,997 22,356 11,824 20,74545–64 years . . . . . . . . . . . . . . . . . . . . . . . . 12.9 1.8 5.1 3.1 2.6 36,155 5,113 14,456 8,766 7,43665 years and over . . . . . . . . . . . . . . . . . . . . 13.8 1.2 6.1 1.1 5.2 56,004 5,026 24,851 4,455 21,241
$10,000–$19,999:All ages . . . . . . . . . . . . . . . . . . . . . . . . . . . . 6.8 0.7 3.5 1.0 1.5 252,428 27,594 130,282 37,094 56,049Under 18 years . . . . . . . . . . . . . . . . . . . . . . 4.4 0.6 2.2 0.7 0.8 44,830 6,326 22,205 7,252 8,55318–44 years . . . . . . . . . . . . . . . . . . . . . . . . 5.4 0.6 3.0 0.9 0.9 76,909 8,629 42,398 12,578 13,00545–64 years . . . . . . . . . . . . . . . . . . . . . . . . 8.5 1.0 4.0 1.6 1.8 47,309 5,675 22,215 9,102 10,21765 years and over . . . . . . . . . . . . . . . . . . . . 11.5 1.0 6.0 1.1 3.4 83,380 6,965 43,463 8,162 24,274
See footnotes and notes at end of table.
113
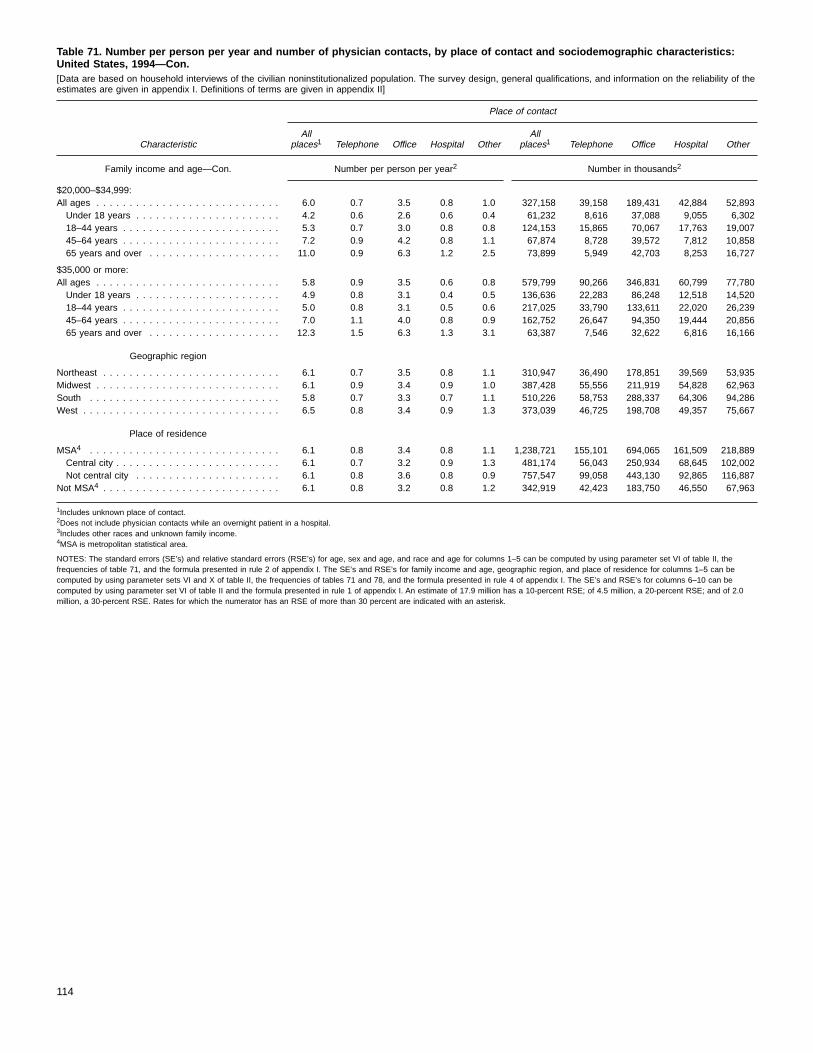
Table 71. Number per person per year and number of physician contacts, by place of contact and sociodemographic characteristics:United States, 1994—Con.[Data are based on household interviews of the civilian noninstitutionalized population. The survey design, general qualifications, and information on the reliability of theestimates are given in appendix I. Definitions of terms are given in appendix II]
Characteristic
Place of contact
Allplaces1 Telephone Office Hospital Other
Allplaces1 Telephone Office Hospital Other
Family income and age—Con. Number per person per year2 Number in thousands2
$20,000–$34,999:All ages . . . . . . . . . . . . . . . . . . . . . . . . . . . . 6.0 0.7 3.5 0.8 1.0 327,158 39,158 189,431 42,884 52,893Under 18 years . . . . . . . . . . . . . . . . . . . . . . 4.2 0.6 2.6 0.6 0.4 61,232 8,616 37,088 9,055 6,30218–44 years . . . . . . . . . . . . . . . . . . . . . . . . 5.3 0.7 3.0 0.8 0.8 124,153 15,865 70,067 17,763 19,00745–64 years . . . . . . . . . . . . . . . . . . . . . . . . 7.2 0.9 4.2 0.8 1.1 67,874 8,728 39,572 7,812 10,85865 years and over . . . . . . . . . . . . . . . . . . . . 11.0 0.9 6.3 1.2 2.5 73,899 5,949 42,703 8,253 16,727
$35,000 or more:All ages . . . . . . . . . . . . . . . . . . . . . . . . . . . . 5.8 0.9 3.5 0.6 0.8 579,799 90,266 346,831 60,799 77,780Under 18 years . . . . . . . . . . . . . . . . . . . . . . 4.9 0.8 3.1 0.4 0.5 136,636 22,283 86,248 12,518 14,52018–44 years . . . . . . . . . . . . . . . . . . . . . . . . 5.0 0.8 3.1 0.5 0.6 217,025 33,790 133,611 22,020 26,23945–64 years . . . . . . . . . . . . . . . . . . . . . . . . 7.0 1.1 4.0 0.8 0.9 162,752 26,647 94,350 19,444 20,85665 years and over . . . . . . . . . . . . . . . . . . . . 12.3 1.5 6.3 1.3 3.1 63,387 7,546 32,622 6,816 16,166
Geographic region
Northeast . . . . . . . . . . . . . . . . . . . . . . . . . . . 6.1 0.7 3.5 0.8 1.1 310,947 36,490 178,851 39,569 53,935Midwest . . . . . . . . . . . . . . . . . . . . . . . . . . . . 6.1 0.9 3.4 0.9 1.0 387,428 55,556 211,919 54,828 62,963South . . . . . . . . . . . . . . . . . . . . . . . . . . . . . 5.8 0.7 3.3 0.7 1.1 510,226 58,753 288,337 64,306 94,286West . . . . . . . . . . . . . . . . . . . . . . . . . . . . . . 6.5 0.8 3.4 0.9 1.3 373,039 46,725 198,708 49,357 75,667
Place of residence
MSA4 . . . . . . . . . . . . . . . . . . . . . . . . . . . . . 6.1 0.8 3.4 0.8 1.1 1,238,721 155,101 694,065 161,509 218,889Central city . . . . . . . . . . . . . . . . . . . . . . . . . 6.1 0.7 3.2 0.9 1.3 481,174 56,043 250,934 68,645 102,002Not central city . . . . . . . . . . . . . . . . . . . . . . 6.1 0.8 3.6 0.8 0.9 757,547 99,058 443,130 92,865 116,887
Not MSA4 . . . . . . . . . . . . . . . . . . . . . . . . . . . 6.1 0.8 3.2 0.8 1.2 342,919 42,423 183,750 46,550 67,963
1Includes unknown place of contact.2Does not include physician contacts while an overnight patient in a hospital.3Includes other races and unknown family income.4MSA is metropolitan statistical area.
NOTES: The standard errors (SE’s) and relative standard errors (RSE’s) for age, sex and age, and race and age for columns 1–5 can be computed by using parameter set VI of table II, thefrequencies of table 71, and the formula presented in rule 2 of appendix I. The SE’s and RSE’s for family income and age, geographic region, and place of residence for columns 1–5 can becomputed by using parameter sets VI and X of table II, the frequencies of tables 71 and 78, and the formula presented in rule 4 of appendix I. The SE’s and RSE’s for columns 6–10 can becomputed by using parameter set VI of table II and the formula presented in rule 1 of appendix I. An estimate of 17.9 million has a 10-percent RSE; of 4.5 million, a 20-percent RSE; and of 2.0million, a 30-percent RSE. Rates for which the numerator has an RSE of more than 30 percent are indicated with an asterisk.
114
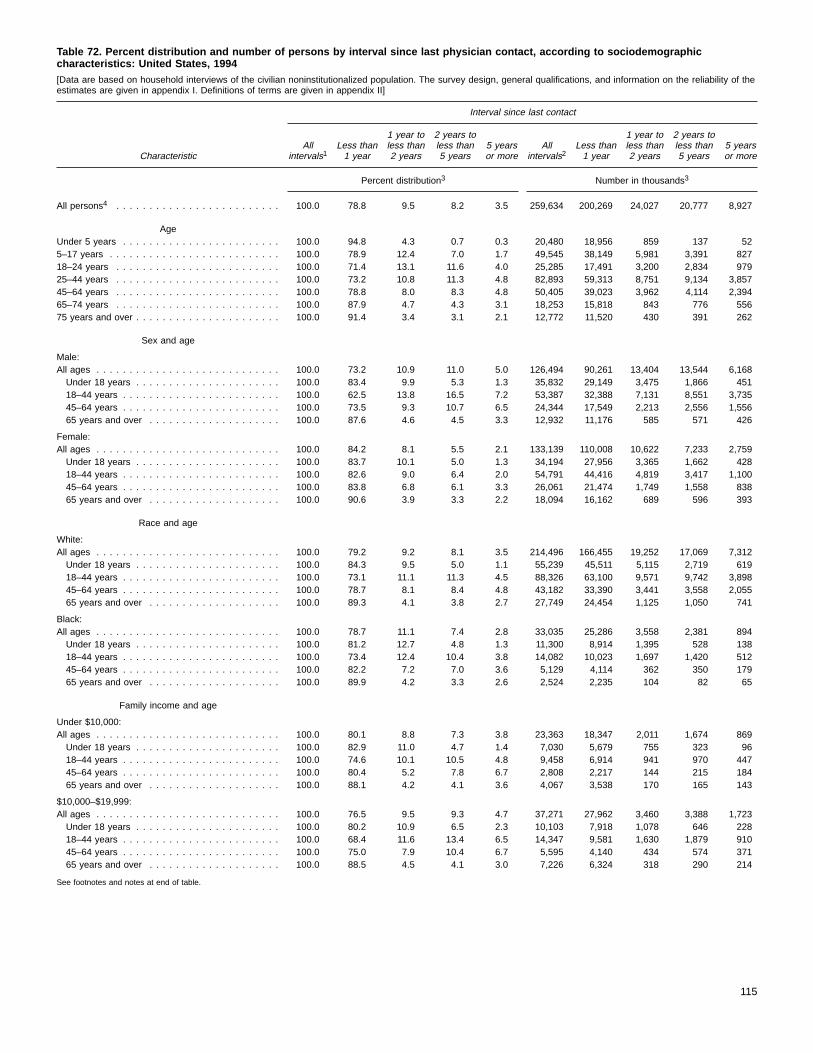
Table 72. Percent distribution and number of persons by interval since last physician contact, according to sociodemographiccharacteristics: United States, 1994[Data are based on household interviews of the civilian noninstitutionalized population. The survey design, general qualifications, and information on the reliability of theestimates are given in appendix I. Definitions of terms are given in appendix II]
Characteristic
Interval since last contact
Allintervals1
Less than1 year
1 year toless than2 years
2 years toless than5 years
5 yearsor more
Allintervals2
Less than1 year
1 year toless than2 years
2 years toless than5 years
5 yearsor more
Percent distribution3 Number in thousands3
All persons4 . . . . . . . . . . . . . . . . . . . . . . . . . 100.0 78.8 9.5 8.2 3.5 259,634 200,269 24,027 20,777 8,927
AgeUnder 5 years . . . . . . . . . . . . . . . . . . . . . . . . 100.0 94.8 4.3 0.7 0.3 20,480 18,956 859 137 525–17 years . . . . . . . . . . . . . . . . . . . . . . . . . . 100.0 78.9 12.4 7.0 1.7 49,545 38,149 5,981 3,391 82718–24 years . . . . . . . . . . . . . . . . . . . . . . . . . 100.0 71.4 13.1 11.6 4.0 25,285 17,491 3,200 2,834 97925–44 years . . . . . . . . . . . . . . . . . . . . . . . . . 100.0 73.2 10.8 11.3 4.8 82,893 59,313 8,751 9,134 3,85745–64 years . . . . . . . . . . . . . . . . . . . . . . . . . 100.0 78.8 8.0 8.3 4.8 50,405 39,023 3,962 4,114 2,39465–74 years . . . . . . . . . . . . . . . . . . . . . . . . . 100.0 87.9 4.7 4.3 3.1 18,253 15,818 843 776 55675 years and over . . . . . . . . . . . . . . . . . . . . . . 100.0 91.4 3.4 3.1 2.1 12,772 11,520 430 391 262
Sex and age
Male:All ages . . . . . . . . . . . . . . . . . . . . . . . . . . . . 100.0 73.2 10.9 11.0 5.0 126,494 90,261 13,404 13,544 6,168Under 18 years . . . . . . . . . . . . . . . . . . . . . . 100.0 83.4 9.9 5.3 1.3 35,832 29,149 3,475 1,866 45118–44 years . . . . . . . . . . . . . . . . . . . . . . . . 100.0 62.5 13.8 16.5 7.2 53,387 32,388 7,131 8,551 3,73545–64 years . . . . . . . . . . . . . . . . . . . . . . . . 100.0 73.5 9.3 10.7 6.5 24,344 17,549 2,213 2,556 1,55665 years and over . . . . . . . . . . . . . . . . . . . . 100.0 87.6 4.6 4.5 3.3 12,932 11,176 585 571 426
Female:All ages . . . . . . . . . . . . . . . . . . . . . . . . . . . . 100.0 84.2 8.1 5.5 2.1 133,139 110,008 10,622 7,233 2,759Under 18 years . . . . . . . . . . . . . . . . . . . . . . 100.0 83.7 10.1 5.0 1.3 34,194 27,956 3,365 1,662 42818–44 years . . . . . . . . . . . . . . . . . . . . . . . . 100.0 82.6 9.0 6.4 2.0 54,791 44,416 4,819 3,417 1,10045–64 years . . . . . . . . . . . . . . . . . . . . . . . . 100.0 83.8 6.8 6.1 3.3 26,061 21,474 1,749 1,558 83865 years and over . . . . . . . . . . . . . . . . . . . . 100.0 90.6 3.9 3.3 2.2 18,094 16,162 689 596 393
Race and age
White:All ages . . . . . . . . . . . . . . . . . . . . . . . . . . . . 100.0 79.2 9.2 8.1 3.5 214,496 166,455 19,252 17,069 7,312Under 18 years . . . . . . . . . . . . . . . . . . . . . . 100.0 84.3 9.5 5.0 1.1 55,239 45,511 5,115 2,719 61918–44 years . . . . . . . . . . . . . . . . . . . . . . . . 100.0 73.1 11.1 11.3 4.5 88,326 63,100 9,571 9,742 3,89845–64 years . . . . . . . . . . . . . . . . . . . . . . . . 100.0 78.7 8.1 8.4 4.8 43,182 33,390 3,441 3,558 2,05565 years and over . . . . . . . . . . . . . . . . . . . . 100.0 89.3 4.1 3.8 2.7 27,749 24,454 1,125 1,050 741
Black:All ages . . . . . . . . . . . . . . . . . . . . . . . . . . . . 100.0 78.7 11.1 7.4 2.8 33,035 25,286 3,558 2,381 894Under 18 years . . . . . . . . . . . . . . . . . . . . . . 100.0 81.2 12.7 4.8 1.3 11,300 8,914 1,395 528 13818–44 years . . . . . . . . . . . . . . . . . . . . . . . . 100.0 73.4 12.4 10.4 3.8 14,082 10,023 1,697 1,420 51245–64 years . . . . . . . . . . . . . . . . . . . . . . . . 100.0 82.2 7.2 7.0 3.6 5,129 4,114 362 350 17965 years and over . . . . . . . . . . . . . . . . . . . . 100.0 89.9 4.2 3.3 2.6 2,524 2,235 104 82 65
Family income and age
Under $10,000:All ages . . . . . . . . . . . . . . . . . . . . . . . . . . . . 100.0 80.1 8.8 7.3 3.8 23,363 18,347 2,011 1,674 869Under 18 years . . . . . . . . . . . . . . . . . . . . . . 100.0 82.9 11.0 4.7 1.4 7,030 5,679 755 323 9618–44 years . . . . . . . . . . . . . . . . . . . . . . . . 100.0 74.6 10.1 10.5 4.8 9,458 6,914 941 970 44745–64 years . . . . . . . . . . . . . . . . . . . . . . . . 100.0 80.4 5.2 7.8 6.7 2,808 2,217 144 215 18465 years and over . . . . . . . . . . . . . . . . . . . . 100.0 88.1 4.2 4.1 3.6 4,067 3,538 170 165 143
$10,000–$19,999:All ages . . . . . . . . . . . . . . . . . . . . . . . . . . . . 100.0 76.5 9.5 9.3 4.7 37,271 27,962 3,460 3,388 1,723Under 18 years . . . . . . . . . . . . . . . . . . . . . . 100.0 80.2 10.9 6.5 2.3 10,103 7,918 1,078 646 22818–44 years . . . . . . . . . . . . . . . . . . . . . . . . 100.0 68.4 11.6 13.4 6.5 14,347 9,581 1,630 1,879 91045–64 years . . . . . . . . . . . . . . . . . . . . . . . . 100.0 75.0 7.9 10.4 6.7 5,595 4,140 434 574 37165 years and over . . . . . . . . . . . . . . . . . . . . 100.0 88.5 4.5 4.1 3.0 7,226 6,324 318 290 214
See footnotes and notes at end of table.
115

Table 72. Percent distribution and number of persons by interval since last physician contact, according to sociodemographiccharacteristics: United States, 1994—Con.[Data are based on household interviews of the civilian noninstitutionalized population. The survey design, general qualifications, and information on the reliability of theestimates are given in appendix I. Definitions of terms are given in appendix II]
Characteristic
Interval since last contact
Allintervals1
Less than1 year
1 year toless than2 years
2 years toless than5 years
5 yearsor more
Allintervals2
Less than1 year
1 year toless than2 years
2 years toless than5 years
5 yearsor more
Family income and age—Con. Percent distribution3 Number in thousands3
$20,000–$34,999:All ages . . . . . . . . . . . . . . . . . . . . . . . . . . . . 100.0 77.4 10.0 8.9 3.7 54,171 41,220 5,316 4,730 1,990Under 18 years . . . . . . . . . . . . . . . . . . . . . . 100.0 80.6 11.5 6.3 1.6 14,454 11,405 1,624 895 22618–44 years . . . . . . . . . . . . . . . . . . . . . . . . 100.0 71.7 11.6 11.9 4.8 23,514 16,552 2,681 2,737 1,10945–64 years . . . . . . . . . . . . . . . . . . . . . . . . 100.0 77.3 8.0 9.2 5.5 9,461 7,216 750 861 51265 years and over . . . . . . . . . . . . . . . . . . . . 100.0 90.4 3.9 3.5 2.1 6,741 6,047 260 237 143
$35,000 or more:All ages . . . . . . . . . . . . . . . . . . . . . . . . . . . . 100.0 80.9 9.2 7.3 2.6 100,302 79,914 9,063 7,193 2,583Under 18 years . . . . . . . . . . . . . . . . . . . . . . 100.0 86.7 8.6 4.1 0.7 28,046 23,921 2,363 1,134 18318–44 years . . . . . . . . . . . . . . . . . . . . . . . . 100.0 76.0 10.7 9.8 3.4 43,705 32,626 4,609 4,217 1,48045–64 years . . . . . . . . . . . . . . . . . . . . . . . . 100.0 80.9 8.1 7.3 3.6 23,402 18,702 1,875 1,695 83365 years and over . . . . . . . . . . . . . . . . . . . . 100.0 91.2 4.2 2.9 1.7 5,148 4,665 217 148 86
Geographic region
Northeast . . . . . . . . . . . . . . . . . . . . . . . . . . . 100.0 82.8 8.1 6.4 2.7 50,610 41,120 4,040 3,162 1,327Midwest . . . . . . . . . . . . . . . . . . . . . . . . . . . . 100.0 79.1 9.4 8.1 3.4 63,238 48,869 5,807 5,006 2,120South . . . . . . . . . . . . . . . . . . . . . . . . . . . . . 100.0 77.0 10.4 8.8 3.9 88,088 66,111 8,923 7,546 3,317West . . . . . . . . . . . . . . . . . . . . . . . . . . . . . . 100.0 78.0 9.3 8.9 3.8 57,697 44,169 5,257 5,063 2,163
Place of residence
MSA5 . . . . . . . . . . . . . . . . . . . . . . . . . . . . . 100.0 79.5 9.3 7.8 3.4 203,079 157,977 18,414 15,457 6,842Central city . . . . . . . . . . . . . . . . . . . . . . . . . 100.0 78.7 9.6 8.0 3.6 79,510 61,210 7,499 6,223 2,829Not central city . . . . . . . . . . . . . . . . . . . . . . 100.0 80.0 9.0 7.6 3.3 123,570 96,766 10,915 9,233 4,012
Not MSA5 . . . . . . . . . . . . . . . . . . . . . . . . . . . 100.0 76.5 10.1 9.6 3.8 56,554 42,293 5,613 5,320 2,085
1Excludes unknown interval.2Includes unknown interval.3Includes physician contacts while an overnight patient in a hospital.4Includes other races and unknown family income.5MSA is metropolitan statistical area.
NOTES: The standard errors (SE’s) and relative standard errors (RSE’s) for age, sex and age, and race and age for columns 2–5 can be computed by using parameter set X of table II, thefrequencies of table 72, and the formula presented in rule 2 of appendix I. The SE’s and RSE’s for family income and age, geographic region, and place of residence for columns 2–5 can becomputed by using parameter set X of table II, the frequencies of table 72, and the formula presented in rule 3 of appendix I. The SE’s and RSE’s for columns 6–10 can be computed by usingparameter set X of table II and the formula presented in rule 1 of appendix I. An estimate of 384,000 has a 10-percent RSE; of 96,000, a 20-percent RSE; and of 43,000, a 30-percent RSE.
116

Table 73. Percent distribution of living persons by number of short-stay hospital episodes during the year preceding interview for allcauses and causes excluding deliveries, according to sociodemographic characteristics: United States, 1994[Data are based on household interviews of the civilian noninstitutionalized population. The survey design, general qualifications, and information on the reliability of theestimates are given in appendix I. Definitions of terms are given in appendix II]
Characteristic
All causes Excluding deliveries1
Allstatuses
Number of episodes
Allstatuses
Number of episodes
None 1 23
or more None 1 23
or more
Percent distribution
All persons2 . . . . . . . . . . . . . . . . . . . . . . . . . 100.0 92.5 6.0 1.0 0.5 100.0 93.7 4.9 0.9 0.5
Age
Under 5 years . . . . . . . . . . . . . . . . . . . . . . . . 100.0 95.0 4.2 0.5 0.3 100.0 95.0 4.2 0.5 0.35–17 years . . . . . . . . . . . . . . . . . . . . . . . . . . 100.0 97.7 2.0 0.2 0.1 100.0 97.9 1.8 0.2 0.118–24 years . . . . . . . . . . . . . . . . . . . . . . . . . 100.0 92.6 6.6 0.6 0.2 100.0 96.0 3.4 0.4 0.225–44 years . . . . . . . . . . . . . . . . . . . . . . . . . 100.0 92.8 6.3 0.6 0.3 100.0 95.3 4.0 0.5 0.345–64 years . . . . . . . . . . . . . . . . . . . . . . . . . 100.0 92.0 6.0 1.3 0.7 100.0 92.0 6.0 1.3 0.765–74 years . . . . . . . . . . . . . . . . . . . . . . . . . 100.0 85.0 10.9 2.7 1.3 100.0 85.0 10.9 2.7 1.375 years and over . . . . . . . . . . . . . . . . . . . . . . 100.0 79.8 14.6 3.8 1.8 100.0 79.8 14.6 3.8 1.8
Sex and age
Male:All ages . . . . . . . . . . . . . . . . . . . . . . . . . . . . 100.0 94.1 4.6 0.8 0.5 100.0 94.1 4.6 0.8 0.5Under 18 years . . . . . . . . . . . . . . . . . . . . . . 100.0 96.8 2.6 0.4 0.2 100.0 96.8 2.6 0.4 0.218–44 years . . . . . . . . . . . . . . . . . . . . . . . . 100.0 96.2 3.2 0.3 0.2 100.0 96.2 3.2 0.3 0.245–64 years . . . . . . . . . . . . . . . . . . . . . . . . 100.0 91.8 6.2 1.3 0.7 100.0 91.8 6.2 1.3 0.765 years and over . . . . . . . . . . . . . . . . . . . . 100.0 81.9 12.9 3.5 1.7 100.0 81.9 12.9 3.5 1.7
Female:All ages . . . . . . . . . . . . . . . . . . . . . . . . . . . . 100.0 91.1 7.3 1.1 0.5 100.0 93.3 5.2 1.0 0.5Under 18 years . . . . . . . . . . . . . . . . . . . . . . 100.0 96.9 2.6 0.3 0.2 100.0 97.3 2.3 0.3 0.218–44 years . . . . . . . . . . . . . . . . . . . . . . . . 100.0 89.4 9.3 0.9 0.3 100.0 94.7 4.4 0.6 0.345–64 years . . . . . . . . . . . . . . . . . . . . . . . . 100.0 92.1 5.8 1.4 0.7 100.0 92.1 5.8 1.4 0.765 years and over . . . . . . . . . . . . . . . . . . . . 100.0 83.5 12.1 3.0 1.4 100.0 83.5 12.1 3.0 1.4
Race and age
White:All ages . . . . . . . . . . . . . . . . . . . . . . . . . . . . 100.0 92.5 6.0 1.0 0.5 100.0 93.6 5.0 1.0 0.5Under 18 years . . . . . . . . . . . . . . . . . . . . . . 100.0 96.9 2.6 0.3 0.2 100.0 97.1 2.5 0.3 0.218–44 years . . . . . . . . . . . . . . . . . . . . . . . . 100.0 92.9 6.2 0.6 0.2 100.0 95.5 3.8 0.5 0.245–64 years . . . . . . . . . . . . . . . . . . . . . . . . 100.0 92.1 5.9 1.3 0.7 100.0 92.1 5.9 1.3 0.765 years and over . . . . . . . . . . . . . . . . . . . . 100.0 82.7 12.5 3.3 1.5 100.0 82.7 12.5 3.3 1.5
Black:All ages . . . . . . . . . . . . . . . . . . . . . . . . . . . . 100.0 92.1 6.3 1.0 0.6 100.0 93.5 5.0 0.9 0.6Under 18 years . . . . . . . . . . . . . . . . . . . . . . 100.0 96.4 3.0 0.4 *0.3 100.0 96.7 2.7 *0.4 *0.318–44 years . . . . . . . . . . . . . . . . . . . . . . . . 100.0 91.2 7.4 0.9 0.5 100.0 94.4 4.5 0.7 0.445–64 years . . . . . . . . . . . . . . . . . . . . . . . . 100.0 89.5 7.5 1.9 1.2 100.0 89.5 7.5 1.9 1.265 years and over . . . . . . . . . . . . . . . . . . . . 100.0 82.8 12.6 2.9 1.7 100.0 82.8 12.6 2.9 1.7
Family income and age
Under $10,000:All ages . . . . . . . . . . . . . . . . . . . . . . . . . . . . 100.0 89.1 8.3 1.6 1.0 100.0 90.5 7.0 1.5 1.0Under 18 years . . . . . . . . . . . . . . . . . . . . . . 100.0 95.2 4.1 *0.5 *0.2 100.0 95.4 4.0 *0.4 *0.218–44 years . . . . . . . . . . . . . . . . . . . . . . . . 100.0 89.8 8.5 1.0 0.7 100.0 93.1 5.4 0.9 0.745–64 years . . . . . . . . . . . . . . . . . . . . . . . . 100.0 83.9 10.9 3.2 2.0 100.0 83.9 10.9 3.2 2.065 years and over . . . . . . . . . . . . . . . . . . . . 100.0 80.5 13.4 3.8 2.4 100.0 80.5 13.4 3.8 2.4
$10,000–$19,999:All ages . . . . . . . . . . . . . . . . . . . . . . . . . . . . 100.0 90.7 7.2 1.5 0.7 100.0 92.0 6.0 1.4 0.7Under 18 years . . . . . . . . . . . . . . . . . . . . . . 100.0 96.3 2.8 0.5 *0.4 100.0 96.6 2.5 0.4 *0.418–44 years . . . . . . . . . . . . . . . . . . . . . . . . 100.0 91.2 7.5 0.9 0.5 100.0 94.4 4.6 0.7 0.445–64 years . . . . . . . . . . . . . . . . . . . . . . . . 100.0 89.5 7.0 2.1 1.4 100.0 89.5 7.0 2.1 1.465 years and over . . . . . . . . . . . . . . . . . . . . 100.0 82.6 12.7 3.5 1.2 100.0 82.6 12.7 3.5 1.2
See footnotes and notes at end of table.
117
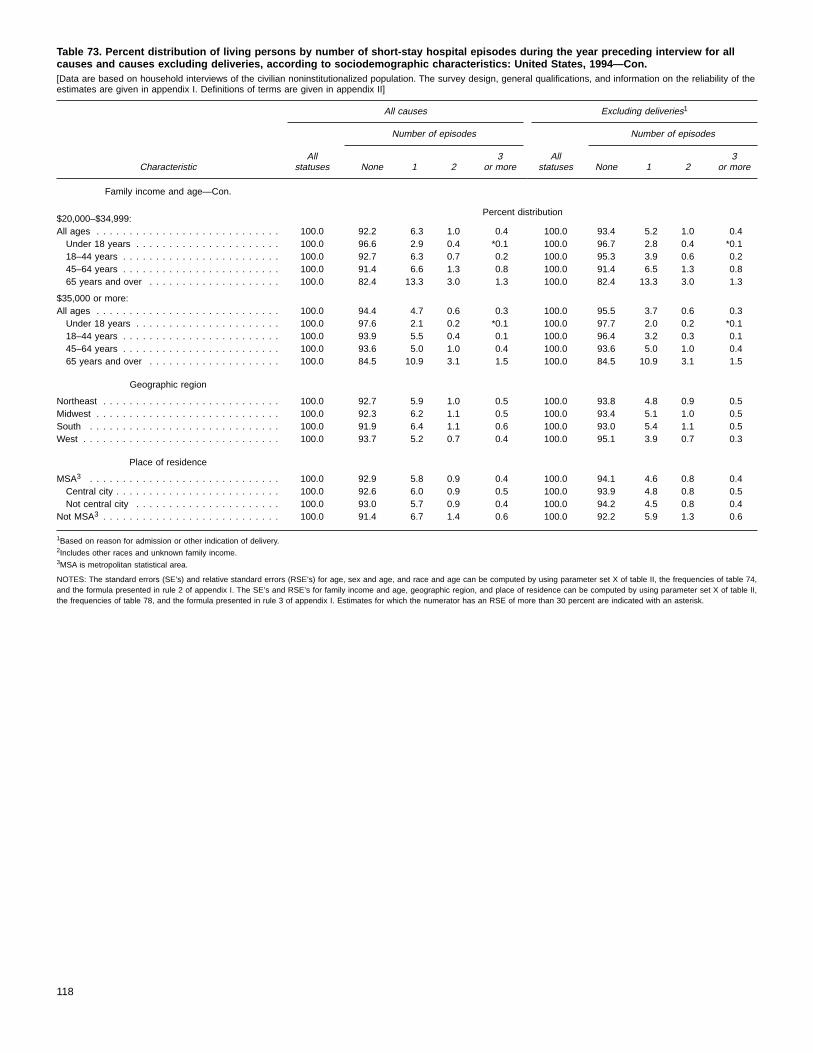
Table 73. Percent distribution of living persons by number of short-stay hospital episodes during the year preceding interview for allcauses and causes excluding deliveries, according to sociodemographic characteristics: United States, 1994—Con.[Data are based on household interviews of the civilian noninstitutionalized population. The survey design, general qualifications, and information on the reliability of theestimates are given in appendix I. Definitions of terms are given in appendix II]
Characteristic
All causes Excluding deliveries1
Allstatuses
Number of episodes
Allstatuses
Number of episodes
None 1 23
or more None 1 23
or more
Family income and age—Con.
$20,000–$34,999:Percent distribution
All ages . . . . . . . . . . . . . . . . . . . . . . . . . . . . 100.0 92.2 6.3 1.0 0.4 100.0 93.4 5.2 1.0 0.4Under 18 years . . . . . . . . . . . . . . . . . . . . . . 100.0 96.6 2.9 0.4 *0.1 100.0 96.7 2.8 0.4 *0.118–44 years . . . . . . . . . . . . . . . . . . . . . . . . 100.0 92.7 6.3 0.7 0.2 100.0 95.3 3.9 0.6 0.245–64 years . . . . . . . . . . . . . . . . . . . . . . . . 100.0 91.4 6.6 1.3 0.8 100.0 91.4 6.5 1.3 0.865 years and over . . . . . . . . . . . . . . . . . . . . 100.0 82.4 13.3 3.0 1.3 100.0 82.4 13.3 3.0 1.3
$35,000 or more:All ages . . . . . . . . . . . . . . . . . . . . . . . . . . . . 100.0 94.4 4.7 0.6 0.3 100.0 95.5 3.7 0.6 0.3Under 18 years . . . . . . . . . . . . . . . . . . . . . . 100.0 97.6 2.1 0.2 *0.1 100.0 97.7 2.0 0.2 *0.118–44 years . . . . . . . . . . . . . . . . . . . . . . . . 100.0 93.9 5.5 0.4 0.1 100.0 96.4 3.2 0.3 0.145–64 years . . . . . . . . . . . . . . . . . . . . . . . . 100.0 93.6 5.0 1.0 0.4 100.0 93.6 5.0 1.0 0.465 years and over . . . . . . . . . . . . . . . . . . . . 100.0 84.5 10.9 3.1 1.5 100.0 84.5 10.9 3.1 1.5
Geographic region
Northeast . . . . . . . . . . . . . . . . . . . . . . . . . . . 100.0 92.7 5.9 1.0 0.5 100.0 93.8 4.8 0.9 0.5Midwest . . . . . . . . . . . . . . . . . . . . . . . . . . . . 100.0 92.3 6.2 1.1 0.5 100.0 93.4 5.1 1.0 0.5South . . . . . . . . . . . . . . . . . . . . . . . . . . . . . 100.0 91.9 6.4 1.1 0.6 100.0 93.0 5.4 1.1 0.5West . . . . . . . . . . . . . . . . . . . . . . . . . . . . . . 100.0 93.7 5.2 0.7 0.4 100.0 95.1 3.9 0.7 0.3
Place of residence
MSA3 . . . . . . . . . . . . . . . . . . . . . . . . . . . . . 100.0 92.9 5.8 0.9 0.4 100.0 94.1 4.6 0.8 0.4Central city . . . . . . . . . . . . . . . . . . . . . . . . . 100.0 92.6 6.0 0.9 0.5 100.0 93.9 4.8 0.8 0.5Not central city . . . . . . . . . . . . . . . . . . . . . . 100.0 93.0 5.7 0.9 0.4 100.0 94.2 4.5 0.8 0.4
Not MSA3 . . . . . . . . . . . . . . . . . . . . . . . . . . . 100.0 91.4 6.7 1.4 0.6 100.0 92.2 5.9 1.3 0.6
1Based on reason for admission or other indication of delivery.2Includes other races and unknown family income.3MSA is metropolitan statistical area.
NOTES: The standard errors (SE’s) and relative standard errors (RSE’s) for age, sex and age, and race and age can be computed by using parameter set X of table II, the frequencies of table 74,and the formula presented in rule 2 of appendix I. The SE’s and RSE’s for family income and age, geographic region, and place of residence can be computed by using parameter set X of table II,the frequencies of table 78, and the formula presented in rule 3 of appendix I. Estimates for which the numerator has an RSE of more than 30 percent are indicated with an asterisk.
118

Table 74. Number of living persons, by number of short-stay hospital episodes during the year preceding interview for all causes andcauses excluding deliveries and by sociodemographic characteristics: United States, 1994[Data are based on household interviews of the civilian noninstitutionalized population. The survey design, general qualifications, and information on the reliability of theestimates are given in appendix I. Definitions of terms are given in appendix II]
Characteristic
All causes Excluding deliveries1
Allstatuses
Number of episodes
Allstatuses
Number of episodes
None 1 23
or more None 1 23
or more
Number of persons in thousands
All persons2 . . . . . . . . . . . . . . . . . . . . . . . . . 259,634 240,258 15,554 2,566 1,255 259,634 243,273 12,735 2,398 1,227
Age
Under 5 years . . . . . . . . . . . . . . . . . . . . . . . . 20,480 19,451 851 110 68 20,480 19,451 851 110 685–17 years . . . . . . . . . . . . . . . . . . . . . . . . . . 49,545 48,388 982 123 53 49,545 48,501 876 115 5318–24 years . . . . . . . . . . . . . . . . . . . . . . . . . 25,285 23,423 1,659 149 55 25,285 24,284 858 93 5125–44 years . . . . . . . . . . . . . . . . . . . . . . . . . 82,893 76,935 5,187 527 243 82,893 78,975 3,276 422 21945–64 years . . . . . . . . . . . . . . . . . . . . . . . . . 50,405 46,356 3,017 668 363 50,405 46,358 3,015 668 36365–74 years . . . . . . . . . . . . . . . . . . . . . . . . . 18,253 15,515 1,992 500 246 18,253 15,515 1,992 500 24675 years and over . . . . . . . . . . . . . . . . . . . . . . 12,772 10,190 1,867 489 227 12,772 10,190 1,867 489 227
Sex and age
Male:All ages . . . . . . . . . . . . . . . . . . . . . . . . . . . . 126,494 118,993 5,844 1,074 582 126,494 118,993 5,844 1,074 582Under 18 years . . . . . . . . . . . . . . . . . . . . . . 35,832 34,696 945 131 60 35,832 34,696 945 131 6018–44 years . . . . . . . . . . . . . . . . . . . . . . . . 53,387 51,367 1,723 179 118 53,387 51,367 1,723 179 11845–64 years . . . . . . . . . . . . . . . . . . . . . . . . 24,344 22,343 1,509 312 180 24,344 22,343 1,509 312 18065 years and over . . . . . . . . . . . . . . . . . . . . 12,932 10,588 1,667 452 225 12,932 10,588 1,667 452 225
Female:All ages . . . . . . . . . . . . . . . . . . . . . . . . . . . . 133,139 121,264 9,710 1,492 673 133,139 124,280 6,891 1,324 645Under 18 years . . . . . . . . . . . . . . . . . . . . . . 34,194 33,143 887 102 62 34,194 33,256 782 94 6218–44 years . . . . . . . . . . . . . . . . . . . . . . . . 54,791 48,992 5,122 496 180 54,791 51,892 2,411 336 15245–64 years . . . . . . . . . . . . . . . . . . . . . . . . 26,061 24,013 1,508 356 183 26,061 24,015 1,506 356 18365 years and over . . . . . . . . . . . . . . . . . . . . 18,094 15,117 2,192 538 248 18,094 15,117 2,192 538 248
Race and age
White:All ages . . . . . . . . . . . . . . . . . . . . . . . . . . . . 214,496 198,366 12,916 2,185 1,029 214,496 200,715 10,714 2,053 1,014Under 18 years . . . . . . . . . . . . . . . . . . . . . . 55,239 53,550 1,424 179 87 55,239 53,622 1,357 173 8718–44 years . . . . . . . . . . . . . . . . . . . . . . . . 88,326 82,083 5,493 532 218 88,326 84,359 3,360 405 20245–64 years . . . . . . . . . . . . . . . . . . . . . . . . 43,182 39,785 2,536 565 296 43,182 39,787 2,534 565 29665 years and over . . . . . . . . . . . . . . . . . . . . 27,749 22,948 3,463 909 429 27,749 22,948 3,463 909 429
Black:All ages . . . . . . . . . . . . . . . . . . . . . . . . . . . . 33,035 30,416 2,085 334 200 33,035 30,897 1,642 308 187Under 18 years . . . . . . . . . . . . . . . . . . . . . . 11,300 10,888 334 45 33 11,300 10,923 302 42 3318–44 years . . . . . . . . . . . . . . . . . . . . . . . . 14,082 12,849 1,049 120 64 14,082 13,296 638 97 5145–64 years . . . . . . . . . . . . . . . . . . . . . . . . 5,129 4,590 385 95 59 5,129 4,590 385 95 5965 years and over . . . . . . . . . . . . . . . . . . . . 2,524 2,089 317 74 44 2,524 2,089 317 74 44
Family income and age
Under $10,000:All ages . . . . . . . . . . . . . . . . . . . . . . . . . . . . 23,363 20,817 1,945 372 228 23,363 21,137 1,641 359 226Under 18 years . . . . . . . . . . . . . . . . . . . . . . 7,030 6,695 290 33 12 7,030 6,706 281 31 1218–44 years . . . . . . . . . . . . . . . . . . . . . . . . 9,458 8,492 805 95 66 9,458 8,801 510 83 6445–64 years . . . . . . . . . . . . . . . . . . . . . . . . 2,808 2,357 306 90 55 2,808 2,357 306 90 5565 years and over . . . . . . . . . . . . . . . . . . . . 4,067 3,272 544 155 96 4,067 3,272 544 155 96
$10,000–$19,999:All ages . . . . . . . . . . . . . . . . . . . . . . . . . . . . 37,271 33,789 2,665 542 276 37,271 34,277 2,218 511 265Under 18 years . . . . . . . . . . . . . . . . . . . . . . 10,103 9,734 281 46 42 10,103 9,762 255 43 4218–44 years . . . . . . . . . . . . . . . . . . . . . . . . 14,347 13,078 1,076 125 68 14,347 13,538 655 97 5745–64 years . . . . . . . . . . . . . . . . . . . . . . . . 5,595 5,007 392 115 81 5,595 5,007 392 115 8165 years and over . . . . . . . . . . . . . . . . . . . . 7,226 5,970 915 256 85 7,226 5,970 915 256 85
See footnotes and notes at end of table.
119
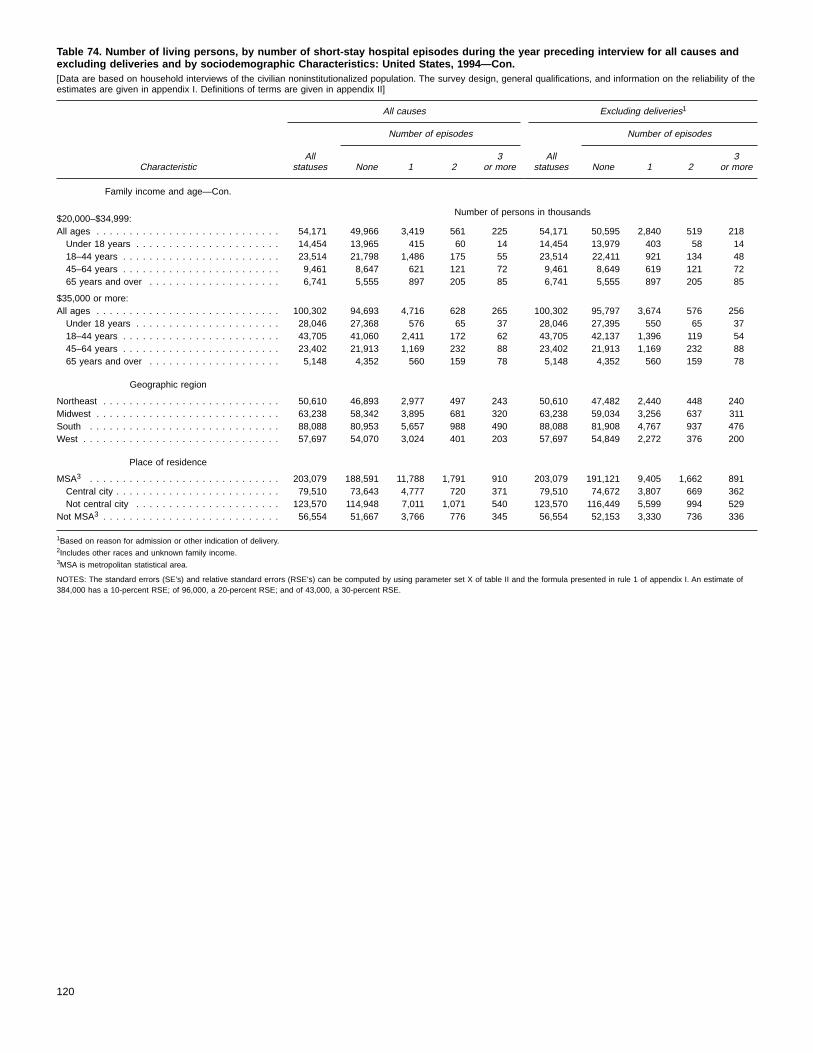
Table 74. Number of living persons, by number of short-stay hospital episodes during the year preceding interview for all causes andexcluding deliveries and by sociodemographic Characteristics: United States, 1994—Con.[Data are based on household interviews of the civilian noninstitutionalized population. The survey design, general qualifications, and information on the reliability of theestimates are given in appendix I. Definitions of terms are given in appendix II]
Characteristic
All causes Excluding deliveries1
Allstatuses
Number of episodes
Allstatuses
Number of episodes
None 1 23
or more None 1 23
or more
Family income and age—Con.
$20,000–$34,999:Number of persons in thousands
All ages . . . . . . . . . . . . . . . . . . . . . . . . . . . . 54,171 49,966 3,419 561 225 54,171 50,595 2,840 519 218Under 18 years . . . . . . . . . . . . . . . . . . . . . . 14,454 13,965 415 60 14 14,454 13,979 403 58 1418–44 years . . . . . . . . . . . . . . . . . . . . . . . . 23,514 21,798 1,486 175 55 23,514 22,411 921 134 4845–64 years . . . . . . . . . . . . . . . . . . . . . . . . 9,461 8,647 621 121 72 9,461 8,649 619 121 7265 years and over . . . . . . . . . . . . . . . . . . . . 6,741 5,555 897 205 85 6,741 5,555 897 205 85
$35,000 or more:All ages . . . . . . . . . . . . . . . . . . . . . . . . . . . . 100,302 94,693 4,716 628 265 100,302 95,797 3,674 576 256Under 18 years . . . . . . . . . . . . . . . . . . . . . . 28,046 27,368 576 65 37 28,046 27,395 550 65 3718–44 years . . . . . . . . . . . . . . . . . . . . . . . . 43,705 41,060 2,411 172 62 43,705 42,137 1,396 119 5445–64 years . . . . . . . . . . . . . . . . . . . . . . . . 23,402 21,913 1,169 232 88 23,402 21,913 1,169 232 8865 years and over . . . . . . . . . . . . . . . . . . . . 5,148 4,352 560 159 78 5,148 4,352 560 159 78
Geographic region
Northeast . . . . . . . . . . . . . . . . . . . . . . . . . . . 50,610 46,893 2,977 497 243 50,610 47,482 2,440 448 240Midwest . . . . . . . . . . . . . . . . . . . . . . . . . . . . 63,238 58,342 3,895 681 320 63,238 59,034 3,256 637 311South . . . . . . . . . . . . . . . . . . . . . . . . . . . . . 88,088 80,953 5,657 988 490 88,088 81,908 4,767 937 476West . . . . . . . . . . . . . . . . . . . . . . . . . . . . . . 57,697 54,070 3,024 401 203 57,697 54,849 2,272 376 200
Place of residence
MSA3 . . . . . . . . . . . . . . . . . . . . . . . . . . . . . 203,079 188,591 11,788 1,791 910 203,079 191,121 9,405 1,662 891Central city . . . . . . . . . . . . . . . . . . . . . . . . . 79,510 73,643 4,777 720 371 79,510 74,672 3,807 669 362Not central city . . . . . . . . . . . . . . . . . . . . . . 123,570 114,948 7,011 1,071 540 123,570 116,449 5,599 994 529
Not MSA3 . . . . . . . . . . . . . . . . . . . . . . . . . . . 56,554 51,667 3,766 776 345 56,554 52,153 3,330 736 336
1Based on reason for admission or other indication of delivery.2Includes other races and unknown family income.3MSA is metropolitan statistical area.
NOTES: The standard errors (SE’s) and relative standard errors (RSE’s) can be computed by using parameter set X of table II and the formula presented in rule 1 of appendix I. An estimate of384,000 has a 10-percent RSE; of 96,000, a 20-percent RSE; and of 43,000, a 30-percent RSE.
120

Table 75. Number of short-stay hospital days during the year preceding interview per living person hospitalized for all causes andexcluding deliveries, by number of episodes and sociodemographic characteristics: United States, 1994[Data are based on household interviews of the civilian noninstitutionalized population. The survey design, general qualifications, and information on the reliability of theestimates are given in appendix I. Definitions of terms are given in appendix II]
Characteristic
All causes Excluding deliveries1
Allstatuses
Number of episodes
Allstatuses
Number of episodes
1 23
or more 1 23
or more
Days per person hospitalizedAll persons2 . . . . . . . . . . . . . . . . . . . . . . . . . 7.4 5.1 12.4 26.1 8.3 5.7 12.7 26.5
Age
Under 5 years . . . . . . . . . . . . . . . . . . . . . . . . 7.9 6.0 9.9 28.6 7.9 6.0 9.9 28.65–17 years . . . . . . . . . . . . . . . . . . . . . . . . . . 6.4 4.9 13.5 17.3 6.7 5.3 13.1 16.818–24 years . . . . . . . . . . . . . . . . . . . . . . . . . 3.9 3.0 8.3 18.4 5.1 3.8 9.7 18.325–44 years . . . . . . . . . . . . . . . . . . . . . . . . . 5.3 3.9 11.1 22.8 6.7 4.8 11.8 24.445–64 years . . . . . . . . . . . . . . . . . . . . . . . . . 8.2 5.4 11.8 24.8 8.2 5.4 11.8 24.865–74 years . . . . . . . . . . . . . . . . . . . . . . . . . 10.0 6.7 14.0 28.5 10.0 6.7 14.0 28.575 years and over . . . . . . . . . . . . . . . . . . . . . . 11.2 7.7 14.7 32.2 11.2 7.7 14.7 32.2
Sex and age
Male:All ages . . . . . . . . . . . . . . . . . . . . . . . . . . . . 9.1 6.2 13.1 30.7 9.1 6.2 13.1 30.7Under 18 years . . . . . . . . . . . . . . . . . . . . . . 7.6 5.9 12.7 22.6 7.6 5.9 12.7 22.618–44 years . . . . . . . . . . . . . . . . . . . . . . . . 7.6 5.5 13.4 29.9 7.6 5.5 13.4 29.945–64 years . . . . . . . . . . . . . . . . . . . . . . . . 8.6 5.4 12.6 27.9 8.6 5.4 12.6 27.965 years and over . . . . . . . . . . . . . . . . . . . . 11.5 7.7 13.5 35.4 11.5 7.7 13.5 35.4
Female:All ages . . . . . . . . . . . . . . . . . . . . . . . . . . . . 6.4 4.4 11.9 22.1 7.6 5.3 12.4 22.6Under 18 years . . . . . . . . . . . . . . . . . . . . . . 6.6 4.9 10.7 24.3 7.0 5.3 10.0 23.818–44 years . . . . . . . . . . . . . . . . . . . . . . . . 4.0 3.0 9.4 16.8 5.4 3.9 10.4 18.245–64 years . . . . . . . . . . . . . . . . . . . . . . . . 7.8 5.3 11.1 21.8 7.8 5.3 11.1 21.865 years and over . . . . . . . . . . . . . . . . . . . . 9.9 6.8 15.0 25.7 9.9 6.8 15.0 25.7
Race and age
White:All ages . . . . . . . . . . . . . . . . . . . . . . . . . . . . 7.3 4.9 12.4 25.8 8.1 5.5 12.7 26.0Under 18 years . . . . . . . . . . . . . . . . . . . . . . 6.5 4.8 12.7 22.0 6.7 5.0 12.4 21.918–44 years . . . . . . . . . . . . . . . . . . . . . . . . 4.8 3.6 9.8 20.5 6.1 4.6 10.8 21.445–64 years . . . . . . . . . . . . . . . . . . . . . . . . 7.6 4.9 11.7 23.7 7.6 4.9 11.7 23.765 years and over . . . . . . . . . . . . . . . . . . . . 10.5 7.0 14.2 30.6 10.5 7.0 14.2 30.6
Black:All ages . . . . . . . . . . . . . . . . . . . . . . . . . . . . 8.5 5.9 12.0 29.1 9.6 6.8 12.2 30.4Under 18 years . . . . . . . . . . . . . . . . . . . . . . 9.9 8.2 *9.4 28.5 10.5 8.7 *9.5 27.818–44 years . . . . . . . . . . . . . . . . . . . . . . . . 6.0 4.1 10.5 29.3 7.5 4.9 10.6 34.845–64 years . . . . . . . . . . . . . . . . . . . . . . . . 10.6 7.3 11.9 30.2 10.6 7.3 11.9 30.265 years and over . . . . . . . . . . . . . . . . . . . . 11.4 8.1 16.1 27.6 11.4 8.1 16.1 27.6
Family income and age
Under $10,000:All ages . . . . . . . . . . . . . . . . . . . . . . . . . . . . 9.1 6.2 14.5 24.5 9.9 6.9 14.4 24.6Under 18 years . . . . . . . . . . . . . . . . . . . . . . 8.5 6.9 *16.4 *25.3 8.7 7.0 *17.2 *25.318–44 years . . . . . . . . . . . . . . . . . . . . . . . . 6.5 4.4 11.4 24.2 8.1 5.8 10.2 24.545–64 years . . . . . . . . . . . . . . . . . . . . . . . . 11.8 8.7 15.3 22.9 11.8 8.7 15.3 22.965 years and over . . . . . . . . . . . . . . . . . . . . 10.9 7.0 15.5 25.2 10.9 7.0 15.5 25.2
$10,000–$19,999:All ages . . . . . . . . . . . . . . . . . . . . . . . . . . . . 9.3 6.5 13.7 28.3 10.4 7.3 14.0 29.1Under 18 years . . . . . . . . . . . . . . . . . . . . . . 8.8 6.1 *10.2 25.2 9.3 6.5 *10.3 24.918–44 years . . . . . . . . . . . . . . . . . . . . . . . . 6.0 4.4 11.6 19.9 7.8 5.8 12.7 22.245–64 years . . . . . . . . . . . . . . . . . . . . . . . . 12.1 7.6 15.2 29.5 12.1 7.6 15.2 29.565 years and over . . . . . . . . . . . . . . . . . . . . 11.6 8.6 14.7 35.5 11.6 8.6 14.7 35.5
See footnotes and notes at end of table.
121
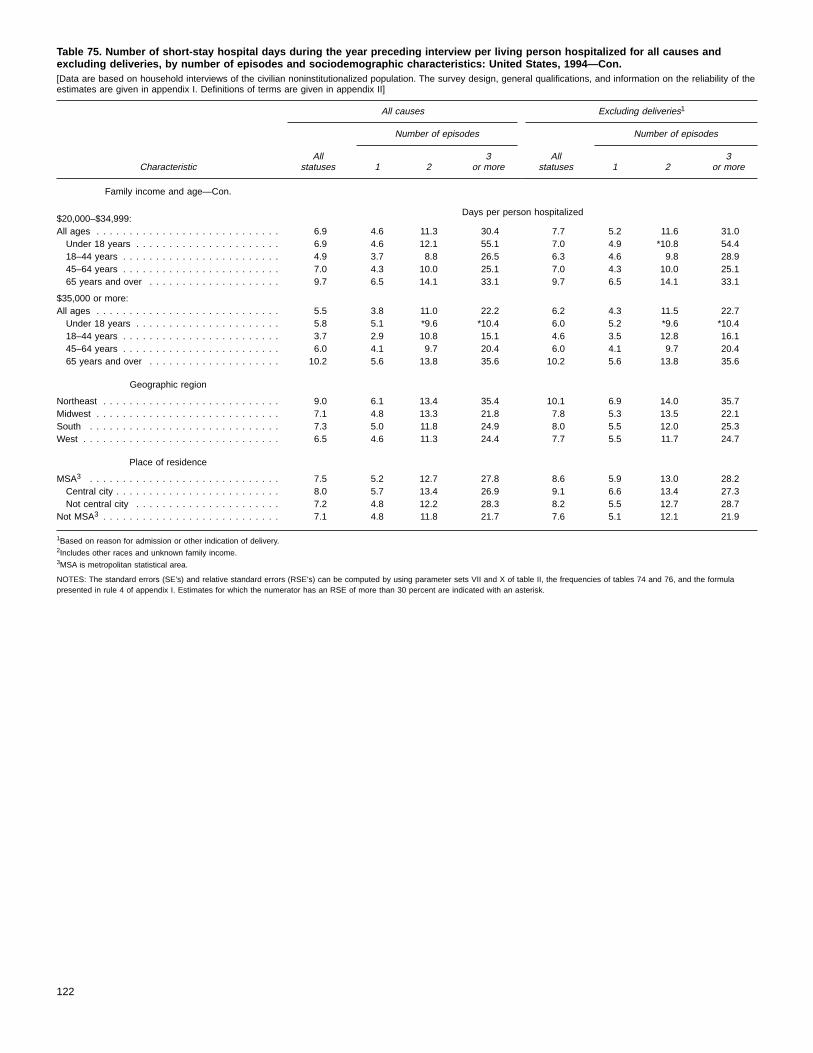
Table 75. Number of short-stay hospital days during the year preceding interview per living person hospitalized for all causes andexcluding deliveries, by number of episodes and sociodemographic characteristics: United States, 1994—Con.[Data are based on household interviews of the civilian noninstitutionalized population. The survey design, general qualifications, and information on the reliability of theestimates are given in appendix I. Definitions of terms are given in appendix II]
Characteristic
All causes Excluding deliveries1
Allstatuses
Number of episodes
Allstatuses
Number of episodes
1 23
or more 1 23
or more
Family income and age—Con.
$20,000–$34,999:Days per person hospitalized
All ages . . . . . . . . . . . . . . . . . . . . . . . . . . . . 6.9 4.6 11.3 30.4 7.7 5.2 11.6 31.0Under 18 years . . . . . . . . . . . . . . . . . . . . . . 6.9 4.6 12.1 55.1 7.0 4.9 *10.8 54.418–44 years . . . . . . . . . . . . . . . . . . . . . . . . 4.9 3.7 8.8 26.5 6.3 4.6 9.8 28.945–64 years . . . . . . . . . . . . . . . . . . . . . . . . 7.0 4.3 10.0 25.1 7.0 4.3 10.0 25.165 years and over . . . . . . . . . . . . . . . . . . . . 9.7 6.5 14.1 33.1 9.7 6.5 14.1 33.1
$35,000 or more:All ages . . . . . . . . . . . . . . . . . . . . . . . . . . . . 5.5 3.8 11.0 22.2 6.2 4.3 11.5 22.7Under 18 years . . . . . . . . . . . . . . . . . . . . . . 5.8 5.1 *9.6 *10.4 6.0 5.2 *9.6 *10.418–44 years . . . . . . . . . . . . . . . . . . . . . . . . 3.7 2.9 10.8 15.1 4.6 3.5 12.8 16.145–64 years . . . . . . . . . . . . . . . . . . . . . . . . 6.0 4.1 9.7 20.4 6.0 4.1 9.7 20.465 years and over . . . . . . . . . . . . . . . . . . . . 10.2 5.6 13.8 35.6 10.2 5.6 13.8 35.6
Geographic region
Northeast . . . . . . . . . . . . . . . . . . . . . . . . . . . 9.0 6.1 13.4 35.4 10.1 6.9 14.0 35.7Midwest . . . . . . . . . . . . . . . . . . . . . . . . . . . . 7.1 4.8 13.3 21.8 7.8 5.3 13.5 22.1South . . . . . . . . . . . . . . . . . . . . . . . . . . . . . 7.3 5.0 11.8 24.9 8.0 5.5 12.0 25.3West . . . . . . . . . . . . . . . . . . . . . . . . . . . . . . 6.5 4.6 11.3 24.4 7.7 5.5 11.7 24.7
Place of residence
MSA3 . . . . . . . . . . . . . . . . . . . . . . . . . . . . . 7.5 5.2 12.7 27.8 8.6 5.9 13.0 28.2Central city . . . . . . . . . . . . . . . . . . . . . . . . . 8.0 5.7 13.4 26.9 9.1 6.6 13.4 27.3Not central city . . . . . . . . . . . . . . . . . . . . . . 7.2 4.8 12.2 28.3 8.2 5.5 12.7 28.7
Not MSA3 . . . . . . . . . . . . . . . . . . . . . . . . . . . 7.1 4.8 11.8 21.7 7.6 5.1 12.1 21.9
1Based on reason for admission or other indication of delivery.2Includes other races and unknown family income.3MSA is metropolitan statistical area.
NOTES: The standard errors (SE’s) and relative standard errors (RSE’s) can be computed by using parameter sets VII and X of table II, the frequencies of tables 74 and 76, and the formulapresented in rule 4 of appendix I. Estimates for which the numerator has an RSE of more than 30 percent are indicated with an asterisk.
122
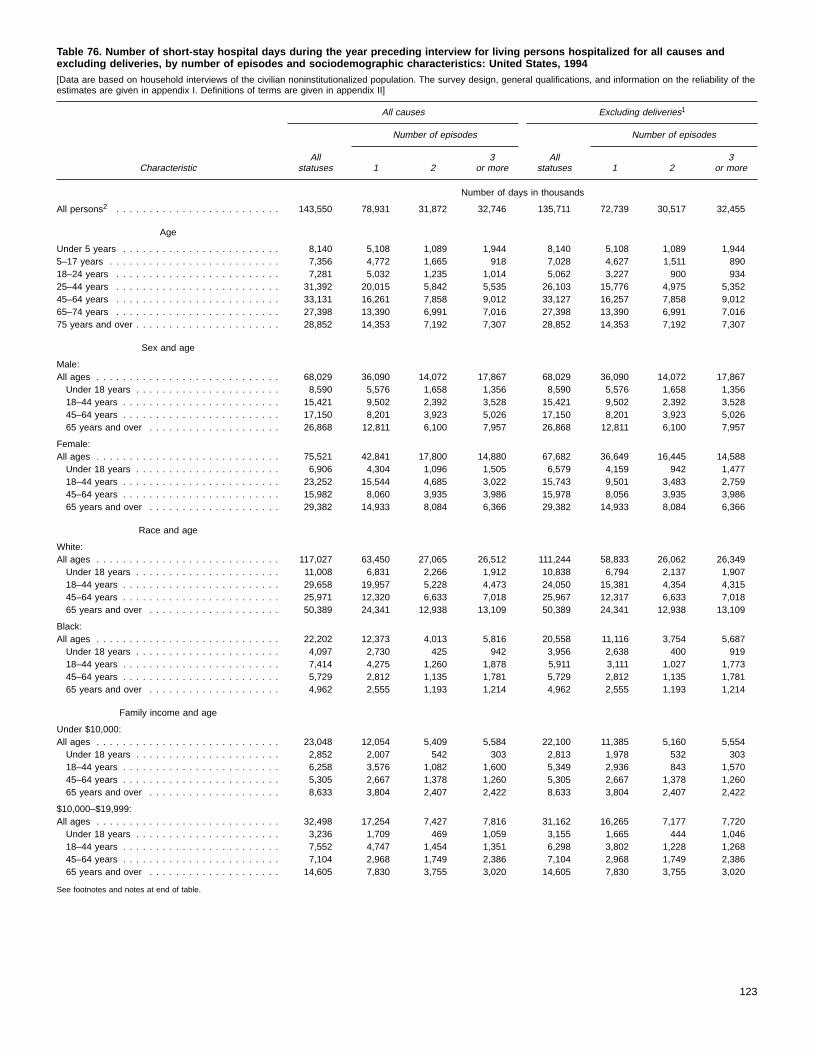
Table 76. Number of short-stay hospital days during the year preceding interview for living persons hospitalized for all causes andexcluding deliveries, by number of episodes and sociodemographic characteristics: United States, 1994[Data are based on household interviews of the civilian noninstitutionalized population. The survey design, general qualifications, and information on the reliability of theestimates are given in appendix I. Definitions of terms are given in appendix II]
Characteristic
All causes Excluding deliveries1
Allstatuses
Number of episodes
Allstatuses
Number of episodes
1 23
or more 1 23
or more
Number of days in thousands
All persons2 . . . . . . . . . . . . . . . . . . . . . . . . . 143,550 78,931 31,872 32,746 135,711 72,739 30,517 32,455
Age
Under 5 years . . . . . . . . . . . . . . . . . . . . . . . . 8,140 5,108 1,089 1,944 8,140 5,108 1,089 1,9445–17 years . . . . . . . . . . . . . . . . . . . . . . . . . . 7,356 4,772 1,665 918 7,028 4,627 1,511 89018–24 years . . . . . . . . . . . . . . . . . . . . . . . . . 7,281 5,032 1,235 1,014 5,062 3,227 900 93425–44 years . . . . . . . . . . . . . . . . . . . . . . . . . 31,392 20,015 5,842 5,535 26,103 15,776 4,975 5,35245–64 years . . . . . . . . . . . . . . . . . . . . . . . . . 33,131 16,261 7,858 9,012 33,127 16,257 7,858 9,01265–74 years . . . . . . . . . . . . . . . . . . . . . . . . . 27,398 13,390 6,991 7,016 27,398 13,390 6,991 7,01675 years and over . . . . . . . . . . . . . . . . . . . . . . 28,852 14,353 7,192 7,307 28,852 14,353 7,192 7,307
Sex and age
Male:All ages . . . . . . . . . . . . . . . . . . . . . . . . . . . . 68,029 36,090 14,072 17,867 68,029 36,090 14,072 17,867Under 18 years . . . . . . . . . . . . . . . . . . . . . . 8,590 5,576 1,658 1,356 8,590 5,576 1,658 1,35618–44 years . . . . . . . . . . . . . . . . . . . . . . . . 15,421 9,502 2,392 3,528 15,421 9,502 2,392 3,52845–64 years . . . . . . . . . . . . . . . . . . . . . . . . 17,150 8,201 3,923 5,026 17,150 8,201 3,923 5,02665 years and over . . . . . . . . . . . . . . . . . . . . 26,868 12,811 6,100 7,957 26,868 12,811 6,100 7,957
Female:All ages . . . . . . . . . . . . . . . . . . . . . . . . . . . . 75,521 42,841 17,800 14,880 67,682 36,649 16,445 14,588Under 18 years . . . . . . . . . . . . . . . . . . . . . . 6,906 4,304 1,096 1,505 6,579 4,159 942 1,47718–44 years . . . . . . . . . . . . . . . . . . . . . . . . 23,252 15,544 4,685 3,022 15,743 9,501 3,483 2,75945–64 years . . . . . . . . . . . . . . . . . . . . . . . . 15,982 8,060 3,935 3,986 15,978 8,056 3,935 3,98665 years and over . . . . . . . . . . . . . . . . . . . . 29,382 14,933 8,084 6,366 29,382 14,933 8,084 6,366
Race and age
White:All ages . . . . . . . . . . . . . . . . . . . . . . . . . . . . 117,027 63,450 27,065 26,512 111,244 58,833 26,062 26,349Under 18 years . . . . . . . . . . . . . . . . . . . . . . 11,008 6,831 2,266 1,912 10,838 6,794 2,137 1,90718–44 years . . . . . . . . . . . . . . . . . . . . . . . . 29,658 19,957 5,228 4,473 24,050 15,381 4,354 4,31545–64 years . . . . . . . . . . . . . . . . . . . . . . . . 25,971 12,320 6,633 7,018 25,967 12,317 6,633 7,01865 years and over . . . . . . . . . . . . . . . . . . . . 50,389 24,341 12,938 13,109 50,389 24,341 12,938 13,109
Black:All ages . . . . . . . . . . . . . . . . . . . . . . . . . . . . 22,202 12,373 4,013 5,816 20,558 11,116 3,754 5,687Under 18 years . . . . . . . . . . . . . . . . . . . . . . 4,097 2,730 425 942 3,956 2,638 400 91918–44 years . . . . . . . . . . . . . . . . . . . . . . . . 7,414 4,275 1,260 1,878 5,911 3,111 1,027 1,77345–64 years . . . . . . . . . . . . . . . . . . . . . . . . 5,729 2,812 1,135 1,781 5,729 2,812 1,135 1,78165 years and over . . . . . . . . . . . . . . . . . . . . 4,962 2,555 1,193 1,214 4,962 2,555 1,193 1,214
Family income and age
Under $10,000:All ages . . . . . . . . . . . . . . . . . . . . . . . . . . . . 23,048 12,054 5,409 5,584 22,100 11,385 5,160 5,554Under 18 years . . . . . . . . . . . . . . . . . . . . . . 2,852 2,007 542 303 2,813 1,978 532 30318–44 years . . . . . . . . . . . . . . . . . . . . . . . . 6,258 3,576 1,082 1,600 5,349 2,936 843 1,57045–64 years . . . . . . . . . . . . . . . . . . . . . . . . 5,305 2,667 1,378 1,260 5,305 2,667 1,378 1,26065 years and over . . . . . . . . . . . . . . . . . . . . 8,633 3,804 2,407 2,422 8,633 3,804 2,407 2,422
$10,000–$19,999:All ages . . . . . . . . . . . . . . . . . . . . . . . . . . . . 32,498 17,254 7,427 7,816 31,162 16,265 7,177 7,720Under 18 years . . . . . . . . . . . . . . . . . . . . . . 3,236 1,709 469 1,059 3,155 1,665 444 1,04618–44 years . . . . . . . . . . . . . . . . . . . . . . . . 7,552 4,747 1,454 1,351 6,298 3,802 1,228 1,26845–64 years . . . . . . . . . . . . . . . . . . . . . . . . 7,104 2,968 1,749 2,386 7,104 2,968 1,749 2,38665 years and over . . . . . . . . . . . . . . . . . . . . 14,605 7,830 3,755 3,020 14,605 7,830 3,755 3,020
See footnotes and notes at end of table.
123
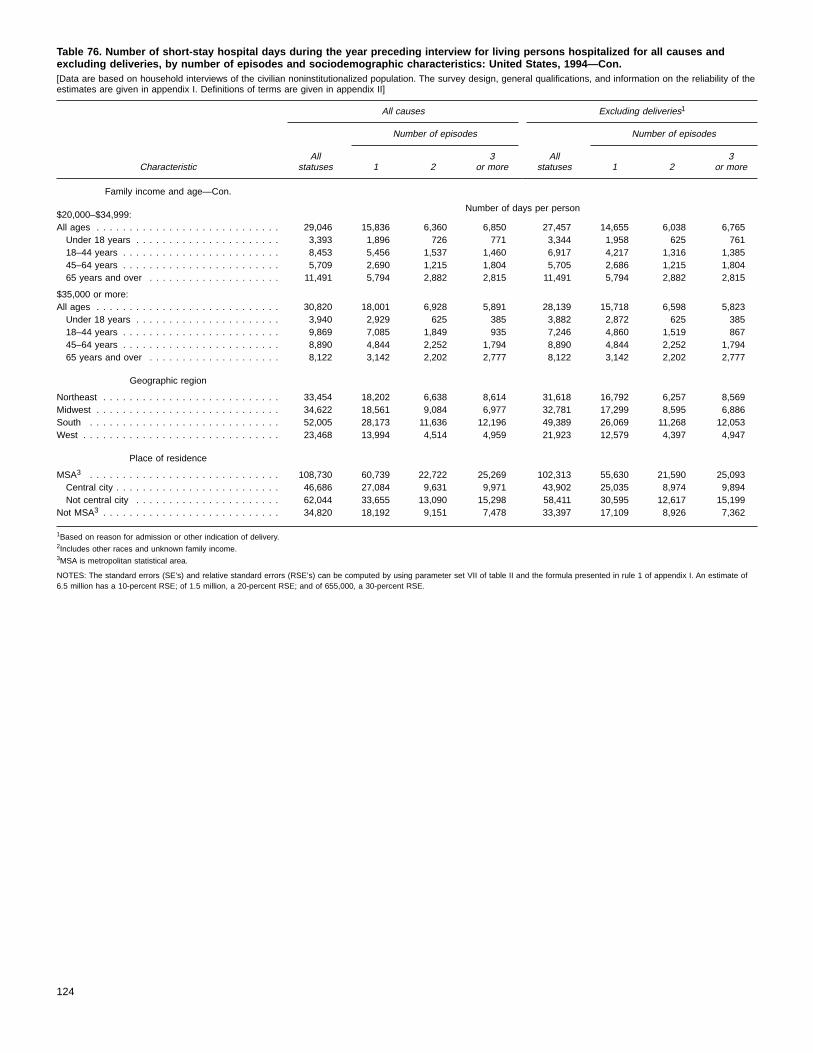
Table 76. Number of short-stay hospital days during the year preceding interview for living persons hospitalized for all causes andexcluding deliveries, by number of episodes and sociodemographic characteristics: United States, 1994—Con.[Data are based on household interviews of the civilian noninstitutionalized population. The survey design, general qualifications, and information on the reliability of theestimates are given in appendix I. Definitions of terms are given in appendix II]
Characteristic
All causes Excluding deliveries1
Allstatuses
Number of episodes
Allstatuses
Number of episodes
1 23
or more 1 23
or more
Family income and age—Con.
$20,000–$34,999:Number of days per person
All ages . . . . . . . . . . . . . . . . . . . . . . . . . . . . 29,046 15,836 6,360 6,850 27,457 14,655 6,038 6,765Under 18 years . . . . . . . . . . . . . . . . . . . . . . 3,393 1,896 726 771 3,344 1,958 625 76118–44 years . . . . . . . . . . . . . . . . . . . . . . . . 8,453 5,456 1,537 1,460 6,917 4,217 1,316 1,38545–64 years . . . . . . . . . . . . . . . . . . . . . . . . 5,709 2,690 1,215 1,804 5,705 2,686 1,215 1,80465 years and over . . . . . . . . . . . . . . . . . . . . 11,491 5,794 2,882 2,815 11,491 5,794 2,882 2,815
$35,000 or more:All ages . . . . . . . . . . . . . . . . . . . . . . . . . . . . 30,820 18,001 6,928 5,891 28,139 15,718 6,598 5,823Under 18 years . . . . . . . . . . . . . . . . . . . . . . 3,940 2,929 625 385 3,882 2,872 625 38518–44 years . . . . . . . . . . . . . . . . . . . . . . . . 9,869 7,085 1,849 935 7,246 4,860 1,519 86745–64 years . . . . . . . . . . . . . . . . . . . . . . . . 8,890 4,844 2,252 1,794 8,890 4,844 2,252 1,79465 years and over . . . . . . . . . . . . . . . . . . . . 8,122 3,142 2,202 2,777 8,122 3,142 2,202 2,777
Geographic region
Northeast . . . . . . . . . . . . . . . . . . . . . . . . . . . 33,454 18,202 6,638 8,614 31,618 16,792 6,257 8,569Midwest . . . . . . . . . . . . . . . . . . . . . . . . . . . . 34,622 18,561 9,084 6,977 32,781 17,299 8,595 6,886South . . . . . . . . . . . . . . . . . . . . . . . . . . . . . 52,005 28,173 11,636 12,196 49,389 26,069 11,268 12,053West . . . . . . . . . . . . . . . . . . . . . . . . . . . . . . 23,468 13,994 4,514 4,959 21,923 12,579 4,397 4,947
Place of residence
MSA3 . . . . . . . . . . . . . . . . . . . . . . . . . . . . . 108,730 60,739 22,722 25,269 102,313 55,630 21,590 25,093Central city . . . . . . . . . . . . . . . . . . . . . . . . . 46,686 27,084 9,631 9,971 43,902 25,035 8,974 9,894Not central city . . . . . . . . . . . . . . . . . . . . . . 62,044 33,655 13,090 15,298 58,411 30,595 12,617 15,199
Not MSA3 . . . . . . . . . . . . . . . . . . . . . . . . . . . 34,820 18,192 9,151 7,478 33,397 17,109 8,926 7,362
1Based on reason for admission or other indication of delivery.2Includes other races and unknown family income.3MSA is metropolitan statistical area.
NOTES: The standard errors (SE’s) and relative standard errors (RSE’s) can be computed by using parameter set VII of table II and the formula presented in rule 1 of appendix I. An estimate of6.5 million has a 10-percent RSE; of 1.5 million, a 20-percent RSE; and of 655,000, a 30-percent RSE.
124

Table 77. Number per 100 persons per year and annual number of short-stay hospital discharges, average length of stay and annualnumber of hospital days for living persons hospitalized for all causes and excluding deliveries by sociodemographic characteristics:United States, 1994[Data are based on household interviews of the civilian noninstitutionalized population. The survey design, general qualifications, and information on the reliability of theestimates are given in appendix I. Definitions of terms are given in appendix II]
Characteristic
All causes1 Excluding deliveries2
Hospital discharges Hospital days Hospital discharges Hospital days
Numberper 100persons
Number inthousands
Averagelengthof stay
Number inthousands
Numberper 100persons
Number inthousands
Averagelengthof stay
Number inthousands
All persons3 . . . . . . . . . . . . . . . . . . . . . . . . . 10.6 27,400 5.9 161,469 9.3 24,101 6.4 153,532
Age
Under 5 years . . . . . . . . . . . . . . . . . . . . . . . . 6.8 1,387 6.3 8,678 6.8 1,387 6.3 8,6785–17 years . . . . . . . . . . . . . . . . . . . . . . . . . . 3.4 1,681 5.2 8,804 3.1 1,529 5.5 8,43018–24 years . . . . . . . . . . . . . . . . . . . . . . . . . 9.0 2,276 3.5 8,067 5.6 1,405 4.2 5,97025–44 years . . . . . . . . . . . . . . . . . . . . . . . . . 9.1 7,572 4.7 35,330 6.4 5,297 5.6 29,86345–64 years . . . . . . . . . . . . . . . . . . . . . . . . . 12.2 6,142 5.8 35,864 12.2 6,142 5.8 35,86465–74 years . . . . . . . . . . . . . . . . . . . . . . . . . 23.0 4,200 7.2 30,093 23.0 4,200 7.2 30,09375 years and over . . . . . . . . . . . . . . . . . . . . . . 32.4 4,141 8.4 34,633 32.4 4,141 8.4 34,633
Sex and age
Male:All ages . . . . . . . . . . . . . . . . . . . . . . . . . . . . 8.7 11,059 7.0 77,880 8.7 11,059 7.0 77,880Under 18 years . . . . . . . . . . . . . . . . . . . . . . 4.3 1,535 6.4 9,882 4.3 1,535 6.4 9,88218–44 years . . . . . . . . . . . . . . . . . . . . . . . . 5.2 2,785 6.4 17,784 5.2 2,785 6.4 17,78445–64 years . . . . . . . . . . . . . . . . . . . . . . . . 12.3 2,986 6.3 18,931 12.3 2,986 6.3 18,93165 years and over . . . . . . . . . . . . . . . . . . . . 29.0 3,754 8.3 31,283 29.0 3,754 8.3 31,283
Female:All ages . . . . . . . . . . . . . . . . . . . . . . . . . . . . 12.3 16,341 5.1 83,589 9.8 13,042 5.8 75,651Under 18 years . . . . . . . . . . . . . . . . . . . . . . 4.5 1,534 5.0 7,599 4.0 1,382 5.2 7,22618–44 years . . . . . . . . . . . . . . . . . . . . . . . . 12.9 7,064 3.6 25,613 7.1 3,917 4.6 18,04945–64 years . . . . . . . . . . . . . . . . . . . . . . . . 12.1 3,156 5.4 16,933 12.1 3,156 5.4 16,93365 years and over . . . . . . . . . . . . . . . . . . . . 25.4 4,587 7.3 33,444 25.4 4,587 7.3 33,444
Race and age
White:All ages . . . . . . . . . . . . . . . . . . . . . . . . . . . . 10.5 22,555 5.8 130,726 9.4 20,060 6.2 125,139Under 18 years . . . . . . . . . . . . . . . . . . . . . . 4.0 2,233 5.4 12,116 3.9 2,144 5.6 11,94518–44 years . . . . . . . . . . . . . . . . . . . . . . . . 8.7 7,673 4.4 33,885 6.0 5,267 5.4 28,46945–64 years . . . . . . . . . . . . . . . . . . . . . . . . 11.8 5,084 5.4 27,415 11.8 5,084 5.4 27,41565 years and over . . . . . . . . . . . . . . . . . . . . 27.3 7,565 7.6 57,309 27.3 7,565 7.6 57,309
Black:All ages . . . . . . . . . . . . . . . . . . . . . . . . . . . . 12.1 3,991 6.1 24,149 10.3 3,401 6.5 22,183Under 18 years . . . . . . . . . . . . . . . . . . . . . . 6.4 723 6.9 4,983 6.0 674 7.1 4,81118–44 years . . . . . . . . . . . . . . . . . . . . . . . . 12.1 1,708 4.5 7,657 8.3 1,167 5.0 5,86445–64 years . . . . . . . . . . . . . . . . . . . . . . . . 17.2 883 7.0 6,138 17.2 883 7.0 6,13865 years and over . . . . . . . . . . . . . . . . . . . . 26.8 676 7.9 5,371 26.8 676 7.9 5,371
Family income and age
Under $10,000:All ages . . . . . . . . . . . . . . . . . . . . . . . . . . . . 16.3 3,816 6.5 24,805 14.8 3,452 6.9 23,804Under 18 years . . . . . . . . . . . . . . . . . . . . . . 6.8 481 6.8 3,283 6.7 474 6.9 3,26318–44 years . . . . . . . . . . . . . . . . . . . . . . . . 14.1 1,329 4.6 6,095 10.3 971 5.3 5,11545–64 years . . . . . . . . . . . . . . . . . . . . . . . . 24.6 692 7.8 5,381 24.6 692 7.8 5,38165 years and over . . . . . . . . . . . . . . . . . . . . 32.3 1,314 7.6 10,045 32.3 1,314 7.6 10,045
$10,000–$19,999:All ages . . . . . . . . . . . . . . . . . . . . . . . . . . . . 14.4 5,358 7.2 38,780 12.7 4,734 7.9 37,237Under 18 years . . . . . . . . . . . . . . . . . . . . . . 5.9 601 6.3 3,778 5.5 555 6.6 3,65318–44 years . . . . . . . . . . . . . . . . . . . . . . . . 12.2 1,754 4.9 8,636 8.2 1,176 6.1 7,21845–64 years . . . . . . . . . . . . . . . . . . . . . . . . 17.9 1,002 8.4 8,393 17.9 1,002 8.4 8,39365 years and over . . . . . . . . . . . . . . . . . . . . 27.7 2,000 9.0 17,973 27.7 2,000 9.0 17,973
See footnotes and notes at end of table.
125

Table 77. Number per 100 persons per year and annual number of short-stay hospital discharges, average length of stay and annualnumber of hospital days for living persons hospitalized for all causes and excluding deliveries by sociodemographic characteristics:United States, 1994—Con.[Data are based on household interviews of the civilian noninstitutionalized population. The survey design, general qualifications, and information on the reliability of theestimates are given in appendix I. Definitions of terms are given in appendix II]
Characteristic
All causes1 Excluding deliveries2
Hospital discharges Hospital days Hospital discharges Hospital days
Family income and age—Con.
Numberper 100persons
Number inthousands
Averagelengthof stay
Number inthousands
Numberper 100persons
Number inthousands
Averagelengthof stay
Number inthousands
$20,000–$34,999:All ages . . . . . . . . . . . . . . . . . . . . . . . . . . . . 10.7 5,787 5.7 33,159 9.4 5,070 6.2 31,555Under 18 years . . . . . . . . . . . . . . . . . . . . . . 4.7 673 5.5 3,687 4.5 650 5.6 3,64218–44 years . . . . . . . . . . . . . . . . . . . . . . . . 9.3 2,190 5.1 11,081 6.4 1,496 6.4 9,52245–64 years . . . . . . . . . . . . . . . . . . . . . . . . 12.7 1,203 4.9 5,913 12.7 1,203 4.9 5,91365 years and over . . . . . . . . . . . . . . . . . . . . 25.5 1,721 7.3 12,479 25.5 1,721 7.3 12,479
$35,000 or more:All ages . . . . . . . . . . . . . . . . . . . . . . . . . . . . 7.2 7,201 4.7 33,924 6.1 6,113 5.1 31,450Under 18 years . . . . . . . . . . . . . . . . . . . . . . 3.1 863 4.8 4,170 3.0 829 5.0 4,11218–44 years . . . . . . . . . . . . . . . . . . . . . . . . 6.9 3,027 3.5 10,546 4.5 1,973 4.1 8,13045–64 years . . . . . . . . . . . . . . . . . . . . . . . . 8.8 2,063 4.8 9,854 8.8 2,063 4.8 9,85465 years and over . . . . . . . . . . . . . . . . . . . . 24.2 1,248 7.5 9,354 24.2 1,248 7.5 9,354
Geographic region
Northeast . . . . . . . . . . . . . . . . . . . . . . . . . . . 10.3 5,225 7.3 37,915 9.1 4,597 7.8 36,058Midwest . . . . . . . . . . . . . . . . . . . . . . . . . . . . 11.0 6,986 5.5 38,769 9.8 6,220 5.9 36,956South . . . . . . . . . . . . . . . . . . . . . . . . . . . . . 11.7 10,319 5.6 57,573 10.4 9,189 6.0 54,761West . . . . . . . . . . . . . . . . . . . . . . . . . . . . . . 8.4 4,870 5.6 27,212 7.1 4,097 6.3 25,756
Place of residence
MSA4 . . . . . . . . . . . . . . . . . . . . . . . . . . . . . 10.0 20,223 6.1 124,135 8.6 17,558 6.7 117,783Central city . . . . . . . . . . . . . . . . . . . . . . . . . 10.6 8,394 6.4 54,091 9.1 7,213 7.1 51,079Not central city . . . . . . . . . . . . . . . . . . . . . . 9.6 11,829 5.9 70,044 8.4 10,345 6.4 66,704
Not MSA4 . . . . . . . . . . . . . . . . . . . . . . . . . . . 12.7 7,177 5.2 37,334 11.6 6,543 5.5 35,749
1Includes unknown cause; based on 6-month reference period.2Based on reason for admission or other indication of delivery.3Includes other races and unknown family income.4MSA is metropolitan statistical area.
NOTES: The standard errors (SE’s) and relative standard errors (RSE’s) for age, sex and age, and race and age for columns 1 and 5 can be computed by using parameter set VIII of table II, thefrequencies of table 77, and the formula presented in rule 2 of appendix I. The SE’s and RSE’s for family income and age, geographic region, and place of residence for columns 1 and 5 can becomputed by using parameter sets VIII and X of table II, the frequencies of tables 77 and 78, and the formula presented in rule 4 of appendix I. The SE’s and RSE’s for columns 2 and 6 can becomputed by using parameter set VIII of table II and the formula presented in rule 1 of appendix I. The SE’s and RSE’s for columns 4 and 8 can be computed by using parameter set IX of table IIand the formula presented in rule 1 of appendix I. The SE’s and RSE’s for columns 3 and 7 can be computed by using parameter sets VIII and IX of table II, the frequencies of table 77, and theformula presented in rule 4 of appendix I. An estimate of 683,000 discharges has a 10-percent RSE; of 169,000, a 20-percent RSE; and of 75,000, a 30-percent RSE. An estimate of 14.4 milliondays has a 10-percent RSE; of 2.8 million, a 20-percent RSE; and of 1.2 million, a 30-percent RSE.
126
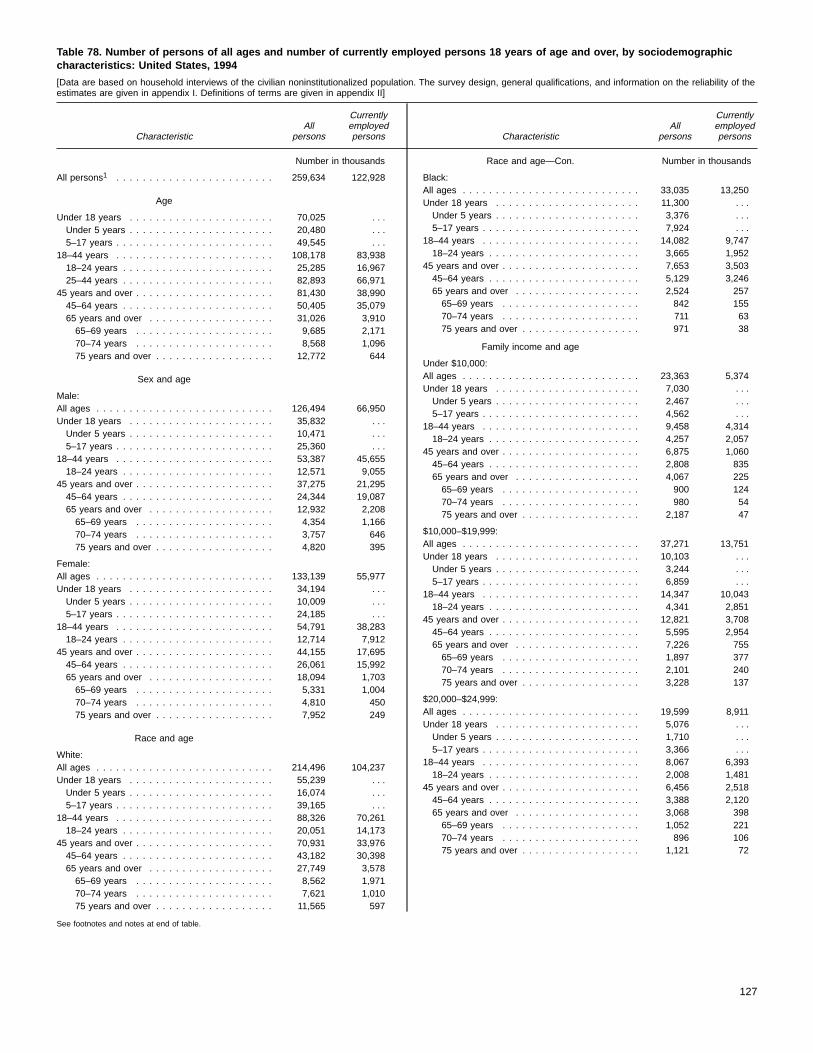
Table 78. Number of persons of all ages and number of currently employed persons 18 years of age and over, by sociodemographiccharacteristics: United States, 1994
[Data are based on household interviews of the civilian noninstitutionalized population. The survey design, general qualifications, and information on the reliability of theestimates are given in appendix I. Definitions of terms are given in appendix II]
CharacteristicAll
persons
Currentlyemployedpersons
Number in thousands
All persons1 . . . . . . . . . . . . . . . . . . . . . . . . 259,634 122,928
Age
Under 18 years . . . . . . . . . . . . . . . . . . . . . . 70,025 . . .Under 5 years . . . . . . . . . . . . . . . . . . . . . . 20,480 . . .5–17 years . . . . . . . . . . . . . . . . . . . . . . . . 49,545 . . .
18–44 years . . . . . . . . . . . . . . . . . . . . . . . . 108,178 83,93818–24 years . . . . . . . . . . . . . . . . . . . . . . . 25,285 16,96725–44 years . . . . . . . . . . . . . . . . . . . . . . . 82,893 66,971
45 years and over . . . . . . . . . . . . . . . . . . . . . 81,430 38,99045–64 years . . . . . . . . . . . . . . . . . . . . . . . 50,405 35,07965 years and over . . . . . . . . . . . . . . . . . . . 31,026 3,91065–69 years . . . . . . . . . . . . . . . . . . . . . 9,685 2,17170–74 years . . . . . . . . . . . . . . . . . . . . . 8,568 1,09675 years and over . . . . . . . . . . . . . . . . . . 12,772 644
Sex and age
Male:All ages . . . . . . . . . . . . . . . . . . . . . . . . . . . 126,494 66,950Under 18 years . . . . . . . . . . . . . . . . . . . . . . 35,832 . . .Under 5 years . . . . . . . . . . . . . . . . . . . . . . 10,471 . . .5–17 years . . . . . . . . . . . . . . . . . . . . . . . . 25,360 . . .
18–44 years . . . . . . . . . . . . . . . . . . . . . . . . 53,387 45,65518–24 years . . . . . . . . . . . . . . . . . . . . . . . 12,571 9,055
45 years and over . . . . . . . . . . . . . . . . . . . . . 37,275 21,29545–64 years . . . . . . . . . . . . . . . . . . . . . . . 24,344 19,08765 years and over . . . . . . . . . . . . . . . . . . . 12,932 2,20865–69 years . . . . . . . . . . . . . . . . . . . . . 4,354 1,16670–74 years . . . . . . . . . . . . . . . . . . . . . 3,757 64675 years and over . . . . . . . . . . . . . . . . . . 4,820 395
Female:All ages . . . . . . . . . . . . . . . . . . . . . . . . . . . 133,139 55,977Under 18 years . . . . . . . . . . . . . . . . . . . . . . 34,194 . . .Under 5 years . . . . . . . . . . . . . . . . . . . . . . 10,009 . . .5–17 years . . . . . . . . . . . . . . . . . . . . . . . . 24,185 . . .
18–44 years . . . . . . . . . . . . . . . . . . . . . . . . 54,791 38,28318–24 years . . . . . . . . . . . . . . . . . . . . . . . 12,714 7,912
45 years and over . . . . . . . . . . . . . . . . . . . . . 44,155 17,69545–64 years . . . . . . . . . . . . . . . . . . . . . . . 26,061 15,99265 years and over . . . . . . . . . . . . . . . . . . . 18,094 1,70365–69 years . . . . . . . . . . . . . . . . . . . . . 5,331 1,00470–74 years . . . . . . . . . . . . . . . . . . . . . 4,810 45075 years and over . . . . . . . . . . . . . . . . . . 7,952 249
Race and age
White:All ages . . . . . . . . . . . . . . . . . . . . . . . . . . . 214,496 104,237Under 18 years . . . . . . . . . . . . . . . . . . . . . . 55,239 . . .Under 5 years . . . . . . . . . . . . . . . . . . . . . . 16,074 . . .5–17 years . . . . . . . . . . . . . . . . . . . . . . . . 39,165 . . .
18–44 years . . . . . . . . . . . . . . . . . . . . . . . . 88,326 70,26118–24 years . . . . . . . . . . . . . . . . . . . . . . . 20,051 14,173
45 years and over . . . . . . . . . . . . . . . . . . . . . 70,931 33,97645–64 years . . . . . . . . . . . . . . . . . . . . . . . 43,182 30,39865 years and over . . . . . . . . . . . . . . . . . . . 27,749 3,57865–69 years . . . . . . . . . . . . . . . . . . . . . 8,562 1,97170–74 years . . . . . . . . . . . . . . . . . . . . . 7,621 1,01075 years and over . . . . . . . . . . . . . . . . . . 11,565 597
See footnotes and notes at end of table.
CharacteristicAll
persons
Currentlyemployedpersons
Race and age—Con. Number in thousands
Black:All ages . . . . . . . . . . . . . . . . . . . . . . . . . . . 33,035 13,250Under 18 years . . . . . . . . . . . . . . . . . . . . . . 11,300 . . .Under 5 years . . . . . . . . . . . . . . . . . . . . . . 3,376 . . .5–17 years . . . . . . . . . . . . . . . . . . . . . . . . 7,924 . . .
18–44 years . . . . . . . . . . . . . . . . . . . . . . . . 14,082 9,74718–24 years . . . . . . . . . . . . . . . . . . . . . . . 3,665 1,952
45 years and over . . . . . . . . . . . . . . . . . . . . . 7,653 3,50345–64 years . . . . . . . . . . . . . . . . . . . . . . . 5,129 3,24665 years and over . . . . . . . . . . . . . . . . . . . 2,524 25765–69 years . . . . . . . . . . . . . . . . . . . . . 842 15570–74 years . . . . . . . . . . . . . . . . . . . . . 711 6375 years and over . . . . . . . . . . . . . . . . . . 971 38
Family income and age
Under $10,000:All ages . . . . . . . . . . . . . . . . . . . . . . . . . . . 23,363 5,374Under 18 years . . . . . . . . . . . . . . . . . . . . . . 7,030 . . .Under 5 years . . . . . . . . . . . . . . . . . . . . . . 2,467 . . .5–17 years . . . . . . . . . . . . . . . . . . . . . . . . 4,562 . . .
18–44 years . . . . . . . . . . . . . . . . . . . . . . . . 9,458 4,31418–24 years . . . . . . . . . . . . . . . . . . . . . . . 4,257 2,057
45 years and over . . . . . . . . . . . . . . . . . . . . . 6,875 1,06045–64 years . . . . . . . . . . . . . . . . . . . . . . . 2,808 83565 years and over . . . . . . . . . . . . . . . . . . . 4,067 22565–69 years . . . . . . . . . . . . . . . . . . . . . 900 12470–74 years . . . . . . . . . . . . . . . . . . . . . 980 5475 years and over . . . . . . . . . . . . . . . . . . 2,187 47
$10,000–$19,999:All ages . . . . . . . . . . . . . . . . . . . . . . . . . . . 37,271 13,751Under 18 years . . . . . . . . . . . . . . . . . . . . . . 10,103 . . .Under 5 years . . . . . . . . . . . . . . . . . . . . . . 3,244 . . .5–17 years . . . . . . . . . . . . . . . . . . . . . . . . 6,859 . . .
18–44 years . . . . . . . . . . . . . . . . . . . . . . . . 14,347 10,04318–24 years . . . . . . . . . . . . . . . . . . . . . . . 4,341 2,851
45 years and over . . . . . . . . . . . . . . . . . . . . . 12,821 3,70845–64 years . . . . . . . . . . . . . . . . . . . . . . . 5,595 2,95465 years and over . . . . . . . . . . . . . . . . . . . 7,226 75565–69 years . . . . . . . . . . . . . . . . . . . . . 1,897 37770–74 years . . . . . . . . . . . . . . . . . . . . . 2,101 24075 years and over . . . . . . . . . . . . . . . . . . 3,228 137
$20,000–$24,999:All ages . . . . . . . . . . . . . . . . . . . . . . . . . . . 19,599 8,911Under 18 years . . . . . . . . . . . . . . . . . . . . . . 5,076 . . .Under 5 years . . . . . . . . . . . . . . . . . . . . . . 1,710 . . .5–17 years . . . . . . . . . . . . . . . . . . . . . . . . 3,366 . . .
18–44 years . . . . . . . . . . . . . . . . . . . . . . . . 8,067 6,39318–24 years . . . . . . . . . . . . . . . . . . . . . . . 2,008 1,481
45 years and over . . . . . . . . . . . . . . . . . . . . . 6,456 2,51845–64 years . . . . . . . . . . . . . . . . . . . . . . . 3,388 2,12065 years and over . . . . . . . . . . . . . . . . . . . 3,068 39865–69 years . . . . . . . . . . . . . . . . . . . . . 1,052 22170–74 years . . . . . . . . . . . . . . . . . . . . . 896 10675 years and over . . . . . . . . . . . . . . . . . . 1,121 72
127
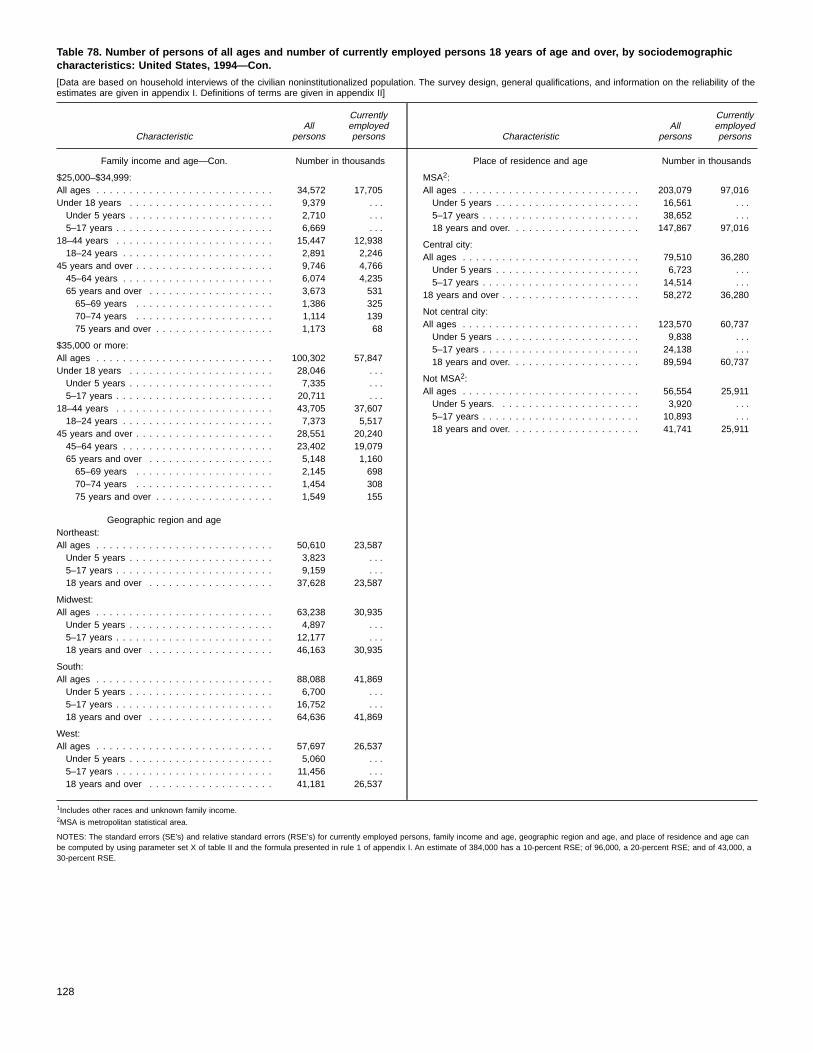
CharacteristicAll
persons
Currentlyemployedpersons
Family income and age—Con. Number in thousands
$25,000–$34,999:All ages . . . . . . . . . . . . . . . . . . . . . . . . . . . 34,572 17,705Under 18 years . . . . . . . . . . . . . . . . . . . . . . 9,379 . . .Under 5 years . . . . . . . . . . . . . . . . . . . . . . 2,710 . . .5–17 years . . . . . . . . . . . . . . . . . . . . . . . . 6,669 . . .
18–44 years . . . . . . . . . . . . . . . . . . . . . . . . 15,447 12,93818–24 years . . . . . . . . . . . . . . . . . . . . . . . 2,891 2,246
45 years and over . . . . . . . . . . . . . . . . . . . . . 9,746 4,76645–64 years . . . . . . . . . . . . . . . . . . . . . . . 6,074 4,23565 years and over . . . . . . . . . . . . . . . . . . . 3,673 53165–69 years . . . . . . . . . . . . . . . . . . . . . 1,386 32570–74 years . . . . . . . . . . . . . . . . . . . . . 1,114 13975 years and over . . . . . . . . . . . . . . . . . . 1,173 68
$35,000 or more:All ages . . . . . . . . . . . . . . . . . . . . . . . . . . . 100,302 57,847Under 18 years . . . . . . . . . . . . . . . . . . . . . . 28,046 . . .Under 5 years . . . . . . . . . . . . . . . . . . . . . . 7,335 . . .5–17 years . . . . . . . . . . . . . . . . . . . . . . . . 20,711 . . .
18–44 years . . . . . . . . . . . . . . . . . . . . . . . . 43,705 37,60718–24 years . . . . . . . . . . . . . . . . . . . . . . . 7,373 5,517
45 years and over . . . . . . . . . . . . . . . . . . . . . 28,551 20,24045–64 years . . . . . . . . . . . . . . . . . . . . . . . 23,402 19,07965 years and over . . . . . . . . . . . . . . . . . . . 5,148 1,16065–69 years . . . . . . . . . . . . . . . . . . . . . 2,145 69870–74 years . . . . . . . . . . . . . . . . . . . . . 1,454 30875 years and over . . . . . . . . . . . . . . . . . . 1,549 155
Geographic region and ageNortheast:All ages . . . . . . . . . . . . . . . . . . . . . . . . . . . 50,610 23,587Under 5 years . . . . . . . . . . . . . . . . . . . . . . 3,823 . . .5–17 years . . . . . . . . . . . . . . . . . . . . . . . . 9,159 . . .18 years and over . . . . . . . . . . . . . . . . . . . 37,628 23,587
Midwest:All ages . . . . . . . . . . . . . . . . . . . . . . . . . . . 63,238 30,935Under 5 years . . . . . . . . . . . . . . . . . . . . . . 4,897 . . .5–17 years . . . . . . . . . . . . . . . . . . . . . . . . 12,177 . . .18 years and over . . . . . . . . . . . . . . . . . . . 46,163 30,935
South:All ages . . . . . . . . . . . . . . . . . . . . . . . . . . . 88,088 41,869Under 5 years . . . . . . . . . . . . . . . . . . . . . . 6,700 . . .5–17 years . . . . . . . . . . . . . . . . . . . . . . . . 16,752 . . .18 years and over . . . . . . . . . . . . . . . . . . . 64,636 41,869
West:All ages . . . . . . . . . . . . . . . . . . . . . . . . . . . 57,697 26,537Under 5 years . . . . . . . . . . . . . . . . . . . . . . 5,060 . . .5–17 years . . . . . . . . . . . . . . . . . . . . . . . . 11,456 . . .18 years and over . . . . . . . . . . . . . . . . . . . 41,181 26,537
CharacteristicAll
persons
Currentlyemployedpersons
Place of residence and age Number in thousands
MSA2:All ages . . . . . . . . . . . . . . . . . . . . . . . . . . . 203,079 97,016Under 5 years . . . . . . . . . . . . . . . . . . . . . . 16,561 . . .5–17 years . . . . . . . . . . . . . . . . . . . . . . . . 38,652 . . .18 years and over. . . . . . . . . . . . . . . . . . . . 147,867 97,016
Central city:All ages . . . . . . . . . . . . . . . . . . . . . . . . . . . 79,510 36,280Under 5 years . . . . . . . . . . . . . . . . . . . . . . 6,723 . . .5–17 years . . . . . . . . . . . . . . . . . . . . . . . . 14,514 . . .
18 years and over . . . . . . . . . . . . . . . . . . . . . 58,272 36,280
Not central city:All ages . . . . . . . . . . . . . . . . . . . . . . . . . . . 123,570 60,737Under 5 years . . . . . . . . . . . . . . . . . . . . . . 9,838 . . .5–17 years . . . . . . . . . . . . . . . . . . . . . . . . 24,138 . . .18 years and over. . . . . . . . . . . . . . . . . . . . 89,594 60,737
Not MSA2:All ages . . . . . . . . . . . . . . . . . . . . . . . . . . . 56,554 25,911Under 5 years. . . . . . . . . . . . . . . . . . . . . . 3,920 . . .5–17 years . . . . . . . . . . . . . . . . . . . . . . . . 10,893 . . .18 years and over. . . . . . . . . . . . . . . . . . . . 41,741 25,911
128
Table 78. Number of persons of all ages and number of currently employed persons 18 years of age and over, by sociodemographiccharacteristics: United States, 1994—Con.
[Data are based on household interviews of the civilian noninstitutionalized population. The survey design, general qualifications, and information on the reliability of theestimates are given in appendix I. Definitions of terms are given in appendix II]
1Includes other races and unknown family income.2MSA is metropolitan statistical area.
NOTES: The standard errors (SE’s) and relative standard errors (RSE’s) for currently employed persons, family income and age, geographic region and age, and place of residence and age canbe computed by using parameter set X of table II and the formula presented in rule 1 of appendix I. An estimate of 384,000 has a 10-percent RSE; of 96,000, a 20-percent RSE; and of 43,000, a30-percent RSE.

Appendixes
Contents
I. Technical notes on methods. . . . . . . . . . . . . . . . . . . . . . . . . . . . . . . . . . . . . . . . . . . . . . . . . . . . . . . . . . . . . . . . . . . . . . . . . . 130Background. . . . . . . . . . . . . . . . . . . . . . . . . . . . . . . . . . . . . . . . . . . . . . . . . . . . . . . . . . . . . . . . . . . . . . . . . . . . . . . . . . . . . . 130Statistical design of the NHIS. . . . . . . . . . . . . . . . . . . . . . . . . . . . . . . . . . . . . . . . . . . . . . . . . . . . . . . . . . . . . . . . . . . . . . . 130Collection and processing of data. . . . . . . . . . . . . . . . . . . . . . . . . . . . . . . . . . . . . . . . . . . . . . . . . . . . . . . . . . . . . . . . . . . . 131Estimation procedures. . . . . . . . . . . . . . . . . . . . . . . . . . . . . . . . . . . . . . . . . . . . . . . . . . . . . . . . . . . . . . . . . . . . . . . . . . . . . . 132Types of estimates. . . . . . . . . . . . . . . . . . . . . . . . . . . . . . . . . . . . . . . . . . . . . . . . . . . . . . . . . . . . . . . . . . . . . . . . . . . . . . . . . 132Reliability of the estimates. . . . . . . . . . . . . . . . . . . . . . . . . . . . . . . . . . . . . . . . . . . . . . . . . . . . . . . . . . . . . . . . . . . . . . . . . . 133
II. Definitions of certain terms used in this report. . . . . . . . . . . . . . . . . . . . . . . . . . . . . . . . . . . . . . . . . . . . . . . . . . . . . . . . . . . 137Terms relating to conditions. . . . . . . . . . . . . . . . . . . . . . . . . . . . . . . . . . . . . . . . . . . . . . . . . . . . . . . . . . . . . . . . . . . . . . . . . 137Terms relating to disability. . . . . . . . . . . . . . . . . . . . . . . . . . . . . . . . . . . . . . . . . . . . . . . . . . . . . . . . . . . . . . . . . . . . . . . . . . 137Terms relating to persons injured. . . . . . . . . . . . . . . . . . . . . . . . . . . . . . . . . . . . . . . . . . . . . . . . . . . . . . . . . . . . . . . . . . . . . 138Terms relating to accidents. . . . . . . . . . . . . . . . . . . . . . . . . . . . . . . . . . . . . . . . . . . . . . . . . . . . . . . . . . . . . . . . . . . . . . . . . . 139Terms relating to physician contacts. . . . . . . . . . . . . . . . . . . . . . . . . . . . . . . . . . . . . . . . . . . . . . . . . . . . . . . . . . . . . . . . . . 139Terms relating to hospitalization. . . . . . . . . . . . . . . . . . . . . . . . . . . . . . . . . . . . . . . . . . . . . . . . . . . . . . . . . . . . . . . . . . . . . 140Demographic terms. . . . . . . . . . . . . . . . . . . . . . . . . . . . . . . . . . . . . . . . . . . . . . . . . . . . . . . . . . . . . . . . . . . . . . . . . . . . . . . . 140
III. Questionnaires and flashcards. . . . . . . . . . . . . . . . . . . . . . . . . . . . . . . . . . . . . . . . . . . . . . . . . . . . . . . . . . . . . . . . . . . . . . . . . 142
Appendix tables
I. The 60 poststratification age-sex-race cells in the National Health Interview Survey. . . . . . . . . . . . . . . . . . . . . . . . . . . . . 132II. Estimated standard error parameters and 30-percent relative standard error (RSE) cutoff points for the National Health
Interview Survey, 1994. . . . . . . . . . . . . . . . . . . . . . . . . . . . . . . . . . . . . . . . . . . . . . . . . . . . . . . . . . . . . . . . . . . . . . . . . . . . . . . 134
129
bcsgahete
.Sb
thteon
clthofbrcus.ise
beanatone
lyodsethbe
leu-sorfrerorut
eled
eedi-
-
esrerem.
:aree-in-atsur
dasd.
Appendix ITechnical notes on methods
Background
This report is one of a series of statistical reports pulished by the staff of the National Center for Health Statisti(NCHS). It is based on information collected in a continuinnationwide sample of households included in the NationHealth Interview Survey (NHIS). Data are obtained on tpersonal, sociodemographic, and health characteristics offamily members and unrelated individuals living in theshouseholds.
Field operations for the survey are conducted by the UBureau of the Census under specifications establishedNCHS. The U.S. Bureau of the Census participates insurvey planning, selects the sample, and conducts the inviews. The data are then transmitted to NCHS for preparatiprocessing, and analysis.
Summary reports and reports on special topics for eayear’s data are prepared by the staff of the Division of HeaInterview Statistics for publication in Series 10 publicationsNCHS. Data are also tabulated for other reports publishedNCHS staff and for use by other organizations and by reseaers within and outside the Government. Since 1969, publictapes have been prepared for each year of data collection
Public use micro-data also are available on compact dread-only memory (CD-ROM) for 1987–92, and will bavailable for later years in the future.
It should be noted that the health characteristics describy the NHIS estimates pertain only to the resident, civilinoninstitutionalized population of the United States livingthe time of the interview. The sample does not include persresiding in nursing homes, members of the armed forcinstitutionalized persons, or U.S. nationals living abroad.
Statistical design of the NHIS
General design
Data from the NHIS have been collected continuoussince 1957. The sample design of the survey has undergchanges following each decennial census. This periodic resign of the NHIS sample allows the incorporation of the latepopulation information and statistical methodology into thsurvey design. The data presented in this report are fromNHIS sample design first used in 1985. This design willused until 1995.
130
-
l
he
.yer-,
h
yh-e
k
d
ss,
nee-t
e
The sample design plan of the NHIS follows a multistageprobability design that permits a continuous sampling of thecivilian noninstitutionalized population residing in the UnitedStates. The survey is designed in such a way that the sampscheduled for each week is representative of the target poplation, and the weekly samples are additive over time. Thidesign permits estimates for high-frequency measures or flarge population groups to be produced from a short period odata collection. Estimates for low-frequency measures or fosmaller population subgroups can be obtained from a longperiod of data collection. The annual sample is designed sthat tabulations can be provided for each of the four majogeographic regions. Because interviewing is done throughothe year, there is no seasonal bias for annual estimates.
The continuous data collection also has administrativand operational advantages because fieldwork can be handon a continuing basis with an experienced, stable staff.
Sample selection
The target population for the NHIS is the civilian nonin-stitutionalized population residing in the United States. For thfirst stage of the sample design, the United States is considerto be a universe composed of approximately 1,900 geographcally defined primary sampling units (PSU’s). A PSU consistsof a county, small group of contiguous counties, or a metropolitan statistical area. The PSU’s collectively cover the 50States and the District of Columbia. The 52 largest PSU’s arselected into the sample with certainty and are referred to aself-representing PSU’s. The other PSU’s in the universe areferred to as non-self-representing PSU’s. These PSU’s aclustered into 73 strata, and 2 sample PSU’s are chosen froeach stratum with probability proportional to population sizeThis gives a total of 198 PSU’s selected in the first stage.
Within a PSU, two types of second stage units are usedarea segments and permit area segments. Area segmentsdefined geographically and contain an expected eight housholds. Permit area segments cover geographical areas containg housing units built after the 1980 census. The permit aresegments are defined using updated lists of building permiissued in the PSU since 1980 and contain an expected fohouseholds.
Within each segment all occupied households are targetefor interview. On occasion, a sample segment may containlarge number of households. In this situation the householdare subsampled to provide a manageable interviewer workloa

plfnl bg0ut
ath
hnofuusuhtuaiyral-
ethlyby
nslly
nbhmicthio
osahendgn
-msi-e-t
eeofns
aydhety9,ndines,ndyoneyl.recedd
-inInnicof).noseSallonhe
singhed
yt
fleal
The sample was designed so that a typical NHIS samfor the data collection years 1985 to 1995 will consist oapproximately 7,500 segments containing about 59,000 assighouseholds. Of these households, an expected 10,000 wilvacant, demolished, or occupied by persons not in the tarpopulation of the survey. The expected sample of 49,0occupied households will yield a probability sample of abo127,000 persons.
Features of the NHIS sample redesign
Starting in 1985, the NHIS design incorporated severnew design features (7). The major changes includefollowing:
1. The use of an all-area frame. The NHIS sample is nowdesigned so that it can serve as a sample frame for otNCHS population-based surveys. In previous NHIS desigabout two-thirds of the sample was obtained from listsaddresses compiled at the time of the decennial censthat is, a list frame. Due to U.S. Bureau of the Censconfidentiality restrictions, these sample addresses cobe used for only those surveys being conducted by tU.S. Bureau of the Census. The methodology usedobtain addresses in the 1985 NHIS area frame does notthe census address lists. The sample addresses thus obtcan be used as a sampling frame for other NCHS surve
2. The NHIS has four panels. Four national subdesigns, opanels, constitute the full NHIS. Each panel containsrepresentative sample of the U.S. civilian noninstitutionaized population. Each of the four panels has the samsampling properties, and any combination of panels defina national design. Panels were constructed to facilitatelinkage of the NHIS to other surveys and also to efficientmake large reductions in the size of the sampleeliminating panels from the survey.
In 1994 the sample consisted of 8,598 segments cotaining 60,628 assigned households. Of the 48,584 houholds eligible for interview, 45,705 households were actuainterviewed, resulting in a sample of 116,179 persons.
3. The oversampling of black persons. One of the goals indesigning the current NHIS was to improve the precisioof estimates for black persons. This was accomplishedthe use of differential sampling rates in PSU’s witbetween about 5- and 50-percent black population. Sapling rates for selection of segments were increasedareas known to have the highest concentrations of blapersons. Segment sampling rates were decreased in oareas within the PSU to ensure that the total sampleeach PSU was the same size as it would have been withoversampling black persons.
4. The reduction of the number of sampled PSU’s. Inter-viewer travel to sample PSU’s constitutes a large compnent of the total field costs for the NHIS. The previouNHIS design included 376 PSU’s. Research showed threducing the number of sample PSU’s while increasing tsample size within PSU’s would reduce travel costs aalso maintain the reliability of health estimates. The desinow contains 198 PSU’s.
e
edeet0
le
ers
s;
ldeoseneds.
ese
-e-
y
-nkernut
-
t
5. The selection of two PSU’s per non-self-representing stratum. In the previous design, one PSU was selected froeach non-self-representing stratum. This feature necestated the use of less efficient variance estimation procdures; the selection of two PSU’s allows more efficienvariance estimation methodology.
Collection and processing of data
The NHIS questionnaire contains two major parts. Thfirst part consists of topics that remain relatively the samfrom year to year. Among these topics are the incidenceacute conditions, the prevalence of chronic conditions, persolimited in activity due to chronic conditions, restriction inactivity due to impairment or health problems, and utilizationof health care services involving physician care and short-sthospitalization. Occasionally new questions are incorporateinto the main questionnaire. Since 1985, questions that ask thousehold members’ city and State of birth, social securinumber, and father’s last name have been included. In 198questions were added that ask the location (city, county, aState) of any physician contact whether by telephone orperson; and for household members born in the United Stathow many years they have lived in the State of residence, afor household members born in a foreign country, how manyears they have lived in the United States. In 1992, a questiwas added for persons 12–21 years of age asking whether thwere either now going to school or on vacation from schooAlthough this question was retained in 1993, no data wecollected and the question was deleted in 1994. In 1992, rawas expanded into 15 detailed racial groupings and includean ‘‘other race’’ category. In 1994 this question was movewithin section L from question 3 to question 4. In 1992, theHispanic origin questions were moved from section L (questions 4a and 4b) to section A (questions 4e and 4f), and1994 they were moved to section L (questions 3a and 3b).1992, questions were added that asked about the Hispaoversample’s reference person or family members’ statusprevious year’s residence (section A, questions 4g and 4hAlthough these questions were retained in 1993, there wasHispanic oversampling and no data were collected for thequestions. They were deleted in 1994. In 1993, the NHIadded E-coding (Supplementary Classification of ExternCauses of Injury and Poisoning) for injuries including medicaand therapeutic misadventures. Beginning in 1994, a questiwas added asking if there were a working telephone inside thome.
The second part of the NHIS consists of special topicadded as supplements to each year’s questionnaire. Beginnin August 1987, a special set of supplemental questions on tadult population’s knowledge and attitudes about acquireimmunodeficiency syndrome (AIDS) was added to the NHISusing Computer Assisted Personal Interview (CAPI). A copof the most recent questionnaire, not included in CurrenEstimates prior to 1989, is shown in appendix III.
Careful procedures are followed to assure the quality odata collected in the interview. Most households in the sampare contacted by mail before the interviewers arrive. Potenti
131
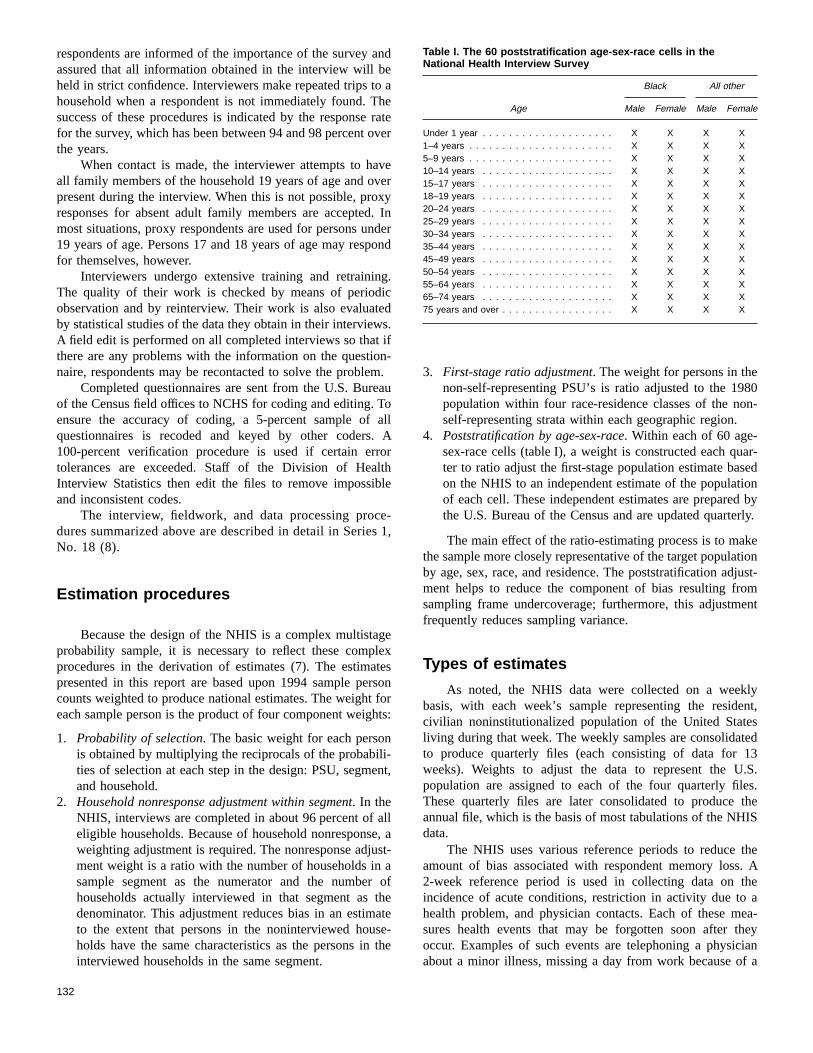
ndeo aheratever
veverxy. Inderond
g.iceds.ifnmaoa
olthle
es
gletersfot
i-en
lesa
haet
0-
r-dnbyly.
eonst-
nt
nt,
d3S.s.e
eAe
a-eyana
Table I. The 60 poststratification age-sex-race cells in theNational Health Interview Survey
Age
Black All other
Male Female Male Female
Under 1 year . . . . . . . . . . . . . . . . . . . . X X X X1–4 years . . . . . . . . . . . . . . . . . . . . . . X X X X5–9 years . . . . . . . . . . . . . . . . . . . . . . X X X X10–14 years . . . . . . . . . . . . . . . . . . . . X X X X15–17 years . . . . . . . . . . . . . . . . . . . . X X X X18–19 years . . . . . . . . . . . . . . . . . . . . X X X X20–24 years . . . . . . . . . . . . . . . . . . . . X X X X25–29 years . . . . . . . . . . . . . . . . . . . . X X X X30–34 years . . . . . . . . . . . . . . . . . . . . X X X X35–44 years . . . . . . . . . . . . . . . . . . . . X X X X45–49 years . . . . . . . . . . . . . . . . . . . . X X X X50–54 years . . . . . . . . . . . . . . . . . . . . X X X X55–64 years . . . . . . . . . . . . . . . . . . . . X X X X65–74 years . . . . . . . . . . . . . . . . . . . . X X X X75 years and over . . . . . . . . . . . . . . . . . X X X X
respondents are informed of the importance of the survey aassured that all information obtained in the interview will bheld in strict confidence. Interviewers make repeated trips thousehold when a respondent is not immediately found. Tsuccess of these procedures is indicated by the responsefor the survey, which has been between 94 and 98 percent othe years.
When contact is made, the interviewer attempts to haall family members of the household 19 years of age and opresent during the interview. When this is not possible, proresponses for absent adult family members are acceptedmost situations, proxy respondents are used for persons un19 years of age. Persons 17 and 18 years of age may respfor themselves, however.
Interviewers undergo extensive training and retraininThe quality of their work is checked by means of periodobservation and by reinterview. Their work is also evaluatby statistical studies of the data they obtain in their interviewA field edit is performed on all completed interviews so thatthere are any problems with the information on the questionaire, respondents may be recontacted to solve the proble
Completed questionnaires are sent from the U.S. Bureof the Census field offices to NCHS for coding and editing. Tensure the accuracy of coding, a 5-percent sample ofquestionnaires is recoded and keyed by other coders.100-percent verification procedure is used if certain errtolerances are exceeded. Staff of the Division of HeaInterview Statistics then edit the files to remove impossiband inconsistent codes.
The interview, fieldwork, and data processing procdures summarized above are described in detail in SerieNo. 18 (8).
Estimation procedures
Because the design of the NHIS is a complex multistaprobability sample, it is necessary to reflect these compprocedures in the derivation of estimates (7). The estimapresented in this report are based upon 1994 sample pecounts weighted to produce national estimates. The weighteach sample person is the product of four component weigh
1. Probability of selection. The basic weight for each personis obtained by multiplying the reciprocals of the probabilties of selection at each step in the design: PSU, segmand household.
2. Household nonresponse adjustment within segment. In theNHIS, interviews are completed in about 96 percent of aeligible households. Because of household nonresponsweighting adjustment is required. The nonresponse adjument weight is a ratio with the number of households insample segment as the numerator and the numberhouseholds actually interviewed in that segment as tdenominator. This adjustment reduces bias in an estimto the extent that persons in the noninterviewed housholds have the same characteristics as the persons ininterviewed households in the same segment.
132
-.u
llAr
-1,
exsonrs:
t,
l, at-
ofete-he
3. First-stage ratio adjustment. The weight for persons in thenon-self-representing PSU’s is ratio adjusted to the 198population within four race-residence classes of the nonself-representing strata within each geographic region.
4. Poststratification by age-sex-race. Within each of 60 age-sex-race cells (table I), a weight is constructed each quater to ratio adjust the first-stage population estimate baseon the NHIS to an independent estimate of the populatioof each cell. These independent estimates are preparedthe U.S. Bureau of the Census and are updated quarter
The main effect of the ratio-estimating process is to makthe sample more closely representative of the target populatiby age, sex, race, and residence. The poststratification adjument helps to reduce the component of bias resulting fromsampling frame undercoverage; furthermore, this adjustmefrequently reduces sampling variance.
Types of estimates
As noted, the NHIS data were collected on a weeklybasis, with each week’s sample representing the residecivilian noninstitutionalized population of the United Statesliving during that week. The weekly samples are consolidateto produce quarterly files (each consisting of data for 1weeks). Weights to adjust the data to represent the U.population are assigned to each of the four quarterly fileThese quarterly files are later consolidated to produce thannual file, which is the basis of most tabulations of the NHISdata.
The NHIS uses various reference periods to reduce thamount of bias associated with respondent memory loss.2-week reference period is used in collecting data on thincidence of acute conditions, restriction in activity due to ahealth problem, and physician contacts. Each of these mesures health events that may be forgotten soon after thoccur. Examples of such events are telephoning a physiciabout a minor illness, missing a day from work because of
oriodotr
feadaet tatusucugovththtieronlesteaithingam
arinaicIbs
thenam
eetoraTh
fbe
omin a-nticto
totics.theder-, orof
ures
hethedicskseorbyar)
iswnnsnde-isofisitald to
i-nsuldheeris-
dntedre,ringxi-nthata
ealltedtheilyispa-
routine health problem, or having a cold. Either a 12-6-month (depending on the type of statistic) reference peris used for hospitalization data because hospitalization ornarily involves a major event in a person’s life and is nquickly forgotten. Chronic condition prevalence estimates abased on a 12-month reference period.
Because most NHIS estimates based on a 2-week reence period are designed to represent the number of heevents for a 12-month period, these data must be adjustean annual basis. Data based on a 2-week reference periodmultiplied by 6.5 to produce the 13-week estimate for thquarter. These reference period adjustments are made atime that the quarterly files are produced. Therefore, the dcan be used to produce estimates for each quarter and arethat way to study seasonal variation. The data from the foquarterly files (representing the number of events in eaquarter) are summed to produce the annual estimate. Althothese data are collected for only 2 weeks for each persincluded in the survey, any unusual event that may haoccurred during a particular 2-week period does not biasestimate because the quarterly estimate is a sum ofestimates produced for each week’s sample during the enquarter and the annual estimate is the sum of the four quart
For prevalence statistics, such as the number of perslimited in activity due to chronic conditions, the annuaestimate results from summing the weighted quarterly filand dividing by 4. This division is necessary because, as noabove, each quarterly file has been weighted to produceestimate of the number of persons in the U.S. population wa given characteristic. Summing the four quarters and dividby 4 in effect averages these quarterly results for the yeThus, the type of prevalence estimate ordinarily derived frothe NHIS data is an annual average prevalence estimate.
For data related to short-stay hospital discharges thatbased on a 6-month reference period, cases identified duany quarter of data collection are multiplied by 2 to producequarterly estimate of the annual number of characteristassociated with short-stay hospital discharges. The NHaverage annual estimate of hospital discharges is derivedsumming the four quarterly estimates and dividing by 4, juas the prevalence estimates are.
Reliability of the estimatesBecause the NHIS estimates are based on a sample,
may differ somewhat from the figures that would have beobtained if a complete census had been taken using the ssurvey and processing procedures. There are two typeserrors possible in an estimate based on a sample survsampling and nonsampling errors. To the extent possible, thtypes of errors are kept to a minimum by methods built inthe survey procedures described earlier (9). Although it is vedifficult to measure the extent of bias in the NHIS, severstudies have been conducted to examine this problem.results have been published in several reports (10–13).
Nonsampling errors
Interviewing process—Information, such as the number odays of restricted activity caused by the condition, can
di-
e
r-lthtore
heaedrhhneeeres.s
dn
r.
reg
sSyt
ey
eofy:se
yle
obtained more accurately from household members than frany other source because only the persons concerned areposition to report this information. However, there are limitations to the accuracy of diagnostic and other informatiocollected in household interviews. For example, for diagnosinformation, the household respondent can usually pass onthe interviewer only the information the physician has giventhe family. For conditions not medically attended, diagnosinformation is often no more than a description of symptomFurther, a respondent may not answer a question inintended manner because he or she has not properly unstood the question, has forgotten the event, does not knowdoes not wish to divulge the answer. Regardless of the typemeasure, all the NHIS data are estimates of health measknown to and willingly reported by the respondents.
Reference period bias—The NHIS estimates do not rep-resent a complete measure of any given topic during tspecified calendar period because data are not collected ininterview for persons who died or became institutionalizeduring the reference period. For many types of statistcollected in the survey, the reference period is the 2 weeprior to the interview week. For such a short period, thcontribution by decedents to a total inventory of conditionsservices should be very small. However, the contributiondecedents during a long reference period (such as 1 yemight be significant, especially for older persons.
Underreporting associated with a long reference periodmost germane to data on hospitalization. Analysis has shothat there is an increase in underreporting of hospitalizatiowith an increase in the time interval between the discharge athe interview. Exclusive of the hospital experience of decdents, the net underreporting using a 12-month recall periodin the neighborhood of 10 percent (14). The underreportingdischarges within 6 months of the week of interviewestimated to be about 5 percent (14). For this reason, hospdischarge data are based on hospital discharges reportehave occurred within 6 months of the week of interview.
Because hospitalization is common in the period immedately preceding death or institutionalization and older persoare much more likely to die than younger ones, the data shonot be used to estimate the volume of hospitalization of telderly although the data can be used to measure characttics of elderly people.
It should further be noted that, although the reportefrequencies and rates related to hospital episodes are preseby the year in which the data were collected, the estimates ain most cases, based on hospitalizations that occurred duthe year of data collection and the prior year. Overall, appromately one-half of the reported hospitalizations for the 12-moreference period occurred in the year prior to the year of dcollection.
Population estimates—Some of the published tables includpopulation figures for specified categories. Except for overtotals for the 60 age, sex, and race groups, which are adjusto independent estimates, these figures are based onsample of households in the NHIS. They are given primarto provide denominators for rate computation, and for thpurpose they are more appropriate for use with the accom
133
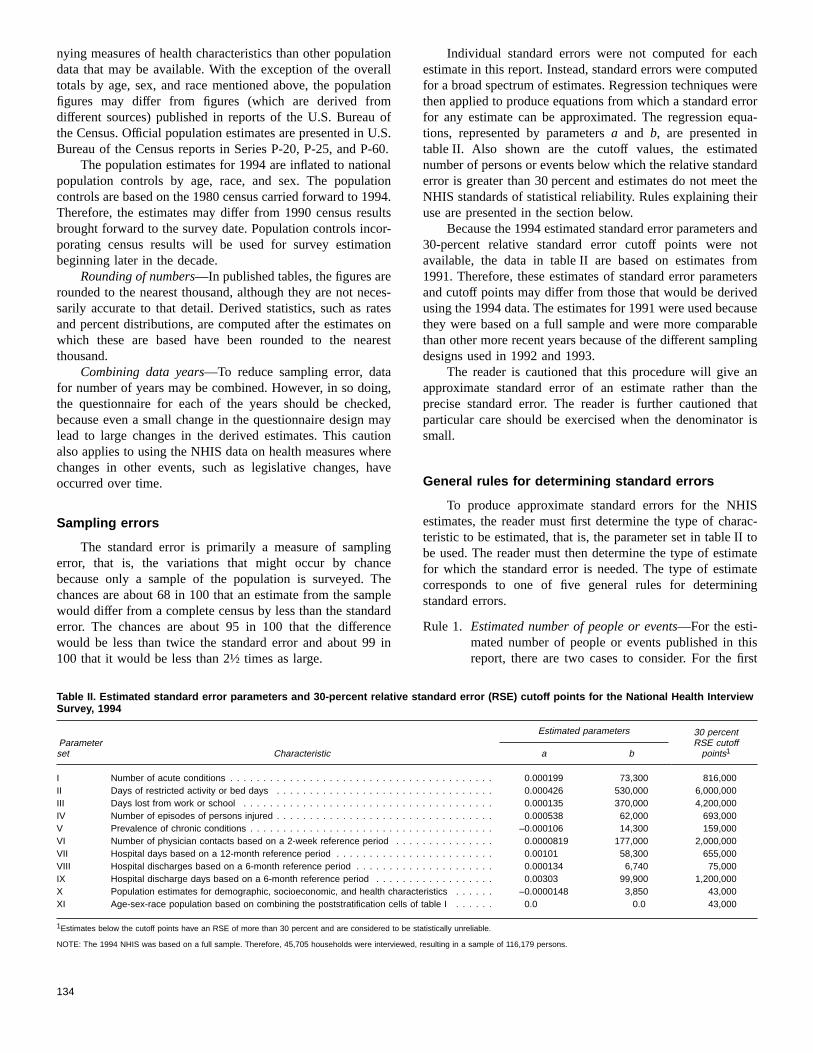
tirat
-6nio9uoio
ects
anemti
nc
an
chtedererrorua-
edardt their
andotomtersdausebleling
anthethatr is
ISrac-I toateateng
isrst
nying measures of health characteristics than other populadata that may be available. With the exception of the ovetotals by age, sex, and race mentioned above, the populafigures may differ from figures (which are derived fromdifferent sources) published in reports of the U.S. Bureauthe Census. Official population estimates are presented in UBureau of the Census reports in Series P-20, P-25, and P
The population estimates for 1994 are inflated to natiopopulation controls by age, race, and sex. The populatcontrols are based on the 1980 census carried forward to 1Therefore, the estimates may differ from 1990 census resbrought forward to the survey date. Population controls incporating census results will be used for survey estimatbeginning later in the decade.
Rounding of numbers—In published tables, the figures arrounded to the nearest thousand, although they are not nesarily accurate to that detail. Derived statistics, such as raand percent distributions, are computed after the estimatewhich these are based have been rounded to the neathousand.
Combining data years—To reduce sampling error, datfor number of years may be combined. However, in so doithe questionnaire for each of the years should be checkbecause even a small change in the questionnaire designlead to large changes in the derived estimates. This caualso applies to using the NHIS data on health measures whchanges in other events, such as legislative changes, hoccurred over time.
Sampling errors
The standard error is primarily a measure of samplierror, that is, the variations that might occur by chanbecause only a sample of the population is surveyed. Tchances are about 68 in 100 that an estimate from the samwould differ from a complete census by less than the standerror. The chances are about 95 in 100 that the differewould be less than twice the standard error and about 99100 that it would be less than 2½ times as large.
Table II. Estimated standard error parameters and 30-percent relative stanSurvey, 1994
Parameterset Characteristic
I Number of acute conditions . . . . . . . . . . . . . . . . . . . . . . . . . . .II Days of restricted activity or bed days . . . . . . . . . . . . . . . . . . . .III Days lost from work or school . . . . . . . . . . . . . . . . . . . . . . . . .IV Number of episodes of persons injured . . . . . . . . . . . . . . . . . . . .V Prevalence of chronic conditions . . . . . . . . . . . . . . . . . . . . . . . .VI Number of physician contacts based on a 2-week reference period . .VII Hospital days based on a 12-month reference period . . . . . . . . . . .VIII Hospital discharges based on a 6-month reference period . . . . . . . .IX Hospital discharge days based on a 6-month reference period . . . . .X Population estimates for demographic, socioeconomic, and health charaXI Age-sex-race population based on combining the poststratification cells
1Estimates below the cutoff points have an RSE of more than 30 percent and are considered to be
NOTE: The 1994 NHIS was based on a full sample. Therefore, 45,705 households were interviewe
134
onllion
of.S.0.aln94.ltsr-n
es-esonrest
g,d,ayonereave
geheplerdcein
Individual standard errors were not computed for eaestimate in this report. Instead, standard errors were compufor a broad spectrum of estimates. Regression techniques wthen applied to produce equations from which a standard efor any estimate can be approximated. The regression eqtions, represented by parametersa and b, are presented intable II. Also shown are the cutoff values, the estimatnumber of persons or events below which the relative standerror is greater than 30 percent and estimates do not meeNHIS standards of statistical reliability. Rules explaining theuse are presented in the section below.
Because the 1994 estimated standard error parameters30-percent relative standard error cutoff points were navailable, the data in table II are based on estimates fr1991. Therefore, these estimates of standard error parameand cutoff points may differ from those that would be deriveusing the 1994 data. The estimates for 1991 were used becthey were based on a full sample and were more comparathan other more recent years because of the different sampdesigns used in 1992 and 1993.
The reader is cautioned that this procedure will giveapproximate standard error of an estimate rather thanprecise standard error. The reader is further cautionedparticular care should be exercised when the denominatosmall.
General rules for determining standard errors
To produce approximate standard errors for the NHestimates, the reader must first determine the type of chateristic to be estimated, that is, the parameter set in table Ibe used. The reader must then determine the type of estimfor which the standard error is needed. The type of estimcorresponds to one of five general rules for deterministandard errors.
Rule 1. Estimated number of people or events—For the esti-mated number of people or events published in threport, there are two cases to consider. For the fi
dard error (RSE) cutoff points for the National Health Interview
Estimated parameters 30 percentRSE cutoffpoints1a b
. . . . . . . . . . . . . 0.000199 73,300 816,000
. . . . . . . . . . . . . 0.000426 530,000 6,000,000
. . . . . . . . . . . . . 0.000135 370,000 4,200,000
. . . . . . . . . . . . . 0.000538 62,000 693,000
. . . . . . . . . . . . . –0.000106 14,300 159,000
. . . . . . . . . . . . . 0.0000819 177,000 2,000,000
. . . . . . . . . . . . . 0.00101 58,300 655,000
. . . . . . . . . . . . . 0.000134 6,740 75,000
. . . . . . . . . . . . . 0.00303 99,900 1,200,000cteristics . . . . . . –0.0000148 3,850 43,000of table I . . . . . . 0.0 0.0 43,000
statistically unreliable.
d, resulting in a sample of 116,179 persons.
oenofeinehep
is;sars
atpen
rIIfin
r
rti-
y,
ix-
ldothne
n
case, if the estimated number is any combinationthe poststratification age-sex-race cells in table I, thits value has been adjusted to official U.S. Bureauthe Census figures and its standard error is assumto be 0.0. This corresponds to parameter set XItable II. As an example, this would be the case for thnumber of persons in the U.S. target population or tnumber of black persons in the 18–44 year age grouAlthough the race class ‘‘white’’ is not specificallyadjusted to U.S. Bureau of the Census figures,dominates the poststratification ‘‘all other’’ race clasconsequently, age-sex-‘‘all other’’ race combinationof table I can be treated as age-sex-white combintions for the purpose of approximating standard erro
For the second case, the standard errors for all other estimof numbers of people or events, such as the number of peolimited in activity or the number of acute conditions, arapproximated by using the parameters provided in table II aformula 1 below.
If the aggregatex for a characteristic has associated parametersa andb, then the approximate standard error forx, SE(x),can be computed by the formula
SE(x) = √ax2 + bx (1)
Example of rule 1. As shown in table 7, the estimated numbeof acute conditions for males is 195,919,000. From tableparameter set I, thea and b parameters for the numbers oacute conditions are 0.000199 and 73,300, respectively. Usformula 1, the estimated standard error is
√(0.000199)(195,919,000)2+(73,300)(195,919,000)
= 4,690,344
An approximate 95-percent confidence interval fothe number of acute conditions for males is from186,725,926 to 205,112,074 (195,919,000±1.96(4,690,344)).
Examples are not provided for rules 2–5 or foapproximating the relative standard error of an esmate. Readers are referred to appendix I ofCurrentEstimates from the National Health Interview Surve1992 (15) for examples using the 1992 estimates.
Rule 2. For rates, proportions, and percents when the denomnator is generated by the poststratification age-serace classes (table I)—In this case, the denominatorhas no sampling error. For example, rule 2 wouapply to the estimated number of bed days per persfor black persons age 65 years and over becausedenominator is a combination of the poststratificatiocells. Approximate standard errors for such estimatcan be computed using table IIa and b parametersassociated with the numerator characteristics alowith formula 2 below.
If the estimate of rate, proportion, or percentp isthe ratio of two estimated numbers,p = x/Y (wherep
f
d
.
t
-.
esle
d
-
,
g
-
ne
s
g
may be inflated by 100 for percents or 1,000 for ratesper 1,000 persons), withY having no sampling error,then the approximate standard error forp is given bythe formula
SE(p) = p√a + bx (2)
In this report, the value of the denominatorY isalways provided, but in a few cases the numeratorvaluex is not published. For these cases the value ofx may be computed by the formula
Rule 3. Proportions and percents when the denominator isnot generated by the poststratification age-sex-raceclasses—If p represents an estimated percent,b is theparameter from table II associated with the numeratorcharacteristics, andy is the number of persons in thedenominator upon whichp is based, then the standarderror ofp may be approximated by
SE(p) = √ bp (100− p)
y (3)
(If p is a proportion, then the above formula can beused but with 100 replaced by 1.0.)
Rule 4. Rates when the denominator is not generated by thepoststratification age-sex-race classes—If the esti-mated ratep is expressed as the ratio of two esti-mates, p = x/y (inflated by 100 or 1,000 whenappropriate), then the estimated standard error forp isgiven by the formula
SE(p) =
p√SE(x)2
x2 + SE(y)2
y2 − 2rSE(x)x
SE(y)y
(4)
where SE(x) and SE(y) are computed using rule 1 andx and y are obtained from the tables. No estimatesof r, the correlation between the numerator anddenominator, are presented in this report; therefore,only the first two terms are available. The reader mustassume thatr = 0.0. Assumingr = 0.0 will yield anoverestimate of the standard error ifr is actuallypositive and an underestimate ifr is negative.
Rule 5. Difference between two statistics (mean, rate, total,and proportion)—If x1 andx2 are two estimates, thenthe standard error of the difference (x1 − x2) can becomputed as follows:
x ={pY if p is a proportion or rate
per unit orpY100
if p is a percent or rate per100 units or
pY1,000
if p is a rate per 1,000 units
135
re
theisbyof
136
SE(x1
− x2) = √SE(x
1)2 + SE(x
2)2 − 2r SE(x
1)SE(x
2)(5)
where SE(x1) and SE(x2) are computed using rules1–4 as appropriate andr is the correlation coefficientbetweenx1 and x2.
Assuming r = 0.0 will result in an accuratestandard error if the two estimates are actually uncor-related and will result in an overestimate of thestandard error if the correlation is positive or anunderestimate if the correlation is negative.
Relative standard errors
Prior to 1985, relative standard error (RSE) curves wepresent inCurrent Estimatesfor approximating relative stan-dard errors. For readers who wish to continue using them,following provides guidance. The RSE of an estimateobtained by dividing the standard error (SE) of the estimatethe estimatex itself. This quantity is expressed as a percentthe estimate:
RSE= 100SE(x)x
yereor actily
edodierorllthe
esldto
3a3nicnsnsr-
tsein
analt
cseenasis
om
eeesly
edteeily,a
enas,Ifaeklyint
lt
eer
to-ut
al
llyes5ge,e,
Appendix IIDefinitions of certain termsused in this report
Terms relating to conditions
Condition—Condition is a general term that includes anspecific illness, injury, or impairment. Condition data arderived from the survey in two ways. First, respondents aasked to identify any conditions that caused certain typesimpact associated with health, such as a visit to a doctor oday spent in bed. Second, respondents are read lists of selechronic conditions and asked whether they or any fammembers have any of these conditions.
At a later point in the survey, a series of questions is askabout each of the conditions identified in either of the twways just described. The information obtained on each contion helps to clarify the nature of the condition and whethmedical services have been involved in its diagnosistreatment. It also aids in the coding of the condition. Aconditions except impairments are coded according toninth revision of theInternational Classification of Diseases(2), with certain modifications adopted to make the codmore suitable for information derived from a househosurvey. A special set of codes devised by the NHIS is usedcode impairments.
Chronic condition—A condition is considered chronic if(a) the respondent indicates it was first noticed more thanmonths before the reference date of the interview, or (b) it istype of condition that ordinarily has a duration of more thanmonths. Examples of conditions that are considered chroregardless of their time of onset are diabetes, heart conditioemphysema, and arthritis. A complete list of these conditiomay be obtained by contacting the Division of Health Inteview Statistics, National Center for Health Statistics.
Impairment—An impairment is a chronic or permanendefect, usually static in nature, that results from diseainjury, or congenital malformation. It represents a decreaseor loss of ability to perform various functions, particularlythose of the musculoskeletal system and the sense orgImpairments are grouped according to type of functionimpairment and etiology in the special NHIS impairmencodes.
Acute condition—A condition is considered acute if (a) itwas first noticed no longer than 3 months before the referendate of the interview, and (b) it is not one of the conditionconsidered chronic regardless of the time of onset. (Sdefinition of chronic condition.) However, any acute conditionot associated with either at least one doctor visit or at leone day of restricted activity during the reference period
f
ed
-
,
,
s.
e
t
considered to be of minor consequence and is excluded frthe final data produced by the survey.
Onset of condition—A condition is considered to havehad its onset when it was first noticed. This could be the timthe person first felt sick or became injured, or it could be thtime the person or family was first told by a physician that thperson had a condition of which he or she had been previouunaware.
Incidence of conditions—The incidence of a condition isthe number of cases that had their onset during a specifiperiod of time. A person may have more than one acucondition during a period of time or may have the samcondition, such as a headache, more than once. Ordinarhowever, a chronic condition can begin only one time duringgiven reference period.
Prevalence of conditions—The prevalence of a conditionis the number of persons who have the condition at a givpoint in time. Although the prevalence of acute conditions ismeaningful concept, it is seldom used in health statisticwhich generally focus on the incidence of acute conditions.the prevalence of a chronic condition is measured duringperiod of time (say, each week during a year), then thresulting estimate of prevalence is an average of 52 weeprevalence estimates. This is called an average annual poprevalence estimate.
Terms relating to disability
Disability—Disability is a general term that refers to anylong- or short-term reduction of a person’s activity as a resuof an acute or chronic condition.Limitation of activityrefers toa long-term reduction in a person’s capacity to perform thaverage kind or amount of activities associated with his or hage group.Restriction of activityrefers to particular kinds ofbehavior usually associated with a reduction in activity dueeither long- or short-term conditions. Thus limitation of activity refers to what a person is generally capable of doing, brestriction of activity ordinarily refers to a relatively short-term reduction in a person’s activities below his or her normcapacity.
Limitation of activity because of chronic conditions—Persons are classified in terms of the major activity usuaassociated with their particular age group. The major activitifor the age groups are (a) ordinary play for children underyears of age, (b) attending school for those 5–17 years of a(c) working or keeping house for persons 18–69 years of ag
137
toepaisdlsg-
nto
r,rnlpnthejo
daie
d
fh
r.he
ldu
o
e
itu
dwlitco
r
dfn.tedffr
ll)hofpsdorat
d
en
chsorm
ee
f
d-)s
gfare
and (d) capacity for independent living (e.g., the abilitybathe, shop, dress, eat, and so forth, without needing the hof another person) for those 70 years of age and over. Peoaged 18–69 years who are classified as keeping house areclassified by their ability to work at a job or business. (In threport, the major activity of persons 65–69 years is assumebe working or keeping house; however, questions were aasked about the capacity for independent living in this agroup, which would permit an alternative definition of limitation.)
In regard to these activities, each person is classified ione of four categories: (a) unable to perform the majactivity, (b) able to perform the major activity but limited inthe kind or amount of this activity, (c) not limited in the majoactivity but limited in the kind or amount of other activitiesand (d) not limited in any way. In regard to these foucategories, the NHIS publications often classify persons oby whether they are limited (groups a–c) or not limited (groud). Persons are not classified as limited in activity unless oor more chronic conditions are reported as the cause ofactivity limitation. If more than one condition is reported, threspondent is asked to identify the condition that is the macause of the limitation.
Restriction of activity—Four types of restricted activityare measured in the NHIS:bed days, work-loss daysforcurrently employed persons 18 years of age and over,school-loss daysfor children 5–17 years of age, andcut-down days.
A bed dayis one during which a person stayed in bemore than half a day because of illness or injury. All hospitdays for inpatients are considered bed days even if the patwas not in bed more than half a day.
A work-loss dayis one on which a currently employedperson 18 years of age and over missed more than half afrom a job or business.
A school-loss dayis one on which a student 5–17 years oage missed more than half a day from the school in whichor she was currently enrolled.
A cut-down dayis a day on which a person cuts down fomore than half a day on the things he or she usually does
Work-loss, school-loss, and cut-down days refer to tshort-term effects of illness or injury. However, bed days aremeasure of both long- and short-term disability, becausechronically ill bedridden person and a person with a cocould both report having spent more than half a day in bed dto an illness.
The number of restricted-activity days is the numberdays a person experienced at least one of the four typesactivity restriction just described. It is the most inclusivmeasure of disability days and the least descriptive; 4 daysrestricted activity may mean 4 bed days associated wserious illness or 4 days during which a person merely cdown on his or her activities due to a mild illness.
A single restricted-activity day may involve both a beday and a work-loss or school-loss day. However, a cut-doday cannot overlap with any of these three types of disabidays. In calculating the sum of restricted-activity days, eaday is counted only once even if more than one typeactivity restriction was involved.
138
lplelso
tooe
or
y
ee
r
lnt
ay
e
aa
e
fof
ofht
nyhf
Restricted-activity days may be associated with eithepersons or conditions.Person daysare the number of daysduring which a person restricted his or her activity.Conditiondaysare the number of days during which a condition causea person to restrict his or her activity. A person day orestricted activity can be caused by more than one conditioIn such a case, each condition causing restriction is associawith that day of restricted activity. Therefore, the number ocondition days of restricted activity may exceed the number operson days of restricted activity. This relationship holds foeach type of restricted-activity day.
When two or more conditions result in a day of restrictedactivity, the conditions may be (a) both (all) acute, (b) one(some) acute and the other (some) chronic, or (c) both (achronic. The number of restricted-activity days associated witacute conditions includes groups (a) and (b); the numbersuch days associated with chronic conditions includes grou(b) and (c). The phrase ‘‘associated with’’ rather than ’’causeby’’ is used to indicate that some days associated with acutechronic conditions are not necessarily caused solely by thtype of condition.
Assessed health status—The categories related to thisconcept result from asking the respondent, ‘‘Would yousay ’s health is excellent, very good, good, fair,or poor?’’ As such, it is based on a respondent’s opinion annot directly on any clinical evidence.
Terms relating to persons injured
Injury condition—An injury condition, or simply an injury,is a condition of the type that is classified according to thnature-of-injury code numbers (800–999) in the ninth revisioof the International Classification of Diseases(2). In additionto fractures, lacerations, contusions, burns, and so forth, whiare commonly thought of as injuries, this group of codeincludes poisonings and impairments caused by accidentsnonaccidental violence. Unless otherwise specified, the terinjury is used to cover all of these.
A person may sustain more than one injury in a singleaccident (for instance, a broken leg and laceration of thscalp), so the number of injury conditions may exceed thnumber of persons injured.
Statistics of acute injury conditions include only injuriesthat involved medical attendance or at least a half day orestricted activity.
E-codes and place of occurrence—Beginning in 1993, theNHIS began collecting additional data to create detailecause-of-injury classifications called ‘‘E-codes’’ (Supplementary Classification of External Causes of Injury and Poisoningfor injuries, poisonings, and other adverse medical reactionalong with place of occurrence.
Episodes of persons injured—Each time a person isinvolved in an accident or nonaccidental violence causininjury that results in medical attention or at least a half day orestricted activity, it is counted as a separate episode ofperson injured. Therefore, one person may account for mothan one episode of a person injured.
ivtat
urnalISc
fierry
roolepne
rod
rifayon
oorthy.yn
tisci
sorth
i-se
y
ss,r-r-
caly
rn-sdgs
.d
isaleasd.ya
efor
ttrn
.
-r
The number of episodes of persons injured is not equlent to the number of accidents for several reasons: (a)term ‘‘accident’’ as commonly used may not involve injuryall; (b) more than one injured person may be involved insingle accident, so the number of accidents resulting in injwould be less than the number of persons injured in accideand (c) the term ‘‘accident’’ ordinarily implies an accidentorigin, whereas ‘‘persons injured’’ as used in the NHincludes persons whose injuries resulted from certain nonadental violence.
The number of episodes of persons injured in a specitime interval is equal to or less than the incidence of injuconditions because a person may incur more than one injua single accident.
Terms relating to accidents
Motor vehicle—A motor vehicle is any mechanically oelectrically powered device, not operated on rails, on whichby which a person or property can be transported or drawna land highway. Any object being towed by a motor vehic(such as a trailer, coaster, sled, or wagon) is considered aof the motor vehicle. Devices used solely for moving persoor materials within the confines of a building and its premisare not counted as motor vehicles.
Moving motor vehicle accident—An accident is classifiedas ‘‘moving motor vehicle’’ if at least one of the motovehicles involved in the accident was moving at the timethe accident. This category is divided into ‘‘traffic’’ an‘‘nontraffic’’ accidents.
Traffıc moving motor vehicle accident—An accident is inthe ‘‘traffic’’ category if it occurred on a public street ohighway. It is considered to have occurred on the highwayoccurred wholly on the highway, originated on the highwterminated on the highway, or involved a vehicle partiallythe highway. (See ‘‘street or highway.’’)
Nontraffıc moving motor vehicle accident—The accidentis in the ‘‘nontraffic’’ category if it occurred entirely in anyplace other than a public street or highway.
Street or highway—‘‘Street or highway’’ means the entirewidth between property lines of a way or place, any partwhich is open for use of the public as matter of rightcustom. This includes more than just the traveled part ofroad. ‘‘Street or highway’’ includes the whole right-of-waPublic sidewalks are part of the street, but private drivewaprivate lanes, private alleys, and private sidewalks areconsidered part of the street.
Nonmoving motor vehicle accident—If the motor vehiclewas not moving at the time of the accident, the accidenconsidered a ‘‘nonmoving motor vehicle’’ accident andclassified in the ‘‘other accident’’ category. (See ‘‘other acdent.’’)
Accident while at work—An accident is classified a‘‘while at work’’ if the injured person was 18 years of ageover and was at work at a job or business at the timeaccident happened.
Home accident—An accident is classified as ‘‘home accdent’’ if the injury occurred either inside or outside the hou
a-he
ayts;
ci-
dyin
rn
artss
f
it,
f
e
s,ot
is
-
e
.
‘‘Outside the house’’ refers to the yard, building, and side-walks on the property. ‘‘Home’’ includes not only the person’sown home but also any other home in which the person mahave been injured.
Industrial place—This category includes factory build-ings, railway yards, warehouses, workshops, loading platformof factories or stores, construction projects (houses, buildingbridges, new roads, and the like), as well as buildings undegoing remodeling. However, accidents in private homes undegoing remodeling are classified as home accidents.
Other accident—This category includes injuries in publicplaces (such as tripping and falling in a store or on a publisidewalk) and also nonaccidental injuries such as homicidand suicidal attempts. The survey does not cover the militarpopulation, but current disability of various types resultingfrom prior injury that occurred while the person was in thearmed forces is covered and is included in this class.
Terms relating to physician contacts
Physician contact—A physician contact is defined asconsultation with a physician, in person or by telephone, foexamination, diagnosis, treatment, or advice. (Physician cotacts with hospital inpatients are not included.) The contact iconsidered to be a physician contact if the service is providedirectly by the physician or by a nurse or other person actinunder a physician’s supervision. For the purpose of thidefinition, ‘‘physician’’ includes doctors of medicine andosteopathic physicians. The term ‘‘doctor’’ is used in theinterview rather than ‘‘physician’’ because of popular usageHowever, the concept toward which all instructions are directeis that which is described here.
Physician contacts for services provided on a mass basare not included in the tabulations. A service received onmass basis is defined as any service involving only a singtest (such as a test for diabetes) or a single procedure (sucha measles inoculation) when this single service is administereidentically to all persons who are at the place for this purposeHence obtaining a chest x ray in a tuberculosis chest x-ratrailer is not included as a physician contact. However,special chest x ray given in a physician’s office or in anoutpatient clinic is considered a physician contact.
If a physician is called to a house to see more than onperson, the call is considered a separate physician contacteach person about whom the physician is consulted.
A physician contact is associated with the person abouwhom the advice is sought, even if that person does noactually see or consult the physician. For example, if a motheconsults a physician about one of her children, the physiciacontact is ascribed to the child.
Place of contact—The place of contact is a classificationof the type of place at which a physician contact took placeThe definitions of the various categories are as follows:
Telephone.Refers to medically related matters discussedin a telephone call with a physician or physician’s assistant. Calls for nonmedically related matters (such as foan appointment) are not included.
139

l
e’
ipbi
eh
ah
n
tn
a
ts
na
o
-aerehh
r
o
s
Offıce.Refers to physician offices that are not located inhospital.Hospital. Involves three types of places in a hospitaemergency room, clinic, and doctor’s office.Other. Any place not classified into one of the threcategories specified above, including clinics and HMOnot located in hospitals.
Interval since last physician contact—The interval sincethe last physician contact is the length of time prior to thweek of interview since a physician was last consultedperson or by telephone for treatment or advice of any tywhatever. A physician contact with a hospital inpatient cancounted as the last time a physician was seen even thoughnot included in the ‘‘physician contact’’ category.
Terms relating to hospitalization
Hospital—For this survey, a hospital is defined as aninstitution either (a) named in the listing of hospitals in thcurrentAmerican Hospital Association Guide to the HealtCare Fieldor (b) found on the Master Facility Inventory Listmaintained by the National Center for Health Statistics.
Short-stay hospital—A short-stay hospital is one in whichthe type of service provided is general; maternity; eye, enose, and throat; children’s; or osteopathic; or it may be thospital department of an institution.
Hospital day—A hospital day is a day on which a persois confined to a hospital. It is counted as a hospital day onlythe patient stays overnight. Thus a patient who entershospital on Monday afternoon and leaves Wednesday nooconsidered to have had two hospital days.
Hospital days during the year—The number of hospitaldays during the year is the total number for all hospitepisodes in the 12-month period prior to the interview weeFor the purposes of this estimate, episodes overlappingbeginning or end of the 12-month period are subdividedthat only those days falling within the period are included.
Hospital episode—A hospital episode is any continuousperiod of stay of 1 night or more in a hospital as an inpatieexcept the period of stay of a well newborn infant. A hospitepisode is recorded for a family member whenever any partthat person’s hospital stay is included in the 12-month periprior to the interview week.
Hospital discharge—A hospital discharge is the completion of any continuous period of stay of 1 night or more inhospital as an inpatient except the period of stay of a wnewborn infant. A hospital discharge is recorded whenevepresent member of the household is reported to have bdischarged from a hospital in the 12-month period prior to tinterview week. (Estimates were based on discharges toccurred during the 6-month period prior to the interview.)
Length of hospital stay—The length of hospital stay is theduration in days, exclusive of the day of discharge, ofhospital discharge. (See ‘‘hospital discharge.’’)
Average length of stay—The average length of stay pedischarged patient is computed by dividing the total numberhospital days for a specified group by the total numberdischarges for that group.
140
a
:
s
eneet is
y
r,e
ifheis
lk.heo
tlofd
llaeneat
a
off
Demographic terms
Age—The age recorded for each person is the age at lastbirthday. Age is recorded in single years and grouped in avariety of distributions depending on the purpose of the table.
Geographic region—For the purpose of classifying thepopulation by geographic area, the States are grouped intofour regions. These regions, which correspond to those usedby the U.S. Bureau of the Census, are as follows:
Region States included
Northeast Maine, Vermont, New Hampshire,Massachusetts, Connecticut, Rhode Island,New York, New Jersey, and Pennsylvania.
Midwest Ohio, Illinois, Indiana, Michigan, Wisconsin,Minnesota, Iowa, Missouri, North Dakota,South Dakota, Kansas, and Nebraska.
South Delaware, Maryland, District of Columbia,West Virginia, Virginia, Kentucky, Tennessee,North Carolina, South Carolina, Georgia, Florida,Alabama, Mississippi, Louisiana, Oklahoma,Arkansas, and Texas.
West Washington, Oregon, California, Nevada,New Mexico, Arizona, Idaho, Utah, Colorado,Montana, Wyoming, Alaska, and Hawaii.
Place of residence—The place of residence of a memberof the civilian noninstitutionalized population is classified asinside a metropolitan statistical area (MSA) or outside anMSA. Place of residence inside an MSA is further classified aseither central city or not central city.
Metropolitan statistical area—The definition and titles ofMSA’s are established by the U.S. Office of Management andBudget with the advice of the Federal Committee on Metro-politan Statistical Areas. Generally speaking, an MSA consistsof a county or group of counties containing at least one city(or twin cities) having a population of 50,000 or more plusadjacent counties that are metropolitan in character and areeconomically and socially integrated with the central city. InNew England, towns and cities rather than counties are theunits used in defining MSA’s. There is no limit to the numberof adjacent counties included in the MSA as long as they areintegrated with the central city, nor is an MSA limited to asingle State; boundaries may cross State lines. The metropoli-tan population in this report is based on MSA’s as defined inthe 1980 census and does not include any subsequent additionor changes.
Central city of an MSA—The largest city in an MSA isalways a central city. One or two additional cities may besecondary central cities in the MSA on the basis of either ofthe following criteria:
1. The additional city or cities must have a populationone-third or more of that of the largest city and a minimumpopulation of 25,000.
2. The additional city or cities must have at least 250,000inhabitants.
.:
,Ia
r
f
as
y
emm
rdrenidorae
ifto,
eorkhev-n,yheoton
ed
heity
ndand
ses
ese
e
m
Not central city of an MSA—This includes all of the MSAthat is not part of the central city itself.
Not in MSA—This includes all other places in the countryRace—The population was divided into three racial groups
‘‘white,’’ ‘‘black,’’ and ‘‘all other.’’ ‘‘All other’’ includedAleut, Eskimo or American Indian, Asian or Pacific Islanderand any other race not listed separately. Since 1992, the NHhas expanded race into 15 detailed racial groupings and‘‘other race’’ category (see appendix III, section L, question4a). Race characterization is based on the respondent’s desction of his or her racial background.
Income of family or of unrelated individuals—Each mem-ber of a family is classified according to the total income othe family of which he or she is a member. Within thehousehold, all persons related to each other by blood, mriage, or adoption constitute a family. Unrelated individualare classified according to their own incomes.
The income recorded is the total of all income received bmembers of the family (or by an unrelated individual) in the12-month period preceding the week of interview. Incomfrom all sources—for example, wages, salaries, rents froproperty, pensions, government payments, and help frorelatives—is included.
Currently employed—Persons 18 years of age and ovewho reported that at any time during the 2-week periocovered by the interview they either worked at or had a job obusiness are currently employed. Current employment includpaid work as an employee of someone else; self-employmein business, farming, or professional practice; and unpawork in a family business or farm. Persons who were temprarily absent from a job or business because of a temporaillness, vacation, strike, or bad weather are consideredcurrently employed if they expected to work as soon as thparticular event causing the absence no longer existed.
Sn
ip-
r-
st
-ys
Freelance workers are considered currently employedthey had a definite arrangement with one employer or morework for pay according to a weekly or monthly scheduleeither full time or part time.
Excluded from the currently employed population arpersons who have no definite employment schedule but wonly when their services are needed. Also excluded from tcurrently employed population are (a) persons receiving reenue from an enterprise but not participating in its operatio(b) persons doing housework or charity work for which thereceived no pay, (c) seasonal workers during the portion of tyear they were not working, and (d) persons who were nworking, even though having a job or business, but werelayoff and looking for work.
The number of currently employed persons estimatfrom the NHIS will differ from the estimates prepared fromthe Current Population Survey (CPS) of the U.S. Bureau of tCensus for several reasons. In addition to sampling variabilthey include three primary conceptual differences, namely:
1. The NHIS estimates are for persons 18 years of age aover; CPS estimates are for persons 16 years of ageover.
2. The NHIS uses a 2-week reference period, while CPS ua 1-week reference period.
3. The NHIS is a continuing survey with separate sampltaken weekly; CPS is a monthly sample taken for thsurvey week which includes the 12th of the month.
The most detailed operational definitions of all of thesterms are found in theNHIS Field Representative’s Manual(16). Instructions are given in the manual on how problecases associated with each concept are to be handled.
141