national forum on youth violence prevention city of philadelphia
TRANSCRIPT

National Forum on Youth Violence Prevention City of Philadelphia

Agenda• Introduction• City Overview: • Historical Information• Philadelphia’s Profile• Strengths of Philadelphia
• Proposal• Plan• Key Challenges• Take –A-ways

Introduction: Violence Prevention Collaborative Co-Chairs
Charles RamseyPolice CommissionerPhiladelphia Police
Dept.
Anne Marie AmbroseCommissioner
Department of Human Services
Kevin DoughertyAdministrative JudgePhiladelphia Family
Court

Introduction: City StructureMayor Michael A.
Nutter &
Chief of Staff/Deputy Mayor for Public
Safety Everett Gillison
Violence Prevention CollaborativeLed by Co-Chairs
Prevention Sub-
Committee
InterventionSub-
Committee
EnforcementSub-
Committee
Re-entrySub-
Committee

HistoryBetween 2001 and 2011,
Citywide:• There were a total of
17,032 shooting victims
• There were a total of 3,712 murder victims
Murder And Shooting Victims 2001 - 2011
YEAR CITYWIDE
MURDER SV
2001 309 1,528
2002 288 1,499
2003 348 1,700
2004 330 1,576
2005 377 1,636
2006 406 1,857
2007 391 1,597
2008 331 1,399
2009 302 1,361
2010 306 1,471
2011 324 1,408
Total 3,712 17,032

City Population 2011: 1.5 million • Up from 2000 Census• Approximately 22% of the population
under 18 years old
Philadelphia’s Profile

Philadelphia’s Profile• One in every four Philadelphians lives below the poverty
line.
• Nearly 40% of our children under 18 live in poverty.
• Nearly 60% of all children in Philadelphia live in a single headed household.
• 57% of Philadelphia children are eligible for free lunch based on USDA Food Environmental Atlas 2006
• 20% of Philadelphia adults are uninsured based on Small Area Health Insurance Estimates (SAHIE) 2009
• Philadelphia has an unemployment rate of 10.8% as of September 2012

White
Black
Asian
Other
Hispan
ic0
10
20
30
40
50
60
70
80
90 Race and Ethnic Breakdown (2011, ACS)
PhiladelphiaUnited States
Race & Ethnicity
Percen
t
Philadelphia’s Profile
• Philadelphia is much more racially diverse as compared with the national average, although there is a smaller Hispanic/Latino population

Philadelphia Profile
High School Graduates Bachelors Degree0
10
20
30
40
50
60
70
80
90
100Educational Attainment
(2011, ACS)
PhiladelphiaPennsylvaniaUnited StatesPe
rcen
t

Strengths of Philadelphia
• Strong Leadership• Strong Programs• Strong Commitment • Strong Partnerships• Disproportionate
Minority Contact (DMC) Work and Partnerships
• Communication between various agencies and departments
• Community feedback and responsiveness
• Collaboration amongst offices, agencies and departments
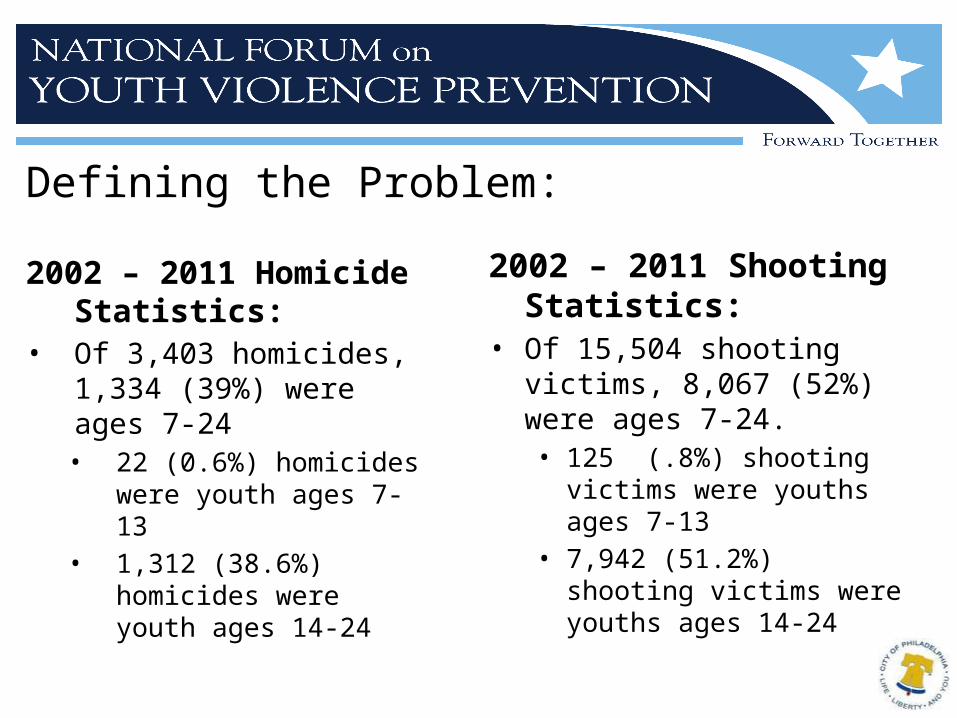
Defining the Problem:
2002 – 2011 Homicide Statistics:
• Of 3,403 homicides, 1,334 (39%) were ages 7-24• 22 (0.6%) homicides were
youth ages 7-13• 1,312 (38.6%) homicides
were youth ages 14-24
2002 – 2011 Shooting Statistics:
• Of 15,504 shooting victims, 8,067 (52%) were ages 7-24.• 125 (.8%) shooting victims
were youths ages 7-13• 7,942 (51.2%) shooting victims
were youths ages 14-24

Defining the Problem• 309 homicides and
1,191 shootings in 2012• 208 people 7-24 years
of age were shot in the four targeted districts• 35% of all shootings involving 7-24
year olds occur in these four districts
• 7-24 year olds make up 50% of all shootings for the entire City

Our Proposal • Philadelphia taking a place based approach to focus on
toughest areas of the City:• Focused on shooting and homicide “hotspots” in North Central
Philadelphia (22nd, 24th, 25th, 39th Police Districts)
• Intention is that the lessons learned from this surgical, place-based approach will translate into similar areas of the City
• Goal is to create a strategic plan to reduce shootings & homicides amongst youth & young adults (14-24 years old) in the hotspots
Initiating a comprehensive approach to developing a youth violence reduction/prevention strategy leads to the City’s ultimate goal to see a
25% reduction in all shootings and homicides.

Our PlanBuild Partnerships & Raise Awareness
• Seek Foundation & Private Sector Input Support• Youth Development• Community Engagement• Broad Coalition of Government Partners
Gather & Use Data Strategically• Gap Analysis
Utilize the Violence Prevention Collaborative’s recommendations to develop a strategy for implementation while continuously evaluating the effectiveness of our efforts.

Key Challenges: Technical Assistance Needs
• Data Collection, organization, and analysis
• Evaluation of programs and projects
• Connecting program research and program elements
• Creating a trauma informed approach
• Developing a sustainable structure inclusive of government and non-government partnerships
• Structuring focus groups; facilitation
• Connecting with other communities/cities• Access to best practices and
how they are delivered
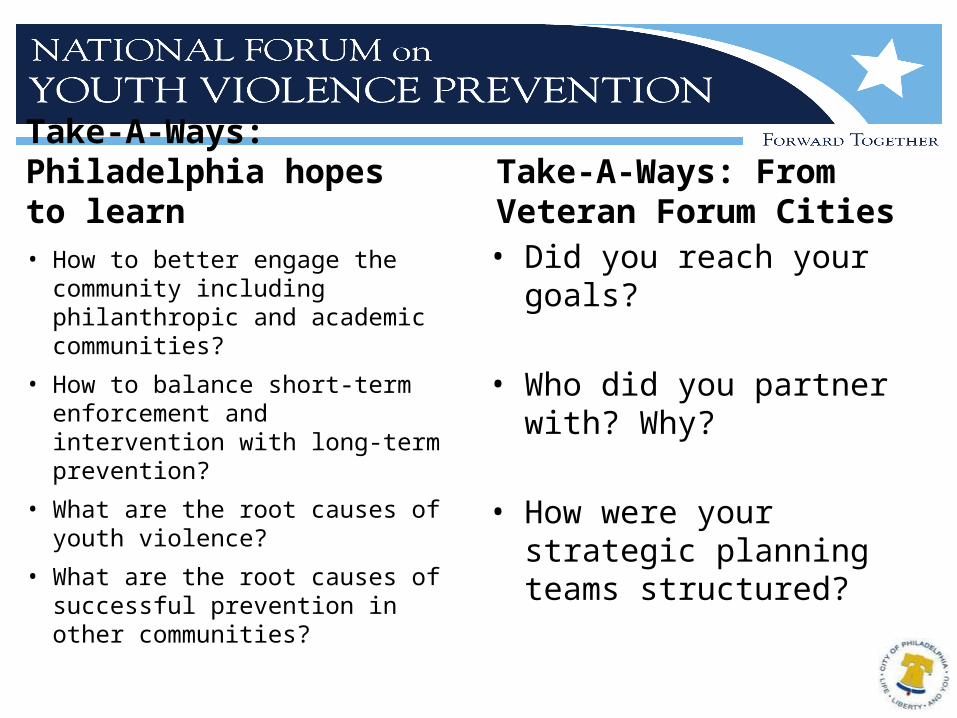
Take-A-Ways: From Veteran Forum Cities• Did you reach your
goals?
• Who did you partner with? Why?
• How were your strategic planning teams structured?
Take-A-Ways: Philadelphia hopes to learn• How to better engage the
community including philanthropic and academic communities?
• How to balance short-term enforcement and intervention with long-term prevention?
• What are the root causes of youth violence?
• What are the root causes of successful prevention in other communities?

Thank youFor selecting Philadelphia to be part of the
Forum
To our sister Forum cities for providing their time and sharing their expertise
We look forward to working with you all