national energy technology laboratory
TRANSCRIPT

Life Cycle Analysis of Coal Exports from the Powder River Basin
August 4, 2016 DOE/NETL-2016/1806
OFFICE OF FOSSIL ENERGY
National Energy Technology Laboratory

Disclaimer This report was prepared as an account of work sponsored by an agency of the United States Government. Neither the United States Government nor any agency thereof, nor any of their employees, makes any warranty, express or implied, or assumes any legal liability or responsibility for the accuracy, completeness, or usefulness of any information, apparatus, product, or process disclosed, or represents that its use would not infringe privately owned rights. Reference therein to any specific commercial product, process, or service by trade name, trademark, manufacturer, or otherwise does not necessarily constitute or imply its endorsement, recommendation, or favoring by the United States Government or any agency thereof. The views and opinions of authors expressed therein do not necessarily state or reflect those of the United States Government or any agency thereof.

Author List:
National Energy Technology Laboratory (NETL)
Timothy J. Skone, P.E. Senior Environmental Engineer
Strategic Energy Analysis and Planning Division
Energy Sector Planning and Analysis (ESPA)
Gregory Cooney, Matthew Jamieson, Joe Marriott, Michele Mutchek, and Michelle Krynock
Booz Allen Hamilton, Inc.
This report was prepared by Energy Sector Planning and Analysis (ESPA) for the United States Department of Energy (DOE), National Energy Technology Laboratory (NETL). This work was completed under DOE NETL Contract Number DE-FE0004001. This work was performed under ESPA Task 150.08.
The authors wish to acknowledge the excellent guidance, contributions, and cooperation of the NETL staff as well as several subject matter experts from the industry, particularly:
Gavin Pickenpaugh, NETL Technical Monitor
Michael Mewing, Dustin Sersland, Dan Speck, Lighthouse Resources
Darryl Maunder, Cloud Peak Energy
Don Collins, Western Research Institute and Wyoming Infrastructure Authority
Alan Bland, Jerrod Isaak, Western Research Institute
Loyd Drain, formerly with Wyoming Infrastructure Authority
Ken Miller, Wyoming Infrastructure Authority and consultant to Millennium Bulk Terminals
DOE Contract Number DE-FE0004001

This page intentionally left blank.

Life Cycle Analysis of Coal Exports from the Powder River Basin
i
Table of Contents Executive Summary ............................................................................................................................... 1 1 Introduction ......................................................................................................................................... 5 2 Background ......................................................................................................................................... 6
2.1 U.S. Coal Market ........................................................................................................................ 6 2.2 U.S. Coal Export Terminals ........................................................................................................ 8 2.3 World Coal Market ................................................................................................................... 12
3 LCA Model Overview ...................................................................................................................... 12 3.1 Basis of Comparison (Functional Unit) .................................................................................... 12 3.2 Boundaries ................................................................................................................................ 13 3.3 Representativeness .................................................................................................................... 13
3.3.1 Temporal ........................................................................................................................... 13 3.3.2 Technological .................................................................................................................... 14 3.3.3 Geographic ........................................................................................................................ 16
3.4 Impact Assessment .................................................................................................................... 16 3.4.1 Greenhouse Gases (GHGs) ............................................................................................... 16 3.4.2 Tool for the Reduction and Assessment of Chemical and Other Environmental Impacts
(TRACI) ............................................................................................................................. 16 4 Modeling Data .................................................................................................................................. 17
4.1 Surface Coal Mining ................................................................................................................. 17 4.1.1 Reference Mine ................................................................................................................. 18 4.1.2 Model Parameters for Mining and Coal ............................................................................ 19
4.1.2.1 Strip Ratio ................................................................................................................. 19 4.1.2.2 Mining Equipment Energy Use................................................................................. 19 4.1.2.3 Coal Quality .............................................................................................................. 21 4.1.2.4 Coal Mine Methane ................................................................................................... 24
4.2 Coal Transportation and Handling ............................................................................................ 24 4.2.1 Transport from Mine to Marine Bulk Terminal ................................................................ 25 4.2.2 Coal Handling at Export Terminal .................................................................................... 26 4.2.3 Transport from Export Terminal to Import Terminal ....................................................... 26
4.3 Power Plant Operations ............................................................................................................. 27 4.4 CO2 Transport and Saline Aquifer Sequestration ..................................................................... 30 4.5 Model Parameter Matrix ........................................................................................................... 30
5 Results/Discussion ............................................................................................................................ 31 5.1 Life Cycle GHG Results ........................................................................................................... 31 5.2 Sensitivity Analysis .................................................................................................................. 48
5.2.1 Sensitivity Tornados ......................................................................................................... 48 5.2.2 Construction Sensitivity .................................................................................................... 50
5.3 Uncertainty Analysis ................................................................................................................. 50 5.4 TRACI 2.1 Impact Assessment Results .................................................................................... 53 5.5 Data Limitations ........................................................................................................................ 59
6 References ......................................................................................................................................... 61

Life Cycle Analysis of Coal Exports from the Powder River Basin
ii
Figures Figure ES-1: LCA Results – Cradle-to-Busbar Coal Exports from Powder River Basin (PRB),
Australia (AU), and Indonesia (ID) to Asian Power Markets ...................................................... 3 Figure 2-1: U.S. Coal Production by Coal Rank.................................................................................... 6 Figure 2-2: U.S. Coal Balance ............................................................................................................... 7 Figure 2-3: U.S. Coal Exports by Coal Type ......................................................................................... 7 Figure 2-4: Potential Rail Routes for PRB Coal from Mine to Marine Terminals ................................ 8 Figure 2-5: U.S. Steam Coal Exports by Customs District .................................................................. 11 Figure 2-6: 2014 Steam Coal Imports to Japan, Korea, and Taiwan from Australia, Indonesia, and
U.S. .............................................................................................................................................. 12 Figure 3-1: Coal Export LCA Process Diagram .................................................................................. 15 Figure 5-1: LCA Results – Cradle-to-Busbar Coal Exports ................................................................ 32 Figure 5-2: Coal Export Scenario Uncertainty Range ......................................................................... 33 Figure 5-3: LCA Results – Cradle-to-Busbar Coal Exports – Upstream Results Only ....................... 34 Figure 5-4: Cradle-to-Busbar LCA Results for PRB Coal Exported to Japan ..................................... 36 Figure 5-5: Cradle-to-Busbar LCA Results for PRB Coal Exported to Japan – Upstream Results Only
..................................................................................................................................................... 37 Figure 5-6: Cradle-to-Busbar LCA Results for Australian Coal Exported to Japan............................ 38 Figure 5-7: Cradle-to-Busbar LCA Results for Australian Coal Exported to Japan – Upstream Results
Only ............................................................................................................................................. 39 Figure 5-8: Cradle-to-Busbar LCA Results for Indonesian (Adaro) Coal Exported to Japan ............. 40 Figure 5-9: Cradle-to-Busbar LCA Results for Indonesian (Adaro) Coal Exported to Japan --
Upstream Results Only ................................................................................................................ 41 Figure 5-10: Cradle to Busbar LCA Results for Indonesian (Mulia) Coal Exported to Japan ............ 42 Figure 5-11: Cradle-to-Busbar LCA Results for Indonesian (Mulia) Coal Exported to Japan --
Upstream Results Only ................................................................................................................ 43 Figure 5-12: Cradle-to-Busbar LCA Results for PRB Coal Exported to Japan – CCS Technology
Case.............................................................................................................................................. 44 Figure 5-13: Cradle-to-Busbar LCA Results for Australian Coal Exported to Japan – CCS
Technology Case ......................................................................................................................... 45 Figure 5-14: Cradle-to-Busbar LCA Results for Indonesian (Adaro) Coal Exported to Japan – CCS
Technology Case ......................................................................................................................... 46 Figure 5-15: Cradle-to-Busbar LCA Results for Indonesian (Mulia) Coal Exported to Japan – CCS
Technology Case ......................................................................................................................... 47 Figure 5-16: Sensitivity Analysis Results based on AR5 100-yr GWP GHG Emissions – Japan
Scenarios Only ............................................................................................................................. 49 Figure 5-17: Cradle-to-Busbar LCA Results for Australian Coal Exported to Japan – Upstream
Results Only – Construction Impacts Increased Tenfold ............................................................ 50 Figure 5-18: Cradle-to-Busbar Uncertainty Analysis Results for PRB Coal Exported to Japan ......... 51 Figure 5-19: Cradle-to-Busbar Uncertainty Analysis Results for Australian Coal Exported to Japan 52 Figure 5-20: Cradle-to-Busbar Uncertainty Analysis Results for Indonesian (Adaro) Coal Exported to
Japan ............................................................................................................................................ 52 Figure 5-21: Cradle-to-Busbar Uncertainty Analysis Results for Indonesian (Mulia) Coal Exported to
Japan ............................................................................................................................................ 53 Figure 5-22: TRACI 2.1 Acidification Results .................................................................................... 54 Figure 5-23: TRACI 2.1 Eutrophication Results ................................................................................. 55 Figure 5-24: TRACI 2.1 Human Health Particulate Results ............................................................... 56 Figure 5-25: TRACI 2.1 Smog Formation Results .............................................................................. 57

Life Cycle Analysis of Coal Exports from the Powder River Basin
iii
Figure 5-26: TRACI 2.1 Impact Assessment Results – Japan Scenario Only; Normalized to Highest Contribution in Each Impact Category (Ocean transport removed), ........................................... 58
Figure 5-27: TRACI 2.1 Impact Assessment Results – Japan Scenario Only; Normalized to Highest Contribution in Each Impact Category (Ocean transport included) ............................................ 59

Life Cycle Analysis of Coal Exports from the Powder River Basin
iv
Tables Table 2-1: Current, Approximate U.S. and Canadian Export Capacity at Existing Coal Export
Terminals ....................................................................................................................................... 9 Table 2-2: Proposed Coal Export Terminal Projects and Their Current Project Status ....................... 10 Table 3-1: IPCC Global Warming Potentials (IPCC, 2013) ................................................................ 16 Table 4-1: Energy Use for Reference Mine (DOE, 2002; D. Maunder, 2015; USGS, 2011) ............ 19 Table 4-2: Grid Mix for Electrically-Powered Equipment1 ................................................................. 21 Table 4-3: Coal Quality Data for Export-Grade Coals ........................................................................ 23 Table 4-4: Coal Mine Methane Emission Factors ............................................................................... 24 Table 4-5: Domestic Transport Modes and Distances ......................................................................... 26 Table 4-6: Diesel Engine and Fuel Parameters ................................................................................... 26 Table 4-7: Ocean Transport Distance (km) .......................................................................................... 27 Table 4-8: NETL PPFM Model Output by Coal Source ..................................................................... 29 Table 4-9: Coal Exports Scenario Parameter Matrix ........................................................................... 31

Life Cycle Analysis of Coal Exports from the Powder River Basin
v
Acronyms and Abbreviations AR5 Fifth Assessment Report, IPCC scf Standard cubic feet AU Australia SF6 Sulfur hexafluoride Btu British thermal unit SO2 Sulfur dioxide CBM Coalbed methane SO2e Sulfur dioxide equivalent CCS Carbon capture and sequestration SOx Sulfur oxide CH4 Methane SCR Selective catalytic reduction CO Carbon monoxide T&D Transmission and distribution CO2 Carbon dioxide TRACI Tool for the Reduction and CO2e Carbon dioxide equivalent Assessment of Chemical and Other EIA Energy Information Administration Environmental Impacts EPA Environmental Protection Agency ton Short ton (2,000 lb) FGD Flue-gas desulfurization tonne Metric ton (1,000 kg) GHG Greenhouse gas ULSD Ultra-low-sulfur diesel GWP Global warming potential U.S. United States H+ Hydrogen ion USCPC Ultra-super critical pulverized coal HHV Higher heating value USGS United States Geological Survey hp Horsepower VOC Volatile organic compound ID Indonesia yr Year IPCC Intergovernmental Panel on Climate Change kg Kilogram km Kilometer kW Kilowatt kWh Kilowatt-hour lb Pound LCA Life cycle assessment/analysis LHV Lower heating value MJ Megajoule mmt Million metric ton MW Megawatt MWh Megawatt-hour N2O Nitrous oxide NETL National Energy Technology Laboratory Nitrogen-e Nitrogen equivalent NMHC Non-methane hydrocarbon NO2 Nitrogen dioxide NOx Nitrogen oxide O3 Ground-level ozone O3e Ozone equivalent PM Particulate matter PM2.5 Particulate matter with a diameter of less than 2.5 micrometers PM2.5e Particulate matter with a diameter of less than 2.5 micrometers equivalent PM10 Particulate matter with a diameter of 10 micrometers or less PPFM Power Plant Flexible Model PPM Parts per million PRB Powder River Basin QGESS Quality Guidelines for Energy System Studies

This page intentionally left blank.

Life Cycle Analysis of Coal Exports from the Powder River Basin
1
Preface The authors would like to acknowledge that a version of this report has been published in the open access journal, ENERGIES, Volume 9, Issue 7, on July 19, 2016, under the title, Understanding the Contribution of Mining and Transportation to the Total Life Cycle Impacts of Coal Exported from the United States. The DOI for the published version of this report is 10.3390/en9070559.

Life Cycle Analysis of Coal Exports from the Powder River Basin
2
Executive Summary The purpose of this study is to compare environmental implications of exporting United States (U.S.) coal resources to Asian markets with respect to alternative global sources of steam coal. The combination of significant Asian demand1 for steam coal and declining U.S. domestic coal consumption in recent years has opened up new potential export markets for U.S. Powder River Basin (PRB) coal. This is evidenced by the recent increase in West Coast terminal proposals to meet this demand.
This study seeks to evaluate and understand potential environmental consequences of exporting PRB coal compared to global alternative sources of coal. Some of the questions which arise in regards to environmental impacts of PRB exports to Asia include: (1) Which stages of the life cycle (e.g., mining, transport, power plant combustion) contribute the most to environmental impacts? (2) How do environmental impacts at each stage differ between the PRB and competing countries? (3) Do environmental impacts differ substantially based on the importing country? (4) Is there a definitive difference between the life cycle greenhouse gas (GHG) profiles between sourcing coal from the U.S. (PRB), Australia, or Indonesia for Japan, South Korea, or Taiwan?
Life cycle analysis (LCA) is by its nature a tool built to address questions such as these. LCA is a comprehensive form of analysis that can be used to evaluate the environmental, economic, and social attributes of energy systems, ranging from the extraction of raw materials from the ground to the use of the energy carrier to perform work2.
The primary objective of this study is to develop a comprehensive LCA of exporting coal from the PRB in the U.S. to potential destinations in Asia. While estimating LCA results – such as emissions and emission rates – is useful, in order to gain a complete sense of the impacts, it is necessary to have a baseline to compare the results against. This requires assumptions of both competitor and potential customer countries. For the purposes of this analysis, Australia and Indonesia3 are deemed to be the competitor countries to the U.S., while Japan, South Korea, and Taiwan are assumed to be the potential customers of PRB exports. The customer countries were chosen because they are the likely potential target market of U.S. PRB coal exports4; Australia and Indonesia were chosen as competitor countries because they are currently major suppliers of steam coal to Japan, South Korea, and Taiwan. In terms of overall Asian coal trade, Indonesia is the largest coal exporter with Australia coming in second (IEA, 2014).
The scope of this LCA is a cradle-to-busbar comparison of 1 megawatt hour (MWh) of electricity generated at a nonspecific power plant in potential customer countries in Asia using PRB coal exported from the U.S. with the same MWh generated from regional coal alternatives sourced from Australia and Indonesia. There are 12 unique modeled cases in this analysis in order to represent each
1 The EIA Annual Energy Outlook 2015 indicates there were 690 million metric tons (mmt) of global steam coal exports to Asia in 2014, with a projected increase to 745 mmt in 2020.
2 Details on life cycle analysis for energy related systems can be found at: http://www.netl.doe.gov/LCA.
3 More specifically, this analysis represents coal mines in HunterValley, Australia and South Kalimantan, Indonesia.
4 Competitor countries Japan, South Korea, and Taiwan currently import greater than 95 percent of their steam coal requirements; each country is projected to continue to import significant amounts of steam coal in the future; each of these countries is located where exports from West Coast terminals are logistically feasible.

Life Cycle Analysis of Coal Exports from the Powder River Basin
3
potential combination of export and import country (including two coal types in Indonesia). This LCA also assumes that the power plant in each importing country is a best available technology power plant with advanced emission controls (i.e., an ultra-super critical pulverized coal (USCPC) plant). The USCPC plant design, fired with sub-bituminous coal (PRB Rosebud), was previously modeled by The National Energy Technology Laboratory (NETL) (NETL, 2011). The USCPC assumption is made because the increase in coal imports by the destination countries is assumed to satisfy the marginal demand for electricity (i.e., the exported coal is utilized to generate the next marginal MWh of electricity). As such, this analysis is attributional in nature. No consequential effects, such as the displacement of other power generation technologies, have been considered.
The text below summarizes the answers to the four main research questions posed for this study regarding the environmental impacts of PRB exports to Asia.
(1) Which stages of the life cycle (e.g., mining, transport, power plant combustion) contribute the most to environmental impacts?
The results of this LCA, as shown in Figure ES-1, find that the majority of cradle-to-busbar life cycle GHG emissions in all cases are from the combustion of coal at the destination power plant (92.5 to 96.1 percent of the total impacts, depending on the individual case). Coal mining activities account for 0.8 to 3.3 percent, while transport accounts for 2.0 to 6.7 percent.
(2) How do environmental impacts at each stage differ between the PRB and competing countries?
Emissions associated with coal mining activities are more significant in Australia and Indonesia compared to the PRB. Both countries have considerably higher strip ratios compared to the PRB, meaning that more overburden must be removed for each unit of coal produced. Additionally, the coal mine methane emissions from Australia and Indonesia are 3.5 to 5 times higher than those modeled as the expected value for the PRB. Finally, Australian coal is processed at a coal cleaning facility prior to export. The direct impacts of the coal cleaning facility are small; however, the indirect effects of scaling up mining activities to yield one unit of exportable coal increase the emissions associated with mining.
Transportation activities can be split into two categories: domestic and international. Domestic transportation is required to get coal from the mine to the export terminal. International travel via ocean freighter carries the coal from the export terminal to the import terminal located in the destination country. It is assumed that there is no local travel in the destination country as the power plants are located adjacent to the import terminals. The domestic transportation component is much more significant for coal from the PRB compared to coals sourced from Australia or Indonesia. This is due entirely to the proximity of the coal mine to the export terminal. Coal sourced from the PRB is transported an expected distance of 2,000 kilometers (km) by rail, while coal sourced in Australia and Indonesia travels only 150 and 329 km, respectively.
Power plant combustion emissions range from 772 kg of carbon dioxide equivalent (CO2e)/MWh (Australia) to 835 kg CO2e/MWh (Indonesia – Mulia). The emissions from the combustion of PRB are approximately 800 kg CO2e/MWh. Differences in the emission factors are driven by the differences in coal quality, which ultimately impacts the efficiency of the power plant.

Life Cycle Analysis of Coal Exports from the Powder River Basin
4
When considering the categories in the Tool for the Reduction and Assessment of Chemical and Other Environmental Impacts (TRACI) version 2.11 that are included in this study, coal sourced from Indonesia tends to have the highest impacts, when the localized impacts of ocean transport are not considered. This can be attributed to non-regulated diesel engine emissions in Indonesia over the study period. Global warming potential (GWP) is the only impact category in which the coal sources are essentially even.
(3) Do environmental impacts differ substantially based on the importing country?
The destination for the coal does not contribute much variability to the life cycle results. For example, the results for Australian coal range from 834 to 836 kilograms (kg) of carbon dioxide equivalent per MWh (kg CO2e/MWh) depending on the destination. The most pronounced range (864 to 873 kg CO2e/MWh) is for PRB-sourced coal because of the significant transport distances. The rank order of expected values for the coal sources does not change given the destination.
(4) Is there a definitive difference between the life cycle GHG profiles between sourcing coal from the U.S. (PRB), Australia, or Indonesia for Japan, South Korea, or Taiwan?
Given the uncertainty in the model parameter values, there is not a definitive difference between the life cycle GHG profiles between sourcing coal from the U.S. (PRB), Australia, or Indonesia for Japan, South Korea, or Taiwan. In fact, when accounting for the uncertainty, it is difficult to attribute any significant difference between the various coal sources. The life cycle GHG emissions for coal sourced from Australia tends to be slightly lower than PRB and Indonesian coal, but no definitive conclusions can be made. Additionally, no definitive conclusion can be made between Indonesian and PRB coal, because the uncertainty spans the results of both of the coals.
Figure ES-1: LCA Results – Cradle-to-Busbar Coal Exports from Powder River Basin (PRB), Australia (AU), and Indonesia (ID) to Asian Power Markets
1 TRACI is an impact characterization method created by the U.S. Environmental Protection Agency (EPA) that includes various impact categories. TRACI impact categories used in this analysis include acidification, eutrophication, photochemical smog formation, and human health particulates.
864 834 854 895 867 836 853 894 873 834 847 886
0100200300400500600700800900
1,000
PRB AU ID -Adaro
ID -Mulia
PRB AU ID -Adaro
ID -Mulia
PRB AU ID -Adaro
ID -Mulia
Japan Korea TaiwanGre
enho
use
Gas
Em
issi
ons
AR5
100-
yr
GW
P(k
g CO
₂e/M
Wh)
Mining Coal Cleaning Truck Transport Rail Transport Barge Transport
Export Terminal Ocean Transport Import Terminal Power Plant

Life Cycle Analysis of Coal Exports from the Powder River Basin
5
1 Introduction The purpose of this study is to compare environmental implications of exporting United States (U.S.) coal resources to Asian markets with respect to alternative global sources of steam coal. The combination of significant Asian demand1 for steam coal and declining U.S. domestic coal consumption in recent years has opened up new potential export markets for U.S. Powder River Basin (PRB) coal. This is evidenced by the recent increase in West Coast terminal proposals to meet this demand.
This study seeks to evaluate and understand potential environmental consequences of exporting PRB coal compared to global alternative sources of coal. Some of the questions which arise in regards to environmental impacts of PRB exports to Asia include: Which stages of the life cycle (e.g., mining, transport, power plant combustion) contribute the most to environmental impacts? How do environmental impacts at each stage differ between the PRB and competing countries? Do environmental impacts differ substantially based on the importing country? Life cycle analysis (LCA) is by its nature a tool built to address questions such as these. LCA is a comprehensive form of analysis that can be used to evaluate the environmental, economic, and social attributes of energy systems, ranging from the extraction of raw materials from the ground to the use of the energy carrier to perform work2.
The primary objective of this study is to develop a comprehensive LCA of exporting coal from the PRB in the U.S. to potential destinations in Asia. While estimating LCA results, such as emissions and emission rates is useful, in order to gain a complete sense of the impacts, it is necessary to have a baseline to compare the results against. This requires assumptions of both competitor and potential customer countries. For the purposes of this analysis, Australia and Indonesia are deemed to be the competitor countries to the U.S., while Japan, South Korea, and Taiwan are assumed to be the potential customers of PRB exports. The customer countries were chosen because they are the likely potential target market of U.S. PRB coal exports3; Australia and Indonesia4 were chosen as competitor countries because they are currently major suppliers of steam coal to Japan, South Korea, and Taiwan. In terms of overall Asian coal trade, Indonesia is the largest coal exporter with Australia coming in second (IEA, 2014).
The scope of this LCA is a cradle-to-busbar comparison of one megawatt hour (MWh) of electricity generated at an unspecified power plant in Asia using PRB coal exported from the U.S. with the same MWh generated from regional coal alternatives sourced from Australia and Indonesia. There are 12 unique modeled cases in this analysis in order to represent each potential combination of export and import country (including two coal types in Indonesia). This LCA also assumes that the power plant in each importing country is a best available technology power plant with advanced
1 For instance, the EIA Annual Energy Outlook 2015 indicates there were 690 million metric tons (mmt) of global steam coal exports to Asia in 2014, with a projected increase to 745 mmt in 2020.
2 Details on life cycle analysis for energy related systems can be found at: http://www.netl.doe.gov/LCA.
3 Competitor countries Japan, South Korea, and Taiwan currently import greater than 95 percent of their steam coal requirements; each country is projected to continue to import significant amounts of steam coal in the future; each of these countries is located where exports from West Coast terminals are logistically feasible.
4 More specifically, this analysis represents coal mines in Hunter Valley, Australia and South Kalimantan, Indonesia.

Life Cycle Analysis of Coal Exports from the Powder River Basin
6
emission controls (i.e., an ultra-super critical pulverized coal (USCPC) plant). The USCPC plant design, fired with sub-bituminous coal (PRB Rosebud), was previously modeled by The National Energy Technology Laboratory (NETL) (NETL, 2011). The USCPC assumption is made because the increase in coal imports by the destination countries is assumed to satisfy the marginal demand for electricity (i.e., the exported coal is utilized to generate the next marginal MWh of electricity). As such, this analysis is attributional in nature. No consequential effects, such as the displacement of other power generation technologies, have been considered.
2 Background
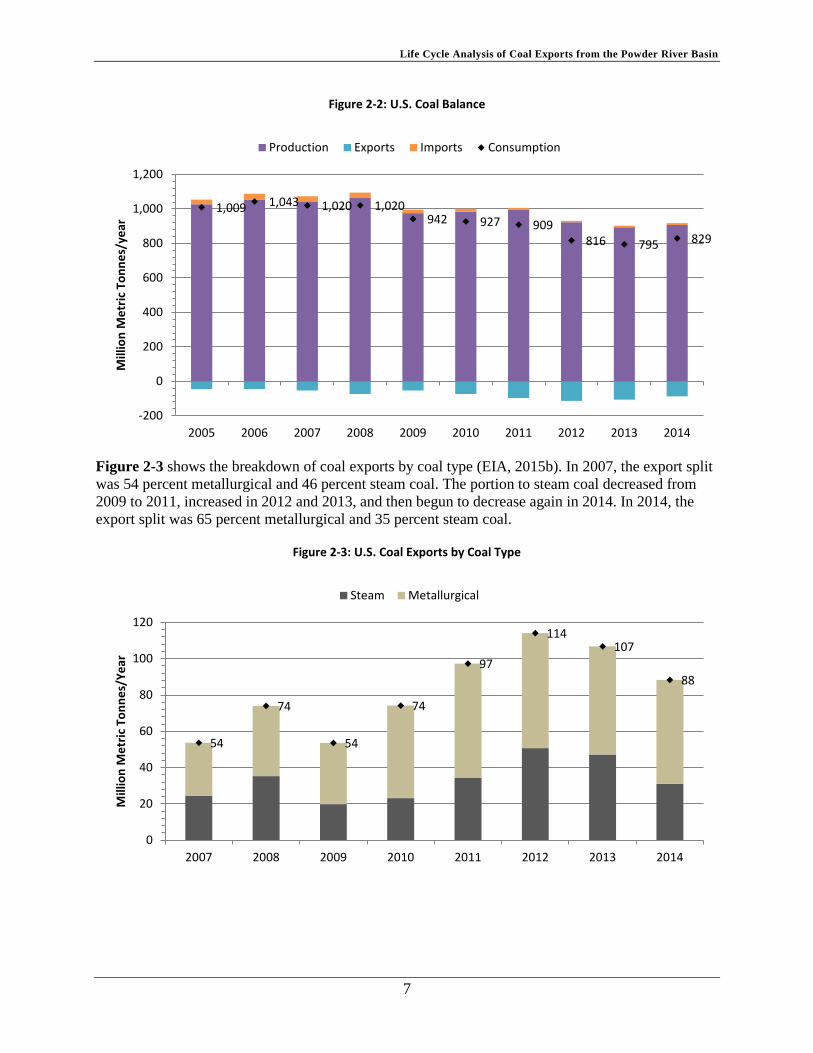
2.1 U.S. Coal Market Coal production in the U.S. is in decline. Figure 2-1 shows coal production in the U.S. by coal rank since 2005.Figure 2-2 shows coal consumption in the U.S. From 2005 to 2012, U.S. coal production has decreased by approximately 10 percent and U.S. consumption was down by 19 percent (EIA, 2015a, 2015c, 2015e). The delta between U.S. production and consumption is filled by increased exports of coal. Exports represented 4.4 percent of production in 2005 and 12.4 percent of production in 2012, while imports have contributed approximately 1 to 3 percent to the consumption mix. To provide perspective on the subbituminous portion of Figure 2-1, in 2014, PRB coal production accounted for 379 million metric tons (mmt) of the 905 mmt of total U.S. coal production (EIA, 2015e).
Figure 2-1: U.S. Coal Production by Coal Rank
1,026 1,055 1,040 1,063 975 984 994
922 893
0
200
400
600
800
1,000
1,200
2005 2006 2007 2008 2009 2010 2011 2012 2013
Mill
ion
Met
ric T
onne
s/ye
ar
Bituminous Subituminous Lignite Anthracite Total
Life Cycle Analysis of Coal Exports from the Powder River Basin
7
Figure 2-2: U.S. Coal Balance
Figure 2-3 shows the breakdown of coal exports by coal type (EIA, 2015b). In 2007, the export split was 54 percent metallurgical and 46 percent steam coal. The portion to steam coal decreased from 2009 to 2011, increased in 2012 and 2013, and then begun to decrease again in 2014. In 2014, the export split was 65 percent metallurgical and 35 percent steam coal.
Figure 2-3: U.S. Coal Exports by Coal Type
1,009 1,043 1,020 1,020 942 927 909
816 795 829
-200
0
200
400
600
800
1,000
1,200
2005 2006 2007 2008 2009 2010 2011 2012 2013 2014
Mill
ion
Met
ric T
onne
s/ye
ar
Production Exports Imports Consumption
54
74
54
74
97
114107
88
0
20
40
60
80
100
120
2007 2008 2009 2010 2011 2012 2013 2014
Mill
ion
Met
ric T
onne
s/Ye
ar
Steam Metallurgical

Life Cycle Analysis of Coal Exports from the Powder River Basin
8
2.2 U.S. Coal Export Terminals Activity surrounding the construction of new thermal coal terminals and the expansion of existing terminals in North America can be characterized by geographic region. The west coast of Canada has four active coal terminals, mainly in the Vancouver area (CBC News, 2014; Source Watch, 2015). Texada Island Port has received a permit to expand and export additional coal (CBC News, 2014). The coal exported from Canada is a mix of thermal coal and metallurgical coal (Moore, 2013; Source Watch, 2014). The majority of coals exported from Canada are transported to Asian markets (Source Watch, 2015).
The west coast of the U.S. has several proposed projects, but many of them have been abandoned by the companies or rejected by government officials. For these projects, it is confirmed that the goal is or was to export PRB coal to Asia (Oregon Public Broadcasting, 2012). Figure 2-4 shows the potential rail routes to transport PRB coal from Wyoming to proposed marine terminals in the Pacific Northwest (Oregon Public Broadcasting, 2012).
Figure 2-4: Potential Rail Routes for PRB Coal from Mine to Marine Terminals1
On the east and southeast coast of the U.S. there are many proposed projects, but the current status of most of the projects is unclear. One way that these projects differ from the West Coast projects is that they vary more widely in coal types being exported (both Eastern and Western coal) as well as final export locations (South America, Europe, and Asia). Table 2-1 lists the current export capacity of existing U.S. coal export terminals (National Mining Association, n.d.). Table 2-2 lists information about proposed export terminal projects in the U.S. and Canada, including new terminals and existing terminal expansions (Cornot-Gandolphe, 2015).
1 Adapted from an interactive map (Oregon Public Broadcasting, 2012).

Life Cycle Analysis of Coal Exports from the Powder River Basin
9
Table 2-1: Current, Approximate U.S. and Canadian Export Capacity at Existing Coal Export Terminals
Terminal Location Current Capacity (mmt/yr) Canadian West Coast 57.5
Westshore Terminal Port Metro, British Columbia 33 Ridley Terminal Prince Rupert, Vancouver 12
Neptune Bulk Terminal Port Metro, British Columbia 12.5 U.S. West Coast 5.2-9.1
Long Beach/Port of Stockton/Levin-Richmond Terminal
California 2-5.91
Seaward Coal Terminal Seaward, AK 2.2 Port Mackenzie Anchorage, AK 1
Canadian East Coast 9 International Coal Terminal Sydney Nova Scotia 1
Canso, Nova Scotia Midstream Operations Canso, Nova Scotia 8 Total Canada East Coast 9
U.S. Great Lakes 26.1 Ashtabula Coal Dock Ashtabula, OH 9
Conneaut Dock Ashtabula, OH 9 Sandusky Dock Pier 3 Sandusky, OH 1.8
Superior Terminal Lake Superior, WI 4 Presque Isle Dock Erie, PA 0.5 Gateway Terminal Port of Buffalo, NY 1.8
U.S. East Coast 96.7 CNX Marine Port of Baltimore, MD 13.6
Chesapeake Bay Terminal (CSX) Port of Baltimore, MD 9.5 Lamberts Point (NS) Port of Hampton Roads, VA 34.5
Pier IX Port of Hampton Roads, VA 14.5 Dominion Terminal Associates (DTA) Port of Hampton Roads, VA 20
Fairless Hills Philadelphia, PA 1.8 Shipyard River Terminal Port of Charleston, SC 1.8
Port of Tampa Port of Tampa, FL 1 U.S. Gulf Coast 80.6
McDuffie Terminal Port of Mobile, AL 9.1 CHIPCO Terminal Port of Mobile, AL 1
Bulk Materials Handling Plant Port of Mobile, AL 2.7 United Bulk Terminal Port of New Orleans, LA 10.9
Lower Mississippi River Midstream Operators Port of New Orleans, LA 29 International Marine Terminal Port of New Orleans, LA 9
IC Rail Marine Terminal (Convent) Lower Miss. River, LA 9.1 Deepwater Terminal Port of Pasadena, TX 6
Port of Houston (HBT) Port of Houston, TX 2.4 Port of Corpus Christi Bulk Terminal Port of Corpus Christi, TX 1.4
Total 275.1-279 1 The EIA indicates there is a lower capacity for California exports, while the National Mining Association reports a higher capacity (National Mining Association, n.d.).

Life Cycle Analysis of Coal Exports from the Powder River Basin
10
Table 2-2: Proposed Coal Export Terminal Projects and Their Current Project Status
Terminal Location New or Expansion? Capacity Increase (mmt/yr) Status Canadian West Coast
Fraser Surrey Docks Vancouver, B.C. New 4 Permit Granted U.S. West Coast
Gateway Pacific Terminal Cherry Point, WA New 48 Under Review1
Millennium Bulk Terminals Longview, WA New 44 Under Review2
Kinder Morgan Port Port Westward, OR Expansion 13.6 - 27.2 Rejected or abandoned Port of Morrow Boardman, OR New 3.5-8 Rejected or Abandoned Port of Coos Bay Coos Bay, OR New 6-10 Rejected or Abandoned
Grays Harbor Export Terminal Hoquiam, WA New 5 Rejected or Abandoned U.S. East Coast
Sparrows Point Baltimore, MD New 0.9 Unknown Pier IX Hampton Roads, VA Expansion 1.5 Unknown
U.S. Gulf Coast McDuffie Coal Terminals Alabama Expansion 5.4 Approved Blue Creek Coal Terminal Alabama New 2.7 Rejected or Abandoned
Burnside Terminals3 Ascension Parish, LA New 7.5 Completed 2014 Armstrong Coal Terminal/RAM Terminals Myrtle Grove, LA New 10 Permit Granted
Convent Marine Terminal Convent, LA Expansion 8.9 Unknown Other Lower Miss River Terminals Lower Miss. River, LA Expansion 3.4 Unknown
United Bulk Terminal LLC Davant, LA Expansion 9.1 Unknown International Marine Terminals Louisiana Expansion 4.5 Unknown
Pin Oak Lower Miss. River, LA New 6-8 Rejected or abandoned Castleton Lower Miss. River, LA New 5-7 Rejected or Abandoned
McDuffie Coal Terminals Alabama Expansion 5.4 Approved Blue Creek Coal Terminal Alabama New 2.7 Rejected or Abandoned
Deepwater Terminal Houston-Galveston, TX Expansion 3.7 Under construction Houston Bulk Terminal Houston-Galveston, TX Expansion 0.3 Under Construction
Jacintoport Bulk Terminal Houston, TX New 13.6 Unknown New Elk Terminal Corpus Christi, TX New 2.7 Rejected or Abandoned
La Quinta Trade Gateway Texas New Unknown Rejected or Abandoned 1 Environmental impact public comment was completed on January 22, 2013.Project under environmental review by county, state, and federal authorities (State of Washington Department of Ecology, 2014a). 2 Cowlitz County approved contract amendment #4 for work on draft Environmental Impact Statements in November 2014 (State of Washington Department of Ecology, 2014b). 3 Burnside Terminals reopened in July 2014 with a capacity of 7.5 mmt/yr and could expand an additional 7.5 mmt/yr.

Life Cycle Analysis of Coal Exports from the Powder River Basin
11
Figure 2-5 indicates that U.S. steam coal exports trended upward from 2010 to 2012, but declined in 2013 and 2014 (EIA, 2015e). The majority of exports from the U.S. have historically been shipped from the East and Gulf coasts (Baltimore, Norfolk, New Orleans, and Mobile). Steam coal to Asia has primarily been shipped from Vancouver, B.C. (via rail through the Seattle Customs District) and New Orleans (Profita, 2013). Historically, approximately 25 percent of steam exports go to Asia, 50 percent to Europe, and the remainder to the rest of the world. Since this study is based on PRB exports, the focus of the analysis is on the steam coal market.
In 2014, the U.S. exported approximately 31.1 mmt of steam coal (down from 47.2 mmt in 2013). Out of the 31.1 mmt, 15.3 mmt went to Europe, 7.2 mmt went to Asia, and 5.2 mmt went to other North American countries. In regards to the potential U.S. PRB coal export customers examined in this study: 1.4 mmt went to Japan, 4.3 mmt was shipped to South Korea, while Taiwan only imported 0.1 mmt (EIA, 2015e).
Figure 2-5: U.S. Steam Coal Exports by Customs District1
1 Coal processed through the Seattle customs district is currently exported from Vancouver, B.C.
19.8
23.2
34.2
50.7
47.2
31.1
0
10
20
30
40
50
60
2009 2010 2011 2012 2013 2014
Mill
ion
Met
ric T
onne
s/Ye
ar
Norfolk, VA New Orleans, LA Seattle, WA Baltimore, MD
San Francisco, CA Minneapolis, MN Los Angeles, CA Houston, TX
Detroit, MI Mobile, AL Other

Life Cycle Analysis of Coal Exports from the Powder River Basin
12
2.3 World Coal Market Globally, coal was the fastest-growing fossil fuel in 2013, although that growth was uneven. In China, coal demand increased 196 mmt while coal demand decreased 35 Mt in Europe (IEA, 2014). As part of this growth, prices are kept lower due to oversupply. Production is still expected to expand despite this, thanks to existing financial commitments. Additionally, attempts to cut costs resulted in increased efficiency and economies of scale, leading to higher production rates (IEA, 2014).
While most coal is still produced and consumed domestically, international trade grew 4.2 percent in 2013, which is less than the 6.7 percent increase in 2012. Indonesia is by far the largest steam coal exporter. In 2013, Indonesia exported approximately 423 million tonnes of steam coal, and Australia was the second leading steam coal exporter, with 182 million tonnes (World Coal Association, 2014). Most coal imports from Indonesia are to Asian countries, especially China, Korea, Japan, India, and Taiwan(IEA, 2014). The Asian countries that are assumed to be PRB coal customers in this study are Japan, South Korea, and Taiwan. From Figure 2-6 it is evident that these countries are heavily reliant on importing steam coal from Australia and Indonesia, which are assumed to be the competitors for PRB exports in the study (EIA, 2015e; IHS, 2014).
Figure 2-6: 2014 Steam Coal Imports to Japan, Korea, and Taiwan from Australia, Indonesia, and U.S.
3 LCA Model Overview LCA is a systematic approach that calculates the environmental burdens of a product or system. The development of an LCA requires a basis for comparison and boundaries, and a modeling framework. The structure of a life cycle model and the data used by the model are also important aspects of performing an LCA.
3.1 Basis of Comparison (Functional Unit) To establish a basis for comparison, the LCA method requires specification of a functional unit, the goal of which is to define an equivalent service provided by the systems of interest. Within the cradle-to-busbar boundary of this analysis, the functional unit is 1 MWh of coal-fired electricity at the power plant gate.
0
20
40
60
80
100
120
140
Japan South Korea Taiwan
Mill
ion
Met
ric T
onne
s/Ye
ar
Australia Indonesia U.S.

Life Cycle Analysis of Coal Exports from the Powder River Basin
13
3.2 Boundaries The system boundary for this study encompasses the cradle-to-busbar processes necessary to produce a functional unit of 1 MWh of coal-fired electricity at the power plant gate. Most of the processes used in this study only report air emissions. All of the processes included in this analysis are shown in Figure 3-1.
This study does not account for the differences in land use impacts between the exporting countries. It is likely that direct land disturbance in Indonesia has a greater GHG impact than in the U.S. and Australia due to Indonesia being part of a carbon rich biome, but quantifying such impacts is beyond the scope of this study. Other differences in environmental practices related to coal mining and transportation are also not included, except for emissions related to diesel fuel combustion. There is evidence that environmental enforcement in Indonesia is lax and illegal mining practices are relatively common, but verifying and quantifying these impacts within an LCA is beyond the scope of the study (Fogarty, 2014).
The construction of trains, trucks, barges, and ocean freighters for coal transport after mining is not included in this analysis. The construction and maintenance of transportation infrastructure, such as roads and river channels, is also not included, with the exception of marine bulk terminals. One reason transportation infrastructure is not modeled is because of lack of data for apportioning impacts to other commodities that use the same infrastructure as coal transport. Construction generally represents a very small portion of life cycle impacts due to the fact that the impact is spread across the lifetime of the constructed item.
Transmission and distribution (T&D) of the electricity generated in the importing countries is not included in this study, because the data were sparse for the losses associated with these steps in the foreign countries of interest. Adding T&D would yield additional uncertainty in the final results that would complicate the comparison. Differences in the T&D infrastructure and processes between countries are an important consideration, but are considered to fall outside the scope of this analysis.
3.3 Representativeness This inventory uses data gathered from a variety of sources, each of which represents a particular temporal period, geographic location, and state of technology. Since the results of this analysis are the combination of each of those inventory sources, this section discusses the temporal, technological, and geographic representativeness of the results of the analysis.
3.3.1 Temporal The temporal characteristics of this analysis include the vintage of data for the coal supply chain and power plants, as well as the lifetimes of coal mines, power plants, and associated infrastructure. Some data included in this analysis pre-dates the time period for these data, but were determined to be the latest or highest quality data available. The sources utilized to represent upstream coal mining are representative of recent operations in the U.S. and abroad (2000-2015). The detailed coal specifications are a mix of data from 2013 and 2015. The power plant data are based on a study conducted in 2011; however, the power plant performance is considered to be consistent with current state-of-the-art technology. Further advancement of technology during the study period is not considered.
The study period is 30 years, starting in 2020 when Western U.S. coal terminals are assumed to begin operating and ending in 2050 (Gateway Pacific Terminal, n.d.). This period is mainly used to adjust impacts related to changes in electricity grid mix and environmental regulations over time and does

Life Cycle Analysis of Coal Exports from the Powder River Basin
14
not represent the full time period of the life cycle. Some lifecycle activities fall outside of the study period. For example, the construction of existing mines and infrastructure occurred prior to 2020, but are still considered part of the life cycle.
It is expected that new infrastructure will be built in Australia and Indonesia during the study period. However, this does not necessarily translate into increased emissions, because the impacts are based on the production of one MWH of electricity and not based on the total coal production in each country or the change in coal production in each country. This also means that construction impacts are based on the expected lifetime of the infrastructure rather than the length of the study period. For example, even though the construction activities associated with a new mine or mine expansion occur over a short time period, those emissions are amortized over the life of the mine for the total amount of coal that is produced. Thus, each ton of coal mined, regardless of when, is attributed some fraction of the construction impacts.
New construction does not affect construction impacts in this LCA, but it does affect transportation distances. Changes in transportation distances due to the changing locations of mines is considered in this study.
Assumptions are made about coal resource availability based on current reserve estimates from the Energy Information Administration (EIA). It is also assumed that the capacity factors of power plants, which affect the total amount of electricity that they produce in their lifetimes, are assumed to be constant over the study period.
3.3.2 Technological All of the coal considered in this analysis is extracted via surface mining methods. The coal is assumed to be used only for power production. This analysis does not include metallurgical grade coals, nor coal used for purposes other than thermo-electric power generation. Only coal that is of export-grade quality is included in this analysis. The mixing of lower-grade coal with higher-grade coal is not considered in this analysis.
It is assumed that the coal considered in this analysis is utilized to generate the next marginal MWh of electricity (i.e., coal for new power plants), therefore, the cradle-to-busbar power plant results are based on the implementation of advanced technologies. This analysis includes an advanced power plant (USCPC) – with and without carbon dioxide (CO2) capture – that is representative of the latest technology but has not achieved broad commercialization. Carbon capture (CCS) technology has not been demonstrated at-scale to-date on coal-fired power plants and is, therefore, modeled as a pre-commercialization option for reducing GHG emissions at the power plant. It is assumed that the reference design for the power plant is consistent, regardless of destination country. Power plant operations are adjusted only based on the characteristics of the coal fed. This analysis is attributional in nature. No consequential effects, such as the displacement of other power generation technologies or shifts in coal markets, have been considered.

Life Cycle Analysis of Coal Exports from the Powder River Basin
15
Figure 3-1: Coal Export LCA Process Diagram1
1 Boxes and arrows with dotted lines represent potential or optional upstream or downstream flows in the model.
Energy Conversion Facility Raw Material Acquisition Raw Material Transport
Coal Mine Commissioning/ Decommissioning
Coal Mine, Equipment
Manufacturing
Surface Coal Mining (Overburden
Removal, Extraction, Reclamation)
Electricity
Light Fuel Oil
Ammonium Nitrate
Coal Cleaning
Local Rail
Local Truck and Barge
Diesel
Diesel/ Fuel Oil
Ocean Transport
Export Terminal
Diesel
Electricity
Diesel Electricity
Import Terminal
Foreign Rail
Ultra Supercritical Pulverized Coal
(Busbar)
Diesel
Diesel
CO2 Transport and Saline Aquifer Sequestration
Ash Disposal
Japan South Korea
Taiwan
Australia Indonesia
United States

Life Cycle Analysis of Coal Exports from the Powder River Basin
16
3.3.3 Geographic Determining the comparative difference in environmental impacts between alternative sources of coal from the U.S. (PRB), Australia (Hunter Valley), and Indonesia (Adaro and Mulia mines in South Kalimantan) exported to Asia is the main interest of this LCA. The two comparison exporting countries, Australia and Indonesia, were chosen based on their export capacity to Asia. Indonesia is the largest coal exporter with Australia coming in second (IEA, 2014). The importing countries chosen for this model include Japan, South Korea, and Taiwan. These countries were chosen because they import virtually all of the coal that they use and would be potential customers for PRB coal; the majority of the coal they import currently comes from Indonesia and Australia. NETL’s coal mining models (unit processes) for the U.S. were modified with country-specific data to represent foreign operations.
3.4 Impact Assessment
3.4.1 Greenhouse Gases (GHGs) GHGs in this analysis are reported on a common mass basis of carbon dioxide equivalents (CO2e) using the global warming potentials (GWPs) of each gas from the Intergovernmental Panel on Climate Change (IPCC) Fifth Assessment Report (AR5) (IPCC, 2013). The default GWP used is the 100-year time frame, but in some cases, results for the 20-year time frame are presented as well. All GHG results in this analysis are expressed as 100-year GWPs unless specified otherwise. Table 3-1 shows the GWPs used for the GHGs that are inventoried, including CO2, methane (CH4), nitrous oxide (N2O), and sulfur hexafluoride (SF6).
Table 3-1: IPCC Global Warming Potentials (IPCC, 2013)
GHG 20-year 100-year CO2 1 1 CH4 87 36 N2O 268 298 SF6 17,500 23,500
3.4.2 Tool for the Reduction and Assessment of Chemical and Other Environmental Impacts (TRACI) This analysis utilizes a modified version of the Tool for the Reduction and Assessment of Chemical and Other Environmental Impacts (TRACI) version 2.1 method for calculating impact assessment results. TRACI is an impact assessment method developed by the Environmental Protection Agency’s (EPA’s) National Risk Management Research Laboratory. The TRACI user’s manual explains how impacts are characterized (Bare, 2012).
The original version of TRACI was released by EPA in 2002. It was created following a literature survey of existing impact assessment methods, which determined that no tool existed that could provide a comprehensive method applicable to the U.S. TRACI 2.0 was released in 2011 and includes new characterization factors for human health cancer/non-cancer and ecotoxicity. These factors are from the USEtox model, which was created as a global consensus model (EPA, 2012b).
Further changes have been made in TRACI 2.1 for the impact categories of acidification, photochemical smog formation, and human health particulates. The changes to acidification are the adoption of a new reference flow of kilogram (kg) sulfur dioxide (SO2), rather than moles hydrogen ions (H+)). Smog formation and human health particulates have also undergone more significant

Life Cycle Analysis of Coal Exports from the Powder River Basin
17
updates, and make use of new underlying models (EPA, 2012b). This analysis utilizes the latest factors available in TRACI 2.1 with modified characterization factors for Human Health Particulates.
The following is a list of the impact categories included in this analysis:
• Acidification: The increased concentration of hydrogen ions in a local environment. This can be from the direct addition of acids, or by indirect chemical reactions from the addition of substances such as ammonia (EPA, 2012b).
• Eutrophication: The “enrichment of an aquatic ecosystem with nutrients (nitrogen, phosphorus) that accelerate biological productivity (growth of algae and weeds) and an undesirable accumulation of algal biomass” (EPA, 2008).
• Photochemical Smog Formation: Smog is ground-level ozone, which is formed by the reaction of nitrogen oxides (NOX) and volatile organic compounds (VOCs) in the presence of sunlight (EPA, 2012b).
• Human Health Particulates: Particulate matter (PM) includes “a mixture of solid particles and liquid droplets found in the air” that are equal to or smaller than 10 microns in diameter (PM10) (EPA, 2013). These small diameter particles can enter deep inside the lungs and cause a number of serious health problems. Almost all PM health impacts are caused by particles 2.5 microns in diameter or smaller (PM2.5) (Humbert, 2009).
Five TRACI impact categories are not included in the results of this analysis: global warming, ecotoxicity, human health toxicity (cancer), human health toxicity (non-cancer), and ozone depletion. Global warming is covered in the GHG analysis described in the previous section. These categories are not included due to data limitations that did not allow for the proper characterization and interpretation of the comparative impacts across the life cycle of the modeled scenarios.
Impacts of ocean transport are left out of the TRACI results due to uncertainty about the existence of localized impacts of air emissions in the middle of the ocean. This is an area for further research as it is not clear what the impacts are given that the ocean is a large sink and not usually close to any human population centers. Ocean transport impacts are not removed from GHG results, because GHG impacts are global in nature.
This analysis uses a modified version of the TRACI 2.1 Human Health Particulate characterization factors to account for the stack height of emissions at the power plant, which is the largest source of PM emissions in the life cycle. The default PM2.5 factor of 1 is calculated using impacts from ground-level, low-stack, and high-stack emissions. A high-stack characterization factor of 0.406 is used for power plant emissions (Humbert, 2009).
4 Modeling Data
4.1 Surface Coal Mining This LCA assumes that all exporting countries are using surface mining rather than underground mining to extract coal, because U.S. PRB coal is surface mined, and because surface mining is the dominant mining method for coal in Australia and Indonesia (Global Methane Initiative, 2010). NETL’s surface coal mining unit process is used in this analysis. Previous NETL extraction models using this unit process have been detailed at length in prior NETL LCA studies (NETL, 2010a, 2010b, 2013a, 2014a).
The mining unit process was updated for the purposes of this model. The first modification was to parametrize the unit process into the three main activities associated with surface coal mining: (1)

Life Cycle Analysis of Coal Exports from the Powder River Basin
18
overburden removal, (2) coal extraction, and (3) mine reclamation. The second modification was to standardize the unit process to represent a Western U.S. reference mine with a strip ratio of 5:1 to allow the overburden removal impacts to be scaled based on the strip ratios of other surface mines.
4.1.1 Reference Mine Operations of the coal mine are based on operations from a compilation of the three largest producers of PRB coal (Peabody Energy's North Antelope-Rochelle mine, Arch Coal, Inc.’s Black Thunder Mine, and Kennecott Energy’s Cordero Rojo Operation), of which Rosebud is a coal seam. The Rosebud coal mine is located in southern Montana, near the town of Colstrip. Sources reviewed in assessing coal mine operations include facility and equipment needs, production rates, electricity usage, particulate air emissions, methane (CH4) emissions, explosives usage, and additional governmental publications on coal and mines.
Coal is extracted from the surface coal seam through an open pit mining process. Drilled holes are blasted with ammonium nitrate fuel oil explosives to remove the overburden and expose the coal seam for extraction. The removal of the overburden occurs with the use of draglines, powered by electricity, which pile the overburden in a different location to enable extraction of the coal. The strip ratio of a mine is the amount of overburden needed to be removed for each unit of coal mined. The strip ratio for the reference coal mine in this analysis is 5:1, which is what the mining energy data are based on (DOE, 2002).1
After the dragline has removed as much of the overburden as possible, large electric shovels are used for the removal of the remaining overburden. The coal is removed using a truck and shovel approach. The trucks move the coal to the preparation facility for grinding and crushing to the proper size for transport. The coal is not cleaned prior to shipment.2 A conveyor belt carries the crushed coal from the preparation facility to the loading silo. The coal is then loaded into rail cars for rail transport.
The mine reclamation process starts before overburden removal with the storing of the topsoil that covers the overburden. Once the mining of the coal is complete, the mined land is contoured, the topsoil is replaced, and the land is revegetated (National Mining Association, 2015).
The energy to power mining equipment comes from electricity and diesel fuel. The energy requirement for each piece of mining equipment comes from a document produced by The U.S. Department of Energy and the National Mining Association (DOE, 2002). These values were vetted by operators and determined to be a reasonable representation of current operations. Dragline electricity requirements were sourced from the United States Geological Survey (USGS) (USGS, 2011). These energy requirements were split across the phases of the overall mining life cycle based on input from a subject matter expert (D. Maunder, 2015) These disaggregated energy requirements are shown by equipment type and phase of the overall mining life cycle in Table 4-1. The total diesel (British thermal units (Btu) of energy per short ton (ton) of coal) and electricity requirements (kilowatt-hours (kWh) or MWh of energy per ton or kg of coal) were validated against the estimates provided in an Environmental Impact Statement for a lease modification for the Spring Creek Coal Mine located in the Montana portion of the PRB (BLM, 2010).
1 Strip ratios can vary across and within mines.
2 Some coals require cleaning prior to shipment to meet customer or market specifications. PRB coal does not require coal cleaning prior to shipment.

Life Cycle Analysis of Coal Exports from the Powder River Basin
19
Table 4-1: Energy Use for Reference Mine (DOE, 2002; D. Maunder, 2015; USGS, 2011)
Energy Source Equipment Overburden Removal Coal Extraction Reclamation Total Units
Electricity
Dragline 7.04E+00 0.00E+00 0.00E+00 7.04E+00 kWh/ton Cable Shovel 2.34E+00 5.85E-01 0.00E+00 2.92E+00
Rotary Drill 3.82E-01 9.55E-02 0.00E+00 4.78E-01 Total 1.08E-05 7.50E-07 0.00E+00 1.15E-05 MWh/kg
Diesel
Dump Trucks1 2.08E+04 5.20E+03 0.00E+00 2.60E+04
Btu/ton
Bulldozer 9.44E+03 0.00E+00 2.36E+03 1.18E+04 Pick-up Trucks 1.24E+03 4.97E+02 1.24E+03 2.98E+03 Water Tankers 8.64E+02 2.16E+02 0.00E+00 1.08E+03
Pumps 2.77E+02 1.11E+02 2.77E+02 6.65E+02 Service Trucks 2.44E+02 9.77E+01 2.44E+02 5.86E+02
Bulk Trucks 4.69E+02 1.17E+02 0.00E+00 5.86E+02 Graders 4.16E+01 1.04E+01 0.00E+00 5.20E+01
Total 8.53E-04 1.60E-04 1.05E-04 1.12E-03 kg/kg 1Dump trucks are assumed to have engines greater than 750 horsepower (hp) (Miller, 2015). When EPA Tier IV standards are applied in this model, dump trucks will have different emission profiles than diesel equipment with engines that are less than or equal to 750 hp.
4.1.2 Model Parameters for Mining and Coal 4.1.2.1 Strip Ratio The strip ratio is used as a scalar in the model to adjust the impact of the mining equipment energy usage and explosives use when there is more or less overburden to remove than the reference mine. The strip ratio for mines operating in the PRB range from 2 to 4:1, while mines in Australia operate at a strip ratio between 8 and 10:1 and Indonesian mining between 3 and 8:1 (M. Mewing, 2015). In the case of this LCA, the strip ratio scalar scales up the emissions for Australia and Indonesia, because they are larger than the reference mine strip ratio of 5:1. Conversely, current operations in the PRB tend to have strip ratios that are slightly less than the reference mine.
4.1.2.2 Mining Equipment Energy Use U.S. and Australian mines rely on both diesel and electrically powered equipment including draglines/cable shovels to remove overburden and coal (DOE, 2002; Mitra & Saydam, 2012). Indonesian surface mining, on the other hand, is assumed to not be connected to the electricity grid and is reliant on diesel-powered truck and shovel equipment to remove the coal and overburden (IEA, 2014; M. Mewing, 2015). While the data are sparse, it is also known that because of the lack of electrically powered large-scale equipment, operations at Indonesian coal mines tend to be less efficient than U.S. or Australian operations. For the purposes of this analysis, a scalar is applied to adjust the diesel use for the Indonesian scenarios. In the base case, it is assumed that Indonesian mines require three times as much diesel fuel as the reference PRB mine. The sensitivity of this assumption is tested parametrically and is discussed later in the report.
In the United States, air emissions from non-road diesel engines are regulated in two ways: emission standards for new diesel engines and maximum sulfur content in diesel fuel (EPA, 2005, 2015a). Diesel equipment used in surface mining are currently regulated under EPA Tier IV regulations for maximum carbon monoxide (CO), non-methane hydrocarbons (NMHC), NOx and PM emissions. There are different standards based on engine size (EPA, 2005). For the purpose of this model, dump
Life Cycle Analysis of Coal Exports from the Powder River Basin
20
trucks engines are assumed to be regulated under the standard for engines greater than 750 horsepower (hp) or 560 kilowatts (kW). The remaining diesel engines used in surface mining are assumed to be regulated under the standard for engines less than 750 hp, but greater than to equal to 175 hp (130 kW and 560 kW, respectively) (Miller, 2015). Additionally, EPA diesel fuel standards require the use of ultra-low sulfur diesel (ULSD). The use of ULSD reduces SO2 emissions when compared to traditional diesel fuel (EPA, 2015a).
Because the diesel engine standard only applies to new engines and existing engines tend to be rebuilt several times before being replaced, the model assumes a phase-in period for compliance. Fifty-percent compliance is assumed from 2022 to 2027 and full compliance is assumed from 2027 to 2050 (Miller, 2015). Non-compliance emissions are based on emission factors for industrial reciprocating diesel engines without NOx control published in EPA’s AP-42, Compilation of Air Pollutant Emission Factors.
Australia has regulations for diesel fuel, but does not have regulations for non-road engines. Indonesia does not have any regulations on any diesel engines or diesel fuel (Australian Government Department of the Environment, 2015a; NSW EPA, 2015). Australia is expected to pass an engine standard for non-road diesel engines in 2016 (Australian Government Department of the Environment, 2015b). For the purpose of this study, it is assumed that Australia will pass a law in 2016 that is the same as the U.S. law and will have the same implementation schedule as the United States. Combining the time it takes to phase-in the law and for the fleet to replace old engines, the fifty-percent compliance will start in 2034 and full compliance will begin in 2039 (DieselNet, 2013; Miller, 2015). It is assumed that Indonesia will pass diesel engine and fuel laws closer to the end of the study period. The impact of including Tier IV and ULSD regulations for Indonesia is minimal, therefore, this study assumes that current lack of standards in Indonesia apply throughout the study period.
Table 4-6 summarizes the parameters for diesel engines and fuel used in this study. Diesel fuel specifications are based on sulfur content regulations in the individual exporting countries (Australian Government Department of the Environment, 2015a; EPA, 2015a; UNEP, 2015).
The electricity grid mix used for the U.S. PRB region is based on the generation mix of the dominant energy supplier in the region, Powder River Energy Corporation (EIA, 2015d; D. Maunder & Sersland, 2015). The electricity grid mix used for Australia in the model is the national grid mix (Australian Bureau of Resources and Energy Economics, 2014). Table 4-2 shows the electric grid mixes for the U.S. PRB region and Australia that are used in this model to calculate emissions from electrically powered mining equipment. This analysis utilized existing models for the diesel and electricity life cycles (NETL, 2008, 2015).

Life Cycle Analysis of Coal Exports from the Powder River Basin
21
Table 4-2: Grid Mix for Electrically-Powered Equipment1
Power Source PRB Region -- Powder River Energy Corp. Mix Australian National Mix
2020 Coal 42.4% 63.8%
Natural Gas 22.0% 18.4% Petroleum 0.4% 1.1%
Nuclear 20.4% 0.0% Hydroelectric 7.4% 7.0% Renewables 7.8% 8.6%
2040 Coal 36.8% 64.5%
Natural Gas 26.5% 14.5% Petroleum 0.3% 0.9%
Nuclear 18.4% 0.0% Hydroelectric 6.5% 5.4% Renewables 10.0% 13.0%
1 It is assumed that Indonesian coal mines are not connected to the electricity grid (M. Mewing, 2015).
4.1.2.3 Coal Quality Subject matter experts provided data on export-grade coals from Australia, Indonesia, and the PRB. It is generally accepted that PRB coal must have a lower heating value (LHV) greater than 8,800 Btu per pound (lb) of coal (Btu/lb) in order to be considered as an export candidate (M. Mewing, 2015)1. Table 4-3 lists the coal quality data for coals in the export regions. Coal specifications for PRB mines were obtained from the two rail companies serving that region (BNSF Railway, 2013b; Union Pacific, 2015).
Unlike PRB coal, Australian coal must be cleaned prior to export. The specifications provided for the Hunter Valley coal in Table 4-3 are post-cleaning. As part of the cleaning process, a fraction of the input material is rejected as waste. Based on subject matter expert input, the fraction of waste in the Australian operations ranges between 20 and 30 percent (M. Mewing, 2015). To yield one unit of exportable coal, the mine must produce 1.2 to 1.3 units of material at the mine mouth. The life cycle model accounts for the coal cleaning operations as well as the storage and disposal of mine tailings.
As shown in Table 4-3, there is a wide range in the quality of the export-grade coal considered in this analysis. Lower heating values range from 7,105 Btu/lb2 for the Mulia coal from Indonesia to almost 11,000 Btu/lb for the Hunter Valley coal from Australia. The lower heating values for PRB coal range from 8,800 to 9,350 Btu/lb. In terms of moisture content, Mulia coal from Indonesia tends to be on the wetter end of the spectrum of coals considered coming in at 35.0 percent. Conversely,
1 This analysis is generally based on HHV, but coal quality data in the context of LHV were provided by the subject matter experts.
2 LHV is also reported in megajoules (MJ) per kg of coal in Table 4-3.

Life Cycle Analysis of Coal Exports from the Powder River Basin
22
the Hunter Valley coal from Australia is the driest at 9.0 percent moisture. All of the coals considered have relatively low sulfur content ranging from 0.2 to 0.7 percent.
The data sources utilized to specify the coals did not provide the full ultimate analysis for each of the coals. Additional information was required to run the coals in the NETL Power Plant Flexible Model (PPFM). The hydrogen content was calculated using a correlation based on the fixed ash, fixed carbon, moisture and volatiles (Research Gate, n.d.). The nitrogen and chlorine fractions were estimated utilizing the ultimate analyses provided in the NETL Quality Guidelines for Energy Systems Studies (QGESS) (NETL, 2012). Finally, the missing oxygen fraction was calculated as the balance component.

Life Cycle Analysis of Coal Exports from the Powder River Basin
23
Table 4-3: Coal Quality Data for Export-Grade Coals
Coal Property
U.S. PRB Australia Indonesia
Decker Spring Creek
Black Thunder South
Black Thunder Antelope
North Antelope/ Rochelle Complex
Hunter Valley Ensham Adaro Mulia
Moisture 24.5% 26.8% 26.0% 27.0% 26.5% 27.6% 9.0% 11.5% 25.0% 35.0% Carbon 52.7% 55.1% 52.4% 52.3% 52.1% 52.1% 63.9% 63.1% 52.2% 42.7%
Hydrogen1 4.2% 4.0% 4.0% 3.9% 4.0% 4.0% 4.3% 4.0% 4.8% 4.0% Nitrogen2 0.7% 0.7% 0.7% 0.7% 0.7% 0.7% 1.3% 1.3% 0.7% 0.7% Chlorine2 0.0% 0.0% 0.0% 0.0% 0.0% 0.0% 0.3% 0.3% 0.0% 0.0%
Sulfur 0.5% 0.3% 0.2% 0.3% 0.2% 0.2% 0.6% 0.7% 0.2% 0.2% Ash 5.1% 4.3% 4.6% 5.2% 5.3% 4.5% 13.5% 12.0% 2.0% 3.9%
Oxygen3 12.3% 8.8% 12.1% 10.6% 11.2% 10.9% 7.2% 7.2% 15.2% 13.5%
HHV (MJ4/kg) 21.8 22.8 21.7 21.6 21.6 21.6 26.5 26.2 21.6 17.6
HHV (Btu/lb)5 9,373 9,820 9,320 9,300 9,270 9,270 11,406 11,271 9,283 7,575
LHV (MJ/kg) 20.7 21.7 20.6 20.5 20.5 20.5 25.4 25.1 20.5 16.5 LHV (Btu/lb) 8,903 9,350 8,850 8,830 8,800 8,800 10,936 10,801 8,813 7,105
Data Source (Michael Mewing,
2015) (BNSF Railway, 2013b; Union Pacific, 2015) (Michael Mewing, 2015)
1 Calculated based on a correlation that utilizes fixed ash, fixed carbon, moisture, and volatiles (Research Gate, n.d.). 2 Based on the NETL QGESS for either Illinois No. 6 or PRB coal depending on the proximity to the reference heating value (NETL, 2012). 3 Calculated as the balance component (e.g. the additional fraction required to sum to 100 percent). 4 Megajoule (MJ)
5 Calculated from LHV with a correlation from the World Coal Association (World Coal Association, 2007) .

Life Cycle Analysis of Coal Exports from the Powder River Basin
24
4.1.2.4 Coal Mine Methane Previous NETL life cycle studies of power systems highlight that coal mine methane emissions are the key GHG contributor in coal mining and is modeled as a single parameter in the coal extraction unit process (NETL, 2013b, 2014b). For underground coals, the majority of emissions are from the ventilation and are required to keep methane concentration low for mine safety. Surface mine methane emissions occur when the overburden is removed and the seam is broken up by mining. These surface emissions are generally harder to quantify because there is not a measureable point emissions source; in general these emissions are estimates based on in-situ coal content and an assumed fraction being emitted. Therefore, data are generally sparse for these emission factors, especially for foreign countries. Since methane concentrations are low, it is assumed that all methane is vented directly to the atmosphere and no flaring occurs.
According to the EPA GHG Inventory, the estimated coal mine methane emission factor for U.S. surface mines was 38.7 standard cubic feet of methane per ton of coal (scf CH4/ton) mined (EPA, 2015b). NETL has previously assumed that approximately 80 percent of the coalbed methane (CBM) is practically extractable using standard CBM recovery techniques and that all of the remaining 20 percent is released during the mining process. Based on this assumption, the coal mine methane emission factor would be reduced to 8 scf CH4/ton of coal mined. In the Environmental Impact Statement for a lease modification to the existing Spring Creek Coal Mine, the BLM estimates an emission factor of 0.8 scf CH4/ton of coal mined (BLM, 2010).
The coal mine methane emission factor for surface mined Australian coal is estimated to be 42.9 scf CH4/ton of coal mined (Australian Government Department of the Environment, 2014).The government assessed an uncertainty of 20 percent associated with this emission factor.
According to the EPA, coal mining in Indonesia in 2010 resulted in 4 million tonnes CO2e entirely from mine methane emissions (EPA, 2012a). For that same year, Indonesia produced approximately 360 million short tons of coal. According to the Global Methane Initiative, almost all of the coal mined in Indonesia is extracted via surface mining methods (Global Methane Initiative, 2010). These values yield a coal mine methane emission factor of 27.9 scf CH4/ton of coal mined.1
Table 4-4 summarizes the coal mine methane emission factors for the three coal sources included in this analysis.
Table 4-4: Coal Mine Methane Emission Factors
Coal Source Methane Emissions (scf/ton)
Powder River Basin 0.8 8
38.7 Australia – Surface 42.9 +/-20%
Indonesia 27.9
4.2 Coal Transportation and Handling The transportation steps in this model include transport of coal from the mine to a marine bulk terminal in the exporting country and ocean transport of coal from the marine bulk terminal in the
1 No uncertainty range was provided for Indonesian coal mine methane emissions.

Life Cycle Analysis of Coal Exports from the Powder River Basin
25
exporting country to a marine bulk terminal in the importing country. Transportation of coal from the marine bulk terminal to the power plants is not included in this model as it is assumed that the power plants are close to the marine bulk terminal.
4.2.1 Transport from Mine to Marine Bulk Terminal Train transport is modeled for the transport of PRB coal from mining sites to a marine bulk terminal on the coast of the Pacific Northwest. The distance from the PRB to the Pacific Northwest for export is based on the average of rail distances from the northern (Decker, MT) and southern (Gillette, WY) PRB to the Millennium Bulk Terminals in Longview, WA and the proposed Pacific Gateway Terminal in Cherry Point, WA. The average distance is estimated to be approximately 2,000 kilometers (km) with a low of 1,900 km and a high of 2,100 km (BNSF Railway, 2013a). The transport distance for Australian coal to the export terminal in Newcastle is much shorter at just 100 to 200 km (M. Mewing, 2015). Based on the location of coal reserves in Australia, it is anticipated that new mines during the study period will be located further inland (Australian Government Department of Industry, 2014). An assumed rail distance range is, therefore, 150 to 300 km for this study. The domestic transport modes and distances are summarized in Table 4-5. It is assumed that all of the infrastructure (e.g., railway, roads, etc.) connecting the coal mine and the energy conversion facility is existing.
In the United States, air emissions from non-road diesel engines are regulated in two ways: emission standards for new diesel engines and maximum sulfur content in diesel fuel (EPA, 2005, 2015a). Line-haul locomotive diesel engines are currently regulated under EPA Tier IV regulations for maximum CO, NMHC, NOx and PM emissions (DieselNet, 2008). The standard for locomotive engines is different than the standard for engines in surface mining equipment. Additionally, EPA diesel fuel standards require the use of ULSD. The use of ULSD reduces SO2 emissions when compared to traditional diesel fuel (EPA, 2015a).
Because the diesel engine standard only applies to new engines and existing engines tend to be rebuilt several times before being replaced, the model assumes a phase-in period for compliance. Fifty-percent compliance is assumed from 2020 to 2025 and full compliance is assumed from 2025 to 2050 (Miller, 2015). Non-compliance emissions are based on emission factors for industrial reciprocating diesel engines without NOx control published in EPA’s AP-42, Compilation of Air Pollutant Emission Factors.
Australia has regulations for diesel fuel, but does not have regulations for non-road engines. Australia is expected to pass an engine standard for non-road diesel engines in 2016 (Australian Government Department of the Environment, 2015b). For the purpose of this study, it is assumed that Australia will pass a law in 2016 that is the same as the U.S. law and will have the same implementation schedule as the United States. Combining the time it takes to phase-in the law and for the fleet to replace old engines, the fifty-percent compliance will start in 2028 and full compliance will begin in 2033 (DieselNet, 2008; Miller, 2015). Table 4-6 lists the phase-in schedule and diesel specifications for line-haul locomotives.
In Indonesia, it is assumed that truck and river barge transport is used to transport coal to the export terminal (Lucarelli, 2010). Truck emissions are modeled based on a unit process developed by the National Renewable Energy Laboratory for diesel-powered passenger trucks. River barge emissions are based on a model developed by Argonne National Laboratory for marine category 2 engines. It is assumed that Indonesia will pass and enforce diesel engine and fuel laws closer to the end of the study period. The impact of including Tier IV and ULSD regulations for Indonesia is minimal,

Life Cycle Analysis of Coal Exports from the Powder River Basin
26
therefore, this study assumes that lack of standards in Indonesia apply throughout the study period. Table 4-6 summarizes the parameters for diesel engines and fuel used in this study.
Table 4-5: Domestic Transport Modes and Distances
Parameter Low, Expected, and High Values PRB Australia Indonesia
Rail Distance (km)
Low 1,900 150 N/A Expected 2,000 225
High 2,100 300
Truck Distance (km)
Low N/A N/A
44 Expected 79
High 114
River Barge Distance (km)
Low N/A N/A
100 Expected 250
High 450
Table 4-6: Diesel Engine and Fuel Parameters
United States Australia Indonesia U.S. EPA Title IV Phase-In Years For Mining Equipment
50% Engine Conversion 2022-2027 2034-2039 N/A 100% Engine Conversion 2027-2050 2039-2050 N/A
U.S. EPA Title IV Phase-In Years For Line-Haul Locomotives 50% Engine Conversion 2020-2025 2028-2033 N/A
100% Engine Conversion 2025-2050 2033-2050 N/A Diesel Fuel Specifications For All Engines
Sulfur Concentration (ppm)1 15 10 3,500
1Sulfur content in diesel fuel impacts SOx emissions. It is assumed that SOx emissions from diesel fuel are in the form of SO2, because the equation used only accounts for SO2.
4.2.2 Coal Handling at Export Terminal Coal handling at the export terminal includes the impact of construction and operation of a marine bulk terminal, with a terminal in the Pacific Northwest as a reference terminal. The emission factors used to model this process come from Gateway Pacific Terminal Air Quality Technical Report Revised Site Layout (ENVIRON International Corporation, 2014). It includes emission factors for CO2e, PM2.5, PM10, SO2, CO, and nitrogen dioxide (NO2). Coal handling impacts are assumed to be the same for all of the export countries and import countries.
4.2.3 Transport from Export Terminal to Import Terminal Ocean vessel engine emissions are based on a model developed by Argonne National Lab for marine category 3 engines. Table 4-7 shows the ocean transport distances between coal sources and destination ports. The assumed source and destination ports were chosen based on current operations in the exporting and importing countries. As previously discussed, there are several export terminal projects under consideration in the U.S. For the purposes of this analysis the focus is on exports from the Pacific Northwest, so the Millennium Bulk Terminals facility, located in Longview, WA, was chosen as the port of departure from the U.S. The results for the PRB scenarios would not be

Life Cycle Analysis of Coal Exports from the Powder River Basin
27
significantly different if the proposed Gateway Pacific Terminal in Cherry Point, WA, was modeled instead. The shipping distances were determined by utilizing the Sea Rates port distance calculator (SeaRates LP, 2015). The high and low ocean transport distances are modeled as +/- 10 percent of the expected value. Impacts of ocean transport are left out of the TRACI results due to uncertainty about the existence of localized impacts of air emissions in the middle of the ocean. This is an area for further research as it is not clear what the impacts are given that the ocean is a large sink and not usually close to any human population centers. Ocean transport impacts are not removed from GHG results, because GHG impacts are global in nature.
Table 4-7: Ocean Transport Distance (km)
Destination PRB – Longview, WA Australia - Newcastle Indonesia – Tanjung Bara
Japan – Yokohama 7,892 8,075 4,683 Korea – Pohang 8,451 8,558 4,380
Taiwan – Keelung 9,904 7,888 2,997
4.3 Power Plant Operations This LCA assumes that the power plant in each importing country is a best available technology power plant with advanced emission controls. This assumption is made because the increase in coal imports by the destination countries is assumed to satisfy the marginal demand for electricity. For the purposes of this analysis, a USCPC plant was selected. The USCPC plant design fired with sub-bituminous coal (PRB Rosebud) was previously modeled by NETL (NETL, 2011). The version of the configuration without carbon capture operates at an efficiency of 39.8 percent (higher heating value (HHV)) yielding a net power output of 550 megawatts (MW). When operated with an amine-based post-combustion capture system, this configuration operates at an efficiency of 28.0 percent (HHV) yielding a net power output of 537 MW. The USCPC plant is fitted with a fabric filter for PM control, activated carbon injection for mercury control, selective catalytic reduction (SCR) for NOX control, and a dry flue-gas desulfurization (FGD) unit for sulfur oxide (SOX) removal. The plant utilizes a hybrid condenser configuration, with 50 percent of the plant cooling supplied by an air-cooled condenser.
To evaluate the impacts of the different coal sources detailed in Table 4-3, this analysis utilizes the NETL PPFM (NETL, 2013b). NETL PPFM simulates combustion-based power plant electrical output, emissions, material usage, and costs for a fully-configurable mix of boiler and steam plant types, feedstocks, and emissions control equipment. The model can be configured to run a custom coal, provided with the corresponding coal composition from an ultimate analysis (specifically carbon, oxygen, water, sulfur, nitrogen, chlorine, ash as mass percentages, and mercury as a trace element in parts per million). Since the coals examined in this analysis are of disparate sulfur content, the plant was tuned to achieve the equivalent emission limits for SO2, NOx, and PM by adjusting the energy requirements to operate the air pollution control equipment necessary for each country’s coal specifications.
Fly ash from the power plant is transported to a landfill for disposal. The air emissions associated with diesel combustion to transport the fly ash to the landfill and for the operations of equipment at the landfill are included in the boundary of the analysis. Additionally, the leachate emissions to water are also considered.
For the plant configuration with post-combustion carbon capture, all of the energy and emissions associated with the amine capture equipment and compression are accounted for inside the boundary of the plant.
Life Cycle Analysis of Coal Exports from the Powder River Basin
28
Table 4-8 provides the plant inputs, outputs and specifications for each of the coal types considered in this analysis. As expected, the drier coal (higher HHV) in Hunter Valley, Australia, results in higher net plant efficiencies (and lower CO2 emissions) than coals with a higher moisture content (lower HHV).

Life Cycle Analysis of Coal Exports from the Powder River Basin
29
Table 4-8: NETL PPFM Model Output by Coal Source
Parameter
U.S. PRB Australia Indonesia
Decker Spring Creek
Black Thunder South
Black Thunder Antelope
North Antelope/ Rochelle Complex
Hunter Valley Ensham1 Adaro Mulia
Inputs (kg/MWh busbar)
Coal 414 393 416 417 418 419 329 333 421 532
Ground Water In 532 531 531 531 531 531 527 526 532 538
Municipal Water In 532 531 531 531 531 531 527 526 532 538
Limestone 4.11 2.44 1.72 2.97 1.99 1.82 3.81 4.82 1.3 1.65
Ammonia 0.97 0.96 0.97 0.97 0.97 0.97 0.93 0.93 0.98 1.01
Activated Carbon 0.06 0.06 0.06 0.06 0.06 0.06 0.06 0.06 0.06 0.07
Natural Gas 0.14 0.14 0.14 0.14 0.14 0.14 0.13 0.13 0.14 0.14
Outputs (kg/MWh busbar)
CO2 800 796 799 800 800 801 772 772 806 835
NOx 0.27 0.27 0.27 0.27 0.27 0.27 0.27 0.27 0.27 0.27
SO2 0.46 0.46 0.46 0.46 0.46 0.46 0.46 0.46 0.46 0.46
PM 0.03 0.02 0.02 0.03 0.02 0.02 0.05 0.05 0.01 0.02
Mercury 0 0 0 0 0 0 0 0 0 0
Wastewater 223 222 222 223 222 222 222 222 223 224
Ash 29 22 22 27 26 22 52 49 11 24
Plant Specifications
Gross power (MW) 578 580 578 578 578 577 596 597 573 557
Net power (MW) 550 553 551 550 551 550 569 569 547 529
Net plant efficiency 39.9% 40.1% 40.0% 39.9% 39.9% 39.9% 41.2% 41.3% 39.6% 38.4% 1 Hunter Valley and Ensham coal have nearly identical specifications; thus only Hunter Valley is modeled for this analysis.

Life Cycle Analysis of Coal Exports from the Powder River Basin
30
4.4 CO2 Transport and Saline Aquifer Sequestration For the power plant configurations equipped with post-combustion CO2 capture, the model is adapted to include the transport via CO2 pipeline 100 miles to a saline aquifer for final disposal and sequestration. Saline aquifers are geological formations that are saturated with brine water. In the U.S., saline aquifers have a broader geographical distribution than oil and gas reservoirs and have a large capacity potential for long-term CO2 storage. The CO2 storage capacity of saline aquifers in the U.S. has been estimated from 2.1 to 20 trillion metric tonnes of CO2 (NETL, 2012).
The life cycle models utilized for the construction and operation of the CO2 pipeline and saline aquifer are consistent with the details provided in previous NETL analyses (NETL, 2013a, 2014a). The construction of the pipeline, pipeline maintenance via pigging, and operation, including boost compression and pipeline leakage have been modeled. The life cycle model for the saline aquifer accounts for the following activities: site preparation, well construction, CO2 sequestration operations, site monitoring, brine management, well closure, and land use.
4.5 Model Parameter Matrix Table 4-9 provides a compilation of the key parameters1 utilized in the life cycle model, along with corresponding uncertainty. Note, the low and high values are based on the corresponding low and high life cycle GHG emissions, not necessarily the low and high absolute values of the parameters.
1 Other parameters within the life cycle model were unchanged (the same) for all modeled scenarios.

Life Cycle Analysis of Coal Exports from the Powder River Basin
31
Table 4-9: Coal Exports Scenario Parameter Matrix
Parameter 1 Parameter 2 Export Location
PRB Australia Indonesia
Coal Mine Methane (scf/ton)
Low Value 0.8 34.3 27.9 Expected Value 8.0 42.9
High Value 38.7 54.4
Diesel Scalar Low Value
1 1 2
Expected Value 3 High Value 4
Mine Electricity Switch N/A 1 1 0
Strip Ratio Low Value 2 8 3
Expected Value 3 9 5.5 High Value 4 10 8
Coal Cleaning Switch N/A 0 1 0 Sulfur Concentration of Diesel Fuel (ppm) N/A 15 10 3500
Rail Distance (km)
Low Value 1,900 150 N/A Expected Value 2,000 225
High Value 2,100 300
Truck Distance (km)
Low Value N/A N/A
44 Expected Value 79
High Value 114
River Barge Distance (km)
Low Value N/A N/A
100 Expected Value 250
High Value 450 Ocean Distance
(km) L/H are +/-10%
To Japan 7,892 8,075 4,683 To Korea 8,451 8,558 4,380
To Taiwan 9,904 7,888 2,997
Coal Type Low Value Spring Creek
Hunter Valley1 Adaro,
Mulia Modeled Separately
Expected Value Decker High Value North Antelope
1 Hunter Valley and Ensham coal have nearly identical specifications; thus only Hunter Valley is modeled for this analysis.
5 Results/Discussion
5.1 Life Cycle GHG Results Figure 5-1 depicts the cradle-to-busbar life cycle GHG results for all four coal sources (U.S. PRB, Australian Hunter Valley, Indonesian Adaro, and Indonesia Mulia) and three prospective destinations (Japan, Korea, and Taiwan). The uncertainty bars included in the figure are informed by the parameter ranges detailed in Table 4-3 and Table 4-9. Depending on the scenario, 92.5 to 96.1 percent of the cradle-to-busbar emissions are from the combustion of coal at the destination power plant. Coal mining activities account for 0.8 to 3.3 percent, while transport accounts for 2.0 to 6.7 percent. Power plant combustion emissions are detailed in Table 4-8 and range from 772 kg CO2e/MWh (Australia) to 835 kg CO2e/MWh (Indonesia – Mulia). The emissions from the combustion of PRB are approximately 800 kg CO2e/MWh. Differences in the emission factors are driven by the differences in coal quality, which ultimately impacts the efficiency of the power plant.

Life Cycle Analysis of Coal Exports from the Powder River Basin
32
There are three key takeaways from Figure 5-1. First, the destination for the coal does not contribute much variability to the life cycle results. For example, the results for Australian coal range from 834 to 836 kg CO2e/MWh depending on the destination. The second key conclusion is that the rank order of expected values for the coal sources do not change given the destination. Finally, and most importantly, given the uncertainty in the model parameter values, there is not a definitive difference between the life cycle GHG profiles between sourcing coal from the U.S. (PRB), Australia, or Indonesia for Japan, South Korea, or Taiwan. This is clearly illustrated in Figure 5-2. The width of the bars in Figure 5-2 represents the uncertainty ranges for all of the scenarios depicted in Figure 5-1. The life cycle GHG emissions for coal sourced from Australia tends to be slightly lower than PRB coal, while the life cycle emissions from the Mulia mine in Indonesia is slightly higher than PRB coal. However, no definitive conclusion can be made for Indonesian coal from Adaro, because the uncertainty is close to spanning two of the other coals.
Figure 5-1: LCA Results – Cradle-to-Busbar Coal Exports
The results from Figure 5-1 are shown in Figure 5-3 with the contributions from the power plant removed. Note, the basis for the results in Figure 5-3 is still 1 MWh of electricity. The purpose for excluding the power plant emissions is to allow for closer inspection of the differences between the activities upstream of the coal power plant. As with Figure 5-1, the uncertainty bars included in the figure are informed by the parameter ranges detailed in Table 4-3 and Table 4-9.
Emissions associated with coal mining activities are much more significant in Australia and Indonesia compared to the PRB. Both countries have considerably higher strip ratios compared to the
864 834 854 895 867 836 853 894 873 834 847 886
219 212 198 222
0100200300400500600700800900
1,000
PRB
AU
ID -
Adar
o
ID -
Mul
ia
PRB
AU
ID -
Adar
o
ID -
Mul
ia
PRB
AU
ID -
Adar
o
ID -
Mul
ia
PRB
Aust
ralia
Indo
nesia
- Ad
aro
Indo
nesia
- M
ulia
Japan Korea Taiwan Japan - Carbon Capture
Gre
enho
use
Gas
Em
issi
ons
AR5
100-
yr G
WP
(kg
CO₂e
/MW
h)
Mining Coal Cleaning Truck Transport
Rail Transport Barge Transport Export Terminal
Ocean Transport Import Terminal Power Plant
Saline Aquifer Sequestration

Life Cycle Analysis of Coal Exports from the Powder River Basin
33
PRB, meaning that more overburden must be removed for each unit of coal produced. Additionally, the coal mine methane emissions from Australia and Indonesia are 3.5 to 5 times higher than those modeled as the expected value for the PRB. Finally, Australian coal is processed at a coal cleaning facility prior to export. The direct impacts of the coal cleaning facility are small; however, the indirect effects of scaling up mining activities to yield one unit of exportable coal increase the emissions associated with mining.
Figure 5-2: Coal Export Scenario Uncertainty Range
Transportation activities can be split into two categories: domestic and international. Domestic transportation is required to get the coal from the mine to export terminal. International travel via ocean freighter carries the coal from the export terminal to the import terminal located in the destination country. As previously noted, it is assumed that there is no local travel in the destination country as there are power plants located adjacent to the import terminals. The domestic transportation component is much more significant for coal from the PRB compared to coals sourced from Australia or Indonesia. This is due entirely to the proximity of the coal mine to the export terminal. Coal sourced from the PRB is transported an expected distance of 2,000 km by rail, while coal sourced in Australia and Indonesia travels only 225 and 329 km, respectively.
As shown by Table 4-9, the ocean transport distances for coal sourced from the PRB and Australia are very similar for the three destination countries (within 5-15 percent). Ocean transport distances from Indonesia are 50 to 70 percent less than for Australia and the PRB. The ocean transport emissions in Figure 5-3 scale according to these assumptions. However, the ocean transport emissions not only scale with distance, but also with the amount of coal that is shipped. As noted in
800 825 850 875 900 925
ID (M)
ID (A)
AU
PRB
ID (M)
ID (A)
AU
PRB
ID (M)
ID (A)
AU
PRB
Taiw
anKo
rea
Japa
n
Greenhouse Gas Emissions AR5 100-yr GWP(kg CO₂e/MWh)

Life Cycle Analysis of Coal Exports from the Powder River Basin
34
Table 4-8, the amount of coal required for 1 MWh of electricity generation is significantly different across the various export grade coals considered. For example, 329 kg of coal sourced from the Hunter Valley of Australia is required to generate 1 MWh, while the same MWh requires 414 kg of coal sourced from the Decker Mine in the PRB. This explains why the ocean transport emissions shown in Figure 5-3 are larger for coal sourced from the PRB compared to Australia even though the transport distances are essentially equal.
Figure 5-3: LCA Results – Cradle-to-Busbar Coal Exports – Upstream Results Only
Detailed life cycle GHG results for coal shipped to Japan are provided in Figure 5-4 through Figure 5-11. Results for all scenarios are presented in tabular form in Appendix B. Graphical results for Korea and Taiwan are not included in the main body of this report, because there is a lack of significant difference between the results of the three destination countries, as can be seen in Figure 5-1. Figure 5-4 through Figure 5-11 include detailed process contributions to the total life cycle GHG emissions by individual GHG. Similar to the presentation of results in Figure 5-1 and Figure 5-3, the drilldown life cycle GHG results are presented for the full cradle-to-busbar system as well as just the upstream fraction (power plant combustion removed) of the system.
For the PRB to Japan scenario, 99.3 percent of the total life cycle GWP is from CO2, with CH4 contributing 0.6 percent and N2O at 0.1 percent. The majority of methane comes from mine emissions, while almost all of the N2O is associated with the manufacturing of explosives used for overburden removal. For the Australia to Japan scenario, 97.8 percent of the total life cycle GWP is from CO2,
57.0 55.6
41.6
52.659.3 57.4
40.4
51.2
65.3
55.2
34.643.8
79.5 76.1
58.1
74.8
0
20
40
60
80
100
120
140
PRB
AU
ID -
Adar
o
ID -
Mul
ia
PRB
AU
ID -
Adar
o
ID -
Mul
ia
PRB
AU
ID -
Adar
o
ID -
Mul
ia
PRB
Aust
ralia
Indo
nesia
- Ad
aro
Indo
nesia
- M
ulia
Japan Korea Taiwan Japan - Carbon Capture
Gre
enho
use
Gas
Em
issi
ons
AR5
100-
yr G
WP
(kg
CO₂e
/MW
h) -
Ups
trea
m O
nly
Mining Coal Cleaning Truck Transport Rail Transport
Barge Transport Export Terminal Ocean Transport Import Terminal

Life Cycle Analysis of Coal Exports from the Powder River Basin
35
with CH4 contributing 1.9 percent and N2O at 0.3 percent. The higher contributions from methane are due to higher mine methane emission factors assumed for both Australia and Indonesia and the higher N2O fraction is due to the higher strip ratio compared to the PRB.
In addition to the base scenarios, the model was also run to evaluate the life cycle GHG emissions for a USCPC power plant fitted with a post-combustion amine carbon capture system. These scenarios were run only for the Japan destination for all three coal sources and the results are depicted in Figure 5-12 through Figure 5-15.

Life Cycle Analysis of Coal Exports from the Powder River Basin
36
Figure 5-4: Cradle-to-Busbar LCA Results for PRB Coal Exported to Japan
864.30.10.0
800.45.61.20.4
26.06.6
0.413.5
3.40.10.00.20.40.20.12.20.71.01.60.20.00.0
0 100 200 300 400 500 600 700 800 900 1,000
TotalFuel Combustion
Fuel UpstreamStack Emissions
Plant Auxiliary InputsPlant Construction
Import TerminalFuel Combustion
Fuel UpstreamExport Terminal
Fuel CombustionFuel Upstream
Fuel CombustionFuel Upstream
Fuel CombustionAmmonium Nitrate Upstream
Electricity UpstreamFuel UpstreamMine Methane
Fuel CombustionAmmonium Nitrate Upstream
Electricity UpstreamFuel Upstream
Access Road ConstructionEquipment Manufacturing
Fly
Ash
Disp
.Po
wer
Plan
tO
cean
Rail
Min
eRe
c.Co
al E
xtra
ctio
nO
verb
urde
nRe
mov
alCo
nst.
Ener
gyCo
nver
sion
Tran
spor
t
Greenhouse Gas Emissions AR5 100-yr GWP (kg CO₂e/MWh)
CO₂ CH₄ N₂O SF₆
Abbreviation Key: Fly Ash Disp. – Fly Ash Disposal Mine Rec. – Mine Reclamation Const. – Construction

Life Cycle Analysis of Coal Exports from the Powder River Basin
37
Figure 5-5: Cradle-to-Busbar LCA Results for PRB Coal Exported to Japan – Upstream Results Only
57.00.4
26.06.6
0.4
13.5
3.4
0.1
0.0
0.2
0.4
0.2
0.1
2.20.7
1.0
1.6
0.2
0.0
0.0
0 10 20 30 40 50 60 70 80
Total
Import Terminal
Fuel Combustion
Fuel Upstream
Export Terminal
Fuel Combustion
Fuel Upstream
Fuel Combustion
Fuel Upstream
Fuel Combustion
Ammonium Nitrate Upstream
Electricity Upstream
Fuel Upstream
Mine Methane
Fuel Combustion
Ammonium Nitrate Upstream
Electricity Upstream
Fuel Upstream
Access Road Construction
Equipment Manufacturing
Oce
anRa
il M
ine
Rec.
Coal
Ext
ract
ion
Ove
rbur
den
Rem
oval
Cons
t.
Tran
spor
t
Greenhouse Gas Emissions AR5 100-yr GWP (kg CO₂e/MWh) - Upstream Only
CO₂ CH₄ N₂O SF₆
Abbreviation Key: Mine Rec. – Mine Reclamation Const. – Construction

Life Cycle Analysis of Coal Exports from the Powder River Basin
38
Figure 5-6: Cradle-to-Busbar LCA Results for Australian Coal Exported to Japan
834.20.20.0
771.75.51.20.3
21.15.4
0.31.20.30.20.10.00.20.40.30.1
13.42.02.96.7
0.60.00.0
0 100 200 300 400 500 600 700 800 900 1,000
TotalFuel Combustion
Fuel UpstreamStack Emissions
Plant Auxiliary InputsPlant Construction
Import TerminalFuel Combustion
Fuel UpstreamExport Terminal
Fuel CombustionFuel Upstream
Electricity UpstreamFuel Combustion
Fuel UpstreamFuel Combustion
Ammonium Nitrate UpstreamElectricity Upstream
Fuel UpstreamMine Methane
Fuel CombustionAmmonium Nitrate Upstream
Electricity UpstreamFuel Upstream
Access Road ConstructionEquipment Manufacturing
Fly
Ash
Disp
.Po
wer
Plan
tO
cean
Rail
Cln
Min
eRe
c.Co
al E
xtra
ctio
nO
verb
urde
nRe
mov
alCo
nst.
Ener
gyCo
nver
sion
Tran
spor
tCo
al M
inin
g
Greenhouse Gas Emissions AR5 100-yr GWP (kg CO₂e/MWh)
CO₂ CH₄ N₂O SF₆
Abbreviation Key: Fly Ash Disp. – Fly Ash Disposal Mine Rec. – Mine Reclamation Const. – Construction Cln – Coal Cleaning

Life Cycle Analysis of Coal Exports from the Powder River Basin
39
Figure 5-7: Cradle-to-Busbar LCA Results for Australian Coal Exported to Japan – Upstream Results Only
55.60.3
21.15.4
0.31.2
0.30.20.10.00.20.40.30.1
13.42.0
2.96.7
0.60.00.0
0 10 20 30 40 50 60 70 80
TotalImport Terminal
Fuel CombustionFuel Upstream
Export TerminalFuel Combustion
Fuel UpstreamElectricity Upstream
Fuel CombustionFuel Upstream
Fuel CombustionAmmonium Nitrate Upstream
Electricity UpstreamFuel UpstreamMine Methane
Fuel CombustionAmmonium Nitrate Upstream
Electricity UpstreamFuel Upstream
Access Road ConstructionEquipment Manufacturing
Oce
anRa
ilCl
n M
ine
Rec.
Coal
Ext
ract
ion
Ove
rbur
den
Rem
oval
Cons
t.
Tran
spor
tCo
al M
inin
g
Greenhouse Gas Emissions AR5 100-yr GWP (kg CO₂e/MWh) - Upstream Only
CO₂ CH₄ N₂O SF₆
Abbreviation Key: Mine Rec. – Mine Reclamation Const. – Construction Cln – Coal Cleaning

Life Cycle Analysis of Coal Exports from the Powder River Basin
40
Figure 5-8: Cradle-to-Busbar LCA Results for Indonesian (Adaro) Coal Exported to Japan
854.20.00.0
805.75.7
1.20.4
15.74.00.41.50.41.60.40.40.10.70.40.2
8.93.81.81.00.00.0
0 100 200 300 400 500 600 700 800 900 1,000
Total
Fuel Combustion
Fuel Upstream
Stack Emissions
Plant Auxiliary Inputs
Plant Construction
Import Terminal
Fuel Combustion
Fuel Upstream
Export Terminal
Fuel Combustion
Fuel Upstream
Fuel Combustion
Fuel Upstream
Fuel Combustion
Fuel Upstream
Fuel Combustion
Ammonium Nitrate Upstream
Fuel Upstream
Mine Methane
Fuel Combustion
Ammonium Nitrate Upstream
Fuel Upstream
Access Road Construction
Equipment Manufacturing
Fly
Ash
Disp
.Po
wer
Pla
ntO
cean
Barg
eTr
uck
Min
eRe
c.Co
al E
xtra
ctio
nO
verb
urde
nRe
mov
alCo
nst.
Ener
gy C
onve
rsio
nTr
ansp
ort
Greenhouse Gas Emissions AR5 100-yr GWP (kg CO₂e/MWh)
CO₂ CH₄ N₂O SF₆
Abbreviation Key: Fly Ash Disp. – Fly Ash Disposal Mine Rec. – Mine Reclamation Const. – Construction

Life Cycle Analysis of Coal Exports from the Powder River Basin
41
Figure 5-9: Cradle-to-Busbar LCA Results for Indonesian (Adaro) Coal Exported to Japan -- Upstream Results Only
41.60.4
15.74.0
0.4
1.50.4
1.6
0.4
0.4
0.1
0.7
0.4
0.2
8.9
3.81.8
1.0
0.0
0.0
0 10 20 30 40 50 60 70 80
Total
Import Terminal
Fuel Combustion
Fuel Upstream
Export Terminal
Fuel Combustion
Fuel Upstream
Fuel Combustion
Fuel Upstream
Fuel Combustion
Fuel Upstream
Fuel Combustion
Ammonium Nitrate Upstream
Fuel Upstream
Mine Methane
Fuel Combustion
Ammonium Nitrate Upstream
Fuel Upstream
Access Road Construction
Equipment Manufacturing
Oce
anBa
rge
Truc
k M
ine
Rec.
Coal
Ext
ract
ion
Ove
rbur
den
Rem
oval
Cons
t.
Tran
spor
t
Greenhouse Gas Emissions AR5 100-yr GWP (kg CO₂e/MWh) - Upstream Only
CO₂ CH₄ N₂O SF₆
Abbreviation Key: Mine Rec. – Mine Reclamation Const. – Construction

Life Cycle Analysis of Coal Exports from the Powder River Basin
42
Figure 5-10: Cradle to Busbar LCA Results for Indonesian (Mulia) Coal Exported to Japan
895.00.10.0
835.35.8
1.20.5
19.85.0
0.51.90.42.00.50.50.10.80.50.2
11.24.82.31.20.00.0
0 100 200 300 400 500 600 700 800 900 1,000
Total
Fuel Combustion
Fuel Upstream
Stack Emissions
Plant Auxiliary Inputs
Plant Construction
Import Terminal
Fuel Combustion
Fuel Upstream
Export Terminal
Fuel Combustion
Fuel Upstream
Fuel Combustion
Fuel Upstream
Fuel Combustion
Fuel Upstream
Fuel Combustion
Ammonium Nitrate Upstream
Fuel Upstream
Mine Methane
Fuel Combustion
Ammonium Nitrate Upstream
Fuel Upstream
Access Road Construction
Equipment Manufacturing
Fly
Ash
Disp
.Po
wer
Pla
ntO
cean
Barg
eTr
uck
Min
eRe
c.Co
al E
xtra
ctio
nO
verb
urde
nRe
mov
alCo
nst.
Ener
gy C
onve
rsio
nTr
ansp
ort
Greenhouse Gas Emissions AR5 100-yr GWP (kg CO₂e/MWh)
CO₂ CH₄ N₂O SF₆
Abbreviation Key: Fly Ash Disp. – Fly Ash Disposal Mine Rec. – Mine Reclamation Const. – Construction

Life Cycle Analysis of Coal Exports from the Powder River Basin
43
Figure 5-11: Cradle-to-Busbar LCA Results for Indonesian (Mulia) Coal Exported to Japan -- Upstream Results Only
52.60.5
19.85.0
0.5
1.9
0.4
2.0
0.5
0.5
0.1
0.8
0.5
0.2
11.2
4.82.3
1.2
0.0
0.0
0 10 20 30 40 50 60 70 80
Total
Import Terminal
Fuel Combustion
Fuel Upstream
Export Terminal
Fuel Combustion
Fuel Upstream
Fuel Combustion
Fuel Upstream
Fuel Combustion
Fuel Upstream
Fuel Combustion
Ammonium Nitrate Upstream
Fuel Upstream
Mine Methane
Fuel Combustion
Ammonium Nitrate Upstream
Fuel Upstream
Access Road Construction
Equipment Manufacturing
Oce
anBa
rge
Truc
k M
ine
Rec.
Coal
Ext
ract
ion
Ove
rbur
den
Rem
oval
Cons
t.
Tran
spor
t
Greenhouse Gas Emissions AR5 100-yr GWP (kg CO₂e/MWh) - Upstream Only
CO₂ CH₄ N₂O SF₆
Abbreviation Key: Mine Rec. – Mine Reclamation Const. – Construction

Life Cycle Analysis of Coal Exports from the Powder River Basin
44
Figure 5-12: Cradle-to-Busbar LCA Results for PRB Coal Exported to Japan – CCS Technology Case
218.10.00.4
12.70.00.80.10.30.10.0
111.511.5
1.20.5
36.29.20.5
18.84.8
0.20.00.30.60.30.1
3.10.91.32.2
0.30.00.0
0 50 100 150 200 250
TotalSite Monitoring
Brine ManagementInjection and Site Operations
Site Prep and ConstructionPipeline Maintenance
Pipeline OperationPipeline Construction
Fuel CombustionFuel Upstream
Stack EmissionsPlant Auxiliary Inputs
Plant ConstructionImport Terminal
Fuel CombustionFuel Upstream
Export TerminalFuel Combustion
Fuel UpstreamFuel Combustion
Fuel UpstreamFuel Combustion
Ammonium Nitrate UpstreamElectricity Upstream
Fuel UpstreamMine Methane
Fuel CombustionAmmonium Nitrate Upstream
Electricity UpstreamFuel Upstream
Access Road ConstructionEquipment Manufacturing
Salin
eAq
uife
r Seq
.CO
₂ Pi
pelin
e
Fly
Ash
Disp
.Po
wer
Plan
tO
cnRa
il M
ine
Rec.
Coal
Ext
ract
ion
Ove
rbur
Rem
oval
Cons
.
CO₂ T
rans
port
and
St
orag
eEn
ergy
Conv
ersio
nTr
ansp
ort
Greenhouse Gas Emissions AR5 100-yr GWP (kg CO₂e/MWh)
CO₂ CH₄ N₂O SF₆ Total
Abbreviation Key: Saline Aquifer Seq. – Saline Aquifer Sequestration Fly Ash Disp. – Fly Ash Disposal Ocn – Ocean Mine Rec. – Mine Reclamation Cons. – Construction

Life Cycle Analysis of Coal Exports from the Powder River Basin
45
Figure 5-13: Cradle-to-Busbar LCA Results for Australian Coal Exported to Japan – CCS Technology Case
210.50.00.5
15.00.00.80.10.30.20.1
105.311.2
1.10.4
28.87.3
0.41.6
0.40.20.20.00.30.50.40.1
18.32.83.9
9.20.80.00.0
0 50 100 150 200 250
TotalSite Monitoring
Brine ManagementInjection and Site Operations
Site Prep and ConstructionPipeline Maintenance
Pipeline OperationPipeline Construction
Fuel CombustionFuel Upstream
Stack EmissionsPlant Auxiliary Inputs
Plant ConstructionImport Terminal
Fuel CombustionFuel Upstream
Export TerminalFuel Combustion
Fuel UpstreamElectricity Upstream
Fuel CombustionFuel Upstream
Fuel CombustionAmmonium Nitrate Upstream
Electricity UpstreamFuel UpstreamMine Methane
Fuel CombustionAmmonium Nitrate Upstream
Electricity UpstreamFuel Upstream
Access Road ConstructionEquipment Manufacturing
Salin
eAq
uife
r Seq
.CO
₂ Pi
pelin
e
Fly
Ash
Disp
.Po
wer
Plan
tO
cnRa
ilCl
. Min
eRe
c.Co
al E
xtra
ctio
nO
verb
urRe
mov
alCo
ns.
CO₂ T
rans
port
and
St
orag
eEn
ergy
Conv
ersio
nTr
ansp
ort
Coal
Min
ing
Greenhouse Gas Emissions AR5 100-yr GWP (kg CO₂e/MWh)
CO₂ CH₄ N₂O SF₆
Abbreviation Key: Saline Aquifer Seq. – Saline Aquifer Sequestration Fly Ash Disp. – Fly Ash Disposal Ocn – Ocean Cl. – Coal Cleaning Mine Rec. – Mine Reclamation Cons. – Construction

Life Cycle Analysis of Coal Exports from the Powder River Basin
46
Figure 5-14: Cradle-to-Busbar LCA Results for Indonesian (Adaro) Coal Exported to Japan – CCS Technology Case
197.40.00.4
12.80.00.80.10.30.00.0
112.311.4
1.20.5
21.85.5
0.52.1
0.52.2
0.60.60.20.90.60.2
12.45.3
2.51.4
0.00.0
0 50 100 150 200 250
TotalSite Monitoring
Brine ManagementInjection and Site Operations
Site Prep and ConstructionPipeline Maintenance
Pipeline OperationPipeline Construction
Fuel CombustionFuel Upstream
Stack EmissionsPlant Auxiliary Inputs
Plant ConstructionImport Terminal
Fuel CombustionFuel Upstream
Export TerminalFuel Combustion
Fuel UpstreamFuel Combustion
Fuel UpstreamFuel Combustion
Fuel UpstreamFuel Combustion
Ammonium Nitrate UpstreamFuel UpstreamMine Methane
Fuel CombustionAmmonium Nitrate Upstream
Fuel UpstreamAccess Road Construction
Equipment Manufacturing
Salin
eAq
uife
r Seq
.CO
₂ Pi
pelin
e
Fly
Ash
Disp
.Po
wer
Plan
tO
cnBa
rge
Truc
k M
ine
Rec.
Coal
Extr
actio
nO
verb
urRe
mov
alCo
ns.
CO₂ T
rans
port
and
St
orag
eEn
ergy
Conv
ersio
nTr
ansp
ort
Greenhouse Gas Emissions AR5 100-yr GWP (kg CO₂e/MWh)
CO₂ CH₄ N₂O SF₆
Abbreviation Key: Saline Aquifer Seq. – Saline Aquifer Sequestration Fly Ash Disp. – Fly Ash Disposal Ocn – Ocean Mine Rec. – Mine Reclamation Overbur. Removal – Overburden Removal Cons. – Construction

Life Cycle Analysis of Coal Exports from the Powder River Basin
47
Figure 5-15: Cradle-to-Busbar LCA Results for Indonesian (Mulia) Coal Exported to Japan – CCS Technology Case
221.40.00.4
13.50.00.90.10.30.10.0
118.411.7
1.30.7
28.17.1
0.72.7
0.62.9
0.80.80.21.20.70.3
15.96.8
3.21.8
0.00.1
0 50 100 150 200 250
TotalSite Monitoring
Brine ManagementInjection and Site Operations
Site Prep and ConstructionPipeline Maintenance
Pipeline OperationPipeline Construction
Fuel CombustionFuel Upstream
Stack EmissionsPlant Auxiliary Inputs
Plant ConstructionImport Terminal
Fuel CombustionFuel Upstream
Export TerminalFuel Combustion
Fuel UpstreamFuel Combustion
Fuel UpstreamFuel Combustion
Fuel UpstreamFuel Combustion
Ammonium Nitrate UpstreamFuel UpstreamMine Methane
Fuel CombustionAmmonium Nitrate Upstream
Fuel UpstreamAccess Road Construction
Equipment Manufacturing
Salin
eAq
uife
r Seq
.CO
₂ Pi
pelin
e
Fly
Ash
Disp
.Po
wer
Plan
tO
cnBa
rge
Truc
k M
ine
Rec.
Coal
Extr
actio
nO
verb
urRe
mov
alCo
ns.
CO₂ T
rans
port
and
St
orag
eEn
ergy
Conv
ersio
nTr
ansp
ort
Greenhouse Gas Emissions AR5 100-yr GWP (kg CO₂e/MWh)
CO₂ CH₄ N₂O SF₆
Abbreviation Key: Saline Aquifer Seq. – Saline Aquifer Sequestration Fly Ash Disp. – Fly Ash Disposal Ocn – Ocean Mine Rec. – Mine Reclamation Overbur. Removal – Overburden Removal Cons. – Construction

Life Cycle Analysis of Coal Exports from the Powder River Basin
48
5.2 Sensitivity Analysis
5.2.1 Sensitivity Tornados This analysis uses a parameterized model that allows the alteration and analysis of key parameters. Doing so allows the identification of variables that have the greatest effect on results. The sensitivity analysis was performed by increasing each parameter by 100 percent while holding all other parameters constant. The 100 percent increase is an arbitrary change – the sensitivity analysis is valid as long as all parameters are changed by the same scale. As illustrated by Figure 5-1, the life cycle GHG results for a given source of coal (e.g. PRB) change only marginally based on the ultimate destination for the coal (Japan, Korea, or Taiwan). Therefore, for the sake of brevity, the sensitivity analysis was performed assuming a single destination, Japan. The results of this analysis would not change significantly if the destination were changed to Korea or Taiwan. Similar to the presentation of results in Figure 5-1 and Figure 5-3, the sensitivity results are presented for the full cradle-to-busbar system, as well, as just the upstream fraction (power plant combustion removed) of the system. For a given coal source, the order of the parameters is the same for the cradle-to-busbar and upstream only results; only the magnitude of the parameter sensitivity changes.
Positive results in Figure 5-16 indicate that an increase in a parameter increases the result. Conversely, negative results indicate inverse relationships, where an increase in a parameter decreases the overall result. For example, a 100 percent increase in strip ratio for PRB coal increases the cradle-to-busbar GHG emissions by 0.4 percent, but a 100 percent increase in diesel fraction for ocean transport rate decreases the cradle-to-busbar emissions by 0.1 percent. The lower portion of each of the sensitivity tornado figures contained in Figure 5-16 can be equally informative with respect to the model; these parameters have a minimal impact on model results, even if they are off by 100 percent. The percentages correlate to the expected values in Figure 5-1 and Figure 5-2.
As shown by Figure 5-16, the most sensitive parameter for all of the coal sources is the distance traveled by the ocean freighter to the ultimate destination for the coal. Coal mine methane is a more sensitive parameter for the Australian and Indonesian scenarios compared to the PRB scenario because the expected value for those scenarios is three to five times higher than the expected value for PRB coal. Rail distance ranks as the second most sensitive parameter for PRB coal given the significant amount of transport that is required from the minemouth to the export terminal. For the Australian scenario, the fraction of mined coal that is rejected as waste in the coal cleaning process shows up in the middle of the parameter ranking for sensitivity. As previously shown, the direct emissions from coal cleaning are negligible, but the indirect effects associated with scaling up the mining activity are more significant.
For the Indonesian scenario, the diesel scalar parameter shows up in the middle of the parameter ranking. As previously noted, it was difficult to find reliable and publicly accessible information about the Indonesian coal mining industry. It is known that the industry tends to be less efficient since labor is cheaper compared to Australia and the U.S., thus it is likely that operations are less efficient. As a result, the model included a parameter that scaled up the diesel fuel requirements for the mining operations from those utilized at the reference mine in the U.S. Doubling the diesel requirements at the Indonesian mine would increase cradle-to-busbar GHG emissions by 0.7 percent for Adaro and 0.9 percent for Mulia. This confirms that the lack of specific knowledge about fuel use for coal mining in Indonesia is not likely to have a significant effect on the model results.

Life Cycle Analysis of Coal Exports from the Powder River Basin
49
Figure 5-16: Sensitivity Analysis Results based on AR5 100-yr GWP GHG Emissions – Japan Scenarios Only
PRB to Japan Australia to Japan Indonesia (Adaro) to Japan Indonesia (Mulia) to Japan
Cradle-to-Busbar
Upstream Fraction
Only
-0.1%
0.2%
0.3%
0.4%
2.0%
3.8%
-2.0% 0.0% 2.0% 4.0%
Ocean - DieselFraction
Ocean - Fuel OilFraction
Coal MineMethane
Strip Ratio
Rail Distance
Ocean Distance
-0.1%
0.1%
0.2%
0.2%
0.6%
1.5%
1.6%
3.2%
-2.0% 0.0% 2.0% 4.0%
Ocean - DieselFraction
Coal CleaningWaste Fine
Rail Distance
Ocean - Fuel OilFraction
Coal CleaningWaste Coarse
Strip Ratio
Coal MineMethane
Ocean Distance
0.0%
0.0%
-0.1%
0.1%
0.2%
0.2%
0.7%
0.8%
1.0%
2.3%
-2.0% 0.0% 2.0% 4.0%
Barge - DieselFraction
Barge - Fuel OilFraction
Ocean - DieselFraction
Ocean - Fuel OilFraction
Barge Distance
Truck Distance
Diesel Scaler
Strip Ratio
Coal MineMethane
Ocean Distance
0.0%
0.0%
-0.1%
0.2%
0.3%
0.3%
0.9%
0.9%
1.3%
2.8%
-2.0% 0.0% 2.0% 4.0%
Barge - DieselFraction
Barge - Fuel OilFraction
Ocean - DieselFraction
Ocean - Fuel OilFraction
Barge Distance
Truck Distance
Diesel Scaler
Strip Ratio
Coal Mine Methane
Ocean Distance
-1.6%
3.5%
3.8%
6.2%
29.6%
57.1%
-20% 0% 20% 40% 60%
Ocean - DieselFraction
Ocean - Fuel OilFraction
Coal MineMethane
Strip Ratio
Rail Distance
Ocean Distance
1.2%
-1.4%
2.0%
2.9%
8.5%
23.2%
24.2%
47.8%
-20% 0% 20% 40% 60%
Rail Distance
Ocean - DieselFraction
Coal CleaningWaste Fine
Ocean - Fuel OilFraction
Coal CleaningWaste Coarse
Strip Ratio
Coal MineMethane
Ocean Distance
-0.1%
0.1%
-1.4%
2.8%
2.9%
3.0%
15.2%
16.7%
22.2%
49.0%
-20% 0% 20% 40% 60%
Barge - DieselFraction
Barge - Fuel OilFraction
Ocean - DieselFraction
Barge Distance
Truck Distance
Ocean - Fuel OilFraction
Diesel Scaler
Strip Ratio
Coal Mine Methane
Ocean Distance
-0.1%
0.1%
-1.4%
2.8%
2.9%
3.0%
15.2%
15.2%
22.2%
49.0%
-20% 0% 20% 40% 60%
Barge - Diesel Fraction
Barge - Fuel OilFraction
Ocean - DieselFraction
Barge Distance
Truck Distance
Ocean - Fuel OilFraction
Strip Ratio
Diesel Scaler
Coal Mine Methane
Ocean Distance

Life Cycle Analysis of Coal Exports from the Powder River Basin
50
5.2.2 Construction Sensitivity During the study period, the exporting countries will vary in how many new mines are built and how much new transportation infrastructure will be needed to service those mines. It is expected that the PRB region will rely on already existing mines and will not expand, while it is expected that Australia and Indonesia will open new mines and expand transportation infrastructure. Differences in volumes of coal production and total amount of construction activities between the exporting countries does not have a multiplying effect on LCA results, because LCA results are normalized to the functional unit. Also, the life cycle encompasses a time period beyond the study period. Therefore, it would be inappropriate to apportion higher impacts to exporting countries that are engaging in construction activities during the study period. With that said, a sensitivity analysis shows that if GHG impacts from construction in Australia or Indonesia were considered to the be 10 times higher than in the U.S., the impact on the life cycle results would still be less than one percent as is shown in Figure 5-17.
Figure 5-17: Cradle-to-Busbar LCA Results for Australian Coal Exported to Japan – Upstream Results Only – Construction Impacts Increased Tenfold
5.3 Uncertainty Analysis The above sensitivity tornados are useful because they demonstrate how GHG results respond to changes in parameters. However, while a sensitivity analysis effectively demonstrates how the model behaves, it does not represent likely parameter ranges. As discussed in Section 3, many of the parameters used in this model comprise expected, low, and high values. The uncertainty analysis is
56.00.3
21.15.40.30.00.00.00.0
1.20.30.20.10.00.20.40.30.1
13.42.02.9
6.70.60.10.3
0 10 20 30 40 50 60 70 80
TotalImport Terminal
Fuel CombustionFuel Upstream
Export TerminalFuel Combustion
Fuel UpstreamFuel Combustion
Fuel UpstreamFuel Combustion
Fuel UpstreamElectricity Upstream
Fuel CombustionFuel Upstream
Fuel CombustionAmmonium Nitrate Upstream
Electricity UpstreamFuel UpstreamMine Methane
Fuel CombustionAmmonium Nitrate Upstream
Electricity UpstreamFuel Upstream
Access Road ConstructionEquipment Manufacturing
Oce
anBa
rge
Truc
kRa
ilCl
n M
ine
Rec.
Coal
Ext
ract
ion
Ove
rbur
den
Rem
oval
Cons
t.
Tran
spor
tCo
al M
inin
g
Greenhouse Gas Emissions AR5 100-yr GWP (kg CO₂e/MWh) - Upstream Only
CO₂ CH₄ N₂O SF₆

Life Cycle Analysis of Coal Exports from the Powder River Basin
51
performed by entering the minimum value of a given parameter while holding all other parameters constant at their expected value, and then performing the same activity with the maximum value. In doing so, the uncertainty analysis illustrates the extent to which the minimum and maximum values can affect results. For the same reasons discussed in Section 5.2, the uncertainty analysis was performed for only a single destination, Japan. Figure 5-18 through Figure 5-20 show the cradle-to-busbar uncertainty analysis results for the PRB, Australia, and Indonesia scenarios, respectively. The percentages correlate to the expected values in Figure 5-1.
The parameters analyzed for uncertainty only include those for which low and high values exist in Table 4-3 and Table 4-9. Therefore, the parameter count is not consistent across the coal sources, nor is it as extensive as the parameter list examined in the sensitivity analysis. Note that transport distances tend to yield a smaller amount of uncertainty than other parameters, because these values tend to be fixed and are generally well-known. By far, the most significant uncertain parameter in the analysis is the quality of coal exported from Indonesia. The cradle-to-busbar results can change by 5 percent depending on which coal from Table 4-3 is exported. Coal quality is not included as an uncertainty parameter for Australia since only one type of export grade coal is included in the model. This results in slightly less overall uncertainty for the Australian scenarios.
Figure 5-18: Cradle-to-Busbar Uncertainty Analysis Results for PRB Coal Exported to Japan
-0.10%
-0.14%
-0.38%
-0.86%
-0.23%
0.09%
0.13%
0.37%
0.15%
1.14%
-2.0% -1.5% -1.0% -0.5% 0.0% 0.5% 1.0% 1.5% 2.0%
Rail Distance
Strip Ratio
Ocean Distance
Coal Quality
Coal Mine Methane

Life Cycle Analysis of Coal Exports from the Powder River Basin
52
Figure 5-19: Cradle-to-Busbar Uncertainty Analysis Results for Australian Coal Exported to Japan
Figure 5-20: Cradle-to-Busbar Uncertainty Analysis Results for Indonesian (Adaro) Coal Exported to Japan
0.16%
-0.17%
-0.32%
-0.32%
-0.06%
0.16%
0.32%
0.32%
-2.0% -1.5% -1.0% -0.5% 0.0% 0.5% 1.0% 1.5% 2.0%
Rail Distance
Strip Ratio
Ocean Distance
Coal Mine Methane
-0.11%
-0.13%
-0.23%
-0.24%
-0.36%
0.10%
0.17%
0.23%
0.24%
0.35%
-2.0% -1.5% -1.0% -0.5% 0.0% 0.5% 1.0% 1.5% 2.0%
Barge Distance
Truck Distance
Ocean Distance
Diesel Scaler
Strip Ratio
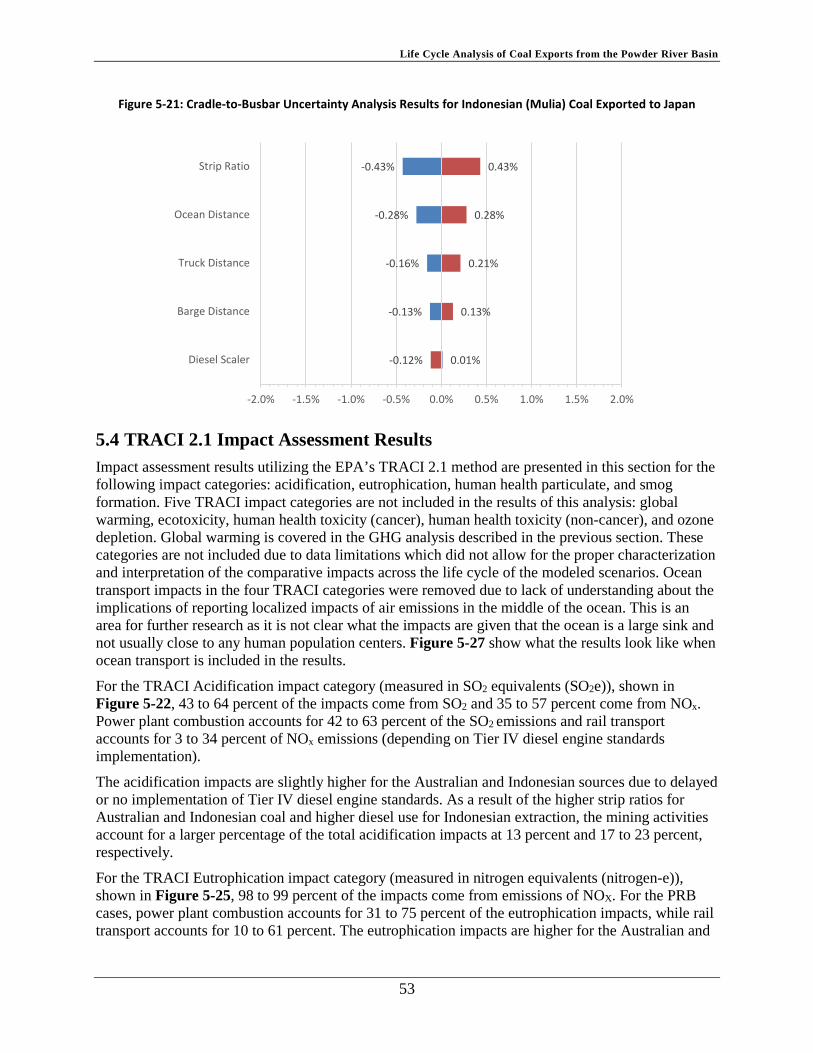
Life Cycle Analysis of Coal Exports from the Powder River Basin
53
Figure 5-21: Cradle-to-Busbar Uncertainty Analysis Results for Indonesian (Mulia) Coal Exported to Japan
5.4 TRACI 2.1 Impact Assessment Results Impact assessment results utilizing the EPA’s TRACI 2.1 method are presented in this section for the following impact categories: acidification, eutrophication, human health particulate, and smog formation. Five TRACI impact categories are not included in the results of this analysis: global warming, ecotoxicity, human health toxicity (cancer), human health toxicity (non-cancer), and ozone depletion. Global warming is covered in the GHG analysis described in the previous section. These categories are not included due to data limitations which did not allow for the proper characterization and interpretation of the comparative impacts across the life cycle of the modeled scenarios. Ocean transport impacts in the four TRACI categories were removed due to lack of understanding about the implications of reporting localized impacts of air emissions in the middle of the ocean. This is an area for further research as it is not clear what the impacts are given that the ocean is a large sink and not usually close to any human population centers. Figure 5-27 show what the results look like when ocean transport is included in the results.
For the TRACI Acidification impact category (measured in SO2 equivalents (SO2e)), shown in Figure 5-22, 43 to 64 percent of the impacts come from SO2 and 35 to 57 percent come from NOx. Power plant combustion accounts for 42 to 63 percent of the SO2 emissions and rail transport accounts for 3 to 34 percent of NOx emissions (depending on Tier IV diesel engine standards implementation).
The acidification impacts are slightly higher for the Australian and Indonesian sources due to delayed or no implementation of Tier IV diesel engine standards. As a result of the higher strip ratios for Australian and Indonesian coal and higher diesel use for Indonesian extraction, the mining activities account for a larger percentage of the total acidification impacts at 13 percent and 17 to 23 percent, respectively.
For the TRACI Eutrophication impact category (measured in nitrogen equivalents (nitrogen-e)), shown in Figure 5-25, 98 to 99 percent of the impacts come from emissions of NOX. For the PRB cases, power plant combustion accounts for 31 to 75 percent of the eutrophication impacts, while rail transport accounts for 10 to 61 percent. The eutrophication impacts are higher for the Australian and
0.01%
-0.13%
-0.16%
-0.28%
-0.43%
-0.12%
0.13%
0.21%
0.28%
0.43%
-2.0% -1.5% -1.0% -0.5% 0.0% 0.5% 1.0% 1.5% 2.0%
Diesel Scaler
Barge Distance
Truck Distance
Ocean Distance
Strip Ratio

Life Cycle Analysis of Coal Exports from the Powder River Basin
54
Indonesian sources due to delayed or no implementation of Tier IV diesel engine standards. As a result of the higher strip ratios for Australian and Indonesian coal and higher diesel use for Indonesian extraction, the mining activities account for a larger percentage of the total eutrophication impacts at 29 to 30 percent and 36 to 46 percent, respectively.
Figure 5-22: TRACI 2.1 Acidification Results1
1 Impacts from ocean transport have been removed from the results due to lack of understanding about the implications of reporting localized impacts of air emissions in the middle of the ocean.
0.78 0.800.87
0.92
0.78 0.800.87
0.92
0.78 0.800.87
0.92
0.0
0.2
0.4
0.6
0.8
1.0
1.2
PRB
Aust
ralia
Indo
nesia
- Ad
aro
Indo
nesia
- M
ulia
PRB
Aust
ralia
Indo
nesia
- Ad
aro
Indo
nesia
- M
ulia
PRB
Aust
ralia
Indo
nesia
- Ad
aro
Indo
nesia
- M
ulia
Japan Korea Taiwan
TRAC
I 2.1
Aci
dific
atio
n (k
g SO
₂e/M
Wh)
Mining Coal Cleaning Truck Transport Rail Transport Barge Transport
Export Terminal Ocean Transport Import Terminal Power Plant

Life Cycle Analysis of Coal Exports from the Powder River Basin
55
Figure 5-23: TRACI 2.1 Eutrophication Results1
The TRACI Human health particulates impact category (measured in PM2.5 equivalents (PM2.5e)) are shown in Figure 5-24. The majority of PM health impacts are caused by PM2.5 at 68 to 88 percent (Humbert, 2009). For PRB, 5 to 63 percent of particulate emissions come from transport and 27 to 72 percent comes from power plant combustion. For Australia, the majority of emissions are from power plant operations and for Indonesia, the majority of emissions come from mining.
For the TRACI Smog formation (ground-level ozone (O3)) impact category (measured in O3 equivalents (O3e)), shown in Figure 5-25, 99 percent of the impacts come from emission of NOX. For the PRB cases, rail transport accounts for 10 to 51 percent of the smog formation impacts, while power plant combustion accounts for 40 to 77 percent. As a result of the higher strip ratios for Australian and Indonesian coal and higher diesel use for Indonesian extraction, the mining activities account for a larger percentage of the total smog formation impacts at 24 percent and 29 to 34 percent, respectively.
Figure 5-26 and Figure 5-27, shows all of the TRACI 2.1 impact categories considered for this analysis, plus the previous GHG results, on a single graph for all three coal source countries with delivery to Japan. Figure 5-26 shows the result when not including ocean transport (except for the
1 Impacts from ocean transport have been removed from the results due to lack of understanding about the implications of reporting localized impacts of air emissions in the middle of the ocean.
0.020.02
0.030.03
0.020.02
0.030.03
0.020.02
0.030.03
0.0E+00
5.0E-03
1.0E-02
1.5E-02
2.0E-02
2.5E-02
3.0E-02
3.5E-02
4.0E-02
PRB
Aust
ralia
Indo
nesia
- Ad
aro
Indo
nesia
- M
ulia
PRB
Aust
ralia
Indo
nesia
- Ad
aro
Indo
nesia
- M
ulia
PRB
Aust
ralia
Indo
nesia
- Ad
aro
Indo
nesia
- M
ulia
Japan Korea Taiwan
TRAC
I 2.1
Eut
roph
icat
ion
(kg
Nitr
ogen
-e/M
Wh)
Mining Coal Cleaning Truck Transport Rail Transport
Barge Transport Export Terminal Import Terminal Power Plant

Life Cycle Analysis of Coal Exports from the Powder River Basin
56
global warming category) and Figure 5-27 shows the results when ocean transport is included1. The actual impacts lie somewhere between these two figures, indicating that there should be some impact from ocean transport.
The results for Figure 5-26 and Figure 5-27 have been normalized to the highest coal source for each impact category. As shown, coal sourced from Indonesia tends to have the highest impacts in the majority of the impact categories considered when ocean transport is not included. When ocean transport is included, Indonesia and PRB tend to have the highest impacts. Global warming potential is the only impact category where the coal sources are essentially even. As previously discussed, the majority of the other impact categories are driven by emissions from diesel combustion. As a result of the lack of diesel fuel and engine standards in Indonesia, it tends to have higher impacts in the associated categories. When ocean transport is included, the impact of the PRB and Australia scenarios increases.
Figure 5-24: TRACI 2.1 Human Health Particulate Results2
1 Ocean vessel engine emissions are based on a model developed by Argonne National Lab for marine category 3 engines. Differences in fuel specifications between countries for international ocean transport were not considered in this study.
2 Impacts from ocean transport have been removed from the results due to lack of understanding about the implications of reporting localized impacts of air emissions in the middle of the ocean.
0.050.06
0.050.06
0.050.06
0.050.06
0.050.06
0.050.06
0.0E+00
1.0E-02
2.0E-02
3.0E-02
4.0E-02
5.0E-02
6.0E-02
7.0E-02
8.0E-02
PRB
Aust
ralia
Indo
nesia
- Ad
aro
Indo
nesia
- M
ulia
PRB
Aust
ralia
Indo
nesia
- Ad
aro
Indo
nesia
- M
ulia
PRB
Aust
ralia
Indo
nesia
- Ad
aro
Indo
nesia
- M
ulia
Japan Korea Taiwan
TRAC
I 2.1
Hum
an H
ealth
Par
ticul
ate
(kg
PM2.
5-e/
MW
h)
Mining Coal Cleaning Truck Transport Rail Transport
Barge Transport Export Terminal Import Terminal Power Plant

Life Cycle Analysis of Coal Exports from the Powder River Basin
57
Figure 5-25: TRACI 2.1 Smog Formation Results1
1 Impacts from ocean transport have been removed from the results due to lack of understanding about the implications of reporting localized impacts of air emissions in the middle of the ocean.
9.82 9.9811.47
12.67
9.82 9.9811.47
12.67
9.82 9.9811.47
12.67
0
2
4
6
8
10
12
14
16
18PR
B
Aust
ralia
Indo
nesia
- Ad
aro
Indo
nesia
- M
ulia
PRB
Aust
ralia
Indo
nesia
- Ad
aro
Indo
nesia
- M
ulia
PRB
Aust
ralia
Indo
nesia
- Ad
aro
Indo
nesia
- M
ulia
Japan Korea Taiwan
TRAC
I 2.1
Sm
og(k
g O
₃e/M
Wh)
Mining Coal Cleaning Truck Transport Rail Transport
Barge Transport Export Terminal Import Terminal Power Plant

Life Cycle Analysis of Coal Exports from the Powder River Basin
58
Figure 5-26: TRACI 2.1 Impact Assessment Results – Japan Scenario Only; Normalized to Highest Contribution in Each Impact Category (Ocean transport removed)1,2
1 Impacts from ocean transport have been removed from the results due to lack of understanding about the implications of reporting localized impacts of air emissions in the middle of the ocean.
2 Global warming data in this figure come from the GHG portion of this study, rather than from TRACI.
0%
10%
20%
30%
40%
50%
60%
70%
80%
90%
100%
Acidification Eutrophication Global Warming Human HealthParticulate
Smog
PRB Australia Indonesia - Adaro Indonesia - Mulia

Life Cycle Analysis of Coal Exports from the Powder River Basin
59
Figure 5-27: TRACI 2.1 Impact Assessment Results – Japan Scenario Only; Normalized to Highest Contribution in Each Impact Category (Ocean transport included)1
5.5 Data Limitations The majority of emission inventories used in this study are air emissions; emissions to water or land are very limited. Land use impacts of mining are also not included. It is likely that direct land disturbance in Indonesia has a greater GHG impact than in the U.S. and Australia due to Indonesia being part of a carbon rich biome, but quantifying such impacts is beyond the scope of this study. Additionally, there is evidence that environmental enforcement in Indonesia is lax and illegal mining practices are relatively common, but verifying and quantifying these impacts within an LCA is beyond the scope of the study (Fogarty, 2014). Construction impacts from transportation vehicles and transportation infrastructure is also not included in the study. The study does include construction of mining vehicles and marine bulk terminals, however.
1 Global warming data in this figure come from the GHG portion of this study, rather than from TRACI.
0%
10%
20%
30%
40%
50%
60%
70%
80%
90%
100%
Acidification Eutrophication Global Warming Human HealthParticulate
Smog
PRB Australia Indonesia - Adaro Indonesia - Mulia

This page intentionally left blank.
Life Cycle Analysis of Coal Exports from the Powder River Basin
61
6 References
Australian Bureau of Resources and Energy Economics. (2014). Australian Energy Projections to 2049-50. Retrieved 10/2/15, from https://web.archive.org/web/20151002165815/http://www.industry.gov.au/Office-of-the-Chief-Economist/Publications/Documents/aep/aep-2014-v2.pdf
Australian Government Department of Industry. (2014). Australian Energy Resource Assessment. Retrieved 12/11/15, from http://www.ga.gov.au/webtemp/image_cache/GA21797.pdf
Australian Government Department of the Environment. (2014). National Inventory Report 2012 Volume 1: The Australian Government Submission to the United Nations Framework Convention on Climate Change Australian National Greenhouse Accounts. Commonwealth of Australia
Australian Government Department of the Environment. (2015a). Diesel fuel quality standard. Retrieved 12/17/15, from https://web.archive.org/web/20151217204223/https://www.environment.gov.au/topics/environment-protection/fuel-quality/standards/diesel
Australian Government Department of the Environment. (2015b). Working towards a National Clean Air Agreement: Discussion paper. Commonwealth of Australia. Retrieved 12/11/15, from https://web.archive.org/web/20151211151135/http://www.environment.gov.au/system/files/pages/e60c698a-ea71-4f3f-8c01-30213f1512e1/files/ncaa-discussion-paper.pdf
Bare, J. (2012). Tool for the Reduction and Assessment of Chemical and other Environmental Impacts (TRACI): TRACI Version 2.1 - User’s Manual. (S-10637-CP-2-0). Cincinnati, OH: U.S. EPA National Risk Management Laboratory
BLM. (2010). Environmental Assessment For Spring Creek Coal Lease Modification MTM-069782 and Amendment to Land Use Lease MTM-74913 EA# MT-DOI-BLM-MT-020-2010-29.
BNSF Railway. (2013a). BNSF Rail Miles Inquiry. Retrieved July 1, 2015, from http://www.bnsf.com/bnsf.was6/RailMiles/RMCentralController
BNSF Railway. (2013b). Guide to Coal Mines - Mines Served by BNSF Railway. Fort Worth, Texas: Retrieved July 1, 2015, from http://www.bnsf.com/customers/pdf/mineguide.pdf
CBC News. (2014, 8/21/2014). Surrey Fraser coal terminal approved by Port Metro Vancouver. CBC News, from http://www.cbc.ca/news/canada/british-columbia/surrey-fraser-coal-terminal-approved-by-port-metro-vancouver-1.2743022

Life Cycle Analysis of Coal Exports from the Powder River Basin
62
Cornot-Gandolphe, S. (2015). US Coal Exports: The Long Road to Asian Markets. Retrieved 7/30/15, from http://www.oxfordenergy.org/wpcms/wp-content/uploads/2015/03/CL-21.pdf
DieselNet. (2008, April 2008). Locomotives. ECOpoint Inc. Retrieved 9/24/15, 2015, from https://web.archive.org/web/20150924124346/http://www.dieselnet.com/standards/us/loco.php
DieselNet. (2013, April 2013). Nonroad Diesel Engines. ECOpoint Inc. Retrieved 9/18/15, from https://web.archive.org/web/20150918123342/https://www.dieselnet.com/standards/us/nonroad.php
DOE. (2002). Energy and Environmental Profile of the U.S. Mining Industry. Washington, DC: U.S. Department of Energy, from http://energy.gov/eere/amo/downloads/itp-mining-energy-and-environmental-profile-us-mining-industry-december-2002
EIA. (2015a). Annual Coal Report 2013. Retrieved 7/21/15, from http://www.eia.gov/coal/annual/
EIA. (2015b). Coal Data Browser. Retrieved 7/21/15, from http://www.eia.gov/beta/coal/data/browser/
EIA. (2015c). Coal: Data. Retrieved 7/21/15, from http://www.eia.gov/coal/data.cfm
EIA. (2015d). Electricity Supply, Disposition, Prices, and Emissions, Reference Case Annual Energy Outlook 2015.
EIA. (2015e, July 2015). Quarterly Coal Report, from http://www.eia.gov/coal/production/quarterly/
ENVIRON International Corporation. (2014). Gateway Pacific Terminal Air Quality Technical Report Revised Site Layout. (29-24703B). Retrieved 7/23/15, from http://eisgatewaypacificwa.gov/sites/default/files/content/files/AQ-GPT_RevisedLayout_AQ_Report_061614.pdf
Control of Emissions from New and In-Use Nonroad Compression-Ignition Engines: Emission Standards and Related Requirements, 40 C.F.R. §1039.101 (2005).
EPA. (2008). Handbook for Developing Watershed Plans to Restore and Protect Our Waters - Glossary. from http://water.epa.gov/polwaste/nps/upload/2008_04_18_NPS_watershed_handbook_glossary.pdf
EPA. (2012a). Summary Report: Global Anthropogenic Non-CO2 Greenhouse Gas Emissions: 1990 - 2030. (EPA 430-S-12-002). Washington, D.C.: U.S. Environmental Protection Agency. Retrieved July 1, 2015, from http://www.epa.gov/climatechange/Downloads/EPAactivities/Summary_Global_NonCO2_Projections_Dec2012.pdf

Life Cycle Analysis of Coal Exports from the Powder River Basin
63
EPA. (2012b). Tool for the Reduction and Assessment of Chemical and other Environmental Impacts (TRACI) - User's Manual.
EPA. (2013). Particulate Matter: Basic Information. Retrieved 6/17/13, from http://www.epa.gov/airquality/particlepollution/basic.html
EPA. (2015a, 9/22/15). Diesel Fuel. U.S. Environmental Protection Agency. Retrieved 9/22/15, from https://web.archive.org/web/20150922140217/http://www3.epa.gov/otaq/fuels/dieselfuels/index.htm
EPA. (2015b). Inventory of U.S. Greenhouse Gas Emissions and Sinks: 1990 - 2013. (EPA 430-R-15-004). Washington, D.C.: U.S. Environmental Protection Agency, from http://www.epa.gov/climatechange/Downloads/ghgemissions/US-GHG-Inventory-2015-Main-Text.pdf
Fogarty, D. (2014, 10/16/2014). Indonesia tries to clamp down on coal sector’s worst excesses. Mongabay Retrieved 12/4/15, from http://news.mongabay.com/2014/10/indonesia-tries-to-clamp-down-on-coal-sectors-worst-excesses/
Gateway Pacific Terminal. (n.d.). Gateway Pacific Terminal. Retrieved 1/8/15, from http://gatewaypacificterminal.com/the-project/
Global Methane Initiative. (2010). Coal Mine Methane Country Profiles. Retrieved June 3, 2014, from https://www.globalmethane.org/documents/toolsres_coal_overviewfull.pdf
Humbert, S. (2009). Geographically Differentiated Life-cycle Impact Assessment of Human Health. University of California, Berkeley.
IEA. (2014). Coal Medium-Term Market Report 2014: Market Analysis and Forcasts to 2019. Retrieved 7/27/15, from https://www.iea.org/bookshop/495-Medium-Term_Coal_Market_Report_2014
IHS. (2014). Coal Report. Retrieved 8/25/15, from http://cr.mccloskeycoal.com/
IPCC. (2013). Climate Change 2013 The Physical Science Basis. New York: Cambridge University Press: Intergovernmental Panel on Climate Change. Retrieved December 12, 2013, from http://www.climatechange2013.org/images/uploads/WGIAR5_WGI-12Doc2b_FinalDraft_All.pdf
Lucarelli, B. (2010). The History and Future of Indonesia's Coal Industry: Impact of Politics Regulatory Framework on Industry Structure and Performance. Stanford Program on Energy and Sustainable Development. Retrieved 12/11/15, from https://web.archive.org/web/20151211203620/http://pesd.fsi.stanford.edu/sites/default/files/WP_93_Lucarelli_revised_Oct_2010.pdf
Maunder, D. (2015). [PRB Coal Extraction Operations]. Personal Communication
Life Cycle Analysis of Coal Exports from the Powder River Basin
64
Maunder, D., & Sersland, D. (2015, 6/4/15 and 6/19/15). [Utility Provider for the Spring Creek Mine in Montana]. Personal Communication
Mewing, M. (2015). [International Coal Specifications and Operations]. Personal Communication
Mewing, M. (2015). [International Coal Specifications and Operations]. Personal Communication
Miller, K. (2015, 9/10/15). [EPA Tier IV Requirements and Equipment Engine Size]. Personal Communication
Mitra, R., & Saydam, S. (2012). Surface Coal Mining Methods in Australia. Intech. Retrieved 8/21/15, from http://cdn.intechopen.com/pdfs-wm/30795.pdf
Moore, A. (2013). Vancouver's Westshore Terminal coal exports increase in second quarter. Retrieved from http://www.platts.com/latest-news/coal/washington/vancouvers-westshore-terminal-coal-exports-increase-21394473.
National Mining Association. (2015). Reclamation: Did you Know?, from http://www.nma.org/index.php/land/reclamation
National Mining Association. (n.d.). Existing and Potential Coal Export Infrastructure. In N. M. Association (Ed.).
NETL. (2008). Development of Baseline Data and Analysis of Life Cycle Greenhouse Gas Emissions of Petroleum-Based Fuels. (DOE/NETL-2009/1346). Pittsburgh, PA: National Energy Technology Laboratory Retrieved May 23, 2012, from http://netl.doe.gov/research/energy-analysis/publications/details?pub=39a03247-40ab-441d-8f32-1654e76e2ee4
NETL. (2010a). Life Cycle Analysis: Integrated Gasification Combined Cycle (IGCC). (DOE/NETL-403/110209). Pittsburgh, PA: National Energy Technology Laboratory,
NETL. (2010b). Life Cycle Analysis: Supercritical Pulverized Coal (SCPC) Power Plant. (DOE/NETL-403/110609). Pittsburgh, PA: National Energy Technology Laboratory, Retrieved May 9, 2014, from http://www.netl.doe.gov/File%20Library/Research/Energy%20Analysis/Life%20Cycle%20Analysis/SCPC-LCA-Final-Report---Report---9-30-10---Final---Rev-1.pdf
NETL. (2011). Cost and Performance Baseline for Fossil Energy Plants: Volume 3b: Low Rank Coal to Electricity: Combustion Cases. (DOE/NETL-2011/1463). Pittsburgh, PA: National Energy Technology Laboratory. Retrieved May 9, 2014, from http://www.netl.doe.gov/research/energy-analysis/energy-baseline-studies
NETL. (2012). Carbon Sequestration Atlas of the United States and Canada Fourth Edition. National Energy Technology Laboratory. Retrieved January 31, 2013, from http://www.netl.doe.gov/research/coal/carbon-storage/atlasiv

Life Cycle Analysis of Coal Exports from the Powder River Basin
65
NETL. (2013a). Gate-to-Grave Life Cycle Analysis Model of Saline Aquifer Sequestration of Carbon Dioxide. (DOE/NETL-2013/1600). Pittsburgh, PA: National Energy Technology Laboratory. Retrieved September 26, 2013 from http://www.netl.doe.gov/research/energy-analysis/life-cycle-analysis/lca-listing?prog=petro
NETL. (2013b). Life Cycle Analysis: Integrated Gasification Combined Cycle (IGCC). (DOE/NETL-403/110209). Pittsburgh, PA: National Energy Technology Laboratory, Retrieved May 9, 2014, from http://www.netl.doe.gov/research/energy-analysis/life-cycle-analysis/lca-listing?prog=coal
NETL. (2014a). Comprehensive Analysis of Coal and Biomass Conversion to Jet Fuel: Oxygen Blown, Transport Reactor Integrated Gasifier (TRIG) and Fischer-Tropsch (F-T) Catalyst Configurations. (DOE/NETL-2012/1563 ). Pittsburgh, PA: National Energy Technology Laboratory. Retrieved May 9, 2014, from http://www.netl.doe.gov/File%20Library/Research/Energy%20Analysis/Life%20Cycle%20Analysis/CCAT-NETL-CBTL-Jet-Fuel-Final-Report.pdf
NETL. (2014b). Life Cycle Analysis of Natural Gas Extraction and Power Generation. (DOE/NETL-2014/1646). Pittsburgh, PA: National Energy Technology Laboratory, from http://netl.doe.gov/File%20Library/Research/Energy%20Analysis/Life%20Cycle%20Analysis/NETL-NG-Power-LCA-29May2014.pdf
NETL. (2015). Grid Mix Explorer. Pittsburgh, PA: National Energy Technology Laboratory. Retrieved 7/29/15, from http://www.netl.doe.gov/research/energy-analysis/life-cycle-analysis/lca-listing?prog=model
NSW EPA. (2015). Cleaner non-road diesel plant and equipment. New South Wales Environmental Protection Authority. Retrieved 12/17/15, from https://web.archive.org/web/20151217202839/http://www.epa.nsw.gov.au/air/nonroaddiesel.htm
Oregon Public Broadcasting. (2012). Coal Scorecard: Your Guide To Coal In The Northwest. Retrieved from http://www.opb.org/news/article/coal-score-card/
Profita, C. (2013). Coal Exports Via Seattle? More Like Canada. Ecotrope. Retrieved from http://www.opb.org/news/blog/ecotrope/coal-exports-via-seattle-more-like-canada/
Research Gate. (n.d.). 1.3 Properties of Coal. Retrieved 8/20/15, from http://www.researchgate.net/publictopics.PublicPostFileLoader.html?id=55101748d5a3f291118b45de&key=099d2483-4e58-44f1-9f50-bd4206c0658f
SeaRates LP. (2015). Distance and Time Online Calculator. Retrieved July 1, 2015, from http://www.searates.com/reference/portdistance/
Source Watch. (2014). Prince Rupert Port. Retrieved 6/24/15, from http://www.sourcewatch.org/index.php/Prince_Rupert_Port

Life Cycle Analysis of Coal Exports from the Powder River Basin
66
Source Watch. (2015, 7/3/15). Canada and coal. Retrieved 7/22/15, from http://www.sourcewatch.org/index.php/Canada_and_coal
State of Washington Department of Ecology. (2014a). Environmental Review Gateway Pacific Terminal at Cherry Point Proposal. Retrieved August 3, 2015, from http://www.ecy.wa.gov/geographic/gatewaypacific/
State of Washington Department of Ecology. (2014b). Environmental Review Millennium Bulk Terminals Longview (MBTL) proposal. Retrieved August 3, 2015, from http://www.ecy.wa.gov/geographic/millennium/
UNEP. (2015). Status of Fuel Quality and Vehicle Emission Standards in Asia-Pacific. In U. N. E. Programme (Ed.).
Union Pacific. (2015). Coal Specifications Table. Retrieved July 1, 2015, from http://www.up.com/customers/coal/mines/specs_table/index.htm
USGS. (2011). Estimates of Electricity Requirements for the Recovery of Mineral Commodities, with Examples Applied to Sub-Saharan Africa. Reston, VA: U. S. G. Survey, from http://pubs.usgs.gov/of/2011/1253/report/OF11-1253.pdf
World Coal Association. (2007). Coal Conversion Statistics. Retrieved July 1, 2015, from http://www.worldcoal.org/resources/coal-statistics/coal-conversion-statistics/
World Coal Association. (2014). Coal Facts 2014. Retrieved 2/2/16, from https://web.archive.org/web/20160202160918/https://www.worldcoal.org/sites/default/files/coal_facts_2014%2812_09_2014%29.pdf

Life Cycle Analysis of Coal Exports from the Powder River Basin
A-1
Appendix A: Unit Process Maps for the Life Cycle Analysis of Coal Exports from
the Powder River Basin
Table of Contents A.1 Model Overview ................................................................................................................... A-3 A.2 Model Connectivity and Unit Process Links ..................................................................... A-3 A.3 NETL Conventions for Modeling Fuel Combustion ........................................................ A-6 A.4 References .......................................................................................................................... A-35
Tables Table A-1: Parent/Child Plan Connections for Coal Exports ............................................................ A-4 Table A-2: Example Appendix table ................................................................................................. A-6 Table A-3: Coal Exports Model Parameter Values and Applicable Unit Processes .......................... A-7 Table A-4: Coal Exports .................................................................................................................... A-9 Table A-5: Surface Coal Mine – Construction .................................................................................. A-9 Table A-6: Surface Mine Comissioning/Decommissioning ............................................................ A-10 Table A-7: Assembly: Surface Coal Mine, Constrution .................................................................. A-11 Table A-8: Blasthole Drill, Construction ......................................................................................... A-12 Table A-9: Coal Loading Silo, Construction ................................................................................... A-12 Table A-10: Conveyor System, Construction .................................................................................. A-14 Table A-11: Coal Loader, Construction ........................................................................................... A-14 Table A-12: Dragline, Construction................................................................................................. A-15 Table A-13: Mining Truck, Construction ........................................................................................ A-15 Table A-14: Electric Shovel, Construction ...................................................................................... A-16 Table A-15: Coal Crusher, Construction ......................................................................................... A-17 Table A-16: Surface Coal Mine – Coal Exports – Overburden Removal........................................ A-18 Table A-17: Surface Coal Mine – Coal Exports – Coal Extraction ................................................. A-20 Table A-18: Surface Coal Mine – Coal Exports – Mine Reclamation ............................................ A-22 Table A-19: Coal Cleaning .............................................................................................................. A-23 Table A-20: Rail Transport .............................................................................................................. A-25 Table A-21: Truck Transport ........................................................................................................... A-26 Table A-22: Barge Transport ........................................................................................................... A-26 Table A-23: Ocean Freighter Transport ........................................................................................... A-27 Table A-24: PPFM CTG Model – Modified for Coal Exports ........................................................ A-29 Table A-25: SCPC Power Plant, Construction ................................................................................ A-30 Table A-26: Ammonia Production, No CO2 Capture ...................................................................... A-32 Table A-27: Fly Ash Disposal ......................................................................................................... A-32 Table A-28: CO2 Pipeline – No Compression ................................................................................. A-33 Table A-29: CO2 Pipeline Construction ........................................................................................... A-34

Life Cycle Analysis of Coal Exports from the Powder River Basin
A-2
Figures Figure A-1: Tiered Modeling Approach ............................................................................................ A-3 Figure A-2: Coal Exports - Top-Level Plan....................................................................................... A-8 Figure A-3: Surface Coal Mine – Construction – Second-Level Plan ............................................... A-9 Figure A-4: Surface Mine Comissioning/Decommissioning – Third-Level Plan ........................... A-10 Figure A-5: Assembly: Surface Coal Mine, Construction – Third-Level Plan................................ A-11 Figure A-6: Blasthole Drill, Construction – Fourth-level Plan ........................................................ A-11 Figure A-7: Coal Loading Silo, Construction – Fourth-level Plan .................................................. A-12 Figure A-8: Conveyor System, Construction – Fourth-level Plan ................................................... A-13 Figure A-9: Coal Loader, Construction – Fourth-level Plan ........................................................... A-14 Figure A-10: Dragline, Construction – Fourth-level Plan ............................................................... A-15 Figure A-11: Mining Truck, Construction – Fourth-level Plan ....................................................... A-15 Figure A-12: Electric Shovel, Construction – Fourth-level Plan ..................................................... A-16 Figure A-13: Coal Crusher, Construction – Fourth-level Plan ........................................................ A-17 Figure A-14: Surface Coal Mine – Coal Exports – Overburden Removal – Second-Level Plan .... A-18 Figure A-15: Surface Coal Mine – Coal Exports – Coal Extraction – Second-Level Plan ............ A-20 Figure A-16: Surface Coal Mine – Coal Exports – Mine Reclamation – Second-Level Plan ......... A-22 Figure A-17: Coal cleaning – Second-Level Plan ........................................................................... A-23 Figure A-18: Rail Transport – Second-Level Plan .......................................................................... A-24 Figure A-19: Truck Transport – Second-Level Plan ....................................................................... A-25 Figure A-20: Barge Transport – Second-Level Plan ....................................................................... A-26 Figure A-21: Ocean Freighter Transport – Second-Level Plan ....................................................... A-27 Figure A-22: PPFM CTG Model – Modified for Coal Exports – Second-level Plan ...................... A-28 Figure A-23: SCPC Power Plant, Construction – Third-level Plan ................................................. A-30 Figure A-24: Ammonia Production, No CO2 Capture – Third-level Plan ....................................... A-31 Figure A-25: Fly Ash Disposal – Second-level Plan ....................................................................... A-32 Figure A-26 CO2 Pipeline – No Compression – Second-level Plan ................................................ A-33 Figure A-27 CO2 Pipeline Construction – Third-level Plan ............................................................ A-34 Figure A-28: Saline Aquifer Sequestration – Second-level Plan* ................................................... A-35

Life Cycle Analysis of Coal Exports from the Powder River Basin
A-3
A.1 Model Overview This model was created using unit processes developed by NETL and modeled in the GaBi 6.0 LCA modeling software package. All of the unit processes utilized to create this model are publicly available on the NETL website, with the exception of those noted explicitly below, which are available from PE International. The model can be re-created utilizing the GaBi 6.0 software or by utilizing a spreadsheet to perform the scaling calculations between the individual unit processes.
A.2 Model Connectivity and Unit Process Links The structure of LCA models in GaBi uses a tiered approach, which means that there are different groups of processes, known as plans, which are combined to create the model. To aid in the connectivity of various plans used in this model, the following naming convention will be utilized in the figure headings throughout the remainder of this section. The main plan will be referred to as the top-level plan, and all subsequent plans will be referred to as second-, third-, etc. level plans. An example of this tiered-nature of the model structure is shown in Figure A-1.
Figure A-1: Tiered Modeling Approach
Table A-1 demonstrates the relationships between the tiers of plans used in the construction of the model. The figures in this section illustrate the connectivity of the various processes and plans.
Plan 1
Plan 2a
Process 3a Process 3b Plan 3a
Process 4a Process 4b
Plan 2b
Process 3c Process 3d
Process 2a
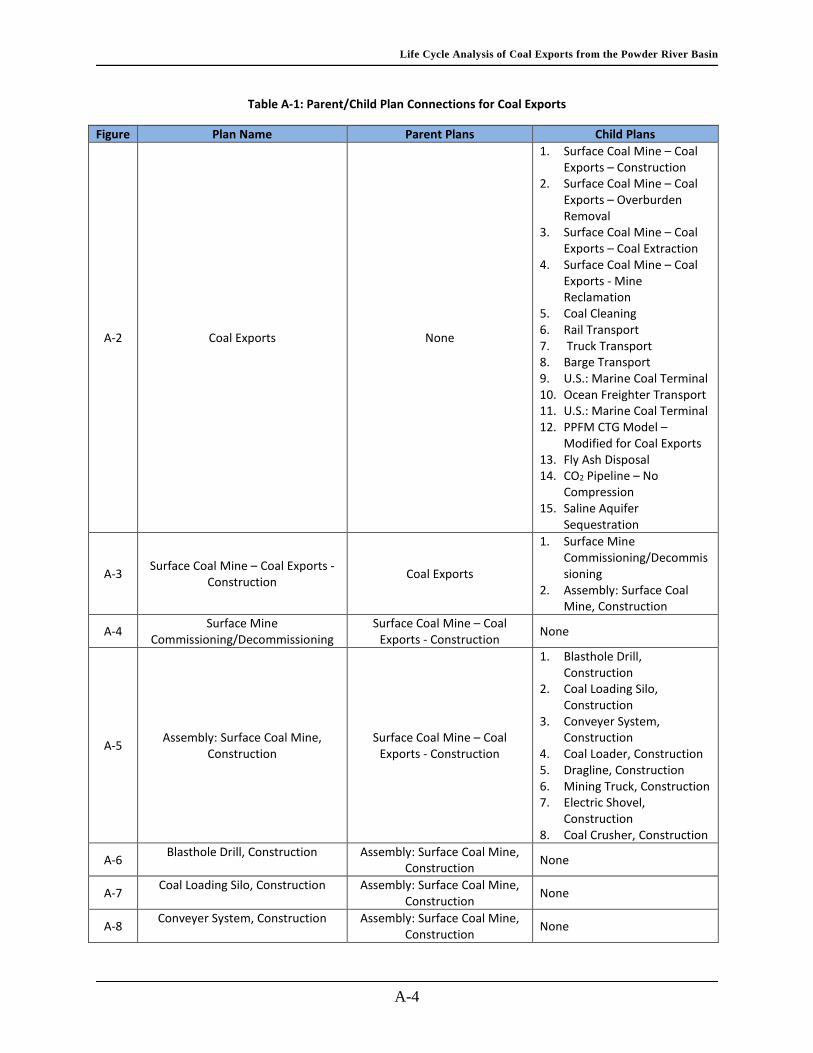
Life Cycle Analysis of Coal Exports from the Powder River Basin
A-4
Table A-1: Parent/Child Plan Connections for Coal Exports
Figure Plan Name Parent Plans Child Plans
A-2 Coal Exports None
1. Surface Coal Mine – Coal Exports – Construction
2. Surface Coal Mine – Coal Exports – Overburden Removal
3. Surface Coal Mine – Coal Exports – Coal Extraction
4. Surface Coal Mine – Coal Exports - Mine Reclamation
5. Coal Cleaning 6. Rail Transport 7. Truck Transport 8. Barge Transport 9. U.S.: Marine Coal Terminal 10. Ocean Freighter Transport 11. U.S.: Marine Coal Terminal 12. PPFM CTG Model –
Modified for Coal Exports 13. Fly Ash Disposal 14. CO2 Pipeline – No
Compression 15. Saline Aquifer
Sequestration
A-3 Surface Coal Mine – Coal Exports - Construction Coal Exports
1. Surface Mine Commissioning/Decommissioning
2. Assembly: Surface Coal Mine, Construction
A-4 Surface Mine Commissioning/Decommissioning
Surface Coal Mine – Coal Exports - Construction None
A-5 Assembly: Surface Coal Mine, Construction
Surface Coal Mine – Coal Exports - Construction
1. Blasthole Drill, Construction
2. Coal Loading Silo, Construction
3. Conveyer System, Construction
4. Coal Loader, Construction 5. Dragline, Construction 6. Mining Truck, Construction 7. Electric Shovel,
Construction 8. Coal Crusher, Construction
A-6 Blasthole Drill, Construction
Assembly: Surface Coal Mine, Construction None
A-7 Coal Loading Silo, Construction
Assembly: Surface Coal Mine, Construction None
A-8 Conveyer System, Construction
Assembly: Surface Coal Mine, Construction None

Life Cycle Analysis of Coal Exports from the Powder River Basin
A-5
Figure Plan Name Parent Plans Child Plans
A-9 Coal Loader, Construction
Assembly: Surface Coal Mine, Construction None
A-10 Dragline, Construction
Assembly: Surface Coal Mine, Construction None
A-11 Mining Truck, Construction
Assembly: Surface Coal Mine, Construction None
A-12 Electric Shovel, Construction
Assembly: Surface Coal Mine, Construction None
A-13 Coal Crusher, Construction Assembly: Surface Coal Mine,
Construction None
A-14 Surface Coal Mine – Coal Exports – Overburden Removal Coal Exports None
A-15 Surface Coal Mine – Coal Exports – Coal Extraction Coal Exports None
A-16 Surface Coal Mine – Coal Exports - Mine Reclamation Coal Exports None
A-17 Coal Cleaning Coal Exports None A-18 Rail Transport Coal Exports None A-19 Truck Transport Coal Exports None A-20 Barge Transport Coal Exports None A-21 Ocean Freighter Transport Coal Exports None
A-22 PPFM CTG Model – Modified for Coal Exports Coal Exports
1. SCPC Power Plant, Construction
2. Ammonia Production, No CO2 Capture
A-23 SCPC Power Plant, Construction PPFM CTG Model None
A-24 Ammonia Production, No CO2 Capture PPFM CTG Model None
A-25 Fly Ash Disposal Coal Exports None A-25 CO2 Pipeline – No Compression Coal Exports 1. CO2 Pipeline Construction A-26 CO2 Pipeline Construction CO2 Pipeline – No Compression None
A-27 Saline Aquifer Sequestration Coal Exports See NETL’s saline aquifer LCA (NETL, 2013)
The following section includes screenshots of the GaBi plans followed by a table of the unit processes included in the corresponding plan. Table A-2 gives an example of the tables. The “Unit Process” column provides the name of the unit process as it is called in the GaBi mode,l as well as the name of the unit process as it can be found on the NETL LCA website:
http://www.netl.doe.gov/research/energy-analysis/life-cycle-analysis/unit-process-library
To find the complete documentation of each unit process, either open the hyperlink provided OR go to the NETL LCA website and search for the files with the corresponding name.
The majority of NETL unit processes are parameterized. The parameter values are utilized within calculations in the unit process to determine the input and output values for that corresponding process. In addition to allowing for the assessment of uncertainty and sensitivity in the overall model results, parameters also make unit processes flexible. For example, the distance parameter in the cargo train transport unit process can be adjusted as necessary to meet the requirements for a particular study. Unit processes posted on the NETL website are prepopulated with default parameter

Life Cycle Analysis of Coal Exports from the Powder River Basin
A-6
values. For this study, some parameter values were altered to accurately model the desired scenarios. These values are detailed in Table A-3 with the corresponding unit process. To match the results presented in this study, it is important that the parameter values are tuned accordingly.
Table A-2: Example Appendix table
Unit Process Notes Version Version Date
NETL Unit Process Library Name Brief Description of Unit Process or Plan # #/####
A.3 NETL Conventions for Modeling Fuel Combustion NETL utilizes a special convention related to the modeling of petroleum fuel combustion emissions (e.g., diesel). When a fuel is combusted, there is typically a set of three processes: (1) cradle-to-gate production of the fuel, (2) combustion of that fuel in a specified piece of equipment (e.g., reciprocating engine, mobile source, etc.), and (3) a process that includes parameters to scale the amount of combusted fuel required to meet the demands of the system (e.g., cargo train transport, tug and barge transport) . The flow that moves between processes 2 and 3 is a flow of combusted fuel and is used only for the purposes of scaling all of the processes in the system to the functional unit. For example, the rail transport process includes parameters that are used to calculate the required combusted fuel input (e.g., distance and fuel efficiency). Given those values, that rail transport process demands the corresponding amount of combusted fuel. As discussed above, those combustion emissions are contained and accounted for in a separate unit process.

Life Cycle Analysis of Coal Exports from the Powder River Basin
A-7
Table A-1: Coal Exports Model Parameter Values and Applicable Unit Processes
Parameter 1 Parameter 2 Export Location
Applicable Unit Process PRB Australia Indonesia
Coal Mine Methane (scf/ton) Low Value 0.8 34.3
27.9 Coal Mine Methane Emissions Expected Value 8.0 42.9 High Value 38.7 54.4
Diesel Scalar Low Value
1 1 2
Surface Coal Mining – Overburden Removal, Extraction, and Reclamation
Expected Value 3 High Value 4
Mine Electricity Switch N/A 1 1 0 Surface Coal Mining – Overburden Removal,
Extraction, and Reclamation;
See Table 4-2 for Grid Mixes
Strip Ratio Low Value 2 8 3
Surface Coal Mining – Overburden Removal, Extraction, and Reclamation
Expected Value 3 9 5.5 High Value 4 10 8
Coal Cleaning Switch N/A 0 1 0 Logic block; no associated UP Sulfur Concentration of
Diesel Fuel (ppm) N/A 15 10 3500 Combustion of Diesel
Rail Distance (km)
Low Value 1,900 150 N/A Cargo, Train Transport Expected Value 2,000 225
High Value 2,100 300
Truck Distance (km)
Low Value N/A N/A
44 Tractor-tanker transport Expected Value 79
High Value 114
River Barge Distance (km)
Low Value N/A N/A
100 Tug and Barge Transport Expected Value 250
High Value 450 Ocean Distance
(km) L/H are +/-10%
To Japan 7,892 8,075 4,683 Ocean Freighter Transport To Korea 8,451 8,558 4,380
To Taiwan 9,904 7,888 2,997
Coal Type
Low Value Spring Creek
Hunter Valley
Adaro, Mulia
Modeled Separately
PPFM – Power Plant Flexible Model See Table 4-3 for Coal Specifications
Expected Value Decker
High Value North Antelope

Life Cycle Analysis of Coal Exports from the Powder River Basin
A-8
Figure A-2: Coal Exports - Top-Level Plan

Life Cycle Analysis of Coal Exports from the Powder River Basin
A-9
Table A-2: Coal Exports
Unit Process Notes Version Version Date
Storage/Disposal Coal Mine Tailings
This unit process provides a summary of relevant input and output flows associated with disposing or storing coal mine tailings in an impoundment (pond), piles (landfill), or backfill.
1 6/2014
Marine Coal Terminal
This unit process provides a summary of relevant input and output flows associated with the processing of coal at a marine bulk terminal. Inputs to this unit process includes coal. Outputs include air emissions.
1 5/2015
Figure A-3: Surface Coal Mine – Construction – Second-Level Plan
Table A-3: Surface Coal Mine – Construction
Unit Process Notes Version Version Date
Water use and quality from surface mining of
coal
This unit process provides a summary of water consumption and quality associated with surface mining of coal. The data are representative of subbituminous coal from the Powder River Basin.
2 7/2013
Surface Coal Mining – Overburden Removal,
Extraction, and Reclamation
This unit process provides a summary of relevant input and output flows associated with the extraction of coal from a surface mine. This includes the amount of electricity and fuel required to power equipment and the direct particulate matter and volatile organic compound emissions from operating equipment and using explosives. Combustion emissions are not included in this unit process, but are included in Combustion of Diesel.
1 8/2015
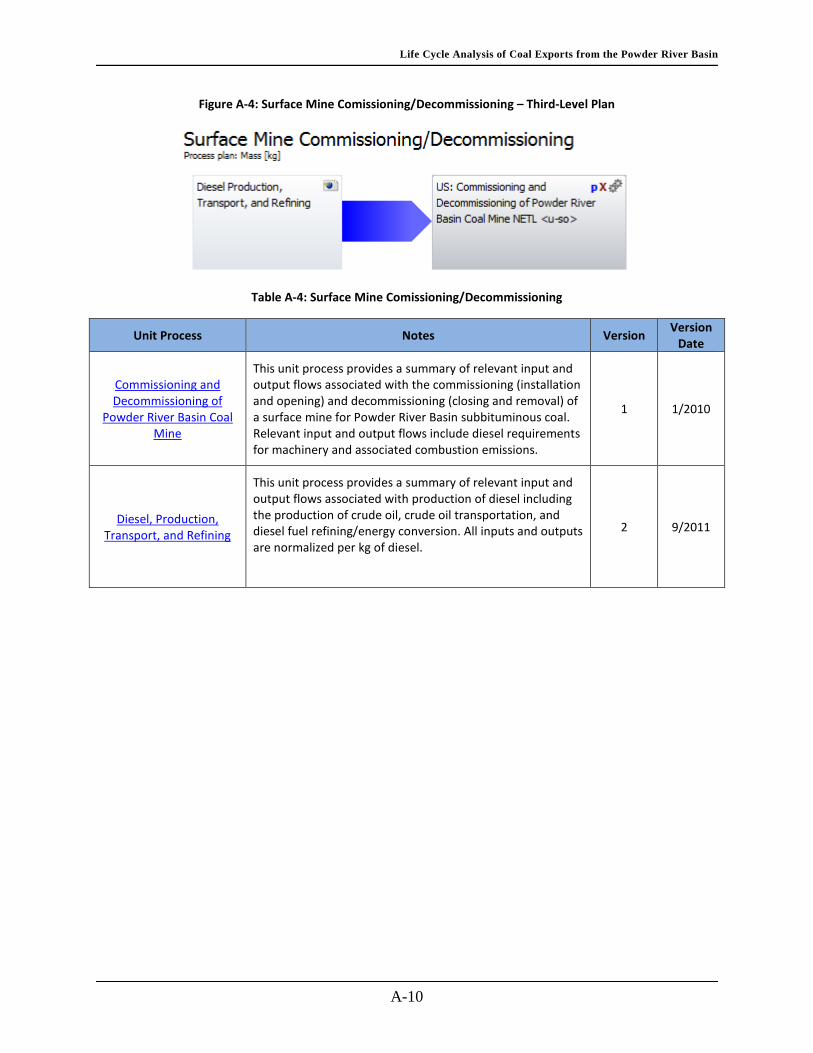
Life Cycle Analysis of Coal Exports from the Powder River Basin
A-10
Figure A-4: Surface Mine Comissioning/Decommissioning – Third-Level Plan
Table A-4: Surface Mine Comissioning/Decommissioning
Unit Process Notes Version Version Date
Commissioning and Decommissioning of
Powder River Basin Coal Mine
This unit process provides a summary of relevant input and output flows associated with the commissioning (installation and opening) and decommissioning (closing and removal) of a surface mine for Powder River Basin subbituminous coal. Relevant input and output flows include diesel requirements for machinery and associated combustion emissions.
1 1/2010
Diesel, Production, Transport, and Refining
This unit process provides a summary of relevant input and output flows associated with production of diesel including the production of crude oil, crude oil transportation, and diesel fuel refining/energy conversion. All inputs and outputs are normalized per kg of diesel.
2 9/2011

Life Cycle Analysis of Coal Exports from the Powder River Basin
A-11
Figure A-5: Assembly: Surface Coal Mine, Construction – Third-Level Plan
Table A-5: Assembly: Surface Coal Mine, Constrution
Unit Process Notes Version Version Date
PRB Coal Surface Mine Assembly, Construction
This unit process provides a summary of the quantities of each piece of equipment required to extract and produce coal at a large surface mine in the Powder River Basin region. The number of each piece of equipment is based on equipment life expectancy, length of the study period, and amount of coal produced. The construction data for individual pieces of equipment is evaluated in the child plans listed below. All inputs and outputs are normalized per 1 piece of Powder River Basin coal surface mine per kg of coal produced.
1 2/2010
Figure A-6: Blasthole Drill, Construction – Fourth-level Plan

Life Cycle Analysis of Coal Exports from the Powder River Basin
A-12
Table A-6: Blasthole Drill, Construction
Unit Process Notes Version Version Date
Steel Blast Furnace (BF) Plate, Manufacturing Third-party data available from the Steel Recycling Institute. N/A N/A
Blasthole Drill, 250,000 lbs, Construction
This unit process provides a summary of the amount of steel plate required for the construction of a blasthole drill (e.g., 1 piece [pcs] of blasthole drill, 250,000 lbs). For the purposes of this analysis, the blasthole drill is assumed to be comprised entirely of steel plate, with other materials being negligible. The number of drills required to produce coal on a large surface mine with a dragline is evaluated in PRB Coal Surface Mine Assembly, Construction. All inputs and outputs are normalized per pcs of blasthole drill.
1 2/2010
Figure A-7: Coal Loading Silo, Construction – Fourth-level Plan
Table A-7: Coal Loading Silo, Construction
Unit Process Notes Version Version Date
Steel Cold Rolled Coil
Third-party data available from thinkstep.
GUID: E4DECB5D-6711-42AA-86E9-03204B518AC3
Last change: System, 11/1/2012
N/A N/A
Coal-Loading Silo, 12,000 Tons, Powder River Basin
(PRB), Construction
This unit process provides a summary of the amount of steel plate and concrete required for the construction of a loading silo, which holds Powder River Basin sub-bituminous coal, releasing it during train loading. The number of silos required for train loading of Powder River Basin sub-
1 2/2010

Life Cycle Analysis of Coal Exports from the Powder River Basin
A-13
bituminous coal is evaluated in PRB Coal Surface Mine Assembly, Construction. All inputs and outputs are normalized per piece of coal loading silo, 12,000 tons, Powder River Basin
Concrete Ready-Mix, Production
This unit process provides a summary of relevant input and output flows associated with the production of ready-mix concrete.
1 6/2013
Figure A-8: Conveyor System, Construction – Fourth-level Plan

Life Cycle Analysis of Coal Exports from the Powder River Basin
A-14
Table A-8: Conveyor System, Construction
Unit Process Notes Version Version Date
Hot-dip Galvanized Third-party data available from the Steel Recycling Institute N/A N/A
Styrene-Butadiene Rubber (SBR) Mix
Third-party data available from thinkstep.
GUID: 9B317E5C-A721-4912-BB28-06BD6B6FB9F
Last change: System, 11/1/2012
N/A N/A
Steel Cold Rolled Coil
Third-party data available from thinkstep.
GUID: E4DECB5D-6711-42AA-86E9-03204B518AC3
Last change: System, 11/1/2012
N/A N/A
Steel-Cord Conveyor System, 72", Construction
This unit process provides a summary of the amount of materials required for the construction of a single steel-cord conveyor system, 72" wide, used for the carrying of coal at a Powder River Basin sub-bituminous coal mine. The number of conveyor systems required to transport coal is evaluated in PRB Coal Surface Mine Assembly, Construction. All inputs and outputs are normalized per piece of steel-cord conveyor system, 72".
1 2/2010
Figure A-9: Coal Loader, Construction – Fourth-level Plan
Table A-9: Coal Loader, Construction
Unit Process Notes Version Version Date
Steel Blast Furnace (BF) Plate, Manufacturing Third-party data available from the Steel Recycling Institute. N/A N/A
Track Loader, 239 Horsepower (HP),
Construction
This unit process provides a summary of the amount of steel required for the construction of a track loader used to scrape and push unconsolidated overburden at a large surface mine.. The number of loaders required to scrape and move overburden is evaluated in PRB Coal Surface Mine Assembly, Construction. This unit process provides construction data only for a single loader.
1 2/2010

Life Cycle Analysis of Coal Exports from the Powder River Basin
A-15
Figure A-10: Dragline, Construction – Fourth-level Plan
Table A-10: Dragline, Construction
Unit Process Notes Version Version Date
Steel Blast Furnace (BF) Plate, Manufacturing Third-party data available from the Steel Recycling Institute. N/A N/A
Dragline, 8,200 ton, Construction
This unit process provides a summary of the amount of steel plate required for the construction of a dragline (e.g., 1 piece [pcs] of dragline, 8,200 tons). The dragline is assumed to be comprised entirely of steel plate, with other materials being negligible. The number of draglines required to produce coal at a surface mine is evaluated in PRB Coal Surface Mine Assembly, Construction. All inputs and outputs are normalized per pcs of dragline.
1 2/2010
Figure A-11: Mining Truck, Construction – Fourth-level Plan
Table A-11: Mining Truck, Construction
Unit Process Notes Version Version Date
Styrene-Butadiene Rubber (SBR) Mix
Third-party data available from thinkstep.
GUID: 9B317E5C-A721-4912-BB28-06BD6B6FB9F
Last change: System, 11/1/2012
N/A N/A

Life Cycle Analysis of Coal Exports from the Powder River Basin
A-16
Unit Process Notes Version Version Date
Steel Blast Furnace (BF) Plate, Manufacturing Third-party data available from the Steel Recycling Institute. N/A N/A
Mining Truck for Surface Mine, 623,690 kg,
Construction
This unit process provides a summary of the amount of steel plate and styrene-butadiene-rubber required for the construction of a mining truck (e.g., 1 piece [pcs] of mining truck, 623,690 kg). For the purposes of this analysis, the mining truck is assumed to be comprised of steel plate and styrene-butadiene-rubber, with other materials being negligible. The number of mining trucks required to produce coal is evaluated in PRB Coal Surface Mine Assembly, Construction. All inputs and outputs are normalized per piece of mining truck.
1 2/2010
Figure A-12: Electric Shovel, Construction – Fourth-level Plan
Table A-12: Electric Shovel, Construction
Unit Process Notes Version Version Date
Steel Blast Furnace (BF) Plate, Manufacturing Third-party data available from the Steel Recycling Institute. N/A N/A
Electric Shovel, 120 tons payload, Construction
This unit process provides a summary of the amount of steel required for the construction of an electric shovel (e.g., 1 piece [pcs] of shovel) needed to move overburden and extract coal at a large surface mine, and to load the coal into a truck for transport at the mine site. The electric shovel is assumed to consist entirely of steel plate. The number of shovels required to move overburden and extract coal is evaluated in PRB Coal Surface Mine Assembly, Construction. All inputs and outputs are normalized per pcs of electric shovel, 120 tons payload.
1 2/2010
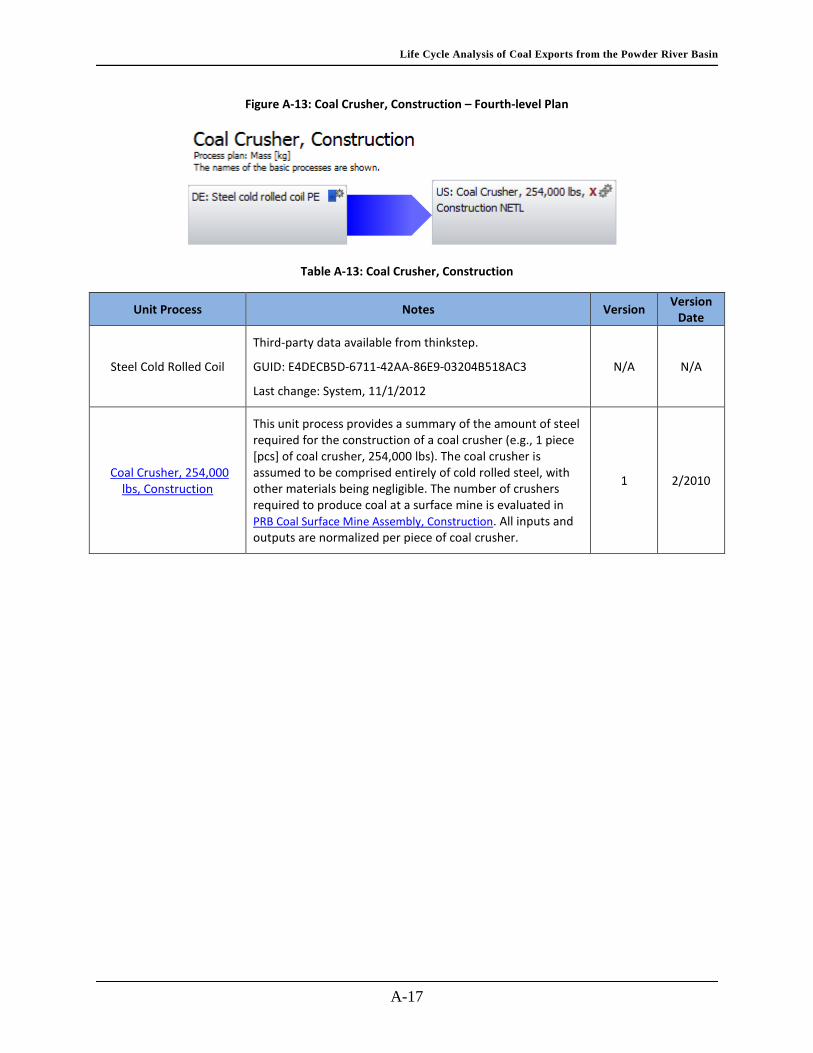
Life Cycle Analysis of Coal Exports from the Powder River Basin
A-17
Figure A-13: Coal Crusher, Construction – Fourth-level Plan
Table A-13: Coal Crusher, Construction
Unit Process Notes Version Version Date
Steel Cold Rolled Coil
Third-party data available from thinkstep.
GUID: E4DECB5D-6711-42AA-86E9-03204B518AC3
Last change: System, 11/1/2012
N/A N/A
Coal Crusher, 254,000 lbs, Construction
This unit process provides a summary of the amount of steel required for the construction of a coal crusher (e.g., 1 piece [pcs] of coal crusher, 254,000 lbs). The coal crusher is assumed to be comprised entirely of cold rolled steel, with other materials being negligible. The number of crushers required to produce coal at a surface mine is evaluated in PRB Coal Surface Mine Assembly, Construction. All inputs and outputs are normalized per piece of coal crusher.
1 2/2010

Life Cycle Analysis of Coal Exports from the Powder River Basin
A-18
Figure A-14: Surface Coal Mine – Coal Exports – Overburden Removal – Second-Level Plan
Table A-14: Surface Coal Mine – Coal Exports – Overburden Removal
Unit Process Notes Version Version Date
US: Ammonium nitrate PE
Third-party data available from thinkstep.
GUID: CADF4ACF-0724-478B-88DC-08B459EFC5F9
Last change: System, 11/1/2012
N/A N/A
Light Fuel Oil at Refinery Third-party data available from thinkstep.
GUID: 18ED02B4-CF73-44DE-9C3D-D8A234666939
Last change: System, 11/1/2012
N/A N/A
Electricity, NETL Grid Mix Explorer Tool
The goal of the Grid Mix Explorer is to allow the user to customize the makeup of their electricity grid specific to their life cycle case or desired scenario and generate a life cycle inventory for that particular mix of technologies. For this project, mixes in Table 4-2 were used.
1 1/2015
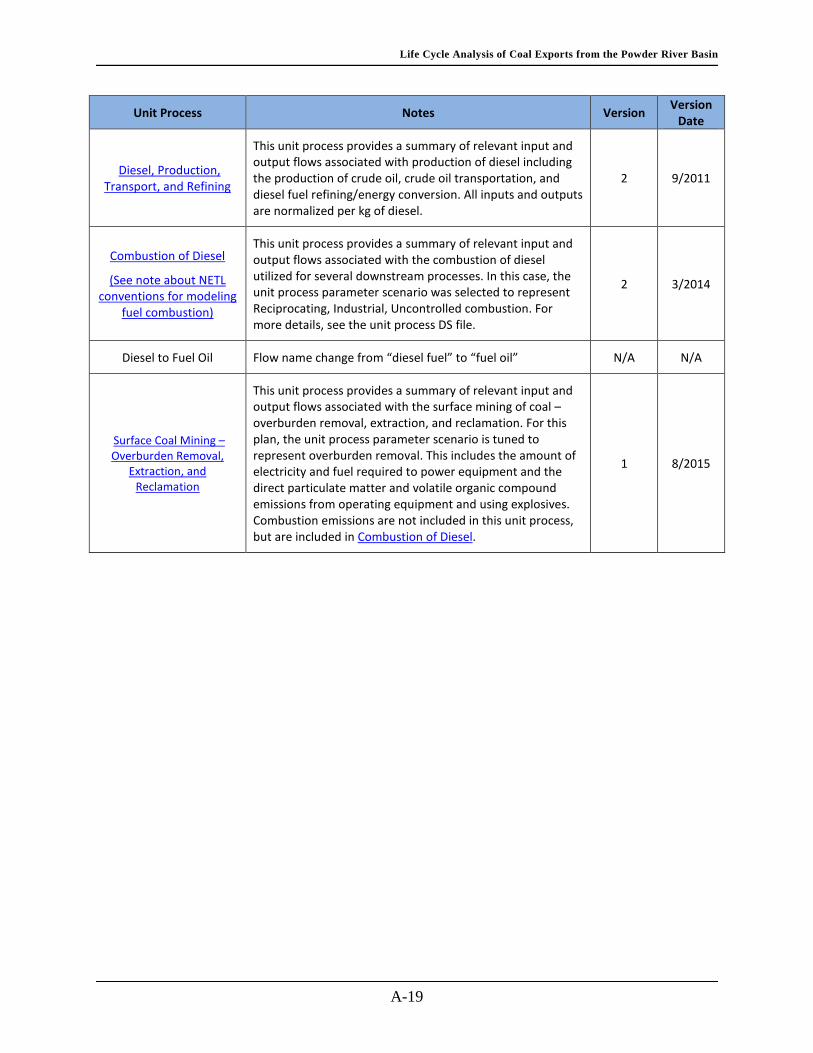
Life Cycle Analysis of Coal Exports from the Powder River Basin
A-19
Unit Process Notes Version Version Date
Diesel, Production, Transport, and Refining
This unit process provides a summary of relevant input and output flows associated with production of diesel including the production of crude oil, crude oil transportation, and diesel fuel refining/energy conversion. All inputs and outputs are normalized per kg of diesel.
2 9/2011
Combustion of Diesel
(See note about NETL conventions for modeling
fuel combustion)
This unit process provides a summary of relevant input and output flows associated with the combustion of diesel utilized for several downstream processes. In this case, the unit process parameter scenario was selected to represent Reciprocating, Industrial, Uncontrolled combustion. For more details, see the unit process DS file.
2 3/2014
Diesel to Fuel Oil Flow name change from “diesel fuel” to “fuel oil” N/A N/A
Surface Coal Mining – Overburden Removal,
Extraction, and Reclamation
This unit process provides a summary of relevant input and output flows associated with the surface mining of coal – overburden removal, extraction, and reclamation. For this plan, the unit process parameter scenario is tuned to represent overburden removal. This includes the amount of electricity and fuel required to power equipment and the direct particulate matter and volatile organic compound emissions from operating equipment and using explosives. Combustion emissions are not included in this unit process, but are included in Combustion of Diesel.
1 8/2015

Life Cycle Analysis of Coal Exports from the Powder River Basin
A-20
Figure A-15: Surface Coal Mine – Coal Exports – Coal Extraction – Second-Level Plan
Table A-15: Surface Coal Mine – Coal Exports – Coal Extraction
Unit Process Notes Version Version Date
US: Ammonium nitrate PE
Third-party data available from thinkstep.
GUID: CADF4ACF-0724-478B-88DC-08B459EFC5F9
Last change: System, 11/1/2012
N/A N/A
Light Fuel Oil at Refinery Third-party data available from thinkstep.
GUID: 18ED02B4-CF73-44DE-9C3D-D8A234666939
Last change: System, 11/1/2012
N/A N/A

Life Cycle Analysis of Coal Exports from the Powder River Basin
A-21
Unit Process Notes Version Version Date
Electricity, NETL Grid Mix Explorer Tool
The goal of the Grid Mix Explorer is to allow the user to customize the makeup of their electricity grid specific to their life cycle case or desired scenario and generate a life cycle inventory for that particular mix of technologies. For this project, mixes in Table 4-2 were used.
1 1/2015
Coal Mine Methane Emissions
This unit process provides a summary of relevant input and output flows associated with coal mine methane emissions. An option is provided to capture a percentage of the total methane produced, but there are no burdens associated with capturing the methane. All vented methane is assumed to be in too low a concentration to be directly flared. The reference flow of this unit process is: 1 kg of extracted coal.
1 7/2013
Natural Gas Venting and Flaring
The scope of this unit process covers flaring and venting in support of natural gas extraction activities. In this case, this process is used to approximate the venting and flaring of coal mine methane. The process is based on the reference flow of 1 kg of natural gas, vented or flared.
2 4/2011
Diesel, Production, Transport, and Refining
This unit process provides a summary of relevant input and output flows associated with production of diesel including the production of crude oil, crude oil transportation, and diesel fuel refining/energy conversion. All inputs and outputs are normalized per kg of diesel.
2 9/2011
Combustion of Diesel
(See note about NETL conventions for modeling
fuel combustion)
This unit process provides a summary of relevant input and output flows associated with the combustion of diesel utilized for several downstream processes. In this case, the unit process parameter scenario was selected to represent Reciprocating, Industrial, Uncontrolled combustion. For more details, see the unit process DS file.
2 3/2014
Diesel to Fuel Oil Flow name change from “diesel fuel” to “fuel oil” N/A N/A
Surface Coal Mining – Overburden Removal,
Extraction, and Reclamation
This unit process provides a summary of relevant input and output flows associated with the surface mining of coal – overburden removal, extraction, and reclamation. For this plan, the unit process parameter scenario is tuned to represent coal extraction. This includes the amount of electricity and fuel required to power equipment and the direct particulate matter and volatile organic compound emissions from operating equipment and using explosives. Combustion emissions are not included in this unit process, but are included in Combustion of Diesel.
1 8/2015

Life Cycle Analysis of Coal Exports from the Powder River Basin
A-22
Figure A-16: Surface Coal Mine – Coal Exports – Mine Reclamation – Second-Level Plan
Table A-16: Surface Coal Mine – Coal Exports – Mine Reclamation
Unit Process Notes Version Version Date
US: Ammonium nitrate PE
Third-party data available from thinkstep.
GUID: CADF4ACF-0724-478B-88DC-08B459EFC5F9
Last change: System, 11/1/2012
N/A N/A
Light Fuel Oil at Refinery Third-party data available from thinkstep.
GUID: 18ED02B4-CF73-44DE-9C3D-D8A234666939
Last change: System, 11/1/2012
N/A N/A
Electricity, NETL Grid Mix Explorer Tool
The goal of the Grid Mix Explorer is to allow the user to customize the makeup of their electricity grid specific to their life cycle case or desired scenario and generate a life cycle inventory for that particular mix of technologies. For this project, mixes in Table 4-2 were used.
1 1/2015
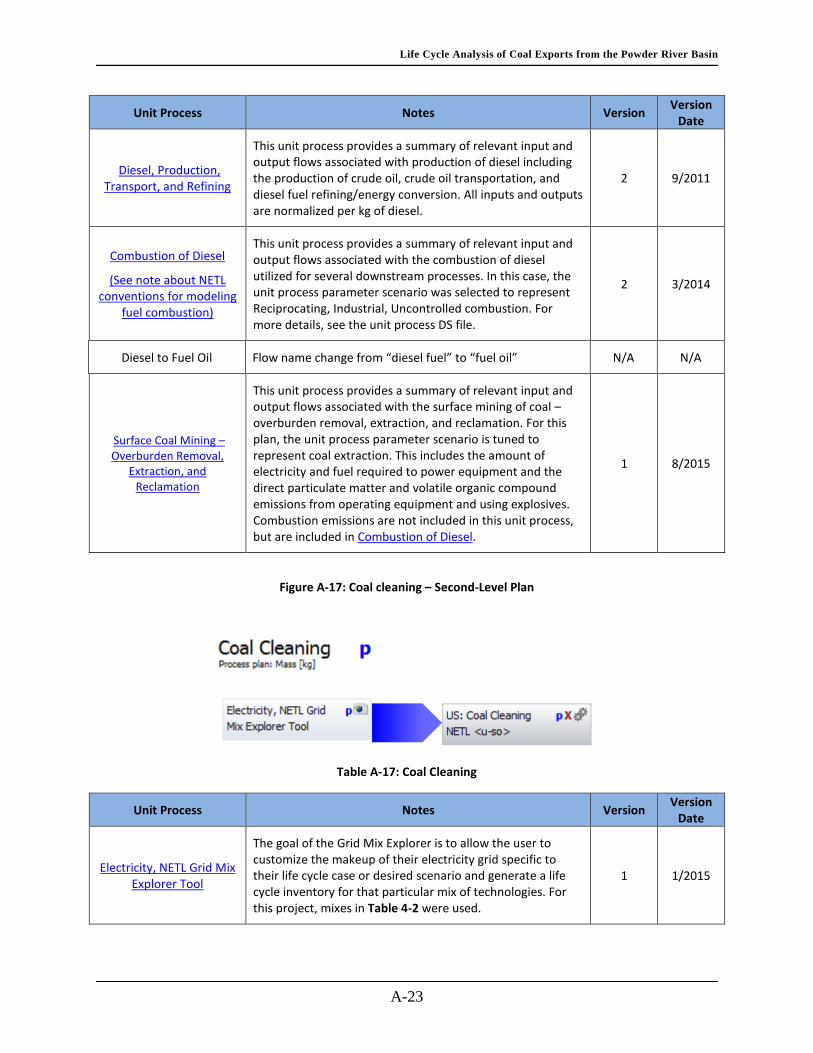
Life Cycle Analysis of Coal Exports from the Powder River Basin
A-23
Unit Process Notes Version Version Date
Diesel, Production, Transport, and Refining
This unit process provides a summary of relevant input and output flows associated with production of diesel including the production of crude oil, crude oil transportation, and diesel fuel refining/energy conversion. All inputs and outputs are normalized per kg of diesel.
2 9/2011
Combustion of Diesel
(See note about NETL conventions for modeling
fuel combustion)
This unit process provides a summary of relevant input and output flows associated with the combustion of diesel utilized for several downstream processes. In this case, the unit process parameter scenario was selected to represent Reciprocating, Industrial, Uncontrolled combustion. For more details, see the unit process DS file.
2 3/2014
Diesel to Fuel Oil Flow name change from “diesel fuel” to “fuel oil” N/A N/A
Surface Coal Mining – Overburden Removal,
Extraction, and Reclamation
This unit process provides a summary of relevant input and output flows associated with the surface mining of coal – overburden removal, extraction, and reclamation. For this plan, the unit process parameter scenario is tuned to represent coal extraction. This includes the amount of electricity and fuel required to power equipment and the direct particulate matter and volatile organic compound emissions from operating equipment and using explosives. Combustion emissions are not included in this unit process, but are included in Combustion of Diesel.
1 8/2015
Figure A-17: Coal cleaning – Second-Level Plan
Table A-17: Coal Cleaning
Unit Process Notes Version Version Date
Electricity, NETL Grid Mix Explorer Tool
The goal of the Grid Mix Explorer is to allow the user to customize the makeup of their electricity grid specific to their life cycle case or desired scenario and generate a life cycle inventory for that particular mix of technologies. For this project, mixes in Table 4-2 were used.
1 1/2015
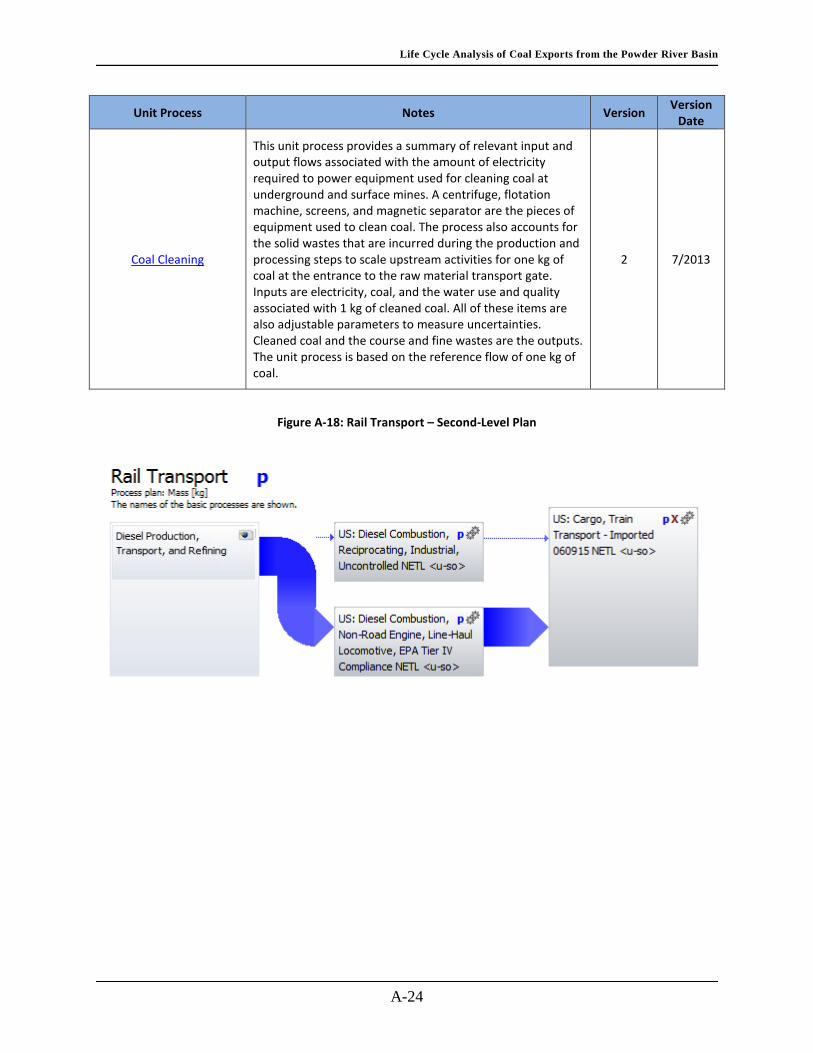
Life Cycle Analysis of Coal Exports from the Powder River Basin
A-24
Unit Process Notes Version Version Date
Coal Cleaning
This unit process provides a summary of relevant input and output flows associated with the amount of electricity required to power equipment used for cleaning coal at underground and surface mines. A centrifuge, flotation machine, screens, and magnetic separator are the pieces of equipment used to clean coal. The process also accounts for the solid wastes that are incurred during the production and processing steps to scale upstream activities for one kg of coal at the entrance to the raw material transport gate. Inputs are electricity, coal, and the water use and quality associated with 1 kg of cleaned coal. All of these items are also adjustable parameters to measure uncertainties. Cleaned coal and the course and fine wastes are the outputs. The unit process is based on the reference flow of one kg of coal.
2 7/2013
Figure A-18: Rail Transport – Second-Level Plan

Life Cycle Analysis of Coal Exports from the Powder River Basin
A-25
Table A-18: Rail Transport
Unit Process Notes Version Version Date
Diesel, Production, Transport, and Refining
This unit process provides a summary of relevant input and output flows associated with production of diesel including the production of crude oil, crude oil transportation, and diesel fuel refining/energy conversion. Available adjustable parameters and their default values are provided inthis unit process.
2 9/2011
Combustion of Diesel
(See note about NETL conventions for modeling
fuel combustion)
This unit process provides a summary of relevant input and output flows associated with the combustion of diesel utilized for several downstream processes. In this case, the unit process parameter scenario was selected to represent Reciprocating, Industrial, Uncontrolled combustion. For more details, see the unit process DS file.
2 3/2014
Cargo, Train Transport
This unit process provides the fuel input to transport generic cargo a given distance by train. The actual combustion of fuel occurs in an upstream process, and because this process is for generic cargo, it does not account for product losses. Combustion emissions are not included in this unit process, but are included in Combustion of Diesel.
1 12/2013
Figure A-19: Truck Transport – Second-Level Plan

Life Cycle Analysis of Coal Exports from the Powder River Basin
A-26
Table A-19: Truck Transport
Unit Process Notes Version Version Date
Diesel, Production, Transport, and Refining
This unit process provides a summary of relevant input and output flows associated with production of diesel including the production of crude oil, crude oil transportation, and diesel fuel refining/energy conversion. Available adjustable parameters and their default values are provided in this unit process.
2 9/2011
Combustion of Diesel
(See note about NETL conventions for modeling
fuel combustion)
This unit process provides a summary of relevant input and output flows associated with the combustion of diesel utilized for several downstream processes. In this case the unit process parameter scenario was selected to represent combustion in a mobile source (truck). For more details, see the unit process DS file.
2 3/2014
Tractor-tanker transport
This unit process provides the fuel input to transport generic cargo a given distance by a tractor-tanker. This process was used as a proxy for coal transport via tractor-trailer. Combustion emissions are not included in this unit process, but are included in Combustion of Diesel.
1 12/2013
Figure A-20: Barge Transport – Second-Level Plan
Table A-20: Barge Transport
Unit Process Notes Version Version Date
Diesel, Production, Transport, and Refining
This unit process provides a summary of relevant input and output flows associated with production of diesel including the production of crude oil, crude oil transportation, and diesel fuel refining/energy conversion. Available adjustable parameters and their default values are provided in this unit process.
2 9/2011

Life Cycle Analysis of Coal Exports from the Powder River Basin
A-27
Unit Process Notes Version Version Date
Combustion of Diesel
(See note about NETL conventions for modeling
fuel combustion)
This unit process provides a summary of relevant input and output flows associated with the combustion of diesel utilized for several downstream processes. In this case, the process was tuned to represent combustion in a category 2 marine vessel for both marine distillate and marine residual oil.
2 3/2014
Tug and Barge Transport
This unit process provides a summary of relevant input and output flows associated with the transport of an unspecified type of cargo by tug and barge. This process can be used regardless of the type of cargo being transported or the location where the transport is taking place. Combustion emissions are not included in this unit process, but are included in Combustion of Diesel.
1 11/2013
Figure A-21: Ocean Freighter Transport – Second-Level Plan
Table A-21: Ocean Freighter Transport
Unit Process Notes Version Version Date
Diesel, Production, Transport, and Refining
This unit process provides a summary of relevant input and output flows associated with production of diesel including the production of crude oil, crude oil transportation, and diesel fuel refining/energy conversion. Available adjustable parameters and their default values are provided in this unit process.
2 9/2011
Combustion of Diesel
(See note about NETL conventions for modeling
fuel combustion)
This unit process provides a summary of relevant input and output flows associated with the combustion of diesel utilized for several downstream processes. In this case, the process was tuned to represent combustion in a category 3 marine vessel for both marine distillate and marine residual oil.
2 3/2014

Life Cycle Analysis of Coal Exports from the Powder River Basin
A-28
Unit Process Notes Version Version Date
Ocean Freighter Transport
This unit process provides a summary of relevant input and output flows associated with the transport of an unspecified type of cargo by ocean freighter. This process can be used regardless of the type of cargo being transported or the location where the transport is taking place. Combustion emissions are not included in this unit process, but are included in Combustion of Diesel.
2 7/2010
Figure A-22: PPFM CTG Model – Modified for Coal Exports – Second-level Plan

Life Cycle Analysis of Coal Exports from the Powder River Basin
A-29
Table A-22: PPFM CTG Model – Modified for Coal Exports
Unit Process Notes Version Version Date
Natural Gas, U.S. Mix 2010, Extraction and
Transport
This unit process provides a summary of relevant input and output flows associated with the extraction and processing
of natural gas and its transportation to an energy conversion facility. It includes all inputs for the raw material acquisition and raw material transportation for 1 kg of delivered natural
gas proportionally from all extraction methods.
2 5/2012
U.S. Sulphuric acid aq. (96%)
Third-party data available from thinkstep.
GUID: 1EFF2DA5-68F6-4630-8D80-ADC181B70C13
Last change: System, 11/1/2012
N/A N/A
U.S. Sodium Hydroxide (from chloride alkali
electrolysis)
Third-party data available from thinkstep.
GUID: C4E097A8-2C08-408A-AAFD-F40A81BA7DE2
Last change: System, 11/1/2012
N/A N/A
U.S. Diethanolamine
Third-party data available from thinkstep.
GUID: 894E2AB9-DA97-4357-8DFF-1306AD80D3E6
Last change: System, 11/1/2012
N/A N/A
U.S. Limestone (CaCO3; washed)
Third-party data available from thinkstep.
GUID: AC854C76-B419-49FA-A354-AFC0526F6F1E
Last change: System, 11/1/2012
N/A N/A
RER: Process Water PE
Third-party data available from thinkstep.
GUID: DB009016-338F-11DD-BD11-0800200C9A66
Last change: System, 11/1/2012
N/A N/A
PPFM – Power Plant Flexible Model
The Power Plant Flexible Model (PPFM) is an Excel-based tool that simulates coal combustion-based power plant electrical output, emissions, materials usage, and costs for a fully-configurable mix of boiler and steam plant types, feedstocks, and emissions control equipment. The technical documentation and user's guide for the model are included in the download package. PPFM is not engineered to be a consumer-level product and requires knowledge of coal combustion power plants and processes to yield reasonable results.
1 11/2013
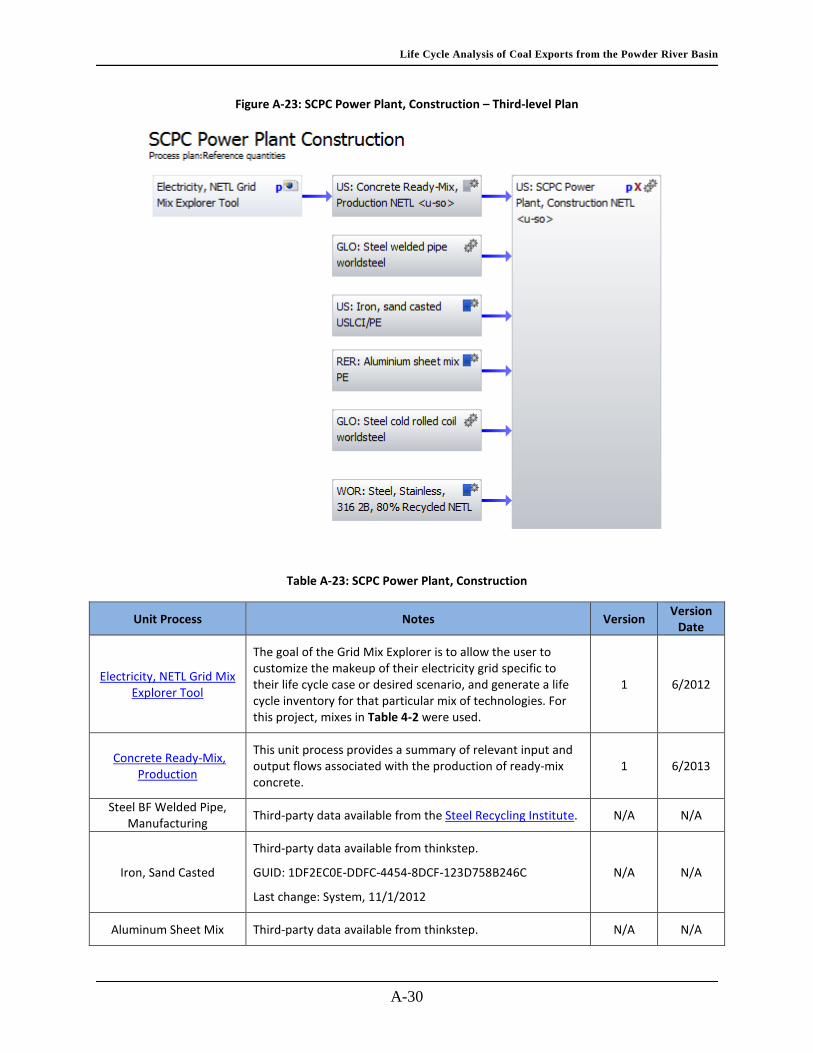
Life Cycle Analysis of Coal Exports from the Powder River Basin
A-30
Figure A-23: SCPC Power Plant, Construction – Third-level Plan
Table A-23: SCPC Power Plant, Construction
Unit Process Notes Version Version Date
Electricity, NETL Grid Mix Explorer Tool
The goal of the Grid Mix Explorer is to allow the user to customize the makeup of their electricity grid specific to their life cycle case or desired scenario, and generate a life cycle inventory for that particular mix of technologies. For this project, mixes in Table 4-2 were used.
1 6/2012
Concrete Ready-Mix, Production
This unit process provides a summary of relevant input and output flows associated with the production of ready-mix concrete.
1 6/2013
Steel BF Welded Pipe, Manufacturing Third-party data available from the Steel Recycling Institute. N/A N/A
Iron, Sand Casted
Third-party data available from thinkstep.
GUID: 1DF2EC0E-DDFC-4454-8DCF-123D758B246C
Last change: System, 11/1/2012
N/A N/A
Aluminum Sheet Mix Third-party data available from thinkstep. N/A N/A

Life Cycle Analysis of Coal Exports from the Powder River Basin
A-31
Unit Process Notes Version Version Date
GUID: 84D84DF1-4A0C-4FD8-9857-7A3F8E6FC84C
Last change: System, 11/1/2012
Steel Cold Rolled Coil
Third-party data available from thinkstep.
GUID: 5DB49085-8D9E-4F29-BD70-19C8F39899C0
Last change: System, 11/1/2012
N/A N/A
Stainless Steel 316 2B (80% Recycled), Manufacturing
Third-party data available from the Steel Recycling Institute. N/A N/A
SCPC Power Plant, Construction
This unit process provides a summary of relevant input and output flows associated with the construction of a supercritical pulverized coal power plant. This process can be used for scenarios with and without carbon capture and sequestration. Key inputs include concrete, steel, steel pipe, stainless steel, aluminum, and cast iron. The key output is one 550 MW supercritical pulverized coal power plant power plant.
2 9/2011
Figure A-24: Ammonia Production, No CO2 Capture – Third-level Plan

Life Cycle Analysis of Coal Exports from the Powder River Basin
A-32
Table A-24: Ammonia Production, No CO2 Capture
Unit Process Notes Version Version Date
Natural Gas, U.S. Mix 2010, Extraction and
Transport
This unit process provides a summary of relevant input and output flows associated with the extraction and processing of natural gas and its transportation to an energy conversion facility. All inputs and outputs are normalized per kg of natural gas delivered for the purpose of providing the energy required for steam production.
2 5/2012
Natural gas combustion in an auxiliary boiler
This unit process provides a summary of relevant input and output flows associated with the combustion of natural gas in a boiler. The only input to this unit process is natural gas. Air emissions include greenhouse gas emission and criteria air pollutants. All inputs and outputs are normalized per kg of natural gas combustion.
1 9/2010
CO2 Captured from Ammonia Production
This unit process provides a summary of relevant input and output flows associated with ammonia production. This process is modified to render captured CO2 an emission, rather than an intermediate flow.
1 12/2012
Figure A-25: Fly Ash Disposal – Second-level Plan
Table A-25: Fly Ash Disposal
Unit Process Notes Version Version Date
Diesel, Production, Transport, and Refining
This unit process provides a summary of relevant input and output flows associated with production of diesel including the production of crude oil, crude oil transportation, and diesel fuel refining/energy conversion. All inputs and outputs are normalized per kg of diesel.
2 9/2011
Combustion of Diesel
This unit process provides a summary of relevant input and output flows associated with the combustion of diesel utilized for several downstream processes. In this case, the process was tuned to represent combustion in a mobile source (truck).
2 3/2014
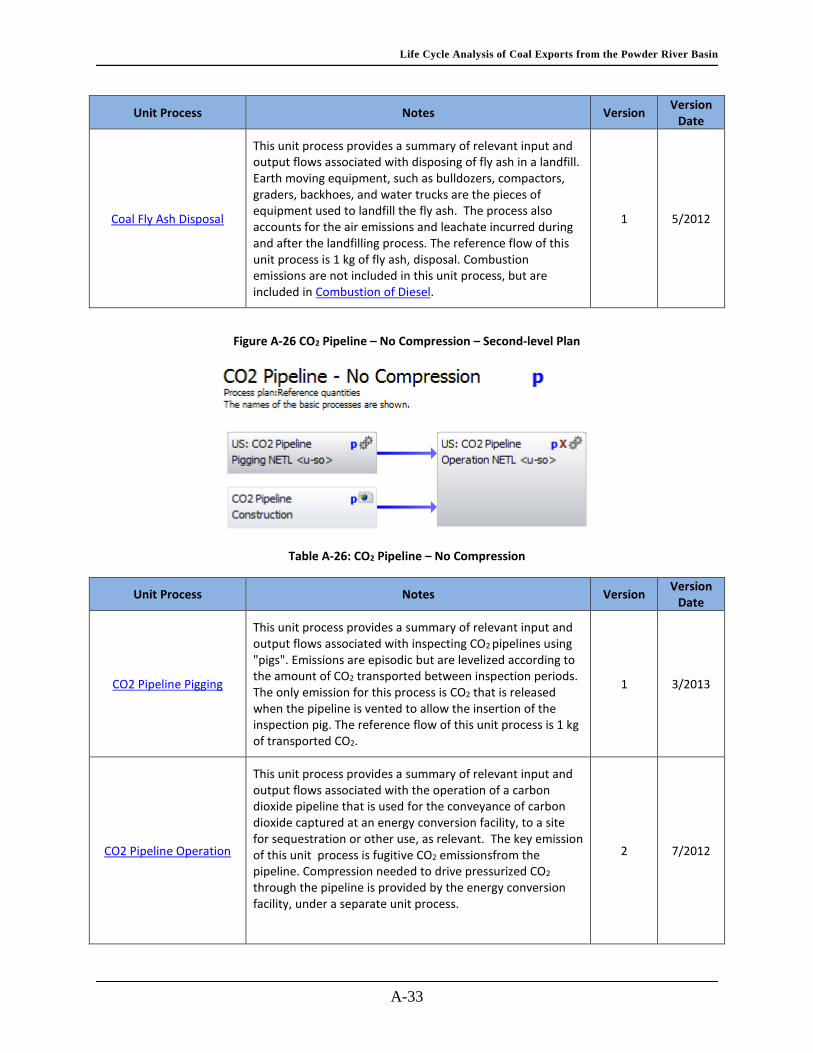
Life Cycle Analysis of Coal Exports from the Powder River Basin
A-33
Unit Process Notes Version Version Date
Coal Fly Ash Disposal
This unit process provides a summary of relevant input and output flows associated with disposing of fly ash in a landfill. Earth moving equipment, such as bulldozers, compactors, graders, backhoes, and water trucks are the pieces of equipment used to landfill the fly ash. The process also accounts for the air emissions and leachate incurred during and after the landfilling process. The reference flow of this unit process is 1 kg of fly ash, disposal. Combustion emissions are not included in this unit process, but are included in Combustion of Diesel.
1 5/2012
Figure A-26 CO2 Pipeline – No Compression – Second-level Plan
Table A-26: CO2 Pipeline – No Compression
Unit Process Notes Version Version Date
CO2 Pipeline Pigging
This unit process provides a summary of relevant input and output flows associated with inspecting CO2 pipelines using "pigs". Emissions are episodic but are levelized according to the amount of CO2 transported between inspection periods. The only emission for this process is CO2 that is released when the pipeline is vented to allow the insertion of the inspection pig. The reference flow of this unit process is 1 kg of transported CO2.
1 3/2013
CO2 Pipeline Operation
This unit process provides a summary of relevant input and output flows associated with the operation of a carbon dioxide pipeline that is used for the conveyance of carbon dioxide captured at an energy conversion facility, to a site for sequestration or other use, as relevant. The key emission of this unit process is fugitive CO2 emissionsfrom the pipeline. Compression needed to drive pressurized CO2
through the pipeline is provided by the energy conversion facility, under a separate unit process.
2 7/2012

Life Cycle Analysis of Coal Exports from the Powder River Basin
A-34
Figure A-27 CO2 Pipeline Construction – Third-level Plan
Table A-27: CO2 Pipeline Construction
Unit Process Notes Version Version Date
Steel BF Welded Pipe, Manufacturing Third-party data available from the Steel Recycling Institute. N/A N/A
CO2 Pipeline Construction
This unit process provides a summary of relevant input and output flows associated with the construction of a CO2 pipeline. It includes scaling equations based on the relationships between distance, flow rate, and pipeline diameter. It includes parameters for pipeline tortuosity and extra materials for valves and other pipeline equipment.
The tracked input is steel used for pipeline construction. The reference flow of this unit process is the construction of a CO2 pipeline.
1 10/2012
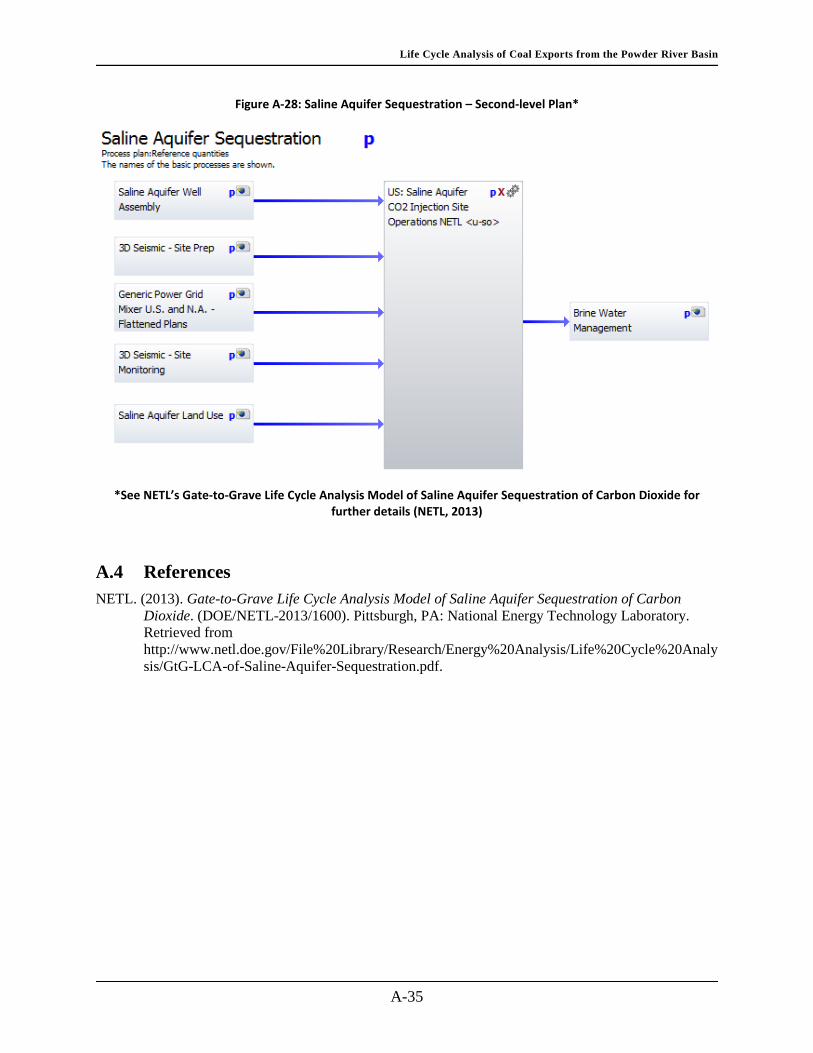
Life Cycle Analysis of Coal Exports from the Powder River Basin
A-35
Figure A-28: Saline Aquifer Sequestration – Second-level Plan*
*See NETL’s Gate-to-Grave Life Cycle Analysis Model of Saline Aquifer Sequestration of Carbon Dioxide for
further details (NETL, 2013)
A.4 References NETL. (2013). Gate-to-Grave Life Cycle Analysis Model of Saline Aquifer Sequestration of Carbon
Dioxide. (DOE/NETL-2013/1600). Pittsburgh, PA: National Energy Technology Laboratory. Retrieved from http://www.netl.doe.gov/File%20Library/Research/Energy%20Analysis/Life%20Cycle%20Analysis/GtG-LCA-of-Saline-Aquifer-Sequestration.pdf.

This page intentionally left blank.

Life Cycle Analysis of Coal Exports from the Powder River Basin
B-1
Appendix B: GHG and Non-GHG Emissions Data for the Life Cycle Analysis of
Coal Exports from the Powder River Basin
Tables Table B-1: Summary of GHG Results – AR5 100-yr GWP (kg CO2e/MWh) ........................... B-3 Table B-2: PRB Coal to Japan Drilldown GHG Results – AR5 100-yr GWP (kg CO2e/MWh)1B-4 Table B-3: PRB Coal to South Korea Drilldown GHG Results – AR5 100-yr GWP (kg
CO2e/MWh)1 ....................................................................................................................... B-5 Table B-4: PRB Coal to Taiwan Drilldown GHG Results – AR5 100-yr GWP (kg
CO2e/MWh)1 ....................................................................................................................... B-6 Table B-5: Australian Coal to Japan Drilldown GHG Results – AR5 100-yr GWP (kg
CO2e/MWh)1 ....................................................................................................................... B-7 Table B-6: Australian Coal to South Korea Drilldown GHG Results – AR5 100-yr GWP (kg
CO2e/MWh)1 ....................................................................................................................... B-8 Table B-7: Australian Coal to Taiwan Drilldown GHG Results – AR5 100-yr GWP (kg
CO2e/MWh)1 ....................................................................................................................... B-9 Table B-8: Indonesian (Mulia) Coal to Japan Drilldown GHG Results – AR5 100-yr GWP (kg
CO2e/MWh)1 ..................................................................................................................... B-10 Table B-9: Indonesian (Adaro) Coal to Japan Drilldown GHG Results – AR5 100-yr GWP
(kg CO2e/MWh)1 .............................................................................................................. B-11 Table B-10: Indonesian (Mulia) Coal to South Korea Drilldown GHG Results – AR5 100-yr
GWP (kg CO2e/MWh)1 ..................................................................................................... B-12 Table B-11: Indonesian (Adaro) Coal to South Korea Drilldown GHG Results – AR5 100-yr
GWP (kg CO2e/MWh)1 ..................................................................................................... B-13 Table B-12: Indonesian (Mulia) Coal to Taiwan Drilldown GHG Results – AR5 100-yr GWP
(kg CO2e/MWh)1 .............................................................................................................. B-14 Table B-13: Indonesian (Adaro) Coal to Taiwan Drilldown GHG Results – AR5 100-yr GWP
(kg CO2e/MWh)1 .............................................................................................................. B-15 Table B-14: CCS Case for PRB Coal to Japan Drilldown GHG Results – AR5 100-yr GWP
(kg CO2e/MWh)1 .............................................................................................................. B-16 Table B-15: CCS Case for Australian Coal to Japan Drilldown GHG Results – AR5 100-yr
GWP (kg CO2e/MWh)1 ..................................................................................................... B-17 Table B-16: CCS Case for Indonesian (Mulia) Coal to Japan Drilldown GHG Results – AR5
100-yr GWP (kg CO2e/MWh)1 ......................................................................................... B-18 Table B-17: CCS Case for Indonesian (Adaro) Coal to Japan Drilldown GHG Results – AR5
100-yr GWP (kg CO2e/MWh)1 ......................................................................................... B-19 Table B-18: Summary of GHG Results – AR5 20-yr GWP (kg CO2e/MWh) ......................... B-20 Table B-19: PRB Coal to Japan Drilldown GHG Results – AR5 20-yr GWP (kg CO2e/MWh)1B-21 Table B-20: PRB Coal to South Korea Drilldown GHG Results – AR5 20-yr GWP (kg
CO2e/MWh)1 ..................................................................................................................... B-22 Table B-21: PRB Coal to Taiwan Drilldown GHG Results – AR5 20-yr GWP (kg
CO2e/MWh)1 ..................................................................................................................... B-23 Table B-22: Australian Coal to Japan Drilldown GHG Results – AR5 20-yr GWP (kg
CO2e/MWh)1 ..................................................................................................................... B-24

Life Cycle Analysis of Coal Exports from the Powder River Basin
B-2
Table B-23: Australian Coal to South Korea Drilldown GHG Results – AR5 20-yr GWP (kg CO2e/MWh)1 ..................................................................................................................... B-25
Table B-24: Australian Coal to Taiwan Drilldown GHG Results – AR5 20-yr GWP (kg CO2e/MWh)1 ..................................................................................................................... B-26
Table B-25: Indonesian (Mulia) Coal to Japan Drilldown GHG Results – AR5 20-yr GWP (kg CO2e/MWh)1 ..................................................................................................................... B-27
Table B-26: Indonesian (Adaro) Coal to Japan Drilldown GHG Results – AR5 20-yr GWP (kg CO2e/MWh)1 .............................................................................................................. B-28
Table B-27: Indonesian (Mulia) Coal to South Korea Drilldown GHG Results – AR5 20-yr GWP (kg CO2e/MWh)1 ..................................................................................................... B-29
Table B-28: Indonesian (Adaro) Coal to South Korea Drilldown GHG Results – AR5 20-yr GWP (kg CO2e/MWh)1 ..................................................................................................... B-30
Table B-29: Indonesian (Mulia) Coal to Taiwan Drilldown GHG Results – AR5 20-yr GWP (kg CO2e/MWh)1 .............................................................................................................. B-31
Table B-30: Indonesian (Adaro) Coal to Taiwan Drilldown GHG Results – AR5 20-yr GWP (kg CO2e/MWh)1 .............................................................................................................. B-32
Table B-31: TRACI 2.1 Acidification Results (kg SO2-e/MWh) ............................................. B-33 Table B-32: TRACI 2.1 Eutrophication Results (kg Nitrogen-e/MWh) .................................. B-33 Table B-33: TRACI 2.1 Human Health Particulate Results (kg PM2.5-e/MWh) ...................... B-34 Table B-34: TRACI 2.1 Smog (kg O3-e/MWh) ....................................................................... B-34
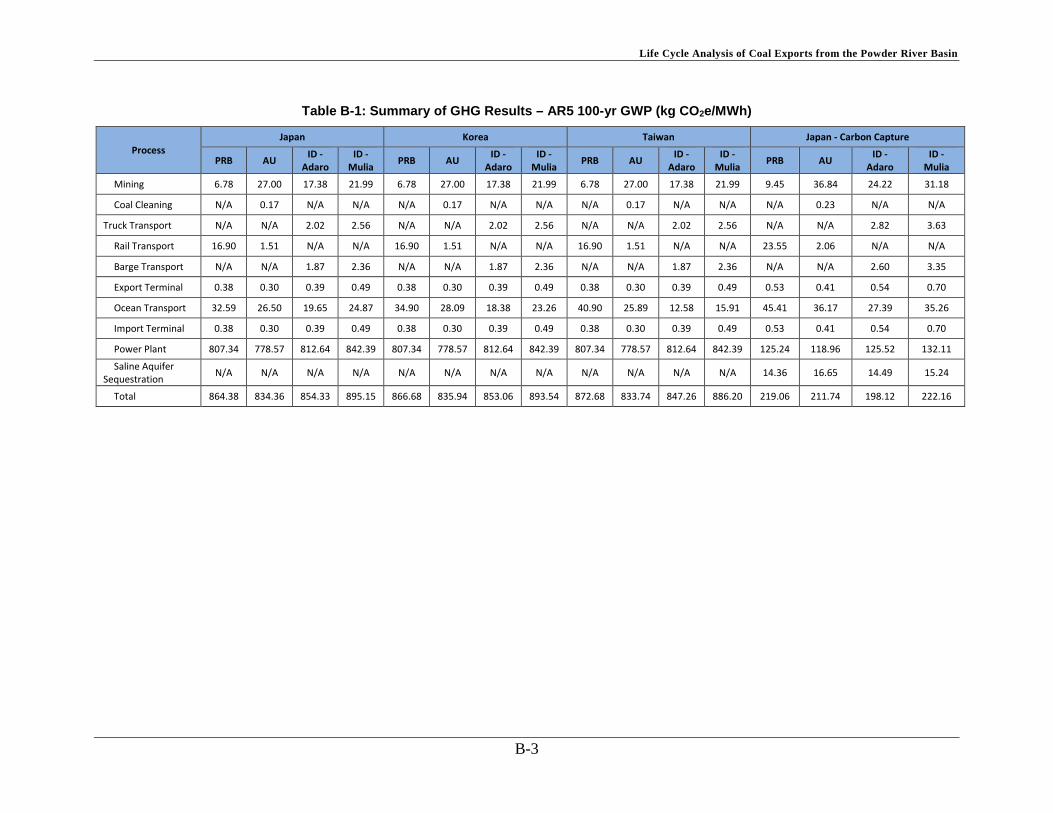
Life Cycle Analysis of Coal Exports from the Powder River Basin
B-3
Table B-1: Summary of GHG Results – AR5 100-yr GWP (kg CO2e/MWh)
Process Japan Korea Taiwan Japan - Carbon Capture
PRB AU ID - Adaro
ID - Mulia PRB AU ID -
Adaro ID -
Mulia PRB AU ID - Adaro
ID - Mulia PRB AU ID -
Adaro ID -
Mulia
Mining 6.78 27.00 17.38 21.99 6.78 27.00 17.38 21.99 6.78 27.00 17.38 21.99 9.45 36.84 24.22 31.18
Coal Cleaning N/A 0.17 N/A N/A N/A 0.17 N/A N/A N/A 0.17 N/A N/A N/A 0.23 N/A N/A
Truck Transport N/A N/A 2.02 2.56 N/A N/A 2.02 2.56 N/A N/A 2.02 2.56 N/A N/A 2.82 3.63
Rail Transport 16.90 1.51 N/A N/A 16.90 1.51 N/A N/A 16.90 1.51 N/A N/A 23.55 2.06 N/A N/A
Barge Transport N/A N/A 1.87 2.36 N/A N/A 1.87 2.36 N/A N/A 1.87 2.36 N/A N/A 2.60 3.35
Export Terminal 0.38 0.30 0.39 0.49 0.38 0.30 0.39 0.49 0.38 0.30 0.39 0.49 0.53 0.41 0.54 0.70
Ocean Transport 32.59 26.50 19.65 24.87 34.90 28.09 18.38 23.26 40.90 25.89 12.58 15.91 45.41 36.17 27.39 35.26
Import Terminal 0.38 0.30 0.39 0.49 0.38 0.30 0.39 0.49 0.38 0.30 0.39 0.49 0.53 0.41 0.54 0.70
Power Plant 807.34 778.57 812.64 842.39 807.34 778.57 812.64 842.39 807.34 778.57 812.64 842.39 125.24 118.96 125.52 132.11
Saline Aquifer Sequestration N/A N/A N/A N/A N/A N/A N/A N/A N/A N/A N/A N/A 14.36 16.65 14.49 15.24
Total 864.38 834.36 854.33 895.15 866.68 835.94 853.06 893.54 872.68 833.74 847.26 886.20 219.06 211.74 198.12 222.16

Life Cycle Analysis of Coal Exports from the Powder River Basin
B-4
Table B-2: PRB Coal to Japan Drilldown GHG Results – AR5 100-yr GWP (kg CO2e/MWh)1
Stage Process 1 Process 2 Pollutant
CO₂ CH₄ N₂O SF₆ Total
Energy Conversion
Fly Ash Disposal Fuel Combustion 9.10E-02 1.11E-04 1.07E-04 0.00E+00 9.12E-02 Fuel Upstream 1.95E-02 4.56E-03 1.17E-04 3.97E-08 2.41E-02
Power Plant
Stack Emissions 8.00E+02 0.00E+00 0.00E+00 0.00E+00 8.00E+02 Plant Auxiliary
Inputs 4.99E+00 6.18E-01 2.10E-02 2.76E-05 5.62E+00
Plant Construction 1.11E+00 8.83E-02 1.86E-03 8.49E-04 1.20E+00
Transport
Processing Import Terminal 3.82E-01 0.00E+00 0.00E+00 0.00E+00 3.82E-01
Ocean Fuel Combustion 2.56E+01 1.52E-02 3.77E-01 0.00E+00 2.60E+01 Fuel Upstream 5.32E+00 1.25E+00 3.20E-02 1.08E-05 6.60E+00
Processing Export Terminal 3.82E-01 0.00E+00 0.00E+00 0.00E+00 3.82E-01
Rail Fuel Combustion 1.34E+01 1.94E-02 3.14E-02 0.00E+00 1.35E+01 Fuel Upstream 2.76E+00 6.48E-01 1.66E-02 5.64E-06 3.43E+00
Coal Mining
Mine Reclamation Fuel Combustion 1.39E-01 2.01E-04 3.25E-04 0.00E+00 1.39E-01 Fuel Upstream 2.86E-02 6.70E-03 1.72E-04 5.83E-08 3.55E-02
Coal Extraction
Fuel Combustion 2.37E-01 3.43E-04 5.53E-04 0.00E+00 2.37E-01 Ammonium Nitrate
Upstream 1.62E-01 8.80E-03 2.29E-01 9.14E-10 4.01E-01
Electricity Upstream 1.71E-01 1.27E-02 7.86E-04 1.05E-03 1.86E-01
Fuel Upstream 4.75E-02 1.15E-02 2.90E-04 8.81E-08 5.93E-02
Overburden Removal
Mine Methane 0.00E+00 2.19E+00 0.00E+00 0.00E+00 2.19E+00 Fuel Combustion 7.39E-01 1.07E-03 1.73E-03 0.00E+00 7.42E-01
Ammonium Nitrate Upstream 3.89E-01 2.11E-02 5.49E-01 2.19E-09 9.59E-01
Electricity Upstream 1.48E+00 1.09E-01 6.79E-03 9.08E-03 1.61E+00
Fuel Upstream 1.49E-01 3.59E-02 9.07E-04 2.83E-07 1.86E-01
Construction
Access Road Construction 8.92E-03 2.01E-03 5.29E-05 7.93E-11 1.10E-02
Equipment Manufacturing 2.92E-02 1.07E-03 2.51E-04 6.65E-06 3.05E-02
Total 8.58E+02 5.04E+00 1.27E+00 1.10E-02 8.64E+02 1 Zero values include cases of no data.

Life Cycle Analysis of Coal Exports from the Powder River Basin
B-5
Table B-3: PRB Coal to South Korea Drilldown GHG Results – AR5 100-yr GWP (kg CO2e/MWh)1
Stage Process 1 Process 2 Pollutant
CO₂ CH₄ N₂O SF₆ Total
Energy Conversion
Fly Ash Disposal Fuel Combustion 9.10E-02 1.11E-04 1.07E-04 0.00E+00 9.12E-02
Fuel Upstream 1.95E-02 4.56E-03 1.17E-04 3.97E-08 2.41E-02
Power Plant
Stack Emissions 8.00E+02 0.00E+00 0.00E+00 0.00E+00 8.00E+02 Plant Auxiliary
Inputs 4.99E+00 6.18E-01 2.10E-02 2.76E-05 5.62E+00
Plant Construction 1.11E+00 8.83E-02 1.86E-03 8.49E-04 1.20E+00
Transport
Processing Import Terminal 3.82E-01 0.00E+00 0.00E+00 0.00E+00 3.82E-01
Ocean Fuel Combustion 2.74E+01 1.62E-02 4.03E-01 0.00E+00 2.78E+01
Fuel Upstream 5.70E+00 1.33E+00 3.42E-02 1.16E-05 7.06E+00 Processing Export Terminal 3.82E-01 0.00E+00 0.00E+00 0.00E+00 3.82E-01
Rail Fuel Combustion 1.34E+01 1.94E-02 3.14E-02 0.00E+00 1.35E+01
Fuel Upstream 2.76E+00 6.48E-01 1.66E-02 5.64E-06 3.43E+00
Coal Mining
Mine Reclamation Fuel Combustion 1.39E-01 2.01E-04 3.25E-04 0.00E+00 1.39E-01
Fuel Upstream 2.86E-02 6.70E-03 1.72E-04 5.83E-08 3.55E-02
Coal Extraction
Fuel Combustion 2.37E-01 3.43E-04 5.53E-04 0.00E+00 2.37E-01 Ammonium Nitrate
Upstream 1.62E-01 8.80E-03 2.29E-01 9.14E-10 4.01E-01
Electricity Upstream 1.71E-01 1.27E-02 7.86E-04 1.05E-03 1.86E-01
Fuel Upstream 4.75E-02 1.15E-02 2.90E-04 8.81E-08 5.93E-02
Overburden Removal
Mine Methane 0.00E+00 2.19E+00 0.00E+00 0.00E+00 2.19E+00 Fuel Combustion 7.39E-01 1.07E-03 1.73E-03 0.00E+00 7.42E-01
Ammonium Nitrate Upstream 3.89E-01 2.11E-02 5.49E-01 2.19E-09 9.59E-01
Electricity Upstream 1.48E+00 1.09E-01 6.79E-03 9.08E-03 1.61E+00
Fuel Upstream 1.49E-01 3.59E-02 9.07E-04 2.83E-07 1.86E-01
Construction
Access Road Construction 8.92E-03 2.01E-03 5.29E-05 7.93E-11 1.10E-02
Equipment Manufacturing 2.92E-02 1.07E-03 2.51E-04 6.65E-06 3.05E-02
Total 8.60E+02 5.13E+00 1.30E+00 1.10E-02 8.67E+02 1 Zero values include cases of no data.

Life Cycle Analysis of Coal Exports from the Powder River Basin
B-6
Table B-4: PRB Coal to Taiwan Drilldown GHG Results – AR5 100-yr GWP (kg CO2e/MWh)1
Stage Process 1 Process 2 Pollutant
CO₂ CH₄ N₂O SF₆ Total
Energy Conversion
Fly Ash Disposal Fuel Combustion 9.10E-02 1.11E-04 1.07E-04 0.00E+00 9.12E-02 Fuel Upstream 1.95E-02 4.56E-03 1.17E-04 3.97E-08 2.41E-02
Power Plant
Stack Emissions 8.00E+02 0.00E+00 0.00E+00 0.00E+00 8.00E+02 Plant Auxiliary
Inputs 4.99E+00 6.18E-01 2.10E-02 2.76E-05 5.62E+00
Plant Construction 1.11E+00 8.83E-02 1.86E-03 8.49E-04 1.20E+00
Transport
Processing Import Terminal 3.82E-01 0.00E+00 0.00E+00 0.00E+00 3.82E-01
Ocean Fuel Combustion 3.21E+01 1.90E-02 4.73E-01 0.00E+00 3.26E+01 Fuel Upstream 6.67E+00 1.56E+00 4.01E-02 1.36E-05 8.28E+00
Processing Export Terminal 3.82E-01 0.00E+00 0.00E+00 0.00E+00 3.82E-01
Rail Fuel Combustion 1.34E+01 1.94E-02 3.14E-02 0.00E+00 1.35E+01 Fuel Upstream 2.76E+00 6.48E-01 1.66E-02 5.64E-06 3.43E+00
Coal Mining
Mine Reclamation Fuel Combustion 1.39E-01 2.01E-04 3.25E-04 0.00E+00 1.39E-01 Fuel Upstream 2.86E-02 6.70E-03 1.72E-04 5.83E-08 3.55E-02
Coal Extraction
Fuel Combustion 2.37E-01 3.43E-04 5.53E-04 0.00E+00 2.37E-01 Ammonium Nitrate
Upstream 1.62E-01 8.80E-03 2.29E-01 9.14E-10 4.01E-01
Electricity Upstream 1.71E-01 1.27E-02 7.86E-04 1.05E-03 1.86E-01
Fuel Upstream 4.75E-02 1.15E-02 2.90E-04 8.81E-08 5.93E-02
Overburden Removal
Mine Methane 0.00E+00 2.19E+00 0.00E+00 0.00E+00 2.19E+00 Fuel Combustion 7.39E-01 1.07E-03 1.73E-03 0.00E+00 7.42E-01
Ammonium Nitrate Upstream 3.89E-01 2.11E-02 5.49E-01 2.19E-09 9.59E-01
Electricity Upstream 1.48E+00 1.09E-01 6.79E-03 9.08E-03 1.61E+00
Fuel Upstream 1.49E-01 3.59E-02 9.07E-04 2.83E-07 1.86E-01
Construction
Access Road Construction 8.92E-03 2.01E-03 5.29E-05 7.93E-11 1.10E-02
Equipment Manufacturing 2.92E-02 1.07E-03 2.51E-04 6.65E-06 3.05E-02
Total 8.66E+02 5.36E+00 1.37E+00 1.10E-02 8.73E+02 1 Zero values include cases of no data.

Life Cycle Analysis of Coal Exports from the Powder River Basin
B-7
Table B-5: Australian Coal to Japan Drilldown GHG Results – AR5 100-yr GWP (kg CO2e/MWh)1
Stage Process 1 Process 2 Pollutant
CO₂ CH₄ N₂O SF₆ Total
Energy Conversion
Fly Ash Disposal Fuel Combustion 1.62E-01 1.98E-04 1.90E-04 0.00E+00 1.62E-01 Fuel Upstream 3.45E-02 8.09E-03 2.08E-04 7.04E-08 4.28E-02
Power Plant
Stack Emissions 7.72E+02 0.00E+00 0.00E+00 0.00E+00 7.72E+02 Plant Auxiliary
Inputs 4.86E+00 5.99E-01 2.07E-02 2.65E-05 5.48E+00
Plant Construction 1.08E+00 8.54E-02 1.80E-03 8.21E-04 1.16E+00
Transport
Processing Import Terminal 3.03E-01 0.00E+00 0.00E+00 0.00E+00 3.03E-01
Ocean Fuel Combustion 2.08E+01 1.23E-02 3.06E-01 0.00E+00 2.11E+01 Fuel Upstream 4.32E+00 1.01E+00 2.60E-02 8.82E-06 5.36E+00
Processing Export Terminal 3.03E-01 0.00E+00 0.00E+00 0.00E+00 3.03E-01
Rail Fuel Combustion 1.20E+00 1.74E-03 2.81E-03 0.00E+00 1.20E+00 Fuel Upstream 2.47E-01 5.79E-02 1.49E-03 5.04E-07 3.07E-01
Coal Mining
Coal Cleaning Electricity Upstream 1.58E-01 1.01E-02 8.02E-04 6.88E-04 1.70E-01
Mine Reclamation Fuel Combustion 1.39E-01 2.01E-04 3.25E-04 0.00E+00 1.39E-01 Fuel Upstream 2.86E-02 6.70E-03 1.72E-04 5.83E-08 3.55E-02
Coal Extraction
Fuel Combustion 2.37E-01 3.43E-04 5.53E-04 0.00E+00 2.37E-01 Ammonium Nitrate
Upstream 1.62E-01 8.80E-03 2.29E-01 9.14E-10 4.01E-01
Electricity Upstream 2.43E-01 1.54E-02 1.23E-03 1.05E-03 2.60E-01
Fuel Upstream 4.75E-02 1.15E-02 2.90E-04 8.81E-08 5.93E-02
Overburden Removal
Mine Methane 0.00E+00 1.34E+01 0.00E+00 0.00E+00 1.34E+01 Fuel Combustion 2.02E+00 2.93E-03 4.73E-03 0.00E+00 2.03E+00
Ammonium Nitrate Upstream 1.17E+00 6.32E-02 1.65E+00 6.56E-09 2.88E+00
Electricity Upstream 6.29E+00 4.00E-01 3.18E-02 2.73E-02 6.75E+00
Fuel Upstream 4.47E-01 1.08E-01 2.72E-03 8.49E-07 5.57E-01
Construction
Access Road Construction 8.92E-03 2.01E-03 5.29E-05 7.93E-11 1.10E-02
Equipment Manufacturing 2.92E-02 1.07E-03 2.51E-04 6.65E-06 3.05E-02
Total 8.15E+02 1.58E+01 2.28E+00 2.99E-02 8.34E+02 1 Zero values include cases of no data.

Life Cycle Analysis of Coal Exports from the Powder River Basin
B-8
Table B-6: Australian Coal to South Korea Drilldown GHG Results – AR5 100-yr GWP (kg CO2e/MWh)1
Stage Process 1 Process 2 Pollutant
CO₂ CH₄ N₂O SF₆ Total
Energy Conversion
Fly Ash Disposal Fuel Combustion 1.62E-01 1.98E-04 1.90E-04 0.00E+00 1.62E-01
Fuel Upstream 3.45E-02 8.09E-03 2.08E-04 7.04E-08 4.28E-02
Power Plant
Stack Emissions 7.72E+02 0.00E+00 0.00E+00 0.00E+00 7.72E+02 Plant Auxiliary
Inputs 4.86E+00 5.99E-01 2.07E-02 2.65E-05 5.48E+00
Plant Construction 1.08E+00 8.54E-02 1.80E-03 8.21E-04 1.16E+00
Transport
Processing Import Terminal 3.03E-01 0.00E+00 0.00E+00 0.00E+00 3.03E-01
Ocean Fuel Combustion 2.21E+01 1.31E-02 3.25E-01 0.00E+00 2.24E+01
Fuel Upstream 4.58E+00 1.07E+00 2.76E-02 9.35E-06 5.69E+00 Processing Export Terminal 3.03E-01 0.00E+00 0.00E+00 0.00E+00 3.03E-01
Rail Fuel Combustion 1.20E+00 1.74E-03 2.81E-03 0.00E+00 1.20E+00
Fuel Upstream 2.47E-01 5.79E-02 1.49E-03 5.04E-07 3.07E-01
Coal Mining
Coal Cleaning Electricity Upstream 1.58E-01 1.01E-02 8.02E-04 6.88E-04 1.70E-01
Mine Reclamation Fuel Combustion 1.39E-01 2.01E-04 3.25E-04 0.00E+00 1.39E-01
Fuel Upstream 2.86E-02 6.70E-03 1.72E-04 5.83E-08 3.55E-02
Coal Extraction
Fuel Combustion 2.37E-01 3.43E-04 5.53E-04 0.00E+00 2.37E-01 Ammonium Nitrate
Upstream 1.62E-01 8.80E-03 2.29E-01 9.14E-10 4.01E-01
Electricity Upstream 2.43E-01 1.54E-02 1.23E-03 1.05E-03 2.60E-01
Fuel Upstream 4.75E-02 1.15E-02 2.90E-04 8.81E-08 5.93E-02
Overburden Removal
Mine Methane 0.00E+00 1.34E+01 0.00E+00 0.00E+00 1.34E+01 Fuel Combustion 2.02E+00 2.93E-03 4.73E-03 0.00E+00 2.03E+00
Ammonium Nitrate Upstream 1.17E+00 6.32E-02 1.65E+00 6.56E-09 2.88E+00
Electricity Upstream 6.29E+00 4.00E-01 3.18E-02 2.73E-02 6.75E+00
Fuel Upstream 4.47E-01 1.08E-01 2.72E-03 8.49E-07 5.57E-01
Construction
Access Road Construction 8.92E-03 2.01E-03 5.29E-05 7.93E-11 1.10E-02
Equipment Manufacturing 2.92E-02 1.07E-03 2.51E-04 6.65E-06 3.05E-02
Total 8.18E+02 1.59E+01 2.30E+00 2.99E-02 8.36E+02 1 Zero values include cases of no data.

Life Cycle Analysis of Coal Exports from the Powder River Basin
B-9
Table B-7: Australian Coal to Taiwan Drilldown GHG Results – AR5 100-yr GWP (kg CO2e/MWh)1
Stage Process 1 Process 2 Pollutant
CO₂ CH₄ N₂O SF₆ Total
Energy Conversion
Fly Ash Disposal Fuel Combustion 1.62E-01 1.98E-04 1.90E-04 0.00E+00 1.62E-01 Fuel Upstream 3.45E-02 8.09E-03 2.08E-04 7.04E-08 4.28E-02
Power Plant
Stack Emissions 7.72E+02 0.00E+00 0.00E+00 0.00E+00 7.72E+02 Plant Auxiliary
Inputs 4.86E+00 5.99E-01 2.07E-02 2.65E-05 5.48E+00
Plant Construction 1.08E+00 8.54E-02 1.80E-03 8.21E-04 1.16E+00
Transport
Processing Import Terminal 3.03E-01 0.00E+00 0.00E+00 0.00E+00 3.03E-01
Ocean Fuel Combustion 2.03E+01 1.21E-02 2.99E-01 0.00E+00 2.06E+01 Fuel Upstream 4.22E+00 9.90E-01 2.54E-02 8.61E-06 5.24E+00
Processing Export Terminal 3.03E-01 0.00E+00 0.00E+00 0.00E+00 3.03E-01
Rail Fuel Combustion 1.20E+00 1.74E-03 2.81E-03 0.00E+00 1.20E+00 Fuel Upstream 2.47E-01 5.79E-02 1.49E-03 5.04E-07 3.07E-01
Coal Mining
Coal Cleaning Electricity Upstream 1.58E-01 1.01E-02 8.02E-04 6.88E-04 1.70E-01
Mine Reclamation Fuel Combustion 1.39E-01 2.01E-04 3.25E-04 0.00E+00 1.39E-01 Fuel Upstream 2.86E-02 6.70E-03 1.72E-04 5.83E-08 3.55E-02
Coal Extraction
Fuel Combustion 2.37E-01 3.43E-04 5.53E-04 0.00E+00 2.37E-01 Ammonium Nitrate
Upstream 1.62E-01 8.80E-03 2.29E-01 9.14E-10 4.01E-01
Electricity Upstream 2.43E-01 1.54E-02 1.23E-03 1.05E-03 2.60E-01
Fuel Upstream 4.75E-02 1.15E-02 2.90E-04 8.81E-08 5.93E-02
Overburden Removal
Mine Methane 0.00E+00 1.34E+01 0.00E+00 0.00E+00 1.34E+01 Fuel Combustion 2.02E+00 2.93E-03 4.73E-03 0.00E+00 2.03E+00
Ammonium Nitrate Upstream 1.17E+00 6.32E-02 1.65E+00 6.56E-09 2.88E+00
Electricity Upstream 6.29E+00 4.00E-01 3.18E-02 2.73E-02 6.75E+00
Fuel Upstream 4.47E-01 1.08E-01 2.72E-03 8.49E-07 5.57E-01
Construction
Access Road Construction 8.92E-03 2.01E-03 5.29E-05 7.93E-11 1.10E-02
Equipment Manufacturing 2.92E-02 1.07E-03 2.51E-04 6.65E-06 3.05E-02
Total 8.15E+02 1.58E+01 2.27E+00 2.99E-02 8.34E+02 1 Zero values include cases of no data.

Life Cycle Analysis of Coal Exports from the Powder River Basin
B-10
B-8: Indonesian (Mulia) Coal to Japan Drilldown GHG Results – AR5 100-yr GWP (kg CO2e/MWh)1
Stage Process 1 Process 2 Pollutant
CO₂ CH₄ N₂O SF₆ Total
Energy Conversion
Fly Ash Disposal Fuel Combustion 7.41E-02 9.08E-05 8.72E-05 0.00E+00 7.41E-02 Fuel Upstream 1.59E-02 3.72E-03 9.53E-05 3.23E-08 1.59E-02
Power Plant
Stack Emissions 8.35E+02 0.00E+00 0.00E+00 0.00E+00 8.35E+02 Plant Auxiliary
Inputs 5.12E+00 6.38E-01 2.07E-02 2.87E-05 5.12E+00
Plant Construction 1.16E+00 9.17E-02 1.93E-03 8.82E-04 1.16E+00
Transport
Processing Import Terminal 4.91E-01 0.00E+00 0.00E+00 0.00E+00 4.91E-01
Ocean Fuel Combustion 1.95E+01 1.16E-02 2.87E-01 0.00E+00 1.95E+01 Fuel Upstream 4.06E+00 9.51E-01 2.44E-02 8.27E-06 4.06E+00
Processing Export Terminal 4.91E-01 0.00E+00 0.00E+00 0.00E+00 4.91E-01
Barge Fuel Combustion 1.89E+00 4.43E-04 2.56E-02 0.00E+00 1.89E+00 Fuel Upstream 3.61E-01 8.46E-02 2.17E-03 7.36E-07 3.61E-01
Truck Fuel Combustion 2.02E+00 2.47E-03 2.38E-03 0.00E+00 2.02E+00 Fuel Upstream 4.32E-01 1.01E-01 2.60E-03 8.81E-07 4.32E-01
Coal Mining
Mine Reclamation Fuel Combustion 0.00E+00 0.00E+00 0.00E+00 0.00E+00 0.00E+00 Fuel Upstream 0.00E+00 0.00E+00 0.00E+00 0.00E+00 0.00E+00
Coal Extraction
Fuel Combustion 0.00E+00 0.00E+00 0.00E+00 0.00E+00 0.00E+00 Ammonium Nitrate
Upstream 5.35E-01 7.75E-04 1.25E-03 0.00E+00 5.35E-01
Fuel Upstream 1.10E-01 2.59E-02 6.63E-04 2.25E-07 1.10E-01
Overburden Removal
Mine Methane 8.44E-01 1.22E-03 1.97E-03 0.00E+00 8.44E-01 Fuel Combustion 2.09E-01 1.13E-02 2.95E-01 1.17E-09 2.09E-01
Ammonium Nitrate Upstream 0.00E+00 0.00E+00 0.00E+00 0.00E+00 0.00E+00
Fuel Upstream 1.72E-01 4.09E-02 1.04E-03 3.40E-07 1.72E-01
Construction
Access Road Construction 0.00E+00 1.12E+01 0.00E+00 0.00E+00 0.00E+00
Equipment Manufacturing 4.77E+00 6.90E-03 1.11E-02 0.00E+00 4.77E+00
Total 8.80E+02 1.35E+01 1.98E+00 9.32E-04 8.80E+02 1 Zero values include cases of no data.

Life Cycle Analysis of Coal Exports from the Powder River Basin
B-11
Table B-9: Indonesian (Adaro) Coal to Japan Drilldown GHG Results – AR5 100-yr GWP (kg CO2e/MWh)1
Stage Process 1 Process 2 Pollutant
CO₂ CH₄ N₂O SF₆ Total
Energy Conversion
Fly Ash Disposal Fuel Combustion 3.35E-02 4.10E-05 3.94E-05 0.00E+00 3.36E-02 Fuel Upstream 7.17E-03 1.68E-03 4.31E-05 1.46E-08 8.89E-03
Power Plant
Stack Emissions 8.06E+02 0.00E+00 0.00E+00 0.00E+00 8.06E+02 Plant Auxiliary
Inputs 5.01E+00 6.22E-01 2.04E-02 2.79E-05 5.65E+00
Plant Construction 1.12E+00 8.89E-02 1.87E-03 8.55E-04 1.21E+00
Transport
Processing Import Terminal 3.88E-01 0.00E+00 0.00E+00 0.00E+00 3.88E-01
Ocean Fuel Combustion 1.54E+01 9.15E-03 2.27E-01 0.00E+00 1.57E+01 Fuel Upstream 3.21E+00 7.52E-01 1.93E-02 6.54E-06 3.98E+00
Processing Export Terminal 3.88E-01 0.00E+00 0.00E+00 0.00E+00 3.88E-01
Barge Fuel Combustion 1.49E+00 3.50E-04 2.02E-02 0.00E+00 1.51E+00 Fuel Upstream 2.85E-01 6.68E-02 1.71E-03 5.81E-07 3.54E-01
Truck Fuel Combustion 1.60E+00 1.95E-03 1.88E-03 0.00E+00 1.60E+00 Fuel Upstream 3.41E-01 8.00E-02 2.05E-03 6.96E-07 4.23E-01
Coal Mining
Mine Reclamation Fuel Combustion 4.23E-01 6.13E-04 9.90E-04 0.00E+00 4.25E-01 Fuel Upstream 8.72E-02 2.04E-02 5.24E-04 1.78E-07 1.08E-01
Coal Extraction
Fuel Combustion 6.67E-01 9.66E-04 1.56E-03 0.00E+00 6.69E-01 Ammonium Nitrate
Upstream 1.65E-01 8.95E-03 2.33E-01 9.28E-10 4.07E-01
Fuel Upstream 1.36E-01 3.23E-02 8.23E-04 2.69E-07 1.69E-01
Overburden Removal
Mine Methane 0.00E+00 8.88E+00 0.00E+00 0.00E+00 8.88E+00 Fuel Combustion 3.77E+00 5.45E-03 8.80E-03 0.00E+00 3.78E+00
Ammonium Nitrate Upstream 7.24E-01 3.92E-02 1.02E+00 4.07E-09 1.79E+00
Fuel Upstream 7.94E-01 1.88E-01 4.80E-03 1.58E-06 9.87E-01
Construction
Access Road Construction 9.07E-03 2.05E-03 5.37E-05 8.06E-11 1.12E-02
Equipment Manufacturing 2.96E-02 1.08E-03 2.55E-04 6.76E-06 3.10E-02
Total 8.42E+02 1.08E+01 1.57E+00 9.00E-04 8.54E+02 1 Zero values include cases of no data.

Life Cycle Analysis of Coal Exports from the Powder River Basin
B-12
Table B-10: Indonesian (Mulia) Coal to South Korea Drilldown GHG Results – AR5 100-yr GWP (kg CO2e/MWh)1
Stage Process 1 Process 2 Pollutant
CO₂ CH₄ N₂O SF₆ Total
Energy Conversion
Fly Ash Disposal Fuel Combustion 7.41E-02 9.08E-05 8.72E-05 0.00E+00 7.43E-02
Fuel Upstream 1.59E-02 3.72E-03 9.53E-05 3.23E-08 1.97E-02
Power Plant
Stack Emissions 8.35E+02 0.00E+00 0.00E+00 0.00E+00 8.35E+02 Plant Auxiliary
Inputs 5.12E+00 6.38E-01 2.07E-02 2.87E-05 5.78E+00
Plant Construction 1.16E+00 9.17E-02 1.93E-03 8.82E-04 1.25E+00
Transport
Processing Import Terminal 4.91E-01 0.00E+00 0.00E+00 0.00E+00 4.91E-01
Ocean Fuel Combustion 1.83E+01 1.08E-02 2.69E-01 0.00E+00 1.85E+01
Fuel Upstream 3.80E+00 8.90E-01 2.28E-02 7.74E-06 4.71E+00 Processing Export Terminal 4.91E-01 0.00E+00 0.00E+00 0.00E+00 4.91E-01
Barge Fuel Combustion 1.89E+00 4.43E-04 2.56E-02 0.00E+00 1.92E+00
Fuel Upstream 3.61E-01 8.46E-02 2.17E-03 7.36E-07 4.48E-01
Truck Fuel Combustion 2.02E+00 2.47E-03 2.38E-03 0.00E+00 2.02E+00
Fuel Upstream 4.32E-01 1.01E-01 2.60E-03 8.81E-07 5.36E-01
Coal Mining
Mine Reclamation Fuel Combustion 5.35E-01 7.75E-04 1.25E-03 0.00E+00 5.37E-01
Fuel Upstream 1.10E-01 2.59E-02 6.63E-04 2.25E-07 1.37E-01
Coal Extraction
Fuel Combustion 8.44E-01 1.22E-03 1.97E-03 0.00E+00 8.47E-01 Ammonium Nitrate
Upstream 2.09E-01 1.13E-02 2.95E-01 1.17E-09 5.15E-01
Fuel Upstream 1.72E-01 4.09E-02 1.04E-03 3.40E-07 2.14E-01
Overburden Removal
Mine Methane 0.00E+00 1.12E+01 0.00E+00 0.00E+00 1.12E+01 Fuel Combustion 4.77E+00 6.90E-03 1.11E-02 0.00E+00 4.79E+00
Ammonium Nitrate Upstream 9.16E-01 4.97E-02 1.29E+00 5.15E-09 2.26E+00
Fuel Upstream 1.01E+00 2.38E-01 6.07E-03 2.00E-06 1.25E+00
Construction
Access Road Construction 1.15E-02 2.59E-03 6.80E-05 1.02E-10 1.41E-02
Equipment Manufacturing 3.75E-02 1.37E-03 3.23E-04 8.56E-06 3.92E-02
Total 8.78E+02 1.34E+01 1.96E+00 9.31E-04 8.93E+02 1 Zero values include cases of no data.

Life Cycle Analysis of Coal Exports from the Powder River Basin
B-13
Table B-11: Indonesian (Adaro) Coal to South Korea Drilldown GHG Results – AR5 100-yr GWP (kg CO2e/MWh)1
Stage Process 1 Process 2 Pollutant
CO₂ CH₄ N₂O SF₆ Total
Energy Conversion
Fly Ash Disposal Fuel Combustion 3.35E-02 4.10E-05 3.94E-05 0.00E+00 3.36E-02
Fuel Upstream 7.17E-03 1.68E-03 4.31E-05 1.46E-08 8.89E-03
Power Plant
Stack Emissions 8.06E+02 0.00E+00 0.00E+00 0.00E+00 8.06E+02 Plant Auxiliary
Inputs 5.01E+00 6.22E-01 2.04E-02 2.79E-05 5.65E+00
Plant Construction 1.12E+00 8.89E-02 1.87E-03 8.55E-04 1.21E+00
Transport
Processing Import Terminal 3.88E-01 0.00E+00 0.00E+00 0.00E+00 3.88E-01
Ocean Fuel Combustion 1.44E+01 8.56E-03 2.12E-01 0.00E+00 1.47E+01
Fuel Upstream 3.00E+00 7.03E-01 1.80E-02 6.12E-06 3.72E+00 Processing Export Terminal 3.88E-01 0.00E+00 0.00E+00 0.00E+00 3.88E-01
Barge Fuel Combustion 1.49E+00 3.50E-04 2.02E-02 0.00E+00 1.51E+00
Fuel Upstream 2.85E-01 6.68E-02 1.71E-03 5.81E-07 3.54E-01
Truck Fuel Combustion 1.60E+00 1.95E-03 1.88E-03 0.00E+00 1.60E+00
Fuel Upstream 3.41E-01 8.00E-02 2.05E-03 6.96E-07 4.23E-01
Coal Mining
Mine Reclamation Fuel Combustion 3.35E-02 4.10E-05 3.94E-05 0.00E+00 3.36E-02
Fuel Upstream 7.17E-03 1.68E-03 4.31E-05 1.46E-08 8.89E-03
Coal Extraction
Fuel Combustion 8.06E+02 0.00E+00 0.00E+00 0.00E+00 8.06E+02 Ammonium Nitrate
Upstream 5.01E+00 6.22E-01 2.04E-02 2.79E-05 5.65E+00
Fuel Upstream 1.36E-01 3.23E-02 8.23E-04 2.69E-07 1.69E-01
Overburden Removal
Mine Methane 0.00E+00 8.88E+00 0.00E+00 0.00E+00 8.88E+00 Fuel Combustion 3.77E+00 5.45E-03 8.80E-03 0.00E+00 3.78E+00
Ammonium Nitrate Upstream 7.24E-01 3.92E-02 1.02E+00 4.07E-09 1.79E+00
Fuel Upstream 7.94E-01 1.88E-01 4.80E-03 1.58E-06 9.87E-01
Construction
Access Road Construction 9.07E-03 2.05E-03 5.37E-05 8.06E-11 1.12E-02
Equipment Manufacturing 2.96E-02 1.08E-03 2.55E-04 6.76E-06 3.10E-02
Total 8.41E+02 1.08E+01 1.55E+00 8.99E-04 8.53E+02 1 Zero values include cases of no data.

Life Cycle Analysis of Coal Exports from the Powder River Basin
B-14
Table B-12: Indonesian (Mulia) Coal to Taiwan Drilldown GHG Results – AR5 100-yr GWP (kg CO2e/MWh)1
Stage Process 1 Process 2 Pollutant
CO₂ CH₄ N₂O SF₆ Total
Energy Conversion
Fly Ash Disposal Fuel Combustion 7.41E-02 9.08E-05 8.72E-05 0.00E+00 7.43E-02
Fuel Upstream 1.59E-02 3.72E-03 9.53E-05 3.23E-08 1.97E-02
Power Plant
Stack Emissions 8.35E+02 0.00E+00 0.00E+00 0.00E+00 8.35E+02 Plant Auxiliary
Inputs 5.12E+00 6.38E-01 2.07E-02 2.87E-05 5.78E+00
Plant Construction 1.16E+00 9.17E-02 1.93E-03 8.82E-04 1.25E+00
Transport
Processing Import Terminal 4.91E-01 0.00E+00 0.00E+00 0.00E+00 4.91E-01
Ocean Fuel Combustion 1.25E+01 7.41E-03 1.84E-01 0.00E+00 1.27E+01
Fuel Upstream 2.60E+00 6.09E-01 1.56E-02 5.30E-06 3.22E+00 Processing Export Terminal 4.91E-01 0.00E+00 0.00E+00 0.00E+00 4.91E-01
Barge Fuel Combustion 1.89E+00 4.43E-04 2.56E-02 0.00E+00 1.92E+00
Fuel Upstream 3.61E-01 8.46E-02 2.17E-03 7.36E-07 4.48E-01
Truck Fuel Combustion 2.02E+00 2.47E-03 2.38E-03 0.00E+00 2.02E+00
Fuel Upstream 4.32E-01 1.01E-01 2.60E-03 8.81E-07 5.36E-01
Coal Mining
Mine Reclamation Fuel Combustion 5.35E-01 7.75E-04 1.25E-03 0.00E+00 5.37E-01
Fuel Upstream 1.10E-01 2.59E-02 6.63E-04 2.25E-07 1.37E-01
Coal Extraction
Fuel Combustion 8.44E-01 1.22E-03 1.97E-03 0.00E+00 8.47E-01 Ammonium Nitrate
Upstream 2.09E-01 1.13E-02 2.95E-01 1.17E-09 5.15E-01
Fuel Upstream 1.72E-01 4.09E-02 1.04E-03 3.40E-07 2.14E-01
Overburden Removal
Mine Methane 0.00E+00 1.12E+01 0.00E+00 0.00E+00 1.12E+01 Fuel Combustion 4.77E+00 6.90E-03 1.11E-02 0.00E+00 4.79E+00
Ammonium Nitrate Upstream 9.16E-01 4.97E-02 1.29E+00 5.15E-09 2.26E+00
Fuel Upstream 1.01E+00 2.38E-01 6.07E-03 2.00E-06 1.25E+00
Construction
Access Road Construction 1.15E-02 2.59E-03 6.80E-05 1.02E-10 1.41E-02
Equipment Manufacturing 3.75E-02 1.37E-03 3.23E-04 8.56E-06 3.92E-02
Total 8.71E+02 1.32E+01 1.87E+00 9.29E-04 8.86E+02 1 Zero values include cases of no data.

Life Cycle Analysis of Coal Exports from the Powder River Basin
B-15
Table B-13: Indonesian (Adaro) Coal to Taiwan Drilldown GHG Results – AR5 100-yr GWP (kg CO2e/MWh)1
Stage Process 1 Process 2 Pollutant
CO₂ CH₄ N₂O SF₆ Total
Energy Conversion
Fly Ash Disposal Fuel Combustion 3.35E-02 4.10E-05 3.94E-05 0.00E+00 3.36E-02
Fuel Upstream 7.17E-03 1.68E-03 4.31E-05 1.46E-08 8.89E-03
Power Plant
Stack Emissions 8.06E+02 0.00E+00 0.00E+00 0.00E+00 8.06E+02 Plant Auxiliary
Inputs 5.01E+00 6.22E-01 2.04E-02 2.79E-05 5.65E+00
Plant Construction 1.12E+00 8.89E-02 1.87E-03 8.55E-04 1.21E+00
Transport
Processing Import Terminal 3.88E-01 0.00E+00 0.00E+00 0.00E+00 3.88E-01
Ocean Fuel Combustion 9.88E+00 5.85E-03 1.45E-01 0.00E+00 1.00E+01
Fuel Upstream 2.05E+00 4.81E-01 1.23E-02 4.18E-06 2.55E+00 Processing Export Terminal 3.88E-01 0.00E+00 0.00E+00 0.00E+00 3.88E-01
Barge Fuel Combustion 1.49E+00 3.50E-04 2.02E-02 0.00E+00 1.51E+00
Fuel Upstream 2.85E-01 6.68E-02 1.71E-03 5.81E-07 3.54E-01
Truck Fuel Combustion 1.60E+00 1.95E-03 1.88E-03 0.00E+00 1.60E+00
Fuel Upstream 3.41E-01 8.00E-02 2.05E-03 6.96E-07 4.23E-01
Coal Mining
Mine Reclamation Fuel Combustion 4.23E-01 6.13E-04 9.90E-04 0.00E+00 4.25E-01
Fuel Upstream 8.72E-02 2.04E-02 5.24E-04 1.78E-07 1.08E-01
Coal Extraction
Fuel Combustion 6.67E-01 9.66E-04 1.56E-03 0.00E+00 6.69E-01 Ammonium Nitrate
Upstream 1.65E-01 8.95E-03 2.33E-01 9.28E-10 4.07E-01
Fuel Upstream 1.36E-01 3.23E-02 8.23E-04 2.69E-07 1.69E-01
Overburden Removal
Mine Methane 0.00E+00 8.88E+00 0.00E+00 0.00E+00 8.88E+00 Fuel Combustion 3.77E+00 5.45E-03 8.80E-03 0.00E+00 3.78E+00
Ammonium Nitrate Upstream 7.24E-01 3.92E-02 1.02E+00 4.07E-09 1.79E+00
Fuel Upstream 7.94E-01 1.88E-01 4.80E-03 1.58E-06 9.87E-01
Construction
Access Road Construction 9.07E-03 2.05E-03 5.37E-05 8.06E-11 1.12E-02
Equipment Manufacturing 2.96E-02 1.08E-03 2.55E-04 6.76E-06 3.10E-02
Total 8.35E+02 1.05E+01 1.48E+00 8.97E-04 8.47E+02 1 Zero values include cases of no data.

Life Cycle Analysis of Coal Exports from the Powder River Basin
B-16
Table B-14: CCS Case for PRB Coal to Japan Drilldown GHG Results – AR5 100-yr GWP (kg CO2e/MWh)1
Stage Process 1 Process 2 Pollutant
CO₂ CH₄ N₂O SF₆ Total
CO₂ Transport and Storage
Saline Aquifer Sequestration
Site Monitoring 3.31E-03 5.91E-05 3.11E-05 1.17E-11 3.40E-03 Brine Management 3.34E-01 2.45E-02 1.53E-03 2.03E-03 3.62E-01 Injection and Site
Operations 1.21E+01 5.22E-01 3.25E-02 4.32E-02 1.27E+01
Site Prep and Construction 3.85E-02 2.09E-04 2.21E-05 9.34E-06 3.88E-02
CO₂ Pipeline Pipeline Maintenance 8.28E-01 0.00E+00 0.00E+00 0.00E+00 8.28E-01
Pipeline Operation 7.98E-02 0.00E+00 0.00E+00 0.00E+00 7.98E-02 Pipeline Construction 3.12E-01 1.19E-02 5.18E-03 0.00E+00 3.29E-01
Energy Conversion
Fly Ash Disposal Fuel Combustion 1.28E-01 1.56E-04 1.50E-04 0.00E+00 1.28E-01 Fuel Upstream 2.73E-02 6.40E-03 1.64E-04 5.57E-08 3.39E-02
Power Plant Stack Emissions 1.12E+02 0.00E+00 0.00E+00 0.00E+00 1.12E+02
Plant Auxiliary Inputs 1.03E+01 1.06E+00 5.53E-02 3.62E-05 1.15E+01 Plant Construction 1.11E+00 8.84E-02 1.86E-03 8.50E-04 1.20E+00
Transport
Processing Import Terminal 5.32E-01 0.00E+00 0.00E+00 0.00E+00 5.32E-01
Ocean Fuel Combustion 3.57E+01 2.11E-02 5.25E-01 0.00E+00 3.62E+01 Fuel Upstream 7.41E+00 1.74E+00 4.46E-02 1.51E-05 9.19E+00
Processing Export Terminal 5.32E-01 0.00E+00 0.00E+00 0.00E+00 5.32E-01
Rail Fuel Combustion 1.87E+01 2.71E-02 4.37E-02 0.00E+00 1.88E+01 Fuel Upstream 3.85E+00 9.03E-01 2.32E-02 7.85E-06 4.78E+00
Coal Mining
Mine Reclamation Fuel Combustion 1.93E-01 2.80E-04 4.52E-04 0.00E+00 1.94E-01 Fuel Upstream 3.98E-02 9.34E-03 2.40E-04 8.12E-08 4.94E-02
Coal Extraction
Fuel Combustion 3.30E-01 4.77E-04 7.71E-04 0.00E+00 3.31E-01 Ammonium Nitrate
Upstream 2.26E-01 1.23E-02 3.20E-01 1.27E-09 5.58E-01
Electricity Upstream 2.39E-01 1.77E-02 1.09E-03 1.47E-03 2.59E-01 Fuel Upstream 6.62E-02 1.61E-02 4.04E-04 1.23E-07 8.26E-02 Mine Methane 0.00E+00 3.05E+00 0.00E+00 0.00E+00 3.05E+00
Overburden Removal
Fuel Combustion 1.03E+00 1.49E-03 2.40E-03 0.00E+00 1.03E+00 Ammonium Nitrate
Upstream 5.41E-01 2.93E-02 7.65E-01 3.05E-09 1.34E+00
Electricity Upstream 2.06E+00 1.53E-01 9.46E-03 1.27E-02 2.24E+00 Fuel Upstream 2.08E-01 5.00E-02 1.26E-03 3.94E-07 2.59E-01
Construction
Access Road Construction 1.24E-02 2.81E-03 7.36E-05 1.11E-10 1.53E-02
Equipment Manufacturing 4.06E-02 1.48E-03 3.50E-04 9.27E-06 4.25E-02
Total 2.09E+02 7.75E+00 1.83E+00 6.03E-02 2.18E+02 1 Zero values include cases of no data.

Life Cycle Analysis of Coal Exports from the Powder River Basin
B-17
Table B-15: CCS Case for Australian Coal to Japan Drilldown GHG Results – AR5 100-yr GWP (kg CO2e/MWh)1
Stage Process 1 Process 2 Pollutant
CO₂ CH₄ N₂O SF₆ Total
CO₂ Transport and Storage
Saline Aquifer Sequestration
Site Monitoring 3.16E-03 5.64E-05 2.97E-05 1.12E-11 3.25E-03 Brine Management 4.46E-01 2.84E-02 2.26E-03 1.94E-03 4.78E-01 Injection and Site
Operations 1.43E+01 6.04E-01 4.80E-02 4.12E-02 1.50E+01
Site Prep and Construction 3.73E-02 2.23E-04 2.48E-05 8.92E-06 3.76E-02
CO₂ Pipeline Pipeline Maintenance 7.88E-01 0.00E+00 0.00E+00 0.00E+00 7.88E-01
Pipeline Operation 7.61E-02 0.00E+00 0.00E+00 0.00E+00 7.61E-02 Pipeline Construction 2.97E-01 1.13E-02 4.94E-03 0.00E+00 3.13E-01
Energy Conversion
Fly Ash Disposal Fuel Combustion 2.23E-01 2.73E-04 2.62E-04 0.00E+00 2.23E-01 Fuel Upstream 4.76E-02 1.12E-02 2.86E-04 9.70E-08 5.90E-02
Power Plant Stack Emissions 1.05E+02 0.00E+00 0.00E+00 0.00E+00 1.05E+02
Plant Auxiliary Inputs 1.01E+01 1.03E+00 5.52E-02 3.41E-05 1.12E+01 Plant Construction 1.05E+00 8.37E-02 1.76E-03 8.06E-04 1.14E+00
Transport
Processing Import Terminal 4.14E-01 0.00E+00 0.00E+00 0.00E+00 4.14E-01
Ocean Fuel Combustion 2.84E+01 1.68E-02 4.18E-01 0.00E+00 2.88E+01 Fuel Upstream 5.90E+00 1.38E+00 3.55E-02 1.20E-05 7.32E+00
Processing Export Terminal 4.14E-01 0.00E+00 0.00E+00 0.00E+00 4.14E-01
Rail Fuel Combustion 1.64E+00 2.37E-03 3.83E-03 0.00E+00 1.64E+00 Fuel Upstream 3.37E-01 7.91E-02 2.03E-03 6.88E-07 4.18E-01
Coal Mining
Coal Cleaning Electricity Upstream 2.16E-01 1.37E-02 1.09E-03 9.38E-04 2.32E-01
Mine Reclamation Fuel Combustion 1.89E-01 2.74E-04 4.43E-04 0.00E+00 1.90E-01 Fuel Upstream 3.90E-02 9.15E-03 2.35E-04 7.96E-08 4.84E-02
Coal Extraction
Fuel Combustion 3.23E-01 4.67E-04 7.55E-04 0.00E+00 3.24E-01 Ammonium Nitrate
Upstream 2.22E-01 1.20E-02 3.13E-01 1.25E-09 5.47E-01
Electricity Upstream 3.31E-01 2.11E-02 1.68E-03 1.44E-03 3.55E-01 Fuel Upstream 6.48E-02 1.57E-02 3.96E-04 1.20E-07 8.09E-02 Mine Methane 0.00E+00 1.83E+01 0.00E+00 0.00E+00 1.83E+01
Overburden Removal
Fuel Combustion 2.76E+00 3.99E-03 6.45E-03 0.00E+00 2.77E+00 Ammonium Nitrate
Upstream 1.59E+00 8.62E-02 2.25E+00 8.95E-09 3.92E+00
Electricity Upstream 8.58E+00 5.46E-01 4.35E-02 3.73E-02 9.21E+00 Fuel Upstream 6.10E-01 1.47E-01 3.71E-03 1.16E-06 7.60E-01
Construction
Access Road Construction 1.22E-02 2.75E-03 7.21E-05 1.08E-10 1.50E-02
Equipment Manufacturing 3.98E-02 1.45E-03 3.42E-04 9.08E-06 4.16E-02
Total 1.85E+02 2.24E+01 3.19E+00 8.36E-02 2.10E+02 1 Zero values include cases of no data.
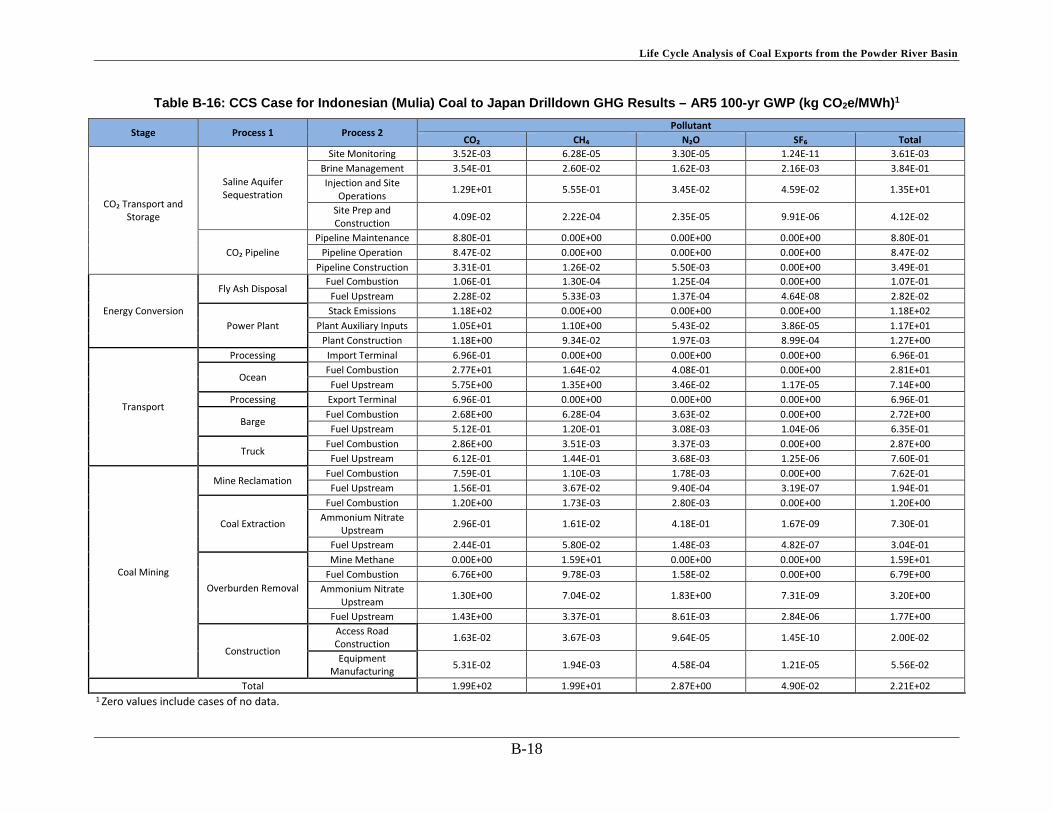
Life Cycle Analysis of Coal Exports from the Powder River Basin
B-18
Table B-16: CCS Case for Indonesian (Mulia) Coal to Japan Drilldown GHG Results – AR5 100-yr GWP (kg CO2e/MWh)1
Stage Process 1 Process 2 Pollutant
CO₂ CH₄ N₂O SF₆ Total
CO₂ Transport and Storage
Saline Aquifer Sequestration
Site Monitoring 3.52E-03 6.28E-05 3.30E-05 1.24E-11 3.61E-03 Brine Management 3.54E-01 2.60E-02 1.62E-03 2.16E-03 3.84E-01 Injection and Site
Operations 1.29E+01 5.55E-01 3.45E-02 4.59E-02 1.35E+01
Site Prep and Construction 4.09E-02 2.22E-04 2.35E-05 9.91E-06 4.12E-02
CO₂ Pipeline Pipeline Maintenance 8.80E-01 0.00E+00 0.00E+00 0.00E+00 8.80E-01
Pipeline Operation 8.47E-02 0.00E+00 0.00E+00 0.00E+00 8.47E-02 Pipeline Construction 3.31E-01 1.26E-02 5.50E-03 0.00E+00 3.49E-01
Energy Conversion
Fly Ash Disposal Fuel Combustion 1.06E-01 1.30E-04 1.25E-04 0.00E+00 1.07E-01 Fuel Upstream 2.28E-02 5.33E-03 1.37E-04 4.64E-08 2.82E-02
Power Plant Stack Emissions 1.18E+02 0.00E+00 0.00E+00 0.00E+00 1.18E+02
Plant Auxiliary Inputs 1.05E+01 1.10E+00 5.43E-02 3.86E-05 1.17E+01 Plant Construction 1.18E+00 9.34E-02 1.97E-03 8.99E-04 1.27E+00
Transport
Processing Import Terminal 6.96E-01 0.00E+00 0.00E+00 0.00E+00 6.96E-01
Ocean Fuel Combustion 2.77E+01 1.64E-02 4.08E-01 0.00E+00 2.81E+01 Fuel Upstream 5.75E+00 1.35E+00 3.46E-02 1.17E-05 7.14E+00
Processing Export Terminal 6.96E-01 0.00E+00 0.00E+00 0.00E+00 6.96E-01
Barge Fuel Combustion 2.68E+00 6.28E-04 3.63E-02 0.00E+00 2.72E+00 Fuel Upstream 5.12E-01 1.20E-01 3.08E-03 1.04E-06 6.35E-01
Truck Fuel Combustion 2.86E+00 3.51E-03 3.37E-03 0.00E+00 2.87E+00 Fuel Upstream 6.12E-01 1.44E-01 3.68E-03 1.25E-06 7.60E-01
Coal Mining
Mine Reclamation Fuel Combustion 7.59E-01 1.10E-03 1.78E-03 0.00E+00 7.62E-01 Fuel Upstream 1.56E-01 3.67E-02 9.40E-04 3.19E-07 1.94E-01
Coal Extraction
Fuel Combustion 1.20E+00 1.73E-03 2.80E-03 0.00E+00 1.20E+00 Ammonium Nitrate
Upstream 2.96E-01 1.61E-02 4.18E-01 1.67E-09 7.30E-01
Fuel Upstream 2.44E-01 5.80E-02 1.48E-03 4.82E-07 3.04E-01
Overburden Removal
Mine Methane 0.00E+00 1.59E+01 0.00E+00 0.00E+00 1.59E+01 Fuel Combustion 6.76E+00 9.78E-03 1.58E-02 0.00E+00 6.79E+00
Ammonium Nitrate Upstream 1.30E+00 7.04E-02 1.83E+00 7.31E-09 3.20E+00
Fuel Upstream 1.43E+00 3.37E-01 8.61E-03 2.84E-06 1.77E+00
Construction
Access Road Construction 1.63E-02 3.67E-03 9.64E-05 1.45E-10 2.00E-02
Equipment Manufacturing 5.31E-02 1.94E-03 4.58E-04 1.21E-05 5.56E-02
Total 1.99E+02 1.99E+01 2.87E+00 4.90E-02 2.21E+02 1 Zero values include cases of no data.

Life Cycle Analysis of Coal Exports from the Powder River Basin
B-19
Table B-17: CCS Case for Indonesian (Adaro) Coal to Japan Drilldown GHG Results – AR5 100-yr GWP (kg CO2e/MWh)1
Stage Process 1 Process 2 Pollutant
CO₂ CH₄ N₂O SF₆ Total
CO₂ Transport and Storage
Saline Aquifer Sequestration
Site Monitoring 3.34E-03 5.96E-05 3.14E-05 1.18E-11 1.97E+02 Brine Management 3.37E-01 2.48E-02 1.54E-03 2.05E-03 3.43E-03 Injection and Site
Operations 1.22E+01 5.27E-01 3.28E-02 4.36E-02 3.65E-01
Site Prep and Construction 3.89E-02 2.11E-04 2.23E-05 9.42E-06 1.28E+01
CO₂ Pipeline Pipeline Maintenance 8.36E-01 0.00E+00 0.00E+00 0.00E+00 3.91E-02
Pipeline Operation 8.05E-02 0.00E+00 0.00E+00 0.00E+00 8.36E-01 Pipeline Construction 3.14E-01 1.20E-02 5.23E-03 0.00E+00 8.05E-02
Energy Conversion
Fly Ash Disposal Fuel Combustion 4.82E-02 5.90E-05 5.67E-05 0.00E+00 3.32E-01 Fuel Upstream 1.03E-02 2.41E-03 6.19E-05 2.10E-08 4.83E-02
Power Plant Stack Emissions 1.12E+02 0.00E+00 0.00E+00 0.00E+00 1.28E-02
Plant Auxiliary Inputs 1.03E+01 1.06E+00 5.40E-02 3.65E-05 1.12E+02 Plant Construction 1.12E+00 8.90E-02 1.87E-03 8.56E-04 1.14E+01
Transport
Processing Import Terminal 5.41E-01 0.00E+00 0.00E+00 0.00E+00 1.21E+00
Ocean Fuel Combustion 2.15E+01 1.27E-02 3.17E-01 0.00E+00 5.41E-01 Fuel Upstream 4.47E+00 1.05E+00 2.69E-02 9.11E-06 2.18E+01
Processing Export Terminal 5.41E-01 0.00E+00 0.00E+00 0.00E+00 5.54E+00
Barge Fuel Combustion 2.08E+00 4.88E-04 2.82E-02 0.00E+00 5.41E-01 Fuel Upstream 3.97E-01 9.31E-02 2.39E-03 8.10E-07 2.11E+00
Truck Fuel Combustion 2.22E+00 2.72E-03 2.62E-03 0.00E+00 4.93E-01 Fuel Upstream 4.76E-01 1.12E-01 2.86E-03 9.70E-07 2.23E+00
Coal Mining
Mine Reclamation Fuel Combustion 5.90E-01 8.54E-04 1.38E-03 0.00E+00 5.92E-01 Fuel Upstream 1.21E-01 2.85E-02 7.30E-04 2.48E-07 1.51E-01
Coal Extraction
Fuel Combustion 9.29E-01 1.35E-03 2.17E-03 0.00E+00 9.33E-01 Ammonium Nitrate
Upstream 2.30E-01 1.25E-02 3.25E-01 1.29E-09 5.67E-01
Fuel Upstream 1.90E-01 4.50E-02 1.15E-03 3.74E-07 2.36E-01
Overburden Removal
Mine Methane 0.00E+00 1.24E+01 0.00E+00 0.00E+00 1.24E+01 Fuel Combustion 5.25E+00 7.60E-03 1.23E-02 0.00E+00 5.27E+00
Ammonium Nitrate Upstream 1.01E+00 5.47E-02 1.43E+00 5.68E-09 2.49E+00
Fuel Upstream 1.11E+00 2.62E-01 6.69E-03 2.20E-06 1.38E+00
Construction
Access Road Construction 1.26E-02 2.85E-03 7.49E-05 1.12E-10 1.56E-02
Equipment Manufacturing 4.13E-02 1.51E-03 3.55E-04 9.42E-06 4.32E-02
Total 1.79E+02 1.58E+01 2.25E+00 4.66E-02 1.97E+02 1 Zero values include cases of no data.

Life Cycle Analysis of Coal Exports from the Powder River Basin
B-20
Table B-18: Summary of GHG Results – AR5 20-yr GWP (kg CO2e/MWh)
Process Japan Korea Taiwan Japan - Carbon Capture
PRB AU ID - Adaro
ID - Mulia PRB AU ID -
Adaro ID -
Mulia PRB AU ID - Adaro
ID - Mulia PRB AU ID -
Adaro ID -
Mulia
Mining 10.10 46.68 30.25 38.28 10.10 46.68 30.25 38.28 10.10 46.68 30.25 38.28 14.08 63.71 42.16 54.28
Coal Cleaning N/A 0.18 N/A N/A N/A 0.18 N/A N/A N/A 0.18 N/A N/A N/A 0.25 N/A N/A
Truck Transport N/A N/A 2.14 2.71 N/A N/A 2.14 2.71 N/A N/A 2.14 2.71 N/A N/A 2.98 3.84
Rail Transport 17.84 1.60 N/A N/A 17.84 1.60 N/A N/A 17.84 1.60 N/A N/A 24.86 2.18 N/A N/A
Barge Transport N/A N/A 1.96 2.48 N/A N/A 1.96 2.48 N/A N/A 1.96 2.48 N/A N/A 2.73 3.52
Export Terminal 0.38 0.30 0.39 0.49 0.38 0.30 0.39 0.49 0.38 0.30 0.39 0.49 0.53 0.41 0.54 0.70
Ocean Transport 34.33 27.92 20.70 26.20 36.77 29.59 19.36 24.50 43.09 27.27 13.25 16.77 47.84 38.10 28.86 37.15
Import Terminal 0.38 0.30 0.39 0.49 0.38 0.30 0.39 0.49 0.38 0.30 0.39 0.49 0.53 0.41 0.54 0.70
Power Plant 808.34 779.55 813.64 843.43 808.34 779.55 813.64 843.43 808.34 779.55 813.64 843.43 126.96 120.64 127.21 133.87
Saline Aquifer Sequestration N/A N/A N/A N/A N/A N/A N/A N/A N/A N/A N/A N/A 15.13 17.55 15.27 16.07
Total 871.39 856.54 869.48 914.08 873.82 858.21 868.14 912.38 880.14 855.89 862.02 904.65 229.93 243.25 220.29 250.10

Life Cycle Analysis of Coal Exports from the Powder River Basin
B-21
Table B-19: PRB Coal to Japan Drilldown GHG Results – AR5 20-yr GWP (kg CO2e/MWh)1
Stage Process 1 Process 2 Pollutant
CO₂ CH₄ N₂O SF₆ Total
Energy Conversion
Fly Ash Disposal Fuel Combustion 9.10E-02 2.69E-04 9.62E-05 0.00E+00 9.13E-02 Fuel Upstream 1.95E-02 1.10E-02 1.05E-04 2.95E-08 3.06E-02
Power Plant
Stack Emissions 8.00E+02 0.00E+00 0.00E+00 0.00E+00 8.00E+02 Plant Auxiliary
Inputs 4.99E+00 1.49E+00 1.89E-02 2.05E-05 6.50E+00
Plant Construction 1.11E+00 2.13E-01 1.67E-03 6.32E-04 1.33E+00
Transport
Processing Import Terminal 3.82E-01 0.00E+00 0.00E+00 0.00E+00 3.82E-01
Ocean Fuel Combustion 2.56E+01 3.67E-02 3.39E-01 0.00E+00 2.60E+01 Fuel Upstream 5.32E+00 3.01E+00 2.88E-02 8.08E-06 8.36E+00
Processing Export Terminal 3.82E-01 0.00E+00 0.00E+00 0.00E+00 3.82E-01
Rail Fuel Combustion 1.34E+01 4.70E-02 2.82E-02 0.00E+00 1.35E+01 Fuel Upstream 2.76E+00 1.57E+00 1.49E-02 4.20E-06 4.35E+00
Coal Mining
Mine Reclamation Fuel Combustion 1.39E-01 4.86E-04 2.92E-04 0.00E+00 1.40E-01 Fuel Upstream 2.86E-02 1.62E-02 1.55E-04 4.34E-08 4.49E-02
Coal Extraction
Fuel Combustion 2.37E-01 8.28E-04 4.98E-04 0.00E+00 2.38E-01 Ammonium Nitrate
Upstream 1.62E-01 2.13E-02 2.06E-01 6.80E-10 3.90E-01
Electricity Upstream 1.71E-01 3.06E-02 7.07E-04 7.83E-04 2.03E-01
Fuel Upstream 4.75E-02 2.79E-02 2.61E-04 6.56E-08 7.56E-02 Mine Methane 0.00E+00 5.30E+00 0.00E+00 0.00E+00 5.30E+00
Overburden Removal
Fuel Combustion 7.39E-01 2.58E-03 1.55E-03 0.00E+00 7.43E-01 Ammonium Nitrate
Upstream 3.89E-01 5.09E-02 4.94E-01 1.63E-09 9.33E-01
Electricity Upstream 1.48E+00 2.65E-01 6.10E-03 6.77E-03 1.76E+00
Fuel Upstream 1.49E-01 8.67E-02 8.16E-04 2.11E-07 2.36E-01
Construction
Access Road Construction 8.92E-03 4.87E-03 4.75E-05 5.91E-11 1.38E-02
Equipment Manufacturing 2.92E-02 2.58E-03 2.26E-04 4.95E-06 3.20E-02
Total 8.58E+02 1.22E+01 1.14E+00 8.22E-03 8.71E+02 1 Zero values include cases of no data.

Life Cycle Analysis of Coal Exports from the Powder River Basin
B-22
Table B-20: PRB Coal to South Korea Drilldown GHG Results – AR5 20-yr GWP (kg CO2e/MWh)1
Stage Process 1 Process 2 Pollutant
CO₂ CH₄ N₂O SF₆ Total
Energy Conversion
Fly Ash Disposal Fuel Combustion 9.10E-02 2.69E-04 9.62E-05 0.00E+00 9.13E-02 Fuel Upstream 1.95E-02 1.10E-02 1.05E-04 2.95E-08 3.06E-02
Power Plant
Stack Emissions 8.00E+02 0.00E+00 0.00E+00 0.00E+00 8.00E+02 Plant Auxiliary
Inputs 4.99E+00 1.49E+00 1.89E-02 2.05E-05 6.50E+00
Plant Construction 1.11E+00 2.13E-01 1.67E-03 6.32E-04 1.33E+00
Transport
Processing Import Terminal 3.82E-01 0.00E+00 0.00E+00 0.00E+00 3.82E-01
Ocean Fuel Combustion 2.74E+01 3.93E-02 3.63E-01 0.00E+00 2.78E+01 Fuel Upstream 5.70E+00 3.23E+00 3.08E-02 8.65E-06 8.95E+00
Processing Export Terminal 3.82E-01 0.00E+00 0.00E+00 0.00E+00 3.82E-01
Rail Fuel Combustion 1.34E+01 4.70E-02 2.82E-02 0.00E+00 1.35E+01 Fuel Upstream 2.76E+00 1.57E+00 1.49E-02 4.20E-06 4.35E+00
Coal Mining
Mine Reclamation Fuel Combustion 1.39E-01 4.86E-04 2.92E-04 0.00E+00 1.40E-01 Fuel Upstream 2.86E-02 1.62E-02 1.55E-04 4.34E-08 4.49E-02
Coal Extraction
Fuel Combustion 2.37E-01 8.28E-04 4.98E-04 0.00E+00 2.38E-01 Ammonium Nitrate
Upstream 1.62E-01 2.13E-02 2.06E-01 6.80E-10 3.90E-01
Electricity Upstream 1.71E-01 3.06E-02 7.07E-04 7.83E-04 2.03E-01 Fuel Upstream 4.75E-02 2.79E-02 2.61E-04 6.56E-08 7.56E-02 Mine Methane 0.00E+00 5.30E+00 0.00E+00 0.00E+00 5.30E+00
Overburden Removal
Fuel Combustion 7.39E-01 2.58E-03 1.55E-03 0.00E+00 7.43E-01 Ammonium Nitrate
Upstream 3.89E-01 5.09E-02 4.94E-01 1.63E-09 9.33E-01
Electricity Upstream 1.48E+00 2.65E-01 6.10E-03 6.77E-03 1.76E+00 Fuel Upstream 1.49E-01 8.67E-02 8.16E-04 2.11E-07 2.36E-01
Construction
Access Road Construction 8.92E-03 4.87E-03 4.75E-05 5.91E-11 1.38E-02
Equipment Manufacturing 2.92E-02 2.58E-03 2.26E-04 4.95E-06 3.20E-02
Total 8.60E+02 1.24E+01 1.17E+00 8.22E-03 8.74E+02 1 Zero values include cases of no data.
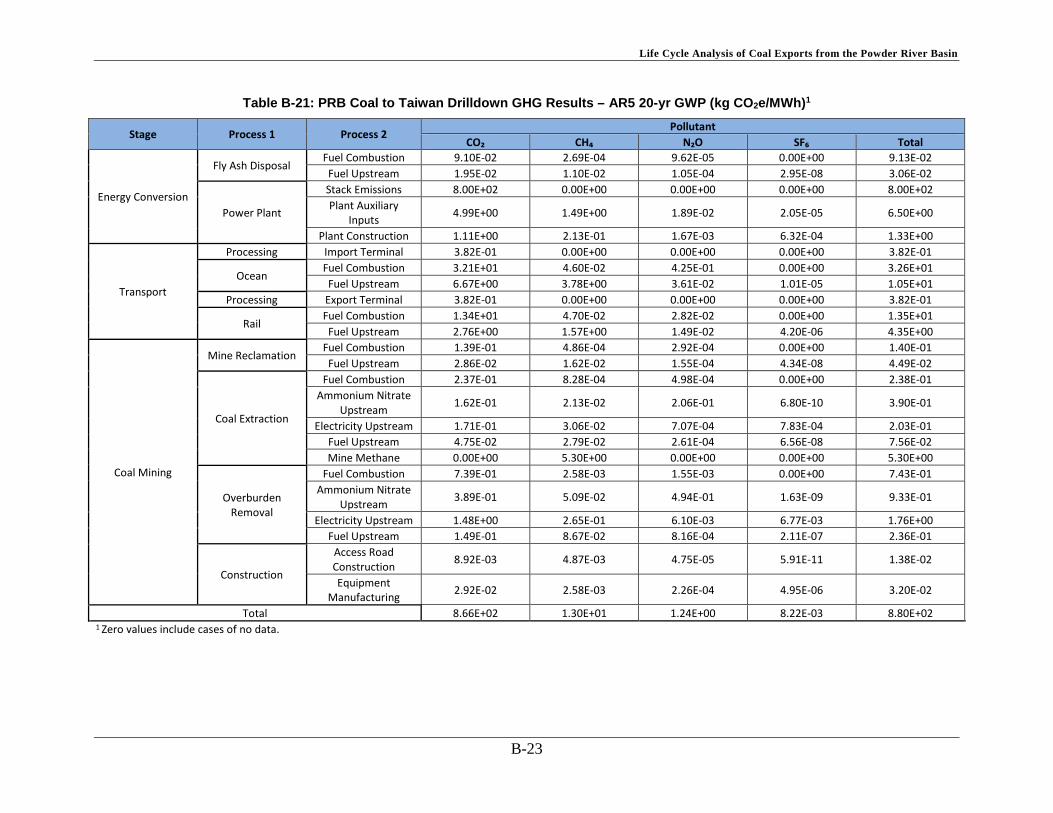
Life Cycle Analysis of Coal Exports from the Powder River Basin
B-23
Table B-21: PRB Coal to Taiwan Drilldown GHG Results – AR5 20-yr GWP (kg CO2e/MWh)1
Stage Process 1 Process 2 Pollutant
CO₂ CH₄ N₂O SF₆ Total
Energy Conversion
Fly Ash Disposal Fuel Combustion 9.10E-02 2.69E-04 9.62E-05 0.00E+00 9.13E-02 Fuel Upstream 1.95E-02 1.10E-02 1.05E-04 2.95E-08 3.06E-02
Power Plant
Stack Emissions 8.00E+02 0.00E+00 0.00E+00 0.00E+00 8.00E+02 Plant Auxiliary
Inputs 4.99E+00 1.49E+00 1.89E-02 2.05E-05 6.50E+00
Plant Construction 1.11E+00 2.13E-01 1.67E-03 6.32E-04 1.33E+00
Transport
Processing Import Terminal 3.82E-01 0.00E+00 0.00E+00 0.00E+00 3.82E-01
Ocean Fuel Combustion 3.21E+01 4.60E-02 4.25E-01 0.00E+00 3.26E+01 Fuel Upstream 6.67E+00 3.78E+00 3.61E-02 1.01E-05 1.05E+01
Processing Export Terminal 3.82E-01 0.00E+00 0.00E+00 0.00E+00 3.82E-01
Rail Fuel Combustion 1.34E+01 4.70E-02 2.82E-02 0.00E+00 1.35E+01 Fuel Upstream 2.76E+00 1.57E+00 1.49E-02 4.20E-06 4.35E+00
Coal Mining
Mine Reclamation Fuel Combustion 1.39E-01 4.86E-04 2.92E-04 0.00E+00 1.40E-01 Fuel Upstream 2.86E-02 1.62E-02 1.55E-04 4.34E-08 4.49E-02
Coal Extraction
Fuel Combustion 2.37E-01 8.28E-04 4.98E-04 0.00E+00 2.38E-01 Ammonium Nitrate
Upstream 1.62E-01 2.13E-02 2.06E-01 6.80E-10 3.90E-01
Electricity Upstream 1.71E-01 3.06E-02 7.07E-04 7.83E-04 2.03E-01 Fuel Upstream 4.75E-02 2.79E-02 2.61E-04 6.56E-08 7.56E-02 Mine Methane 0.00E+00 5.30E+00 0.00E+00 0.00E+00 5.30E+00
Overburden Removal
Fuel Combustion 7.39E-01 2.58E-03 1.55E-03 0.00E+00 7.43E-01 Ammonium Nitrate
Upstream 3.89E-01 5.09E-02 4.94E-01 1.63E-09 9.33E-01
Electricity Upstream 1.48E+00 2.65E-01 6.10E-03 6.77E-03 1.76E+00 Fuel Upstream 1.49E-01 8.67E-02 8.16E-04 2.11E-07 2.36E-01
Construction
Access Road Construction 8.92E-03 4.87E-03 4.75E-05 5.91E-11 1.38E-02
Equipment Manufacturing 2.92E-02 2.58E-03 2.26E-04 4.95E-06 3.20E-02
Total 8.66E+02 1.30E+01 1.24E+00 8.22E-03 8.80E+02 1 Zero values include cases of no data.

Life Cycle Analysis of Coal Exports from the Powder River Basin
B-24
Table B-22: Australian Coal to Japan Drilldown GHG Results – AR5 20-yr GWP (kg CO2e/MWh)1
Stage Process 1 Process 2 Pollutant
CO₂ CH₄ N₂O SF₆ Total
Energy Conversion
Fly Ash Disposal Fuel Combustion 1.62E-01 4.78E-04 1.71E-04 0.00E+00 1.62E-01 Fuel Upstream 3.45E-02 1.96E-02 1.87E-04 5.24E-08 5.43E-02
Power Plant
Stack Emissions 7.72E+02 0.00E+00 0.00E+00 0.00E+00 7.72E+02 Plant Auxiliary
Inputs 4.86E+00 1.45E+00 1.86E-02 1.98E-05 6.33E+00
Plant Construction 1.08E+00 2.06E-01 1.62E-03 6.12E-04 1.28E+00
Transport
Processing Import Terminal 3.03E-01 0.00E+00 0.00E+00 0.00E+00 3.03E-01
Ocean Fuel Combustion 2.08E+01 2.98E-02 2.75E-01 0.00E+00 2.11E+01 Fuel Upstream 4.32E+00 2.45E+00 2.34E-02 6.57E-06 6.80E+00
Processing Export Terminal 3.03E-01 0.00E+00 0.00E+00 0.00E+00 3.03E-01
Rail Fuel Combustion 1.20E+00 4.20E-03 2.52E-03 0.00E+00 1.21E+00 Fuel Upstream 2.47E-01 1.40E-01 1.34E-03 3.75E-07 3.89E-01
Coal Mining
Coal Cleaning Electricity Upstream 1.58E-01 2.43E-02 7.21E-04 5.12E-04 1.84E-01
Mine Reclamation Fuel Combustion 1.39E-01 4.86E-04 2.92E-04 0.00E+00 1.40E-01 Fuel Upstream 2.86E-02 1.62E-02 1.55E-04 4.34E-08 4.49E-02
Coal Extraction
Fuel Combustion 2.37E-01 8.28E-04 4.98E-04 0.00E+00 2.38E-01 Ammonium Nitrate
Upstream 1.62E-01 2.13E-02 2.06E-01 6.80E-10 3.90E-01
Electricity Upstream 2.43E-01 3.73E-02 1.11E-03 7.85E-04 2.82E-01
Fuel Upstream 4.75E-02 2.79E-02 2.61E-04 6.56E-08 7.56E-02 Mine Methane 0.00E+00 3.24E+01 0.00E+00 0.00E+00 3.24E+01
Overburden Removal
Fuel Combustion 2.02E+00 7.07E-03 4.25E-03 0.00E+00 2.04E+00 Ammonium Nitrate
Upstream 1.17E+00 1.53E-01 1.48E+00 4.88E-09 2.80E+00
Electricity Upstream 6.29E+00 9.67E-01 2.86E-02 2.03E-02 7.30E+00
Fuel Upstream 4.47E-01 2.60E-01 2.45E-03 6.32E-07 7.09E-01
Construction
Access Road Construction 8.92E-03 4.87E-03 4.75E-05 5.91E-11 1.38E-02
Equipment Manufacturing 2.92E-02 2.58E-03 2.26E-04 4.95E-06 3.20E-02
Total 8.16E+02 3.82E+01 2.05E+00 2.23E-02 8.56E+02 1 Zero values include cases of no data.

Life Cycle Analysis of Coal Exports from the Powder River Basin
B-25
Table B-23: Australian Coal to South Korea Drilldown GHG Results – AR5 20-yr GWP (kg CO2e/MWh)1
Stage Process 1 Process 2 Pollutant
CO₂ CH₄ N₂O SF₆ Total
Energy Conversion
Fly Ash Disposal Fuel Combustion 1.62E-01 4.78E-04 1.71E-04 0.00E+00 1.62E-01 Fuel Upstream 3.45E-02 1.96E-02 1.87E-04 5.24E-08 5.43E-02
Power Plant
Stack Emissions 7.72E+02 0.00E+00 0.00E+00 0.00E+00 7.72E+02 Plant Auxiliary
Inputs 4.86E+00 1.45E+00 1.86E-02 1.98E-05 6.33E+00
Plant Construction 1.08E+00 2.06E-01 1.62E-03 6.12E-04 1.28E+00
Transport
Processing Import Terminal 3.03E-01 0.00E+00 0.00E+00 0.00E+00 3.03E-01
Ocean Fuel Combustion 2.21E+01 3.16E-02 2.92E-01 0.00E+00 2.24E+01 Fuel Upstream 4.58E+00 2.60E+00 2.48E-02 6.96E-06 7.20E+00
Processing Export Terminal 3.03E-01 0.00E+00 0.00E+00 0.00E+00 3.03E-01
Rail Fuel Combustion 2.47E-01 1.40E-01 1.34E-03 3.75E-07 3.89E-01 Fuel Upstream 1.58E-01 2.43E-02 7.21E-04 5.12E-04 1.84E-01
Coal Mining
Coal Cleaning Electricity Upstream 1.39E-01 4.86E-04 2.92E-04 0.00E+00 1.40E-01
Mine Reclamation Fuel Combustion 2.86E-02 1.62E-02 1.55E-04 4.34E-08 4.49E-02 Fuel Upstream 2.37E-01 8.28E-04 4.98E-04 0.00E+00 2.38E-01
Coal Extraction
Fuel Combustion 1.62E-01 2.13E-02 2.06E-01 6.80E-10 3.90E-01 Ammonium Nitrate
Upstream 2.43E-01 3.73E-02 1.11E-03 7.85E-04 2.82E-01
Electricity Upstream 4.75E-02 2.79E-02 2.61E-04 6.56E-08 7.56E-02 Fuel Upstream 0.00E+00 3.24E+01 0.00E+00 0.00E+00 3.24E+01 Mine Methane 2.02E+00 7.07E-03 4.25E-03 0.00E+00 2.04E+00
Overburden Removal
Fuel Combustion 1.17E+00 1.53E-01 1.48E+00 4.88E-09 2.80E+00 Ammonium Nitrate
Upstream 6.29E+00 9.67E-01 2.86E-02 2.03E-02 7.30E+00
Electricity Upstream 4.47E-01 2.60E-01 2.45E-03 6.32E-07 7.09E-01 Fuel Upstream 8.92E-03 4.87E-03 4.75E-05 5.91E-11 1.38E-02
Construction
Access Road Construction 2.92E-02 2.58E-03 2.26E-04 4.95E-06 3.20E-02
Equipment Manufacturing 2.47E-01 1.40E-01 1.34E-03 3.75E-07 3.89E-01
Total 8.18E+02 3.84E+01 2.07E+00 2.23E-02 8.58E+02 1 Zero values include cases of no data.

Life Cycle Analysis of Coal Exports from the Powder River Basin
B-26
Table B-24: Australian Coal to Taiwan Drilldown GHG Results – AR5 20-yr GWP (kg CO2e/MWh)1
Stage Process 1 Process 2 Pollutant
CO₂ CH₄ N₂O SF₆ Total
Energy Conversion
Fly Ash Disposal Fuel Combustion 1.62E-01 4.78E-04 1.71E-04 0.00E+00 1.62E-01 Fuel Upstream 3.45E-02 1.96E-02 1.87E-04 5.24E-08 5.43E-02
Power Plant
Stack Emissions 7.72E+02 0.00E+00 0.00E+00 0.00E+00 7.72E+02 Plant Auxiliary
Inputs 4.86E+00 1.45E+00 1.86E-02 1.98E-05 6.33E+00
Plant Construction 1.08E+00 2.06E-01 1.62E-03 6.12E-04 1.28E+00
Transport
Processing Import Terminal 3.03E-01 0.00E+00 0.00E+00 0.00E+00 3.03E-01
Ocean Fuel Combustion 2.03E+01 2.91E-02 2.69E-01 0.00E+00 2.06E+01 Fuel Upstream 4.22E+00 2.39E+00 2.28E-02 6.41E-06 6.64E+00
Processing Export Terminal 3.03E-01 0.00E+00 0.00E+00 0.00E+00 3.03E-01
Rail Fuel Combustion 1.20E+00 4.20E-03 2.52E-03 0.00E+00 1.21E+00 Fuel Upstream 2.47E-01 1.40E-01 1.34E-03 3.75E-07 3.89E-01
Coal Mining
Coal Cleaning Electricity Upstream 1.58E-01 2.43E-02 7.21E-04 5.12E-04 1.84E-01
Mine Reclamation Fuel Combustion 1.39E-01 4.86E-04 2.92E-04 0.00E+00 1.40E-01 Fuel Upstream 2.86E-02 1.62E-02 1.55E-04 4.34E-08 4.49E-02
Coal Extraction
Fuel Combustion 2.37E-01 8.28E-04 4.98E-04 0.00E+00 2.38E-01 Ammonium Nitrate
Upstream 1.62E-01 2.13E-02 2.06E-01 6.80E-10 3.90E-01
Electricity Upstream 2.43E-01 3.73E-02 1.11E-03 7.85E-04 2.82E-01
Fuel Upstream 4.75E-02 2.79E-02 2.61E-04 6.56E-08 7.56E-02 Mine Methane 0.00E+00 3.24E+01 0.00E+00 0.00E+00 3.24E+01
Overburden Removal
Fuel Combustion 2.02E+00 7.07E-03 4.25E-03 0.00E+00 2.04E+00 Ammonium Nitrate
Upstream 1.17E+00 1.53E-01 1.48E+00 4.88E-09 2.80E+00
Electricity Upstream 6.29E+00 9.67E-01 2.86E-02 2.03E-02 7.30E+00
Fuel Upstream 4.47E-01 2.60E-01 2.45E-03 6.32E-07 7.09E-01
Construction
Access Road Construction 8.92E-03 4.87E-03 4.75E-05 5.91E-11 1.38E-02
Equipment Manufacturing 2.92E-02 2.58E-03 2.26E-04 4.95E-06 3.20E-02
Total 8.15E+02 3.82E+01 2.04E+00 2.23E-02 8.56E+02 1 Zero values include cases of no data.
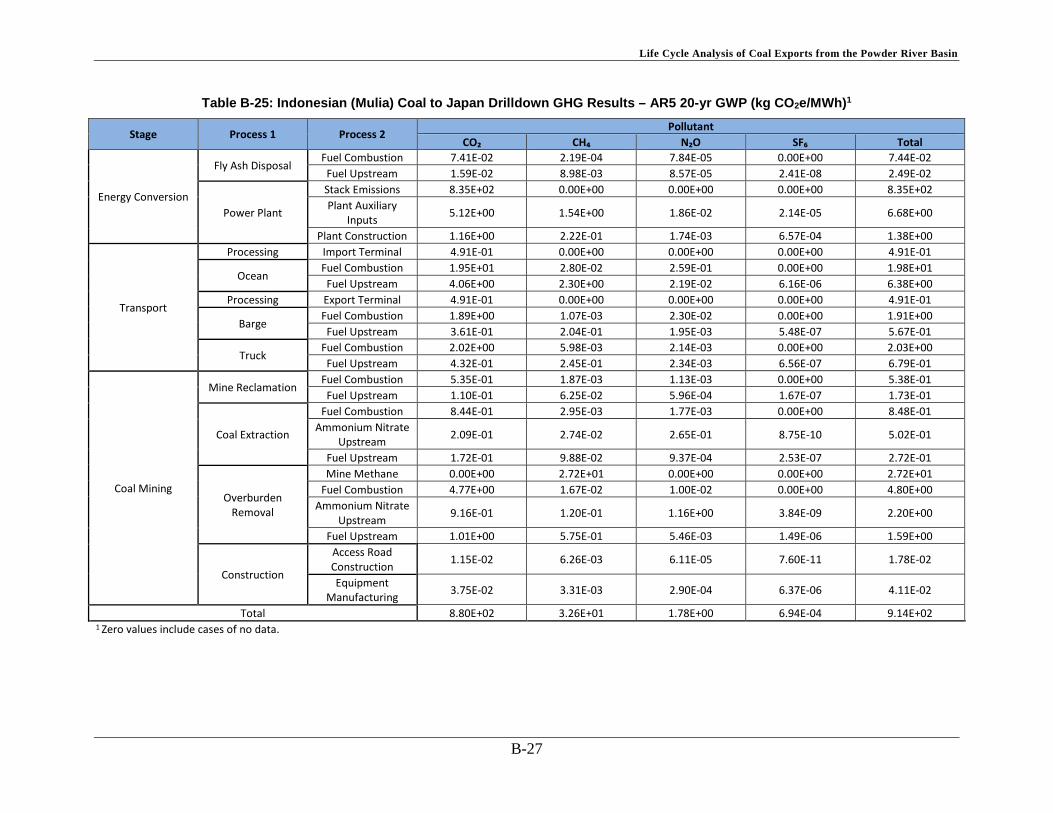
Life Cycle Analysis of Coal Exports from the Powder River Basin
B-27
Table B-25: Indonesian (Mulia) Coal to Japan Drilldown GHG Results – AR5 20-yr GWP (kg CO2e/MWh)1
Stage Process 1 Process 2 Pollutant
CO₂ CH₄ N₂O SF₆ Total
Energy Conversion
Fly Ash Disposal Fuel Combustion 7.41E-02 2.19E-04 7.84E-05 0.00E+00 7.44E-02 Fuel Upstream 1.59E-02 8.98E-03 8.57E-05 2.41E-08 2.49E-02
Power Plant
Stack Emissions 8.35E+02 0.00E+00 0.00E+00 0.00E+00 8.35E+02 Plant Auxiliary
Inputs 5.12E+00 1.54E+00 1.86E-02 2.14E-05 6.68E+00
Plant Construction 1.16E+00 2.22E-01 1.74E-03 6.57E-04 1.38E+00
Transport
Processing Import Terminal 4.91E-01 0.00E+00 0.00E+00 0.00E+00 4.91E-01
Ocean Fuel Combustion 1.95E+01 2.80E-02 2.59E-01 0.00E+00 1.98E+01 Fuel Upstream 4.06E+00 2.30E+00 2.19E-02 6.16E-06 6.38E+00
Processing Export Terminal 4.91E-01 0.00E+00 0.00E+00 0.00E+00 4.91E-01
Barge Fuel Combustion 1.89E+00 1.07E-03 2.30E-02 0.00E+00 1.91E+00 Fuel Upstream 3.61E-01 2.04E-01 1.95E-03 5.48E-07 5.67E-01
Truck Fuel Combustion 2.02E+00 5.98E-03 2.14E-03 0.00E+00 2.03E+00 Fuel Upstream 4.32E-01 2.45E-01 2.34E-03 6.56E-07 6.79E-01
Coal Mining
Mine Reclamation Fuel Combustion 5.35E-01 1.87E-03 1.13E-03 0.00E+00 5.38E-01 Fuel Upstream 1.10E-01 6.25E-02 5.96E-04 1.67E-07 1.73E-01
Coal Extraction
Fuel Combustion 8.44E-01 2.95E-03 1.77E-03 0.00E+00 8.48E-01 Ammonium Nitrate
Upstream 2.09E-01 2.74E-02 2.65E-01 8.75E-10 5.02E-01
Fuel Upstream 1.72E-01 9.88E-02 9.37E-04 2.53E-07 2.72E-01
Overburden Removal
Mine Methane 0.00E+00 2.72E+01 0.00E+00 0.00E+00 2.72E+01 Fuel Combustion 4.77E+00 1.67E-02 1.00E-02 0.00E+00 4.80E+00
Ammonium Nitrate Upstream 9.16E-01 1.20E-01 1.16E+00 3.84E-09 2.20E+00
Fuel Upstream 1.01E+00 5.75E-01 5.46E-03 1.49E-06 1.59E+00
Construction
Access Road Construction 1.15E-02 6.26E-03 6.11E-05 7.60E-11 1.78E-02
Equipment Manufacturing 3.75E-02 3.31E-03 2.90E-04 6.37E-06 4.11E-02
Total 8.80E+02 3.26E+01 1.78E+00 6.94E-04 9.14E+02 1 Zero values include cases of no data.

Life Cycle Analysis of Coal Exports from the Powder River Basin
B-28
Table B-26: Indonesian (Adaro) Coal to Japan Drilldown GHG Results – AR5 20-yr GWP (kg CO2e/MWh)1
Stage Process 1 Process 2 Pollutant
CO₂ CH₄ N₂O SF₆ Total
Energy Conversion
Fly Ash Disposal Fuel Combustion 3.35E-02 9.92E-05 3.55E-05 0.00E+00 3.37E-02 Fuel Upstream 7.17E-03 4.06E-03 3.88E-05 1.09E-08 1.13E-02
Power Plant
Stack Emissions 8.06E+02 0.00E+00 0.00E+00 0.00E+00 8.06E+02 Plant Auxiliary
Inputs 5.01E+00 1.50E+00 1.83E-02 2.07E-05 6.53E+00
Plant Construction 1.12E+00 2.15E-01 1.68E-03 6.37E-04 1.34E+00
Transport
Processing Import Terminal 3.88E-01 0.00E+00 0.00E+00 0.00E+00 3.88E-01
Ocean Fuel Combustion 1.54E+01 2.21E-02 2.04E-01 0.00E+00 1.57E+01 Fuel Upstream 3.21E+00 1.82E+00 1.73E-02 4.87E-06 5.04E+00
Processing Export Terminal 3.88E-01 0.00E+00 0.00E+00 0.00E+00 3.88E-01
Barge Fuel Combustion 1.49E+00 8.46E-04 1.82E-02 0.00E+00 1.51E+00 Fuel Upstream 2.85E-01 1.62E-01 1.54E-03 4.33E-07 4.48E-01
Truck Fuel Combustion 1.60E+00 4.72E-03 1.69E-03 0.00E+00 1.60E+00 Fuel Upstream 3.41E-01 1.93E-01 1.85E-03 5.18E-07 5.37E-01
Coal Mining
Mine Reclamation Fuel Combustion 4.23E-01 1.48E-03 8.90E-04 0.00E+00 4.26E-01 Fuel Upstream 8.72E-02 4.94E-02 4.71E-04 1.32E-07 1.37E-01
Coal Extraction
Fuel Combustion 6.67E-01 2.33E-03 1.40E-03 0.00E+00 6.70E-01 Ammonium Nitrate
Upstream 1.65E-01 2.16E-02 2.10E-01 6.91E-10 3.96E-01
Fuel Upstream 1.36E-01 7.81E-02 7.40E-04 2.00E-07 2.15E-01
Overburden Removal
Mine Methane 0.00E+00 2.15E+01 0.00E+00 0.00E+00 2.15E+01 Fuel Combustion 3.77E+00 1.32E-02 7.92E-03 0.00E+00 3.79E+00
Ammonium Nitrate Upstream 7.24E-01 9.48E-02 9.20E-01 3.03E-09 1.74E+00
Fuel Upstream 7.94E-01 4.54E-01 4.31E-03 1.18E-06 1.25E+00
Construction
Access Road Construction 9.07E-03 4.95E-03 4.83E-05 6.00E-11 1.41E-02
Equipment Manufacturing 2.96E-02 2.62E-03 2.29E-04 5.03E-06 3.25E-02
Total 8.42E+02 2.61E+01 1.41E+00 6.70E-04 8.69E+02 1 Zero values include cases of no data.

Life Cycle Analysis of Coal Exports from the Powder River Basin
B-29
Table B-27: Indonesian (Mulia) Coal to South Korea Drilldown GHG Results – AR5 20-yr GWP (kg CO2e/MWh)1
Stage Process 1 Process 2 Pollutant
CO₂ CH₄ N₂O SF₆ Total
Energy Conversion
Fly Ash Disposal Fuel Combustion 7.41E-02 2.19E-04 7.84E-05 0.00E+00 7.44E-02
Fuel Upstream 1.59E-02 8.98E-03 8.57E-05 2.41E-08 2.49E-02
Power Plant Stack Emissions 8.35E+02 0.00E+00 0.00E+00 0.00E+00 8.35E+02
Plant Auxiliary Inputs 5.12E+00 1.54E+00 1.86E-02 2.14E-05 6.68E+00 Plant Construction 1.16E+00 2.22E-01 1.74E-03 6.57E-04 1.38E+00
Transport
Processing Import Terminal 4.91E-01 0.00E+00 0.00E+00 0.00E+00 4.91E-01
Ocean Fuel Combustion 1.83E+01 2.62E-02 2.42E-01 0.00E+00 1.85E+01
Fuel Upstream 3.80E+00 2.15E+00 2.05E-02 5.76E-06 5.97E+00 Processing Export Terminal 4.91E-01 0.00E+00 0.00E+00 0.00E+00 4.91E-01
Barge Fuel Combustion 1.89E+00 1.07E-03 2.30E-02 0.00E+00 1.91E+00
Fuel Upstream 3.61E-01 2.04E-01 1.95E-03 5.48E-07 5.67E-01
Truck Fuel Combustion 2.02E+00 5.98E-03 2.14E-03 0.00E+00 2.03E+00
Fuel Upstream 4.32E-01 2.45E-01 2.34E-03 6.56E-07 6.79E-01
Coal Mining
Mine Reclamation Fuel Combustion 5.35E-01 1.87E-03 1.13E-03 0.00E+00 5.38E-01
Fuel Upstream 1.10E-01 6.25E-02 5.96E-04 1.67E-07 1.73E-01
Coal Extraction
Fuel Combustion 8.44E-01 2.95E-03 1.77E-03 0.00E+00 8.48E-01 Ammonium Nitrate
Upstream 2.09E-01 2.74E-02 2.65E-01 8.75E-10 5.02E-01
Fuel Upstream 1.72E-01 9.88E-02 9.37E-04 2.53E-07 2.72E-01
Overburden Removal
Mine Methane 0.00E+00 2.72E+01 0.00E+00 0.00E+00 2.72E+01 Fuel Combustion 4.77E+00 1.67E-02 1.00E-02 0.00E+00 4.80E+00
Ammonium Nitrate Upstream 9.16E-01 1.20E-01 1.16E+00 3.84E-09 2.20E+00
Fuel Upstream 1.01E+00 5.75E-01 5.46E-03 1.49E-06 1.59E+00
Construction
Access Road Construction 1.15E-02 6.26E-03 6.11E-05 7.60E-11 1.78E-02
Equipment Manufacturing 3.75E-02 3.31E-03 2.90E-04 6.37E-06 4.11E-02
Total 8.78E+02 3.25E+01 1.76E+00 6.94E-04 9.12E+02 1 Zero values include cases of no data.

Life Cycle Analysis of Coal Exports from the Powder River Basin
B-30
Table B-28: Indonesian (Adaro) Coal to South Korea Drilldown GHG Results – AR5 20-yr GWP (kg CO2e/MWh)1
Stage Process 1 Process 2 Pollutant
CO₂ CH₄ N₂O SF₆ Total
Energy Conversion
Fly Ash Disposal Fuel Combustion 3.35E-02 9.92E-05 3.55E-05 0.00E+00 3.37E-02
Fuel Upstream 7.17E-03 4.06E-03 3.88E-05 1.09E-08 1.13E-02
Power Plant Stack Emissions 8.06E+02 0.00E+00 0.00E+00 0.00E+00 8.06E+02
Plant Auxiliary Inputs 5.01E+00 1.50E+00 1.83E-02 2.07E-05 6.53E+00 Plant Construction 1.12E+00 2.15E-01 1.68E-03 6.37E-04 1.34E+00
Transport
Processing Import Terminal 3.88E-01 0.00E+00 0.00E+00 0.00E+00 3.88E-01
Ocean Fuel Combustion 1.44E+01 2.07E-02 1.91E-01 0.00E+00 1.46E+01
Fuel Upstream 3.00E+00 1.70E+00 1.62E-02 4.55E-06 4.72E+00 Processing Export Terminal 3.88E-01 0.00E+00 0.00E+00 0.00E+00 3.88E-01
Barge Fuel Combustion 1.49E+00 8.46E-04 1.82E-02 0.00E+00 1.51E+00
Fuel Upstream 2.85E-01 1.62E-01 1.54E-03 4.33E-07 4.48E-01
Truck Fuel Combustion 1.60E+00 4.72E-03 1.69E-03 0.00E+00 1.60E+00
Fuel Upstream 3.41E-01 1.93E-01 1.85E-03 5.18E-07 5.37E-01
Coal Mining
Mine Reclamation Fuel Combustion 4.23E-01 1.48E-03 8.90E-04 0.00E+00 4.26E-01
Fuel Upstream 8.72E-02 4.94E-02 4.71E-04 1.32E-07 1.37E-01
Coal Extraction
Fuel Combustion 6.67E-01 2.33E-03 1.40E-03 0.00E+00 6.70E-01 Ammonium Nitrate
Upstream 1.65E-01 2.16E-02 2.10E-01 6.91E-10 3.96E-01
Fuel Upstream 1.36E-01 7.81E-02 7.40E-04 2.00E-07 2.15E-01
Overburden Removal
Mine Methane 0.00E+00 2.15E+01 0.00E+00 0.00E+00 2.15E+01 Fuel Combustion 3.77E+00 1.32E-02 7.92E-03 0.00E+00 3.79E+00
Ammonium Nitrate Upstream 7.24E-01 9.48E-02 9.20E-01 3.03E-09 1.74E+00
Fuel Upstream 7.94E-01 4.54E-01 4.31E-03 1.18E-06 1.25E+00
Construction
Access Road Construction 9.07E-03 4.95E-03 4.83E-05 6.00E-11 1.41E-02
Equipment Manufacturing 2.96E-02 2.62E-03 2.29E-04 5.03E-06 3.25E-02
Total 8.41E+02 2.60E+01 1.40E+00 6.70E-04 8.68E+02 1 Zero values include cases of no data.

Life Cycle Analysis of Coal Exports from the Powder River Basin
B-31
Table B-29: Indonesian (Mulia) Coal to Taiwan Drilldown GHG Results – AR5 20-yr GWP (kg CO2e/MWh)1
Stage Process 1 Process 2 Pollutant
CO₂ CH₄ N₂O SF₆ Total
Energy Conversion
Fly Ash Disposal Fuel Combustion 7.41E-02 2.19E-04 7.84E-05 0.00E+00 7.44E-02
Fuel Upstream 1.59E-02 8.98E-03 8.57E-05 2.41E-08 2.49E-02
Power Plant Stack Emissions 8.35E+02 0.00E+00 0.00E+00 0.00E+00 8.35E+02
Plant Auxiliary Inputs 5.12E+00 1.54E+00 1.86E-02 2.14E-05 6.68E+00 Plant Construction 1.16E+00 2.22E-01 1.74E-03 6.57E-04 1.38E+00
Transport
Processing Import Terminal 4.91E-01 0.00E+00 0.00E+00 0.00E+00 4.91E-01
Ocean Fuel Combustion 1.25E+01 1.79E-02 1.65E-01 0.00E+00 1.27E+01
Fuel Upstream 2.60E+00 1.47E+00 1.40E-02 3.94E-06 4.08E+00 Processing Export Terminal 4.91E-01 0.00E+00 0.00E+00 0.00E+00 4.91E-01
Barge Fuel Combustion 1.89E+00 1.07E-03 2.30E-02 0.00E+00 1.91E+00
Fuel Upstream 3.61E-01 2.04E-01 1.95E-03 5.48E-07 5.67E-01
Truck Fuel Combustion 2.02E+00 5.98E-03 2.14E-03 0.00E+00 2.03E+00
Fuel Upstream 4.32E-01 2.45E-01 2.34E-03 6.56E-07 6.79E-01
Coal Mining
Mine Reclamation Fuel Combustion 5.35E-01 1.87E-03 1.13E-03 0.00E+00 5.38E-01
Fuel Upstream 1.10E-01 6.25E-02 5.96E-04 1.67E-07 1.73E-01
Coal Extraction
Fuel Combustion 8.44E-01 2.95E-03 1.77E-03 0.00E+00 8.48E-01 Ammonium Nitrate
Upstream 2.09E-01 2.74E-02 2.65E-01 8.75E-10 5.02E-01
Fuel Upstream 1.72E-01 9.88E-02 9.37E-04 2.53E-07 2.72E-01
Overburden Removal
Mine Methane 0.00E+00 2.72E+01 0.00E+00 0.00E+00 2.72E+01 Fuel Combustion 4.77E+00 1.67E-02 1.00E-02 0.00E+00 4.80E+00
Ammonium Nitrate Upstream 9.16E-01 1.20E-01 1.16E+00 3.84E-09 2.20E+00
Fuel Upstream 1.01E+00 5.75E-01 5.46E-03 1.49E-06 1.59E+00
Construction
Access Road Construction 1.15E-02 6.26E-03 6.11E-05 7.60E-11 1.78E-02
Equipment Manufacturing 3.75E-02 3.31E-03 2.90E-04 6.37E-06 4.11E-02
Total 8.71E+02 3.18E+01 1.68E+00 6.92E-04 9.04E+02 1 Zero values include cases of no data.
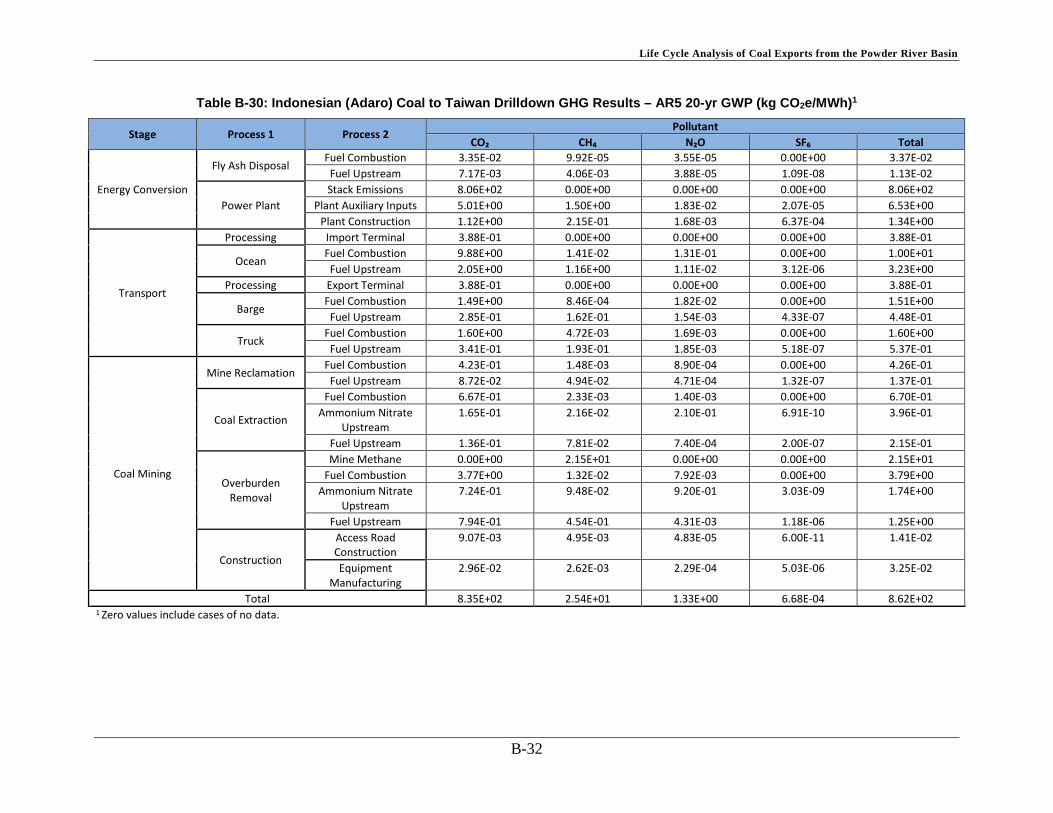
Life Cycle Analysis of Coal Exports from the Powder River Basin
B-32
Table B-30: Indonesian (Adaro) Coal to Taiwan Drilldown GHG Results – AR5 20-yr GWP (kg CO2e/MWh)1
Stage Process 1 Process 2 Pollutant
CO₂ CH₄ N₂O SF₆ Total
Energy Conversion
Fly Ash Disposal Fuel Combustion 3.35E-02 9.92E-05 3.55E-05 0.00E+00 3.37E-02
Fuel Upstream 7.17E-03 4.06E-03 3.88E-05 1.09E-08 1.13E-02
Power Plant Stack Emissions 8.06E+02 0.00E+00 0.00E+00 0.00E+00 8.06E+02
Plant Auxiliary Inputs 5.01E+00 1.50E+00 1.83E-02 2.07E-05 6.53E+00 Plant Construction 1.12E+00 2.15E-01 1.68E-03 6.37E-04 1.34E+00
Transport
Processing Import Terminal 3.88E-01 0.00E+00 0.00E+00 0.00E+00 3.88E-01
Ocean Fuel Combustion 9.88E+00 1.41E-02 1.31E-01 0.00E+00 1.00E+01
Fuel Upstream 2.05E+00 1.16E+00 1.11E-02 3.12E-06 3.23E+00 Processing Export Terminal 3.88E-01 0.00E+00 0.00E+00 0.00E+00 3.88E-01
Barge Fuel Combustion 1.49E+00 8.46E-04 1.82E-02 0.00E+00 1.51E+00
Fuel Upstream 2.85E-01 1.62E-01 1.54E-03 4.33E-07 4.48E-01
Truck Fuel Combustion 1.60E+00 4.72E-03 1.69E-03 0.00E+00 1.60E+00
Fuel Upstream 3.41E-01 1.93E-01 1.85E-03 5.18E-07 5.37E-01
Coal Mining
Mine Reclamation Fuel Combustion 4.23E-01 1.48E-03 8.90E-04 0.00E+00 4.26E-01
Fuel Upstream 8.72E-02 4.94E-02 4.71E-04 1.32E-07 1.37E-01
Coal Extraction
Fuel Combustion 6.67E-01 2.33E-03 1.40E-03 0.00E+00 6.70E-01 Ammonium Nitrate
Upstream 1.65E-01 2.16E-02 2.10E-01 6.91E-10 3.96E-01
Fuel Upstream 1.36E-01 7.81E-02 7.40E-04 2.00E-07 2.15E-01
Overburden Removal
Mine Methane 0.00E+00 2.15E+01 0.00E+00 0.00E+00 2.15E+01 Fuel Combustion 3.77E+00 1.32E-02 7.92E-03 0.00E+00 3.79E+00
Ammonium Nitrate Upstream
7.24E-01 9.48E-02 9.20E-01 3.03E-09 1.74E+00
Fuel Upstream 7.94E-01 4.54E-01 4.31E-03 1.18E-06 1.25E+00
Construction
Access Road Construction
9.07E-03 4.95E-03 4.83E-05 6.00E-11 1.41E-02
Equipment Manufacturing
2.96E-02 2.62E-03 2.29E-04 5.03E-06 3.25E-02
Total 8.35E+02 2.54E+01 1.33E+00 6.68E-04 8.62E+02 1 Zero values include cases of no data.

Life Cycle Analysis of Coal Exports from the Powder River Basin
B-33
Table B-31: TRACI 2.1 Acidification Results (kg SO2-e/MWh)
Process Japan Korea Taiwan
PRB AU ID - Adaro ID - Mulia PRB AU ID -
Adaro ID - Mulia PRB AU ID - Adaro ID - Mulia
Mining 4.11E-02 1.09E-01 1.68E-01 2.12E-01 4.11E-02 1.09E-01 1.68E-01 2.12E-01 4.11E-02 1.09E-01 1.68E-01 2.12E-01
Coal Cleaning N/A 3.92E-04 N/A N/A N/A 3.92E-04 N/A N/A N/A 3.92E-04 N/A N/A
Truck Transport N/A N/A 1.30E-02 1.65E-02 N/A N/A 1.30E-02 1.65E-02 N/A N/A 1.30E-02 1.65E-02
Rail Transport 6.21E-02 1.41E-02 N/A N/A 6.21E-02 1.41E-02 N/A N/A 6.21E-02 1.41E-02 N/A N/A
Barge Transport N/A N/A 1.11E-02 1.40E-02 N/A N/A 1.11E-02 1.40E-02 N/A N/A 1.11E-02 1.40E-02
Export Terminal 3.05E-03 2.42E-03 3.10E-03 3.92E-03 3.05E-03 2.42E-03 3.10E-03 3.92E-03 3.05E-03 2.42E-03 3.10E-03 3.92E-03
Ocean Transport N/A N/A N/A N/A N/A N/A N/A N/A N/A N/A N/A N/A
Import Terminal 3.05E-03 2.42E-03 3.10E-03 3.92E-03 3.05E-03 2.42E-03 3.10E-03 3.92E-03 3.05E-03 2.42E-03 3.10E-03 3.92E-03
Power Plant 6.72E-01 6.72E-01 6.71E-01 6.72E-01 6.72E-01 6.72E-01 6.71E-01 6.72E-01 6.72E-01 6.72E-01 6.71E-01 6.72E-01
Total 7.81E-01 8.00E-01 8.69E-01 9.23E-01 7.81E-01 8.00E-01 8.69E-01 9.23E-01 7.81E-01 8.00E-01 8.69E-01 9.23E-01
Table B-32: TRACI 2.1 Eutrophication Results (kg Nitrogen-e/MWh)
Process Japan Korea Taiwan
PRB AU ID - Adaro ID - Mulia PRB AU ID -
Adaro ID - Mulia PRB AU ID - Adaro ID - Mulia
Mining 3.17E-03 6.81E-03 1.06E-02 1.34E-02 3.17E-03 6.81E-03 1.06E-02 1.34E-02 3.17E-03 6.81E-03 1.06E-02 1.34E-02
Coal Cleaning N/A 1.11E-03 N/A N/A N/A 1.11E-03 N/A N/A N/A 1.11E-03 N/A N/A
Truck Transport N/A N/A 6.35E-04 8.04E-04 N/A N/A 6.35E-04 8.04E-04 N/A N/A 6.35E-04 8.04E-04
Rail Transport 3.65E-03 8.73E-04 N/A N/A 3.65E-03 8.73E-04 N/A N/A 3.65E-03 8.73E-04 N/A N/A
Barge Transport N/A N/A N/A N/A N/A N/A 5.38E-04 6.81E-04 N/A N/A 5.38E-04 6.81E-04
Export Terminal 1.87E-04 1.48E-04 1.90E-04 2.40E-04 1.87E-04 1.48E-04 1.90E-04 2.40E-04 1.87E-04 1.48E-04 1.90E-04 2.40E-04
Ocean Transport N/A N/A N/A N/A N/A N/A N/A N/A N/A N/A N/A N/A
Import Terminal 1.87E-04 1.48E-04 1.90E-04 2.40E-04 1.87E-04 1.48E-04 1.90E-04 2.40E-04 1.87E-04 1.48E-04 1.90E-04 2.40E-04
Power Plant 1.38E-02 1.38E-02 1.37E-02 1.38E-02 1.38E-02 1.38E-02 1.37E-02 1.38E-02 1.38E-02 1.38E-02 1.37E-02 1.38E-02
Total 2.10E-02 2.29E-02 2.59E-02 2.91E-02 2.10E-02 2.29E-02 2.59E-02 2.91E-02 2.10E-02 2.29E-02 2.59E-02 2.91E-02

Life Cycle Analysis of Coal Exports from the Powder River Basin
B-34
Table B-33: TRACI 2.1 Human Health Particulate Results (kg PM2.5-e/MWh)
Process Japan Korea Taiwan
PRB AU ID - Adaro ID - Mulia PRB AU ID -
Adaro ID - Mulia PRB AU ID - Adaro ID - Mulia
Mining 3.14E-03 8.98E-03 1.12E-02 1.42E-02 3.14E-03 8.98E-03 1.12E-02 1.42E-02 3.14E-03 8.98E-03 1.12E-02 1.42E-02
Coal Cleaning N/A 6.96E-05 N/A N/A N/A 6.96E-05 N/A N/A N/A 6.96E-05 N/A N/A
Truck Transport N/A N/A 7.45E-04 9.43E-04 N/A N/A 7.45E-04 9.43E-04 N/A N/A 7.45E-04 9.43E-04
Rail Transport 3.52E-03 8.99E-04 N/A N/A 3.52E-03 8.99E-04 N/A N/A 3.52E-03 8.99E-04 N/A N/A
Barge Transport N/A N/A 3.11E-03 3.94E-03 N/A N/A 3.11E-03 3.94E-03 N/A N/A 3.11E-03 3.94E-03
Export Terminal 1.29E-04 1.02E-04 1.31E-04 1.65E-04 1.29E-04 1.02E-04 1.31E-04 1.65E-04 1.29E-04 1.02E-04 1.31E-04 1.65E-04
Ocean Transport N/A N/A N/A N/A N/A N/A N/A N/A N/A N/A N/A N/A
Import Terminal 1.29E-04 1.02E-04 1.31E-04 1.65E-04 1.29E-04 1.02E-04 1.31E-04 1.65E-04 1.29E-04 1.02E-04 1.31E-04 1.65E-04
Power Plant 4.24E-02 4.71E-02 3.83E-02 4.11E-02 4.24E-02 4.71E-02 3.83E-02 4.11E-02 4.24E-02 4.71E-02 3.83E-02 4.11E-02
Total 4.93E-02 5.73E-02 5.36E-02 6.05E-02 4.93E-02 5.73E-02 5.36E-02 6.05E-02 4.93E-02 5.73E-02 5.36E-02 6.05E-02
Table B-34: TRACI 2.1 Smog (kg O3-e/MWh)
Process Japan Korea Taiwan
PRB AU ID - Adaro ID - Mulia PRB AU ID -
Adaro ID - Mulia PRB AU ID - Adaro ID - Mulia
Mining 9.73E-01 2.45E+00 3.82E+00 4.83E+00 9.73E-01 2.45E+00 3.82E+00 4.83E+00 9.73E-01 2.45E+00 3.82E+00 4.83E+00
Coal Cleaning N/A 3.75E-03 N/A N/A N/A 3.75E-03 N/A N/A N/A 3.75E-03 N/A N/A
Truck Transport N/A N/A 2.34E-01 2.96E-01 N/A N/A 2.34E-01 2.96E-01 N/A N/A 2.34E-01 2.96E-01
Rail Transport 1.63E+00 3.36E-01 N/A N/A 1.63E+00 3.36E-01 N/A N/A 1.63E+00 3.36E-01 N/A N/A
Barge Transport N/A N/A 2.07E-01 2.62E-01 N/A N/A 2.07E-01 2.62E-01 N/A N/A 2.07E-01 2.62E-01
Export Terminal 1.05E-01 8.32E-02 1.06E-01 1.35E-01 1.05E-01 8.32E-02 1.06E-01 1.35E-01 1.05E-01 8.32E-02 1.06E-01 1.35E-01
Ocean Transport N/A N/A N/A N/A N/A N/A N/A N/A N/A N/A N/A N/A
Import Terminal 1.05E-01 8.32E-02 1.06E-01 1.35E-01 1.05E-01 8.32E-02 1.06E-01 1.35E-01 1.05E-01 8.32E-02 1.06E-01 1.35E-01
Power Plant 7.01E+00 7.02E+00 7.00E+00 7.01E+00 7.01E+00 7.02E+00 7.00E+00 7.01E+00 7.01E+00 7.02E+00 7.00E+00 7.01E+00
Total 9.82E+00 9.98E+00 1.15E+01 1.27E+01 9.82E+00 9.98E+00 1.15E+01 1.27E+01 9.82E+00 9.98E+00 1.15E+01 1.27E+01

This page intentionally left blank.
www.netl.doe.gov Pittsburgh, PA • Morgantown, WV • Albany, OR • Sugar Land, TX • Anchorage, AK
(800) 553-7681
Timothy J. Skone, P.E. [email protected]
Joe Marriott, Ph.D. [email protected]