national endowment arts
TRANSCRIPT

National Endowment for the Arts
2002 SURVEY OF PUBLIC PARTICIPATION
IN THE ARTS
Research Division Report #45

Research Division Report #45
March 2004
National Endowment for the Arts1100 Pennsylvania Avenue, NorthwestWashington, DC 20506-0001Telephone: (202) 682-5400
Produced by Tom Bradshaw and Bonnie NicholsResearch Division, National Endowment for the Arts
Prepared for the Research Division, National Endowment for the Arts by BBC Research & Consulting, Denver, Colorado
Designed by Fletcher Design Inc., Washington, DCwww.fletcherdesign.com
Cover photo by Jann Whaley
Printed in the United States of America
Library of Congress Cataloging-in-Publication Data
2002 survey of public participation in the arts : summary report.p. cm. — (Research division report ; #45)
Produced by Tom Bradshaw and Bonnie Nichols, Research Division, National Endowmentfor the Arts. 1. Arts audiences—United States. 2. Arts surveys—United States. 3. Arts—UnitedStates—Citizen participation. I. Title: Survey of public participation in the arts. II. Bradshaw,Tom. III. Nichols, Bonnie. IV. National Endowment for the Arts. Research Division. V. Series. VI.Research Division report (National Endowment for the Arts. Research Division) ; 45.NX220.A164 2004700’.973’090511—dc22
2003027809CIP
Voice/TTY:(202) 682-5496 For individuals who are deaf or hard-of-hearing.
Individuals who do not use conventional print may contact the Arts Endowment’s Office for AccessAbility to obtain this publication in an alternate format. Telephone: (202) 682-5532
This publication is available online at www.arts.gov, the Web site of the NationalEndowment for the Arts.
Chapter 1. Executive Summary...................................................................................................................1Methodology, 1 • Attendance, 2 • Broadcast and Recorded Media, 3 • Personal Participation in the Arts, 5 • Summary, 5 • Additional Information from the 2002 SPPA, 6
Chapter 2. Introduction...............................................................................................................................7Benchmark Activities, 7 • Data Collection Methodology, 7 • Organization of the Report, 9
Chapter 3. Attendance at Arts Performances and Events............................11Benchmark Activities, 11 • Performing Arts, 12 • Visual Arts, 18Historic Sites, 18 • Literature, 19 • Influence of Education on Arts Attendance, 19
Chapter 4. Participation via Media..................................................................................................21Performing Arts, 21 • Visual Arts, 28 • Literature, 29 • Internet, 29
Chapter 5. Personal Participation in the Arts...............................................................31Performing and Creating Art, 31 • Owning Art, 40 • Literature, 40 • Arts Classes, 40
Chapter 6. ARTS Preferences and leisure participation....................................43Arts Preferences, 43 • Music Preferences, 44 • Other Leisure Activities, 45
Chapter 7. Regional Differences in Arts Participation...................................49Attendance, 49 • Media Participation, 51 • Trips Taken for Art, 51
Chapter 8. Summary Results for Benchmark Activities...................................55Art Museums and Galleries, 55 • Ballet and Dance, 55 • Classical Music, 56 • Jazz, 56Musical Plays, 57 • Non-Musical Plays, 58 • Opera, 58
iii
contents

APPENDICES.........................................................................................................................................................................59
Appendix A. Survey of Public Participation in the Arts Background and Methodology.............................................................................................................................................591982 and 1985 Surveys of Public Participation in the Arts, 59 • 1992 Survey of Public Participation in the Arts, 59 • 1997 Survey of Public Participation in the Arts, 592002 Survey of Public Participation in the Arts, 60
Appendix B. Data Collection.............................................................................................................................................................61
Appendix C. Standard Errors, Hypothesis Testing and Design Effect................................62
Appendix D. 2002 Survey of Public Participation in the Arts (SPpA)..............................................63Participation via Attendance, 63 • Participation via Media, 64 • Leisure Activities, 64Preferences, 65 • Arts Learning, 66 • Travel/Trips, 68 • Internet, 68
Appendix E. Research Division Reports and Notes of Related Interest.............................69Notes, 69 • Reports, 69
iv
List of Tables
Table 1. U.S. Adults Participating in the Arts at Least Once in a 12-Month Period: 1982, 1992, 2002.........................................................2
Table 2. U.S. Adults Who Watched or Listened to the Arts on TV, Radio, Recordings or the Internet in a 12-Month Period: 1982, 1992, 2002.....4
Table 3. U.S. Adults Performing or Creating Art at Least Once in a 12-Month Period: 1992 and 2002................................................5
Table 4. Percentage of U.S. Adults Participating in the Arts at Least Once in the 12-Month Period Ending August 2002....................................................6
Table 5. 2002 SPPA Question Areas for Each Art Form ............................................................8
Table 6. U.S. Adults Participating in the Arts at Least Once in a 12-Month Period: 1982, 1992, 2002.................................................................12
Table 7. Average Number of Attendances and Total Number of Attendances: 1992 and 2002 ........13
Table 8. Demographic Distribution of U.S. Adults Who Attend/Visit/Read at Least Oncein the 12-Month Period Ending August 2002..........14
Table 9. Rates at Which U.S. Adults Attend/Visit/Read by Demographic Group, 2002(Percentage Participating at Least Once in the 12-Month Period Ending August 2002).........16
Table 10. U.S. Adults Who Watched or Listened to the Arts on TV, Radio, Recordings or the Internet in a 12-Month Period: 1982, 1992, 2002...22
Table 11. Demographic Distribution of U.S. Adults Participating in the Arts Through Media at Least Once in the 12-Month Period Ending August 2002..................................................24
Table 12. Rates at Which U.S. Adults Participate in the Arts Through Media, 2002(Percentage Participating at Least Once in the 12-Month Period Ending August 2002)....................26
v
Table 13. TV/VCR/DVD Viewing Frequency for 1992 and 2002 .....................................................28
Table 14. U.S. Adults’ Use of the Internet to Explore the Arts, 2002 ..........................................29
Table 15. U.S. Adults Performing or Creating Art at Least Once in a 12-Month Period: 1992 and 2002..............................................33
Table 16. U.S. Adults Performing in Public or Creating Art That Was Publicly Displayed in a 12-Month Period: 1992 and 2002.............................34
Table 17. Demographic Distribution of U.S. Adults Personally Participating in the Arts at Least Once in the 12-Month Period Ending August 2002...............................................................36
Table 18. Rates at Which U.S. Adults Participate in the Arts by Demographic Group, 2002 (Percentage Participating at Least Once in the 12-Month Period Ending August 2002)....................38
Table 19. U.S. Adults Taking an Arts Lesson or Class at Any Time in Their Lives: 1982, 1992, 2002.................................................................40
Table 20. U.S. Adults Taking an Arts Lesson or Class in the 12-Month period Ending August 2002...............................................................40
Table 21. U.S. Adults’ Preferences for Attending Additional Arts Events: 1982, 1992, 2002 .............43
Table 22. Type of Arts Event U.S. Adults Would Prefer to Attend Most, 2002 ..........................44
Table 23. Types of Music Liked by U.S. Adults: 1982, 1992, 2002 .........................................44
Table 24. Type of Music U.S. Adults Liked Best, 2002........................................................44
Table 25. U.S. Adults’ Top 5 Music Preferences: 1982, 1992, 2002 ......................................................45
Table 26.Participation in Other Leisure Activities: 1982, 1992, 2002.....................................45
vi
National Endowment for the Arts
Table 27. Demographic Distribution of U.S. Adults Personally Participating in Other LeisureActivities at Least Once in the 12-Month PeriodEnding August 2002..................................................46
Table 28. Percentage of U.S. Adults Who Participated at Least Once in the 12-Month Period Ending August 2002......................................47
Table 29. Percentage of U.S. Adults Participating in the Arts at Least Once in the 12-Month PeriodEnding August 2002 by Region................................50
Table 30. Percentage of U.S. Adults Who Watched or Listened to the Arts in the 12-Month Period Ending August 2002 by Region....................52
Table 31. Trips to Performing Arts Events Among Arts Attenders, 2002 ....................................53
Table 32.Key Facts for Art Museums and Galleries..............................................................55
Table 33. Key Facts for Ballet and Dance................56
Table 34. Key Facts for Classical Music ..................56
Table 35. Key Facts for Jazz......................................57
Table 36. Key Facts for Musicals..............................57
Table 37. Key Facts for Plays....................................58
Table 38. Key Facts for Opera ...............................58
List of Figures
Figure 1. Millions of U.S. Adults Attending a Performance Arts Activity at Least Once in the 12-Month Period Ending August 2002 ..............11
Figure 2. Percentage of U.S. Adults Attending at Least One Benchmark Activity by Education, 2002....................................................19
Figure 3. Rate at Which U.S. Adults With at Least a College Degree Attend/Visit/Read Compared With Adults With a High School Degree, 2002 ............................19
Figure 4. Percentage of U.S. Adults Attending at Least One Benchmark Activity by Parents’ Education, 2002.........................................................20
Figure 5. Millions of U.S. Adults Personally Performing Art at Least Once in the 12-MonthPeriod Ending August 2002......................................32
Figure 6. Ratio of Personal Participation of Adults with at Least a College Degree Compared With Adults With a High SchoolEducation, 2002.........................................................35
Figure 7. Key Findings for Study Area Regions, 2002............................................................51
2002 Survey of Public Participation in the Arts
1
National Endowment for the Arts
Although they changed travel and otherplans, Americans continued to attendarts events in the 12 months afterSeptember 11, 2001 — according tothe results of the Survey of Public
Participation in the Arts (SPPA). Nearly one-third ofadults reported going to at least one jazz, classicalmusic, opera, musical, play or ballet performance dur-ing the 12 months ending August 2002, not includingelementary or high school performances. About one-quarter of adults said they visited an art museum or artgallery. Combined, 39 percent of adults, or 81 millionpeople, attended these types of events. This is 5 millionmore than attended (76 million) in 1992, the last yearof a directly comparable National Endowment for theArts survey. The National Endowment for the Arts hasbeen tracking attendance at these “benchmark” eventssince 1982.
The percentage of adults reporting attendance atlive jazz, classical music, opera, musicals, non-musicalplays, ballet and art museums/galleries held steadybetween 1992 and 2002. As in 1992, more peoplereported attending musical plays than any other type ofperforming arts examined in the SPPA. The SPPA alsoexamined activities such as visiting historic sites andreading literature.
Counting all of the art forms and types of participa-tion in the arts examined in the SPPA, 76 percent ofadults, or 157 million people, made the arts part of theirlives in the 12 months ending August 2002. The surveyinvestigated different forms of participation, includingviewing or listening to performing arts on television orradio, reading literature, visiting historic sites, perform-
ing and creating art, owning art and taking arts classes.Nearly two-thirds of American adults attended arts andcultural events, visited historic sites or read literaturefrom September 2001 through August 2002. Four-in-ten reported personally performing or creating art dur-ing this period. Over half watched or listened to the artson television, radio, recorded media or the Internet.About 5 percent took an arts-related class.
MethodologyThe 2002 SPPA marks the fifth NEA survey of artsparticipation in the past 20 years. The surveys con-ducted in 1992 and 1982, also conducted by the U.S.Bureau of the Census, are the primary points of com-parison for the 2002 SPPA. The SPPA supplements in1992 and 1982 were attached to the National CrimeSurvey while the 2002 SPPA was collected as a sup-plement to the Current Population Survey. The 17,135adults participating in the 2002 SPPA exceeded the1992 survey and was about the same as in 1982. Theresponse rate was 70 percent — similar to the rate inthe second half of 1992 (68 percent) when a similarquestionnaire was used.
Questions asked of respondents were consistentfrom 1992 to 2002 with the exception of several addi-tional questions asked about traveling to arts events andtime spent on the Internet viewing, discussing or learn-ing about the arts. DVD viewing was also added to the2002 SPPA media participation questions.
In 1997, the SPPA was conducted through a random-digit dial, telephone survey independent from any Cen-sus research studies. Data are not directly comparable to2002 because of the differences in data collection. Even
CHAPTER 1
Executive Summary

2002 Survey of Public Participation in the Arts
2
National Endowment for the Arts
though the methodology for the 2002 and 1992 surveysare more similar, comparisons should be made cautious-ly because of the change of sponsoring survey (NationalCrime Survey in 1992 versus Current Population Surveyin 2002) and different season for the study (surveys con-ducted each month in 1992 and only in August in 2002).It is unknown how the topic of prior questions may affectresponses to arts participation questions.
AttendanceThe SPPA has tracked attendance at certain performingarts events since 1982. Attendance rate trends were
examined for seven “benchmark” activities followed byanalysis of other live arts events.
Benchmark attendance. In the 12 months end-ing August 2002, 39 percent of U.S. adults attended atleast one of the following arts activities: jazz, classicalmusic, opera, musicals, plays, ballet or art museums.These seven activities identify a “benchmark” partici-pation rate for live arts attendance that the NEA hasmonitored since 1982. Although the 2002 rate is 2 percentage points below 1992’s rate of 41 percent, thisdifference is not statistically significant. The actualnumber of participants increased from 76 million to
Table 1.U.S. Adults Participating in the Arts at Least Once in a 12-month period: 1982, 1992, 2002
Percent of Adults Millions of AdultsAttending/Visiting/Reading Attending/Visiting/Reading
1982 1992 2002 1982 1992 2002
PERFORMING ARTSMUSIC
Jazz* 9.6 % 10.6 % 10.8 % 15.7 19.7 22.2Classical music* 13.0 12.5 11.6 21.3 23.2 23.8Opera* 3.0 3.3 3.2 4.5 6.1 6.6
PLAYSMusical plays* 18.6 17.4 17.1 30.5 32.3 35.1Non-musical plays* 11.9 13.5 12.3 19.5 25.1 25.2
DANCEBallet* 4.2 4.7 3.9 6.9 8.7 8.0Other dance1 NA 7.1 6.3 NA 13.2 12.1
VISUAL ARTSArt museums/galleries* 22.1 26.7 26.5 36.2 49.6 54.3Art/craft fairs and festivals 39.0 40.7 33.4 63.9 75.6 68.4
HISTORIC SITESParks/historic buildings/neighborhoods 37.0 34.5 31.6 60.6 64.1 64.7
LITERATUREPlays/poetry/novels/short stories 56.9 54.0 46.7 93.3 100.3 95.3
ANY BENCHMARK ACTIVITY 39.0 41.0 39.4 66.5 76.2 81.2
1 “Other dance” refers to dance other than ballet, including modern, folk and tap. “Other dance” was not included in the 1982 survey.* Denotes “benchmark” art activity.Note: Figures may differ slightly from those shown in other reports and notes due to rounding.
Source: 1982, 1992, and 2002 Surveys of Public Participation in the Arts.

2002 Survey of Public Participation in the Arts
3
National Endowment for the Arts
about 81 million reflecting the growth in the adult pop-ulation from 1992 to 2002.
As presented in Table 1, rates of attendance for mostarts activities have remained relatively constant since1982’s SPPA. There were no statistically significant dif-ferences between the percentages of adults attending in1992 versus 2002.
Other live arts attendance. In addition to theseven activities described above, survey respondentswere asked about going to arts and crafts fairs and fes-tivals and visits to historic sites. September 11 mayhave affected attendance at fairs, festivals and historicsites. Festival and fair attendance fell to 33 percent ofadults in 2002, 7 percentage points below 1992 and astatistically significant decline. This was the largestdecline of any live attendance event in the SPPA. Visitsto historic sites dropped from 34 percent of adults in1992 to approximately 32 percent in 2002, the secondlargest drop among live events. This decline was alsostatistically significant.
Other arts activity. The SPPA also asks aboutreading habits. In 2002, 56 percent of respondents indi-cated they had read a book during the previous 12months, about the same as in 1992. However, the per-centage of respondents reading literature, defined in thesurvey as plays, poetry, short stories or novels,decreased by 8 percentage points from 1992 to 2002(46 percent of 2002 respondents), a statistically signif-icant drop.
Broadcast and Recorded MediaAlthough the past decade saw impressive advances inmedia options for viewing and listening to the arts, thisform of arts participation experienced a relatively largedecrease from 1992. Participation via every type of lis-tening or viewing showed statistically significantdeclines. Even so, the percentage of adults reportingviewing or listening via broadcast and recorded mediaremained higher than live attendance. Table 2 exam-ines the percentage and number of adults viewing orlistening to different art forms, and, for the first time inthe SPPA, use of the Internet for learning about, listen-ing to, or discussing topics related to the arts.
TV, VCR or DVD viewing. Jazz, classical music,opera, musicals, plays, dance (including ballet) and
visual arts each experienced at least a 5 percentage pointdecline in respondents’ viewing of these art forms onbroadcast or cable TV, video or DVD from 1992 to 2002. The largest decline, from 34 to 25 percent, was forrespondents indicating they had watched a program aboutartists, art works, or art museums in the previous 12months.
The percentage of respondents who reported watch-ing non-musical plays and opera decreased by one-half.The percentage of adults viewing classical music per-formances declined from 26 percent in 1992 to 18 per-cent in 2002. Those viewing dance declined from 20 to12 percent of adults. Viewing of jazz and musicalsdeclined as well. Projecting these results to the adultpopulation in the U.S., the number of adults viewingthese art forms on TV, VCR or DVD declined from1992 to 2002.
Radio. The percentage of adults reporting that they listen to jazz, classical music, opera, musicals andplays on the radio declined from 1992 to 2002. Thoughnot as dramatic as for viewing performances on TV,declines were substantial. The largest absolutedecrease was for classical music, falling from 31 percent of adults listening on the radio in 1992 to 24percent in 2002. However, it should be noted that the49 million classical music listeners reported in 2002was still more than a third larger than the number in1982 (36 million).
Recordings. Classical music also saw the largestabsolute decline in the percentage of adults listening toaudio recordings, from 24 percent in 1992 to 19 percentin 2002. Other performing arts also experienced largedeclines in listening.
Internet. The 2002 SPPA asked several questionsregarding use of the Internet. About 53 percent ofrespondents said they use the Internet. A total of 19percent of all survey respondents (one-third of Internetusers) reported exploring at least one arts topic on theInternet.
Of the art forms, music is the most frequent topic ofInternet investigation, totaling 13 percent of respon-dents, or 27 million American adults. The second mostcommonly investigated arts topic on the Internet is lit-erature (9 percent of respondents), followed by visualarts (6 percent), theater (4 percent), dance (2 percent)and opera (1 percent).

2002 Survey of Public Participation in the Arts
4
National Endowment for the Arts
Table 2.U.S. Adults Who Watched or Listened to the Arts on TV, Radio,Recordings or the Internet in a 12-Month period: 1982, 1992, 2002
Percent of Adults Millions of AdultsListening or Watching Listening or Watching
1982 1992 2002 1982 1992 2002
PERFORMING ARTSMUSIC
JazzTV/VCR/DVD 18.0% 22.0% 16.4% 29.6 40.9 33.5Radio 18.0 28.0 23.5 30.4 52.0 48.0Audio recordings 20.0 21.0 17.2 32.4 39.0 35.2
Classical musicTV/VCR/DVD 25.0 26.0 18.1 40.8 48.3 37.0Radio 20.0 31.0 23.9 36.0 57.6 48.9Audio recordings 22.0 24.0 19.3 35.6 44.6 39.5
OperaTV/VCR/DVD 12.0 12.0 5.8 20.9 22.3 11.9Radio 7.0 9.0 5.7 11.2 16.7 11.7Audio recordings 8.0 7.0 5.5 12.5 13.0 11.3Internet, exploring opera NA NA 1.3 NA NA 2.7
Internet, exploring all types of music NA NA 13.1 NA NA 27.0
PLAYSMusicals
TV/VCR/DVD 21.0 17.0 11.7 29.8 31.6 24.0Radio 4.0 4.0 2.4 8.3 7.4 4.9Audio recordings 8.5 6.0 4.3 13.0 11.1 8.8
Non-musical playsTV/VCR/DVD 26.0 18.0 9.4 36.5 33.4 19.2Radio 4.0 3.0 2.1 6.4 5.4 4.3
Internet, exploring all types of theater NA NA 4.1 NA NA 8.4
DANCETV/VCR/DVD NA 20.0 12.6 NA 37.2 25.7Internet, exploring all types of dance NA NA 2.0 NA NA 4.1
VISUAL ARTSTV/VCR/DVD 23.0 34.0 25.0 43.3 63.2 51.0Internet, exploring visual arts NA NA 5.9 NA NA 12.1
LITERATUREListen to poetry or novels NA 16.6 12.4 NA 30.8 25.5Internet, exploring novels,
poetry or plays NA NA 9.2 NA NA 19.0
Source: 1982, 1992, and 2002 Surveys of Public Participation in the Arts.

2002 Survey of Public Participation in the Arts
5
National Endowment for the Arts
Personal Participation in the ArtsThe 2002 SPPA researched personal participation in thearts through questions on performing and creating art.
Performance and creation. Singing in a choir,chorale or other vocal group remained the most popularform of personal performance in 2002. With 9.8 millionadults participating, it had more than double the number of participants than any other type of personalperformance except dance. Weaving, sewing and otherneedlework remained the most popular among the
visual arts activities. Though these activities have relatively higher levels of participation than other performing arts or visual arts activities, both experi-enced statistically significant declines from 1992 to 2002.
Table 3 shows rates of personal performance and cre-ation of art in 1992 and 2002. Measured in millions ofadult participants, only photography, ballet, composingmusic and writing literature increased in activity from1992 to 2002. The percentage of adults who said thatthey had performed classical music in the past 12 months
dropped by one-half in 2002, from 4percent to 2 percent. Adults who per-formed dance other than balletdropped from 8 percent to 4 percent ofrespondents. Both declines are statisti-cally significant.
Classes. In the 2002 survey, more respondents took classes in theperforming arts in the prior 12 months(6 million adults) than in the visualarts (5 million). The most populartype of class was music — 2 percentof respondents reported that they hadtaken a music class in the past 12months (4 million adults).
SummaryTable 4 presents an aggregate view ofarts participation for the 2002 SPPAdata. About the same share of adultsparticipated in performing arts andvisual arts activities (about 59 per-cent) in the 12 months ending August2002. For performing arts, most adultsparticipated by watching or listeningto music, plays or dance on television,the radio, via audio recordings or theInternet. Over half of adults say theyhave viewed some type of performingarts media in the previous 12 months.Participation through attendance atlive events is smaller (32 percent),with more adults attending plays(musicals or non-musical plays) thanother types of performing arts events.
Table 3.U.S. Adults performing or creating art at Least Once in a 12-Month period: 1992 and 2002
Percent of Adults Millions of AdultsPersonally Performing Personally Performing
or Creating or Creating
1992 2002 1992 2002
PERFORMING ARTSMUSIC
Jazz 1.7 % 1.3 % 3.2 2.7Classical music 4.2 1.8 7.8 3.7Opera 1.1 0.7 2.0 1.4Choir/chorale 6.3 4.8 11.7 9.8Composing music 2.1 2.3 3.9 4.7
PLAYSMusical plays 3.8 2.4 7.1 4.9Non-musical plays 1.6 1.4 3.0 2.9
DANCEBallet 0.2 0.3 0.4 0.6Other dance1 8.1 4.2 15.0 8.6
VISUAL ARTSCREATING ART
Painting/drawing 9.6 8.6 17.8 17.6Pottery/jewelry 8.4 6.9 15.6 14.1Weaving/sewing 24.8 16.0 46.1 32.7Photography 11.6 11.5 21.6 23.5
OWN ORIGINAL ART 22.1 19.3 41.1 39.5
LITERATUREPlays/poetry/novels/
short stories 7.4 7.0 13.7 14.4
1 “Other dance” refers to dance other than ballet, including modern, folk and tap.
Source: 1992 and 2002 Surveys of Public Participation in the Arts.

2002 Survey of Public Participation in the Arts
6
National Endowment for the Arts
For the visual arts, participation is most often in theform of attending an art museum or gallery or an artsand crafts fair or festival. In addition, nearly 39 percentreport personally creating some type of visual art,though this includes ownership of an original artwork.
Approximately one-half of U.S. adults experienced“literature” in some way in 2002 (poetry, plays, novelsor short stories).
In sum, over 76 percent of adults have experiencedart in some form in the 12 months ending August of2002.
Additional Information from the 2002 SPPAAdditional Research Division reports will examine fur-ther topics such as differences in arts participation bygeographic area, age and educational levels. Thesereports will be available later in 2004. Current informa-tion on these and other Research Division reports andnotes can be found at www.arts.gov. The complete 2002SPPA dataset can be downloaded from the CulturalPolicy and the Arts National Data Base Archive websiteat www.cpanda.org, or ordered from the U.S. CensusBureau, Customer Services Center.
Research Division Reports and Notes of RelatedInterest can be found in Appendix E.
Table 4.Percentage of U.S. Adults Participating in the Arts at Least Once in the 12-month period Ending August 2002
Watched orAttended/ Listened to PersonallyVisited/ on TV/Radio/ Performed Took a All Forms of
Read Recordings/Internet or Created Class Participation
PERFORMING ARTS 31.7% 51.8% 12.6% 2.7% 59.0%
Music 18.8 47.9 8.1 1.8 51.9Plays 22.3 21.0 3.5 0.5 33.2Dance 8.7 13.7 4.3 0.8 20.5
VISUAL ARTS 41.9 26.3 38.9 1.7 58.8
HISTORIC SITES 31.6 NA NA NA NA
LITERATURE 46.7 18.2 7.0 1.0 50.0
ANY ARTS ACTIVITY 65.1% 56.0% 43.9% 4.8% 76.3%
Source: 2002 Survey of Public Participation in the Arts.
2002 Survey of Public Participation in the Arts
7
National Endowment for the Arts
The Survey of Public Participation of theArts (SPPA) collected arts participationdata from Americans in 1982, 1985,1992, 1997 and 2002. The 2002 SPPAsurveyed over 17,000 adults across the
United States.The SPPA examines a number of different types of
participation in the arts. The 2002 SPPA includedquestions about attendance at arts events; listening to orwatching arts on television, radio and recordings;exploring arts through the Internet; personally perform-ing or creating art; and taking arts-related classes.
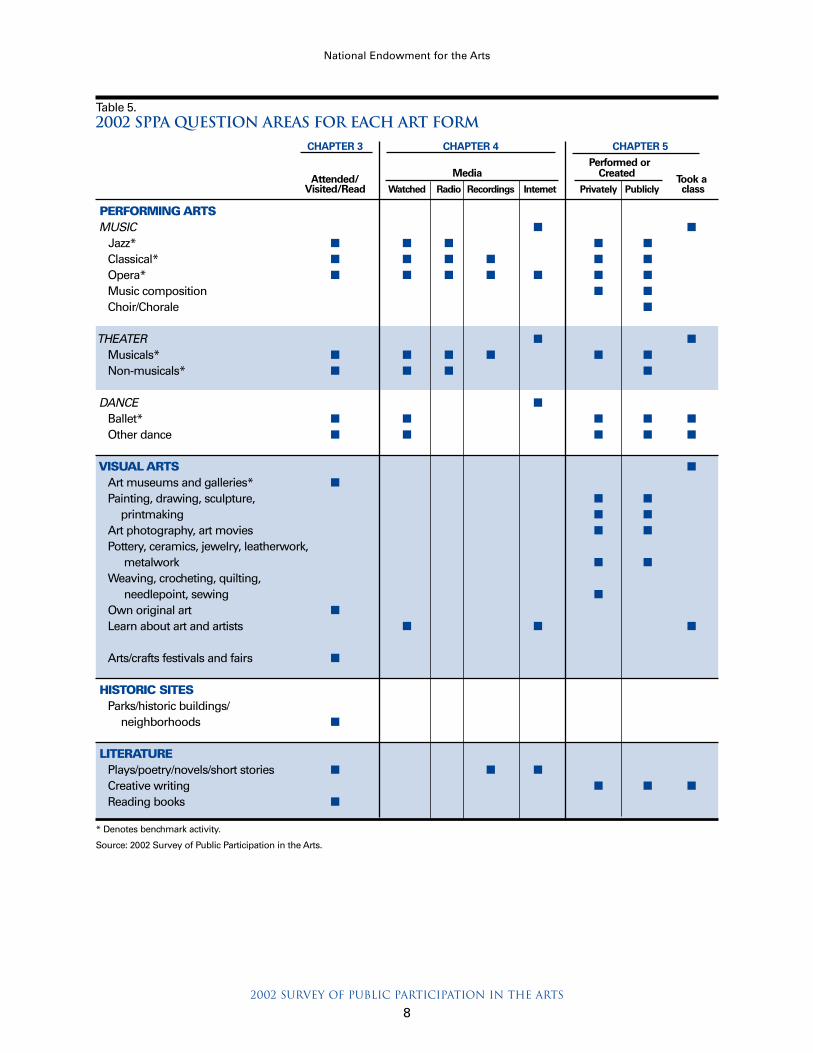
For art forms such as jazz and theater, many of thesedifferent types of participation were probed in the sur-vey. For art forms such as pottery, the SPPA onlyrecords whether someone created the art. Table 5 dis-plays the types of participation questions asked by artform and the section of the report that discusses eachitem.
Benchmark ActivitiesBecause the SPPA has added new art forms to each sur-vey, it is challenging to examine trends in arts atten-dance from one survey to another. To allow for easieranalysis of long-term trends, the SPPA has designatedcertain art forms as “benchmark” activities that areincluded in each survey since 1982.
“Benchmark attendance” counts attendance at oneor more of the following seven types of arts activities:jazz performance, classical music performance, opera,musical play, non-musical play, ballet and visits to anart museum or gallery. Table 5 identifies these bench-mark activities with an asterisk.
Data Collection MethodologySurvey approach. For the first time, the 2002 SPPAwas collected in conjunction with the U.S. Bureau of theCensus’ Current Population Survey (CPS). The U.S.Bureau of the Census surveys about 60,000 householdsper month in the CPS. Households are scientificallyselected to represent the socioeconomic characteristicsof the U.S. population.
The 2002 SPPA was conducted as a supplement tothe August 2002 CPS. In 1982 and 1992, the SPPA wascollected as a supplement to the National Crime Surveyover several months of the year. The National CrimeSurvey (now called the national Crime VictimizationSurvey) was also conducted by the U.S. Bureau of theCensus.
In the 2002 SPPA, 17,135 adults 18 and older wereinterviewed, primarily by telephone. Demographic dataincluding gender, income, educational level, age andrace/ethnicity were used in weighting the survey data sothat the results match characteristics of the total U.S.adult population. The U.S. Census Bureau determinedthe weight for each survey record.
The response rate to the survey was 70 percent, similar to the rate in the second half of 1992 (68 per-cent) when a similar questionnaire was used. Eventhough the SPPA may have been longer than most CPSsupplements, there were no irregular patterns in theresponse rate.
Appendix A presents information on the SPPA.Appendix B discusses the data collection proceduresfor both the CPS and SPPA supplement. Appendix Cbriefly discusses calculation of standard errors, hypoth-
CHAPTER 2
introduction
2002 Survey of Public Participation in the Arts
8
National Endowment for the Arts
Table 5.2002 SPPA Question Areas for Each Art Form
CHAPTER 3 CHAPTER 4 CHAPTER 5
Performed or
Attended/ Media Created Took aVisited/Read Watched Radio Recordings Internet Privately Publicly class
PERFORMING ARTSMUSIC n n
Jazz* n n n n n
Classical* n n n n n n
Opera* n n n n n n n
Music composition n n
Choir/Chorale n
THEATER n n
Musicals* n n n n n n
Non-musicals* n n n n
DANCE n
Ballet* n n n n n
Other dance n n n n n
VISUAL ARTS n
Art museums and galleries* n
Painting, drawing, sculpture, n n
printmaking n n
Art photography, art movies n n
Pottery, ceramics, jewelry, leatherwork, metalwork n n
Weaving, crocheting, quilting, needlepoint, sewing n
Own original art n
Learn about art and artists n n n
Arts/crafts festivals and fairs n
HISTORIC SITESParks/historic buildings/
neighborhoods n
LITERATUREPlays/poetry/novels/short stories n n n
Creative writing n n n
Reading books n
* Denotes benchmark activity.
Source: 2002 Survey of Public Participation in the Arts.

2002 Survey of Public Participation in the Arts
9
National Endowment for the Arts
esis tests and design effects for the 2002 SPPA. For adetailed description of CPS survey methodology, pleasesee the U.S. Census Bureau technical brief at: http://www.bls.census.gov/cps/tp/tp63.htm.
Comparison with previous SPPA results. TheSPPA surveys conducted in 1982 and 1992, also con-ducted by the U.S. Bureau of the Census, serve as thepoints of comparison for the 2002 SPPA. The 1997SPPA was a stand-alone telephone survey conducted bya private research firm. Because it employed a differentsampling plan (random-digit dial telephone survey), itsresults are not directly comparable to other SPPAs. The1997 Summary Report further explains why the 1997data cannot be compared with earlier surveys conduct-ed by the U.S. Bureau of the Census.
Changes and additions to 2002 survey ques-tions. The 2002 SPPA adds questions on DVD viewingand exploring different types of art through the Internet,activities that have grown in importance since 1992.Questions about trips taken to attend arts events werealso added in 2002. These new questions are includedin the survey instrument provided in Appendix D.
Tabulations. As with past SPPA reports, the surveyresults are for respondents providing an answer for aquestion, excluding those refusing to answer a questionor those replying “don’t know.” For most questions, thepercentage excluded was very small, with less than 0.5percent of survey respondents refusing to answer oranswering “don’t know” to specific questions.
Organization of the ReportThe remainder of this report is organized by type of artsparticipation, with a special section at the end of thereport providing one-page highlights for each of the“benchmark” art forms.
Attendance see Chapter 3
Media participation see Chapter 4
Personal performance and creation see Chapter 5
Leisure participation and arts preferences see Chapter 6
Geographic differences in arts participation see Chapter 7
Chapter 8 presents one-page summaries of SPPA find-ings for each of the benchmark activities — jazz, clas-sical music, opera, musicals, non-musical plays, balletand art museum or gallery attendance.
Each section examines changes from the 1992 SPPAas well as major differences in participation by age, gen-der, income, education level and ethnicity or race.
The 2002 SPPA examines U.S. adults’attendance at performing arts events, artmuseums and art fairs, and historic sites.The SPPA also studies reading habits.Attendance at “benchmark” activities has
been tracked in the SPPA since 1982. This section of the report begins by examining the
number of adults attending an art form at least once in12 months (Figure 1), the percentage of adults attend-
ing (Table 6) and number of attendances (Table 7,which includes one person going to an art form multipletimes).
Benchmark ActivitiesNearly one-third of adults reported going to at least onejazz, classical music, opera, musical, play or ballet per-formance during the 12 months ending August 2002, notincluding elementary or high school performances.
About one-quarter of adults said theyvisited an art museum or art gallery.Combined, 39 percent of adultsattended these types of events.Together, these seven events representthe benchmark activities trackedsince 1982.
The percentage of adults reportingthat they attended at least one of thebenchmark activities has been verystable over the past 20 years. In 1992,41 percent of survey respondents saidthat they had been to at least one ofthese seven types of events, not a sta-tistically significant difference fromthe 2002 attendance rate. In 1982, 39percent of survey respondents report-ed going to at least one of the bench-mark activities.
A stable rate of attendance com-bined with a growing adult populationmeans that the number of peopleattending benchmark arts activitieshas been increasing. In 1992, about
2002 Survey of Public Participation in the Arts
11
National Endowment for the Arts
CHAPTER 3
attendance at arts performances and events
0 10 20
Millions of US Adults
30 40
Musical Plays 35.1
Non-m usical Plays 25.2
Classical Music 23.8
Jazz 22.2
OtherDance 12.1
Ballet 8.0
Opera 6.6
1
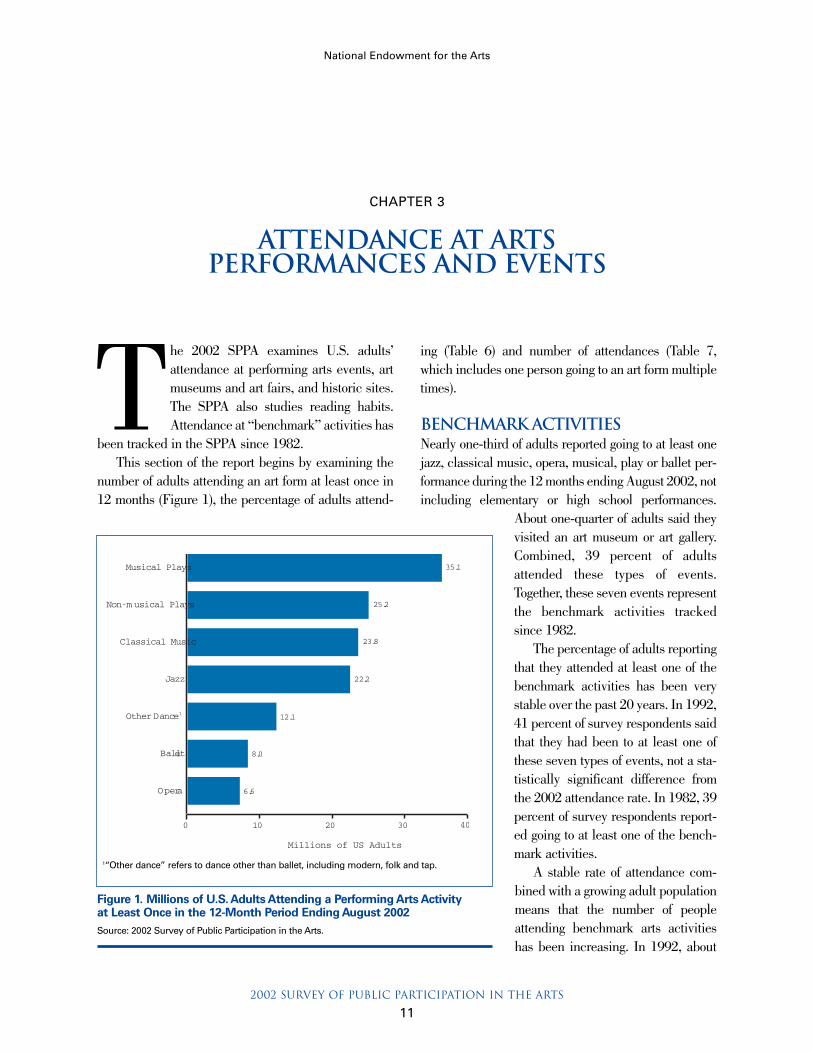
Figure 1. Millions of U.S. Adults Attending a Performing Arts Activity at Least Once in the 12-Month Period Ending August 2002Source: 2002 Survey of Public Participation in the Arts.
1“Other dance” refers to dance other than ballet, including modern, folk and tap.

2002 Survey of Public Participation in the Arts
12
National Endowment for the Arts
76 million adults attended at least one of the bench-mark activities. In 2002, about 81 million people wentto at least one benchmark event.
Performing ArtsThe performing arts attendance studied in the 2002SPPA includes each of the performing arts in the“benchmark” activities plus dance other than ballet (asurvey question added in 1992). Among these activi-ties, more people went to musicals from September2001 through August 2002 than any other type of per-
forming arts.1 As shown in Figure 1, about 35 millionadults went to musical plays during this period.
About 25 million adults attended non-musical playsin 2002, with somewhat smaller numbers attendingclassical music and jazz performances. Dance otherthan ballet, which includes modern, folk and tap, drew12 million adult attenders in 2002.
About 8 million adults went to at least one ballet
Table 6.U.S. Adults Participating in the Arts at Least Once in a 12-Month period: 1982, 1992, 2002
Percent of Adults Millions of AdultsAttending/Visiting/Reading Attending/Visiting/Reading
1982 1992 2002 1982 1992 2002
PERFORMING ARTSMUSIC
Jazz* 9.6 % 10.6 % 10.8 % 15.7 19.7 22.2Classical music* 13.0 12.5 11.6 21.3 23.2 23.8Opera* 3.0 3.3 3.2 4.5 6.1 6.6
PLAYSMusical plays* 18.6 17.4 17.1 30.5 32.3 35.1Non-musical plays* 11.9 13.5 12.3 19.5 25.1 25.2
DANCEBallet* 4.2 4.7 3.9 6.9 8.7 8.0Other dance1 NA 7.1 6.3 NA 13.2 12.1
VISUAL ARTSArt museums/galleries* 22.1 26.7 26.5 36.2 49.6 54.3Art/craft fairs and festivals 39.0 40.7 33.4 63.9 75.6 68.4
HISTORIC SITESParks/historic buildings/neighborhoods 37.0 34.5 31.6 60.6 64.1 64.7
LITERATUREPlays/poetry/novels/short stories 56.9 54.0 46.7 93.3 100.3 95.3
ANY BENCHMARK ACTIVITY 39.0 41.0 39.4 66.5 76.2 81.2
1 “Other dance” refers to dance other than ballet, including modern, folk and tap. “Other dance” was not included in the 1982 survey.* Denotes benchmark activity.Note: Figures may differ slightly from those shown in other reports and notes due to rounding.Source: 1982, 1992, and 2002 Surveys of Public Participation in the Arts.
1 Attendance in the 12 months ending August 2002 is often referred toas “2002 attendance” in this report even though it spans the period fromSeptember 2001 through August 2002.

2002 Survey of Public Participation in the Arts
13
National Endowment for the Arts
performance during this period, slightly more than thenumber that went to opera.
Note that these attendance data pertain to the num-ber of people attending at least once, not total atten-dance at all arts events. Someone going to the sympho-ny three times in a year is only counted once.
Table 6 compares audience size, in millions, for1982, 1992 and 2002. The table also displays the per-centage of adults attending different types of performingarts activities at least once in the prior 12 months.
Another way to examine attendance at performingarts events is by the number of times people attend atype of performance in a year. As in prior SPPA surveys,respondents who had attended a particular type of eventin the prior 12 months were asked to estimate the num-ber of times they had attended. Table 7 presents the
average number of attendances for each “attender” (anindividual who went at least once). Multiplying the totalaudience for each art form by the average number ofattendances yields an estimate of the total number ofattendances.
Musical plays lead all types of performing arts withan estimated 79 million attendances in 2002. The 35million people who went to a musical play at least onceattended an average of 2.3 musicals in 2002, the sameaverage as found in the 1992 SPPA.
Classical music had the second-highest number ofattendances among the types of performing arts in 2002— 72.8 million. The number of attendances per atten-der averaged 3.1 for classical music, higher than foundin 1992. Number of attendances grew by over 20 per-cent from 1992 to 2002.
Table 7.Average Number of Attendances and Total Number of Attendances: 1992 and 2002
1992 2002Average Total Average Total
number of number of number of number ofAudience in attendances attendances Audience attendances attendances
millions per attender in millions in millions per attender in millions
PERFORMING ARTSMUSIC
Jazz* 19.7 2.9 57.1 22.2 3.1 68.8Classical music* 23.2 2.6 60.3 23.8 3.1 72.8Opera* 6.1 1.7 10.4 6.6 2.0 13.3
PLAYSMusical plays* 32.3 2.3 74.5 35.1 2.3 79.3Non-musical plays* 25.1 2.4 60.2 25.2 2.3 58.7
DANCEBallet* 8.7 1.7 14.8 8.0 1.7 13.5Other dance1 13.2 3.0 39.6 12.1 2.0 24.6
VISUAL ARTSArt museums/galleries* 49.6 3.3 163.7 54.3 3.5 190.6Art/craft fairs and festivals 75.6 2.7 204.1 68.4 2.4 164.2
HISTORIC SITESParks/historic buildings/
neighborhoods 64.1 3.8 243.6 64.7 3.6 231.0
1 “Other dance” refers to dance other than ballet, including modern, folk and tap.* Denotes benchmark activity.Source: 1992 and 2002 Surveys of Public Participation in the Arts.

2002 Survey of Public Participation in the Arts
14
National Endowment for the Arts
Table 8.Demographic Distribution of U.S. Adults who attend/Visit/Read at Least Once in the 12-Month period ending august 2002
AnyU.S. Population Benchmark Classical Non-musicalMillions Percent Activity Jazz Music Opera Musicals Plays
GENDERMale 98.7 47.9% 44.2% 47.7% 42.7% 42.2% 39.1% 40.1%Female 107.2 52.1 55.8 52.3 57.3 57.8 60.9 59.9
Total 205.9 100.0 100.0 100.0 100.0 100.0 100.0 100.0
RACE AND ETHNICITYHispanic 22.7 11.0 6.5 6.3 5.2 6.1 4.5 5.5White* 150.1 72.9 80.5 77.0 86.2 86.4 85.4 84.1African American* 23.7 11.5 8.1 13.5 4.5 3.8 6.9 6.6Other* 9.5 4.6 4.9 3.1 4.1 3.6 3.2 3.7
Total 205.9 100.0 100.0 100.0 100.0 100.0 100.0 100.0
AGE18-24 26.8 13.0 11.8 12.7 8.8 8.3 11.3 12.025-34 36.9 17.9 18.0 18.0 14.0 17.0 16.2 15.535-44 44.2 21.5 23.0 25.8 19.8 18.9 23.9 22.645-54 39.0 18.9 22.1 24.4 24.9 24.0 21.4 23.455-64 25.9 12.6 13.0 10.3 17.0 16.8 14.5 14.165-74 17.6 8.5 7.7 6.1 9.3 10.7 8.3 9.175 and over 15.5 7.5 4.4 2.7 6.2 4.4 4.5 3.3
Total 205.9 100.0 100.0 100.0 100.0 100.0 100.0 100.0
EDUCATIONGrade School 11.6 5.6 1.1 0.5 0.7 0.4 0.5 0.5Some High School 20.1 9.8 3.4 2.4 1.6 2.6 2.4 2.9High School Graduate 63.8 31.0 19.5 15.2 12.2 8.3 16.5 14.4Some College 56.9 27.6 31.4 31.5 27.5 24.1 31.3 28.6College Graduate 36.1 17.5 28.5 31.5 33.1 35.5 30.8 31.9Graduate School 17.4 8.5 16.2 18.9 24.9 29.1 18.5 21.7
Total 205.9 100.0 100.0 100.0 100.0 100.0 100.0 100.0
INCOME**Less than $10K 14.4 7.0 4.1 3.6 4.4 3.2 3.4 3.4$10K to $20K 22.7 11.0 6.8 6.0 5.5 6.4 5.8 5.4$20K to $30K 25.0 12.1 8.7 7.8 7.2 7.0 6.7 6.6$30K to $40K 24.2 11.8 11.5 13.1 11.3 10.7 10.2 10.6$40K to $50K 17.6 8.5 9.4 9.0 10.5 7.1 8.9 9.4$50K to $75K 34.7 16.9 21.3 19.3 19.7 20.2 23.2 21.2$75K and over 45.8 22.2 38.2 41.2 41.5 45.3 41.8 43.5
Total 205.9 100.0 100.0 100.0 100.0 100.0 100.0 100.0
* Not including Hispanics** Distribution by income differs from percentages reported in Research Note #82 as Note #82 includes “unreported income” as a separate category. 21.5 million adults did not report their income in the August 2002 CPS.Note: Total may not equal 100.0 percent due to rounding.Source: 2002 Survey of Public Participation in the Arts.

2002 Survey of Public Participation in the Arts
15
National Endowment for the Arts
Survey results suggest that the number of atten-dances declined for non-musical plays, ballet and otherdance between 1992 and 2002.
The following discussion examines the audience fordifferent performing arts. Types of performing arts arepresented in order of the number of adults attending atleast once in 2002.
Musical plays. One out of every six adults went toat least one performance of a musical play in the 12months ending August 2002. This 17 percent rate ofattendance was unchanged from 1992. The number ofadults attending musicals at least once per year is grow-ing over the past 20 years solely due to increases in theadult population.
More women than men attend musicals. As shownin Table 8, women comprised over 60 percent of peo-ple attending musicals in 2002. About one-half ofattenders were college graduates or people with gradu-ate education.2
Table 9 examines attendance rates by specificdemographic group. For example, 38 percent of peoplewith graduate education attended musicals comparedwith 9 percent of adults with no formal educationbeyond a high school degree. Table 9 also shows thatattendance for performing arts is much more closelycorrelated with education than income.
The age groups of people most likely to see musicalplays are those 35 to 64 years of age. People 35 to 44are just as likely to see a musical at least once a year asadults 55 to 64, and more likely than younger adults oradults over 65.
Non-Hispanic whites are most likely to attend amusical and Hispanics are least likely to go to a musi-cal play.
Non-musical plays. About one out of every eightadults went to a non-musical play in 2002. There wasno statistically significant change from the rate of atten-dance in 1992. The number of people attending non-musical plays at least once in a year was stable between1992 and 2002.
Art FairsArt Other Historic and
Ballet Museum Dance Literature Sites Festivals
31.6% 44.5% 38.2% 38.6% 46.4% 38.8%68.4 55.5 61.8 61.4 53.6 61.2
100.0 100.0 100.0 100.0 100.0 100.0
4.6 6.7 9.7 6.2 6.0 6.788.2 81.2 79.0 80.3 83.1 83.04.5 6.4 7.6 9.1 6.5 6.82.7 5.7 3.7 4.3 4.4 3.5
100.0 100.0 100.0 100.0 100.0 100.0
8.8 11.6 12.8 11.9 11.7 11.416.2 18.1 16.7 18.3 18.9 18.027.2 22.2 23.6 21.4 24.3 23.825.1 23.5 24.0 20.9 22.8 22.010.8 13.2 12.0 13.2 12.6 13.27.4 7.6 7.3 8.3 6.6 8.04.4 3.8 3.6 5.9 3.1 3.5
100.0 100.0 100.0 100.0 100.0 100.0
0.6 1.0 2.0 1.7 1.1 1.41.9 2.8 2.7 4.9 3.5 4.19.3 16.6 16.5 25.0 19.9 23.9
27.7 30.2 31.8 31.3 32.0 31.732.3 30.7 27.3 23.7 28.3 25.828.1 18.6 19.7 13.4 15.2 13.1
100.0 100.0 100.0 100.0 100.0 100.0
3.0 3.6 3.2 5.3 3.4 4.55.8 6.3 7.3 9.8 5.6 7.78.1 8.1 8.0 10.8 8.7 9.79.1 11.2 12.4 12.2 11.5 12.78.8 8.9 8.6 9.7 9.6 9.7
20.4 21.1 22.0 20.8 22.6 22.244.8 40.7 38.5 31.6 38.6 33.5
100.0 100.0 100.0 100.0 100.0 100.0 2 The profile of performing arts audience from the SPPA will differ froma snapshot of people attending a typical performance. The SPPA exam-ines characteristics of people attending at least one event in a year. Theprofile of people sitting in any one performance is more influenced bythose who regularly attend that type of event. As a result, the SPPA pro-file of attendance understates the importance of education in predictingwho will attend an art event.

2002 Survey of Public Participation in the Arts
16
National Endowment for the Arts
The demographic profile of people attending non-musical plays at least once a year is similar to that formusicals. More women than men attend. People ages35 to 54 account for nearly one-half of adults attendingat least once a year. As with musicals, Table 8 examines
the demographic distribution of adults attending non-musical plays.
Rates of attendance by demographic group areshown in Table 9. For each demographic group, fewerpeople attend non-musical plays in a year than go to
Table 9.Rates at Which U.S. Adults Attend/Visit/Read by Demographic Group, 2002(Percentage Participating at Least Once in a 12-Month period ending August 2002)
AnyBenchmark Classical Non-musical
Activity Jazz Music Opera Musicals Plays Ballet
ALL ADULTS 39.0% 10.8% 11.6% 3.2% 17.1% 12.3% 3.9%
GENDERMale 36.4% 10.7% 10.3% 2.8% 14.0% 10.3% 2.5%Female 42.2 10.8 12.7 3.5 20.0 14.2 5.1
RACE AND ETHNICITYHispanic 23.1 6.2 5.5 1.8 6.9 6.2 1.6White* 43.6 11.4 13.7 3.8 20.1 14.2 4.7African American* 27.8 12.7 4.5 1.1 10.3 7.1 1.5Other* 41.8 7.3 10.3 2.5 11.9 10.0 2.3
AGE18-24 35.9 10.5 7.8 2.0 14.8 11.4 2.625-34 39.6 10.8 9.0 3.0 15.4 10.7 3.535-44 42.2 13.0 10.7 2.8 19.1 13.0 4.945-54 46.0 13.9 15.2 4.0 19.3 15.2 5.155-64 40.6 8.8 15.6 4.2 19.7 13.8 3.365-74 35.3 7.6 12.5 4.0 16.6 13.0 3.375 and over 23.2 3.9 9.5 1.8 10.1 5.4 2.2
EDUCATIONGrade School 7.3 0.9 1.5 0.2 1.6 1.1 0.4Some High School 13.6 2.7 1.9 0.8 4.1 3.7 0.8High School Graduate 24.8 5.3 4.5 0.8 9.1 5.7 1.2Some College 44.8 12.2 11.5 2.8 19.4 12.7 3.9College Graduate 64.1 19.4 21.9 6.4 30.2 22.5 7.2Graduate School 75.8 24.0 34.1 10.9 37.6 31.8 12.9
INCOMELess than $10K 21.2 5.1 6.7 1.3 7.6 5.3 1.5$10K to $20K 22.2 5.4 5.2 1.6 8.2 5.4 1.9$20K to $30K 25.9 6.3 6.3 1.6 8.6 6.0 2.4$30K to $40K 35.3 10.9 10.3 2.6 13.6 10.0 2.8$40K to $50K 39.6 10.3 12.9 2.4 16.1 12.2 3.6$50K to $75K 45.5 11.2 12.4 3.4 21.5 14.0 4.3$75K and over 61.8 18.2 19.9 5.8 29.3 21.8 7.2
* Not including Hispanics.Source: 2002 Survey of Public Participation in the Arts.
2002 Survey of Public Participation in the Arts
17
National Endowment for the Arts
musicals. Among all age groups, individuals 45 to 54 years of age are most likely to attend a non-musicalplay at least once a year.
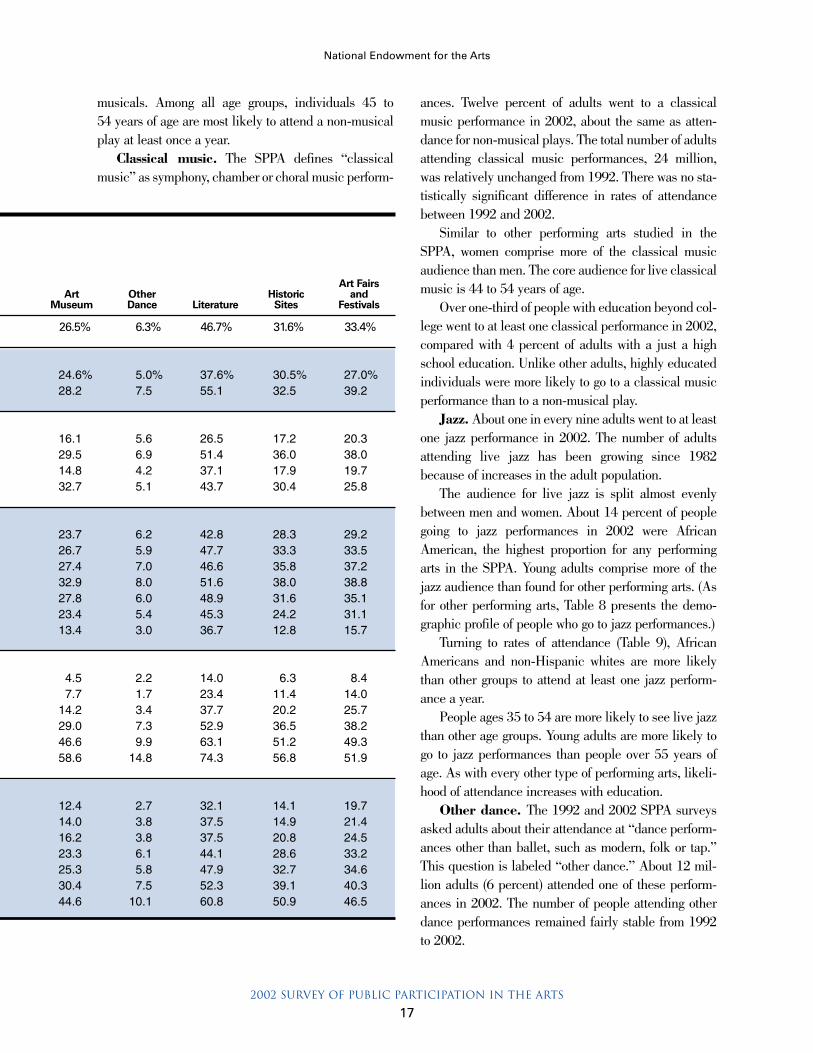
Classical music. The SPPA defines “classicalmusic” as symphony, chamber or choral music perform-
ances. Twelve percent of adults went to a classicalmusic performance in 2002, about the same as atten-dance for non-musical plays. The total number of adultsattending classical music performances, 24 million,was relatively unchanged from 1992. There was no sta-tistically significant difference in rates of attendancebetween 1992 and 2002.
Similar to other performing arts studied in theSPPA, women comprise more of the classical musicaudience than men. The core audience for live classicalmusic is 44 to 54 years of age.
Over one-third of people with education beyond col-lege went to at least one classical performance in 2002,compared with 4 percent of adults with a just a highschool education. Unlike other adults, highly educatedindividuals were more likely to go to a classical musicperformance than to a non-musical play.
Jazz. About one in every nine adults went to at leastone jazz performance in 2002. The number of adultsattending live jazz has been growing since 1982because of increases in the adult population.
The audience for live jazz is split almost evenlybetween men and women. About 14 percent of peoplegoing to jazz performances in 2002 were AfricanAmerican, the highest proportion for any performingarts in the SPPA. Young adults comprise more of thejazz audience than found for other performing arts. (Asfor other performing arts, Table 8 presents the demo-graphic profile of people who go to jazz performances.)
Turning to rates of attendance (Table 9), AfricanAmericans and non-Hispanic whites are more likelythan other groups to attend at least one jazz perform-ance a year.
People ages 35 to 54 are more likely to see live jazzthan other age groups. Young adults are more likely togo to jazz performances than people over 55 years ofage. As with every other type of performing arts, likeli-hood of attendance increases with education.
Other dance. The 1992 and 2002 SPPA surveysasked adults about their attendance at “dance perform-ances other than ballet, such as modern, folk or tap.”This question is labeled “other dance.” About 12 mil-lion adults (6 percent) attended one of these perform-ances in 2002. The number of people attending otherdance performances remained fairly stable from 1992to 2002.
Art FairsArt Other Historic and
Museum Dance Literature Sites Festivals
26.5% 6.3% 46.7% 31.6% 33.4%
24.6% 5.0% 37.6% 30.5% 27.0%28.2 7.5 55.1 32.5 39.2
16.1 5.6 26.5 17.2 20.329.5 6.9 51.4 36.0 38.014.8 4.2 37.1 17.9 19.732.7 5.1 43.7 30.4 25.8
23.7 6.2 42.8 28.3 29.226.7 5.9 47.7 33.3 33.527.4 7.0 46.6 35.8 37.232.9 8.0 51.6 38.0 38.827.8 6.0 48.9 31.6 35.123.4 5.4 45.3 24.2 31.113.4 3.0 36.7 12.8 15.7
4.5 2.2 14.0 6.3 8.47.7 1.7 23.4 11.4 14.0
14.2 3.4 37.7 20.2 25.729.0 7.3 52.9 36.5 38.246.6 9.9 63.1 51.2 49.358.6 14.8 74.3 56.8 51.9
12.4 2.7 32.1 14.1 19.714.0 3.8 37.5 14.9 21.416.2 3.8 37.5 20.8 24.523.3 6.1 44.1 28.6 33.225.3 5.8 47.9 32.7 34.630.4 7.5 52.3 39.1 40.344.6 10.1 60.8 50.9 46.5

2002 Survey of Public Participation in the Arts
18
National Endowment for the Arts
Both formal education and income play a large partin predicting other dance performance attendance.People with high incomes (over $75,000) and those whoattended graduate school are more likely to attend thesetypes of dance performances.
Ballet. The total audience for live ballet perform-ances is considerably smaller than other types of per-forming arts. About 8 million people (4 percent ofadults) went to a ballet performance in 2002.
Women comprise much more of the ballet audiencethan found for other performing arts. In 2002, more thantwo-thirds of ballet attenders were female. The balletaudience also has the smallest representation of racialand ethnic minorities — in 2002, 88 percent of atten-ders were non-Hispanic whites. Over 52 percent of theaudience was between the ages of 35 and 54.
Attendance of ballet performances reached 13 per-cent for people with a graduate education, the highestmarket penetration rate of any demographic segmentstudied for ballet. Only one out of every 80 adults witha high school education went to the ballet in 2002.
Opera. Three percent of adults go to opera at leastonce per year, a rate that has been constant since 1992.Because of growth in the adult population, the totalnumber of opera-goers increased to about 7 millionpeople in 2002.
About 58 percent of the audience for live opera isfemale. Two-thirds of the opera audience has at least acollege degree. More than 10 percent of adults with agraduate education went to the opera at least once in2002. Fewer than one in one hundred adults with a highschool education went to opera in 2002.
People 45 to 74 are the most likely to attend opera.One-third of the opera audience is at least 55 years ofage or older, making the opera audience among the old-est of any of the performing arts.
Visual ArtsThe SPPA includes questions concerning visits to artmuseums or galleries and attendance at art and craftfestivals or fairs.
Art museums and galleries. About one-quarter ofadults visited an art museum or art gallery in 2002, thesame rate as recorded in 1992. Because of growth in theadult population, the total number of people going to artmuseums or galleries increased from 50 million in 1992
to 54 million in 2002. Table 6 shows these trends.Among adults going to an art museum or art gallery
at least once in 2002, 55 percent were women. Almostone-half of art museum and art gallery adult attendersare between 35 and 54 years of age. As with the per-forming arts, Table 8 presents the demographic profileof people going to an art museum or art gallery at leastonce in the 12 months ending August 2002.
As shown in Table 9, nearly 60 percent of peoplewith a graduate education went to an art museum or artgallery in 2002. Differences in attendance based onlevel of education exceed differences between incomegroups.
People ages 45 to 54 are the most likely to go tothese types of institutions.
The race and ethnic group most likely to go to artmuseums or art galleries is “other races/ethnicities,”defined as non-Hispanics of races other than white andAfrican American (mostly Asian Americans and NativeAmericans). African Americans were the least likely togo to an art museum or art gallery in 2002.
Art and craft fairs and festivals. The percentageof adults going to art and craft fairs or festivals declinedsharply in the 12 months ending August 2002 comparedwith 1992. In 1992, about 40 percent of adults went toat least one arts fair or festival. In 2002, only 33 percentof adults went to these events. This decrease is statisti-cally significant. The total audience declined from 76million people (attending at least once) in 1992 to 68million people in 2002. This decline may be due in partto changes in event attendance after September 11.
Whites are much more likely to attend art fairs andfestivals than other ethnicities, and women are morelikely to attend than men. People ages 35 to 54 are theage group most likely to attend these fairs and festivals.As income and level of formal education increase, sodoes the likelihood of attending art festivals.
Historic SitesVisits to historic sites dropped from 34 percent of adultsin 1992 to about 32 percent in 2002, the second largestdrop among live events. This decline is statistically sig-nificant. Changes in travel behavior after September 11may have affected attendance at historic sites. Table 6presents data for rates of attendance at historic sites andtotal attendance among U.S. adults.

2002 Survey of Public Participation in the Arts
19
National Endowment for the Arts
Women and men visit historic sites in relativelyeven numbers. Non-Hispanic whites are far more like-ly to visit historic sites than African Americans orHispanics.
LiteratureThe SPPA also asks about reading habits. In 2002, 56percent of respondents indicated they had read a bookduring the previous 12 months, about the same as in1992. However, the percentage of respondents reading“literature” (defined as plays, poetry or novels) was only47 percent of adults in 2002. The share of adults read-ing literature dropped by 7 percentage points from1992 to 2002, a statistically significant change.
Women read literature in greater numbers thanmen. Only respondents without formal educationbeyond grade school had a participation rate under 20percent. Younger adults (under 45) are more likely toread literature than older adults.
Influence of Education on Arts AttendanceMore than any other demographic factor, going to artsevents and art museums is highly correlated with anindividual’s educational attainment. Education is muchmore predictive of arts attendance than householdincome, for example.
In turn, educational attainment is a proxy for manyother factors including early introduction to the artsthrough parents and schools, formal arts training, prox-imity to arts offerings, and a number of social factors.Separate monographs using 2002 SPPA data will focuson education and arts attendance. The Summary Reportonly briefly touches on this relationship.
Own education. Figure 2 shows the percentage ofrespondents by educational level that attended at leastone benchmark activity in 2002. The proportion of peo-ple attending at least one benchmark activity steadilyincreases with each additional level of educationalattainment. Adults with a graduate school education areten times as likely to go to the arts as someone with agrade school education.
Figure 3 illustrates the strength of the relationshipbetween education and participation for specific artforms. A ratio comparing the attendance of adults witha college degree (and beyond) to adults with a high
Figure 2. Percentage of U.S. Adults Attending at LeastOne Benchmark Activity by Education, 2002Source: 2002 Survey of Public Participation in the Arts.
Figure 3. Rate at Which U.S. Adults With at Least aCollege Degree Attend/Visit/Read Compared WithAdults With a High School Degree, 2002Source: 2002 Survey of Public Participation in the Arts.
1 “Other dance” refers to dance other than ballet, including modern, folk and tap.Note: A ratio of “10” means that people with at least a college degree attend at 10 times therate of people with just a high school degree. A ratio of “1” means that both groups attend atequal rates.
2002 Survey of Public Participation in the Arts
20
National Endowment for the Arts
school degree was computed for each arts event. Thisratio was 9.9 for opera, which means that an adult withat least a college degree is about 10 times more likelyto attend opera than an adult with only a high schooleducation. The ratio for literature is only 1.8, whichmeans that a college graduate is about twice as likely toread literature as someone with a high school diploma.
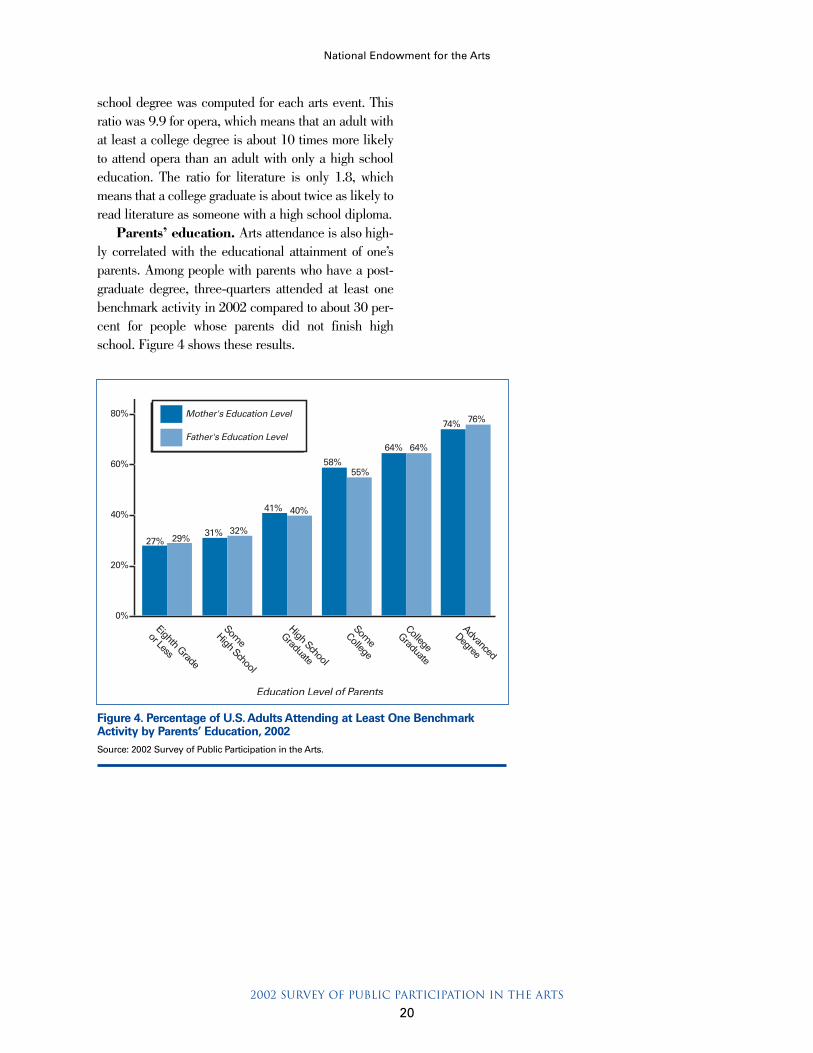
Parents’ education. Arts attendance is also high-ly correlated with the educational attainment of one’sparents. Among people with parents who have a post-graduate degree, three-quarters attended at least onebenchmark activity in 2002 compared to about 30 per-cent for people whose parents did not finish highschool. Figure 4 shows these results.
Figure 4. Percentage of U.S. Adults Attending at Least One BenchmarkActivity by Parents’ Education, 2002Source: 2002 Survey of Public Participation in the Arts.

2002 Survey of Public Participation in the Arts
21
National Endowment for the Arts
The 2002 SPPA assessed participation inthe arts through different media such astelevision, radio, audio recordings and theInternet. In 2002, 56 percent of adultswatched, listened or explored the arts
through some form of media. The total arts audience viamedia was 114 million adults, led by participation inmusic (classical, jazz and opera). However, participa-tion via the media fell sharply from 1992 to 2002. Thissection describes each art form’s media participation indetail, first discussing performing arts and visual arts,and then literature and use of the Internet.
Performing Arts The SPPA asks respondents separate questions for eachform of media: television (including VCR and DVDviewing), radio, audio recordings and the Internet.Questions on Internet use are new to the 2002 survey.In descending order, the most listened to or watchedperforming arts are:
• Classical music;• Jazz;• Musical plays;• Dance (including ballet and other dance);• Non-musical plays; and• Opera.
Table 10 shows the media audience for each type ofperforming arts in millions. The table also shows thepercentage of adults who used media to explore differ-ent art forms.
Classical music. Classical music ranks first among theperforming arts for all three traditional types of media
participation. Table 10 examines television viewing(including VCR and DVD), listening to the radio andlistening to audio recordings for classical music.
Percentage of adults participating via media. Morepeople watch or listen to classical music than any othertype of performing arts. About one-quarter of adultsreported listening to classical music on the radio in2002. About one in five people said that they listenedto classical music recordings and a similar percentageviewed some type of classical music performance ontelevision, video or DVD recordings.
Although classical music leads other performingarts in media use, it also experienced the greatestdeclines in media use from 1992 to 2002. The percent-age of people viewing classical music on televisiondeclined 8 percentage points, radio listening dropped 7percentage points and listening to audio recordings fellby 5 percentage points. All declines in media viewing,classical music included, are statistically significant.
More women than men listen to or watch classicalmusic, as shown in Table 11. Nearly one-quarter ofadults who listen to classical music on the radio arebetween 45 and 54 years of age.
As with other types of participation in classicalmusic, highly educated individuals are far more likelyto listen or watch classical music performances viamedia (see Table 12). Over one-half of people surveyedwho had a graduate education reported listening to clas-sical music on the radio compared with only 15 percentof respondents who had completed high school but notattended college.
Adults 18 to 24 years old are the age group leastlikely to experience classical music via media. African
CHAPTER 4
participation via media

2002 Survey of Public Participation in the Arts
22
National Endowment for the Arts
Table 10.U.S. Adults Who Watched or Listened to the Arts on TV, Radio,Recordings or the Internet in a 12-Month period: 1982, 1992, 2002
Percent of Adults Millions of AdultsListening or Watching Listening or Watching
1982 1992 2002 1982 1992 2002
PERFORMING ARTSMUSIC
JazzTV/VCR/DVD 18.0% 22.0% 16.4% 29.6 40.9 33.5Radio 18.0 28.0 23.5 30.4 52.0 48.0Audio recordings 20.0 21.0 17.2 32.4 39.0 35.2
Classical musicTV/VCR/DVD 25.0 26.0 18.1 40.8 48.3 37.0Radio 20.0 31.0 23.9 36.0 57.6 48.9Audio recordings 22.0 24.0 19.3 35.6 44.6 39.5
OperaTV/VCR/DVD 12.0 12.0 5.8 20.9 22.3 11.9Radio 7.0 9.0 5.7 11.2 16.7 11.7Audio recordings 8.0 7.0 5.5 12.5 13.0 11.3Internet, exploring opera NA NA 1.3 NA NA 2.7
Internet, exploring all types of music NA NA 13.1 NA NA 27.0
PLAYSMusicals
TV/VCR/DVD 21.0 17.0 11.7 29.8 31.6 24.0Radio 4.0 4.0 2.4 8.3 7.4 4.9Audio recordings 8.5 6.0 4.3 13.0 11.1 8.8
Non-musical playsTV/VCR/DVD 26.0 18.0 9.4 36.5 33.4 19.2Radio 4.0 3.0 2.1 6.4 5.4 4.3
Internet, exploring all types of theater NA NA 4.1 NA NA 8.4
DANCETV/VCR/DVD NA 20.0 12.6 NA 37.2 25.7Internet, exploring all types of dance NA NA 2.0 NA NA 4.1
VISUAL ARTSTV/VCR/DVD 23.0 34.0 25.0 43.3 63.2 51.0Internet, exploring visual arts NA NA 5.9 NA NA 12.1
LITERATUREListen to poetry or novels NA 16.6 12.4 NA 30.8 25.5Internet, exploring novels,
poetry or plays NA NA 9.2 NA NA 19.0
Note: Not all questions were asked in 1982 and 1992.
Source: 1982, 1992, and 2002 Surveys of Public Participation in the Arts.

2002 Survey of Public Participation in the Arts
23
National Endowment for the Arts
Americans have lower rates of media participation forclassical music than other racial/ethnic groups.
Frequency of viewing. People who watched classicalmusic programs on TV or video in the 12 months end-ing August 2002 saw an average of about seven pro-grams during this time period, slightly more than in1992. However, because of the large decline in numberof adults watching these programs, the total number ofviewings (audience total multiplied by average numberof viewings) declined from 309 million in 1992 to 251million in 2002. Table 13 examines frequency of view-ing for 1992 and 2002.
Jazz. Jazz draws a slightly smaller television, radio andrecording audience than classical music, but leads allperforming arts in total number of viewings.
Percentage of adults participating via media. As withclassical music, the most popular way of accessing jazzthrough electronic media is radio. About 24 percent ofadults listened to jazz on the radio in 2002. One in sixadults listened to jazz recordings and an equal numberwatched at least one jazz program on television in 2002.
Similar to media participation for all other art forms,participation in jazz through television, radio or record-ings markedly declined from 1992 to 2002.
Jazz is the one performing art form where men andwomen participate equally when watching programs andlistening to radio and recordings, as shown in Table 11.
African Americans participate in all three mediaforms for jazz at higher rates than other groups (seeTable 12).
Most age groups are much more likely to listen tojazz on the radio than to watch a television program onjazz or listen to jazz recordings.
Compared with adults who only have a high schooleducation, people with a college degree are three timesmore likely to listen to jazz recordings and twice as like-ly to listen to jazz on the radio or watch jazz programson television.
Frequency of viewing. Among people watching per-forming arts on television or video, the jazz audiencewatches the most frequently (seven times in 2002). Aswith classical music, the average number of jazz view-ings increased from 1992 to 2002. The increase was notenough to keep the total number of viewings fromdeclining, however. Table 13 shows these results.
Musical plays. Media audience size for musicals ranksbehind classical music and jazz, but before dance. Aswith other art forms, the number of adults watchingmusicals on television, listening on the radio or listen-ing to recordings of musicals declined from 1992 to2002.
Percentage of adults participating via media.Approximately 24 million adults, about 12 percent ofthe adult population, reported watching at least onemusical on television, VCR or DVD in 2002.Audiences for radio and recordings are much smaller.About 2 percent reported listening to a musical on theradio and 4 percent reported listening to a recording ofa musical.
More women than men watch musicals and listen torecordings of musicals, with an audience that is 63 per-cent female for each type of media.
Education is as influential in predicting who watch-es or listens to musicals as it is for other art forms.
Frequency of viewing. The average number of view-ings per audience member was about the same in 1992and 2002. In 2002, the average number of viewings ofmusicals was 4.6, very close to the 4.3 average found in1992. Because the total number of viewing adultsdeclined, the total number of musical viewingsdecreased from 135.9 million in 1992 to 110.2 millionin 2002. Table 13 displays these trends.
Dance. The SPPA question concerning media partici-pation for dance asked respondents if they had watcheddance, such as ballet, modern, folk or tap, on television,on tape, or on a DVD in the last 12 months. This wasthe only media participation question asked for dance.
Percentage of adults participating via media. About13 percent of respondents reported watching dance ontelevision in 2002.
The audience for viewing dance on television isabout two-thirds female. Adults ages 55 to 74 are mostlikely to watch, as are those with more education.However, the influence of education and income on whowatches dance on television is somewhat smaller thanfor other art forms.
Frequency of viewing. The average number of view-ings of dance decreased from 6.3 average viewings in1992 to 4.9 viewings in 2002. With both a drop in thenumber of viewers and the average viewings per year,

2002 Survey of Public Participation in the Arts
24
National Endowment for the Arts
Table 11.Demographic Distribution of U.S. Adult Participating in the Arts Through Media at least Once in the 12-Month period ending august 2002
U.S. Adult Population JAZZ CLASSICAL
Millions Percent Watch TV Radio Recordings Watch TV Radio Recordings W
GENDERMale 98.7 47.9% 47.8% 48.4% 47.6% 40.8% 43.8% 39.8%Female 107.2 52.1 52.2 51.6 52.4 59.2 56.2 60.2
Total 205.9 100.0 100.0 100.0 100.0 100.0 100.0 100.0
RACE AND ETHNICITYHispanic 22.7 11.0 8.3 6.5 5.8 6.9 7.1 5.2White* 150.1 72.9 69.3 72.8 73.5 80.9 81.9 84.9African American* 23.7 11.5 18.1 16.3 15.7 6.5 6.2 5.1Other* 9.5 4.6 4.3 4.4 5.0 5.7 4.7 4.9
Total 205.9 100.0 100.0 100.0 100.0 100.0 100.0 100.0
AGE18-24 26.8 13.0 8.4 8.9 9.8 6.4 7.5 9.425-34 36.9 17.9 15.0 18.2 18.2 12.3 15.9 16.835-44 44.2 21.5 23.1 25.6 26.3 18.8 21.4 21.345-54 39.0 18.9 23.8 23.9 24.0 21.8 23.7 22.755-64 25.9 12.6 13.0 13.0 12.3 16.6 15.6 15.065-74 17.6 8.5 9.7 6.7 5.9 13.3 9.5 9.275 and over 15.5 7.5 6.9 3.8 3.4 10.7 6.5 5.5
Total 205.9 100.0 100.0 100.0 100.0 100.0 100.0 100.0
EDUCATIONGrade School 11.6 5.6 1.8 1.1 0.8 2.1 1.5 1.3Some High School 20.1 9.8 4.8 4.2 3.3 3.9 3.5 2.5High School Graduate 63.8 31.0 21.3 19.5 17.6 20.6 18.9 15.5Some College 56.9 27.6 32.2 32.0 31.3 30.3 30.0 30.0College Graduate 36.1 17.5 25.7 27.8 30.1 25.7 27.8 31.1Graduate School 17.4 8.5 14.1 15.3 16.8 17.5 18.4 19.6
Total 205.9 100.0 100.0 100.0 100.0 100.0 100.0 100.0
INCOMELess than $10K 14.4 7.0 6.3 5.5 4.6 5.8 5.0 3.9$10K to $20K 22.7 11.0 8.8 8.1 7.0 9.3 8.3 7.7$20K to $30K 25.0 12.1 10.6 9.8 8.2 10.5 9.7 8.6$30K to $40K 24.2 11.8 12.7 11.8 12.9 11.6 10.8 10.8$40K to $50K 17.6 8.5 9.2 9.4 9.2 10.2 10.1 9.8$50K to $75K 34.7 16.9 20.3 20.6 19.6 20.3 22.0 21.1$75K and over 45.8 22.2 32.2 34.8 38.5 32.1 34.1 38.1
Total 205.9 100.0 100.0 100.0 100.0 100.0 100.0 100.0
* Not including Hispanics.Note: Totals may not equal 100.0 percent due to rounding.
Source: 2002 Survey of Public Participation in the Arts.

2002 Survey of Public Participation in the Arts
25
National Endowment for the Arts
OPERA MUSICAL PLAY NON-MUSICAL PLAY DANCE ART
Watch TV Radio Recordings Watch TV Radio Recordings Watch TV Radio Watch TV Watch TV
38.2% 44.2% 39.4% 36.9% 46.7% 36.4% 41.0% 50.2% 34.3% 42.2%61.8 55.8 60.6 63.1 53.3 63.6 59.0 49.8 65.7 57.8
100.0 100.0 100.0 100.0 100.0 100.0 100.0 100.0 100.0 100.0
10.5 6.9 5.9 6.3 10.8 5.0 9.0 7.6 9.9 7.972.7 79.9 83.0 79.0 73.7 84.6 75.0 75.9 76.4 79.59.2 7.7 5.2 9.5 6.4 3.6 10.7 12.8 9.1 8.47.6 5.5 5.9 5.2 9.1 6.9 5.4 3.7 4.6 4.2
100.0 100.0 100.0 100.0 100.0 100.0 100.0 100.0 100.0 100.0
6.8 4.6 6.4 8.0 10.1 9.3 9.6 8.2 9.0 10.911.7 14.1 14.4 15.0 13.1 13.6 14.0 17.9 14.3 18.216.6 16.3 18.2 21.5 22.1 21.8 19.3 23.8 22.1 21.318.8 21.4 23.2 21.5 20.4 26.3 19.5 25.2 20.7 21.717.8 19.3 18.3 13.2 14.8 15.0 16.4 9.9 15.1 13.715.7 14.1 12.1 11.8 11.4 8.8 12.3 9.8 10.3 8.412.6 10.2 7.3 9.1 8.1 5.2 8.8 5.2 8.6 5.8
100.0 100.0 100.0 100.0 100.0 100.0 100.0 100.0 100.0 100.0
3.2 2.0 1.1 1.8 2.6 1.5 2.1 1.8 2.4 1.93.1 2.5 1.5 3.8 3.2 1.7 4.5 3.6 4.6 3.6
20.9 14.5 16.2 19.0 16.6 12.8 22.2 14.8 21.8 21.229.6 28.7 26.0 32.4 30.5 29.1 29.3 33.0 32.9 32.125.2 27.1 29.4 27.1 26.0 32.1 25.3 29.6 24.0 26.317.9 25.2 25.8 15.8 21.1 22.8 16.6 17.3 14.3 14.8
100.0 100.0 100.0 100.0 100.0 100.0 100.0 100.0 100.0 100.0
6.9 5.7 5.0 5.5 7.0 2.9 7.1 8.6 5.8 5.210.3 9.4 8.5 8.9 9.0 6.4 11.8 8.1 9.7 8.812.0 11.0 7.8 9.9 9.0 6.7 8.8 8.6 12.0 11.112.2 10.6 12.3 11.2 11.4 11.6 12.1 11.4 12.5 12.19.7 12.2 8.9 10.9 10.1 9.4 8.9 7.7 8.7 9.4
20.5 19.5 22.5 21.3 19.0 20.7 18.3 19.2 20.3 20.928.4 31.5 35.1 32.3 34.3 42.3 33.1 36.4 31.0 32.5
100.0 100.0 100.0 100.0 100.0 100.0 100.0 100.0 100.0 100.0

2002 Survey of Public Participation in the Arts
26
National Endowment for the Arts
Table 12.Rates at Which U.S. Adults Participate in the Arts Through Media, 2002(Percentage Participating at Least Once in a 12-Month period ending august 2002)
JAZZ CLASSICALWatch TV Radio Recordings Watch TV Radio Recordings W
ALL ADULTS 16.4% 23.5% 17.2% 18.1% 23.9% 19.3%
GENDERMale 16.4 23.8 17.1 15.4 21.9 16.1Female 16.4 23.3 17.3 20.6 25.8 22.3
RACE AND ETHNICITYHispanic 12.4 14.0 9.1 11.4 15.5 9.0White* 15.6 23.5 17.4 20.1 26.9 22.5African American* 25.9 33.4 23.6 10.2 12.9 8.5Other* 15.2 22.3 18.7 22.1 24.7 20.7
AGE18-24 10.7 16.1 13.1 8.9 13.8 14.125-34 13.8 23.8 17.5 12.4 21.1 18.135-44 17.7 28.1 21.1 15.9 23.9 19.345-54 20.7 29.6 21.8 20.9 29.9 23.155-64 17.0 24.1 16.8 23.8 29.5 22.965-74 18.5 18.4 11.8 28.3 26.5 20.875 and over 15.1 11.9 7.7 25.8 20.8 14.2
EDUCATIONGrade School 5.2 4.5 2.5 6.7 6.2 4.4Some High School 8.2 10.3 5.9 7.2 8.6 5.0High School Graduate 11.2 14.8 9.7 12.0 14.6 9.6Some College 19.2 27.2 19.5 19.8 25.9 21.0College Graduate 24.2 37.4 29.7 26.6 38.1 34.5Graduate School 27.7 42.8 34.4 37.7 52.1 44.9
INCOMELess than $10K 13.4 16.9 10.4 13.6 15.6 9.9$10K to $20K 11.8 15.8 9.9 13.7 16.2 12.4$20K to $30K 12.9 17.3 10.6 14.0 17.3 12.5$30K to $40K 16.1 21.6 17.4 16.1 19.9 16.4$40K to $50K 15.9 23.4 16.9 19.4 25.5 20.3$50K to $75K 17.9 26.2 18.3 19.6 28.3 22.1$75K and over 21.7 33.8 27.4 23.6 33.5 30.6
* Not including Hispanics.
Source: 2002 Survey of Public Participation in the Arts.
the total number of viewings dropped from 234 millionin 1992 to 126 million in 2002.
Non-musical plays. Respondents were asked abouttwo types of media participation for non-musical stageplays: television viewing and listening to plays on the
radio. The percentage of adults viewing plays on televi-sion declined by one-half from 1992 to 2002, thelargest decline of any performing arts media participa-tion. The television audience declined from 33 millionto 19 million adults (people watching at least once dur-ing the year).

2002 Survey of Public Participation in the Arts
27
National Endowment for the Arts
OPERA MUSICAL PLAY NON-MUSICAL PLAY DANCE ARTWatch TV Radio Recordings Watch TV Radio Recordings Watch TV Radio Watch TV Watch TV
5.8% 5.7% 5.5% 11.7% 2.4% 4.3% 9.4% 2.1% 12.6% 25.0%
4.6 5.3 4.6 9.0 2.3 3.2 8.1 2.2 9.0 22.06.8 6.1 6.4 14.2 2.4 5.2 10.7 2.0 15.9 27.6
5.5 3.6 3.0 6.7 2.4 1.9 7.7 1.4 11.3 17.95.7 6.2 6.3 12.7 2.4 5.0 9.7 2.2 13.2 27.24.6 3.8 2.5 9.7 1.3 1.3 8.8 2.3 10.0 18.29.5 6.8 7.1 13.3 4.7 6.4 11.0 1.7 12.6 22.9
3.0 2.0 2.7 7.2 1.9 3.1 7.0 1.3 8.7 21.13.7 4.5 4.4 9.8 1.7 3.2 7.3 2.1 10.0 25.34.5 4.3 4.7 11.8 2.5 4.4 8.5 2.3 13.0 24.85.7 6.4 6.8 13.3 2.6 5.9 9.7 2.8 13.8 28.58.1 8.7 8.1 12.3 2.8 5.1 12.3 1.6 15.0 27.2
10.5 9.4 7.9 16.2 3.2 4.4 13.6 2.4 15.1 24.59.7 7.7 5.4 14.1 2.6 2.9 11.1 1.4 14.4 19.1
3.3 2.0 1.1 3.8 1.1 1.1 3.5 0.7 5.3 8.51.9 1.5 0.8 4.6 0.8 0.8 4.3 0.8 6.0 9.33.9 2.7 2.9 7.2 1.3 1.8 6.8 1.0 8.8 17.06.2 5.9 5.2 13.8 2.6 4.5 10.0 2.5 15.0 29.18.3 8.8 9.3 18.2 3.6 7.9 13.6 3.5 17.3 37.4
12.2 17.1 17.0 22.1 6.0 11.6 18.6 4.2 21.4 44.0
5.0 4.2 3.6 8.3 2.1 1.6 8.6 2.4 9.6 17.34.7 4.3 3.9 8.6 1.7 2.3 9.0 1.4 10.0 18.35.0 4.6 8.7 1.5 2.2 6.1 1.4 11.2 20.85.3 4.6 5.3 10.2 2.0 3.9 8.7 1.9 12.1 23.85.7 7.2 5.2 13.5 2.5 4.3 8.8 1.7 11.5 25.16.2 5.9 6.7 13.5 2.4 4.8 9.1 2.2 13.7 28.56.5 7.2 8.0 15.7 3.3 7.5 12.7 3.2 16.0 33.7
Percentage of adults participating via media. Thepercentage of adults watching non-musical plays andthe percentage listening to plays on the radio declinedby one-half and one-third, respectively, from 1992 to 2002. In 2002, about 9 percent of survey respondentssaid that they had watched a non-musical play on
television and 2 percent reported listening to a non-musical play on the radio. Table 10 shows thesetrends.
Frequency of viewing. The average number of view-ings of plays declined slightly from eight in 1992 toseven in 2002. This puts the total number of viewings

2002 Survey of Public Participation in the Arts
28
National Endowment for the Arts
for 2002 at 133 million. Table 13 displays all frequen-cy information for television viewing of the arts.
Opera. Opera has the smallest audience for participa-tion via media of any performing arts studied in theSPPA. Opera also experienced significant declines inmedia participation from 1992 to 2002.
Percentage of adults participating via media. Ratesfor viewing opera on television, listening to opera onthe radio and listening to opera recordings were simi-lar in 2002, and all declined from 1992. Six percent ofadults reported watching opera on television in 2002,down from 12 percent in 1992. Similar numbers ofadults report listening to opera on the radio and listen-ing to opera recordings. Each of these participationrates is equivalent to an audience of between 11 and12 million adults.
As with other performing arts, women are more like-ly to watch an opera program, listen to an opera record-ing, or listen to opera on the radio.
Those with a graduate school education are morelikely to watch or listen to opera. People over 55 yearsof age are about twice as likely to watch or listen toopera as younger adults.
Frequency of viewing. Opera has the lowest frequen-cy of viewing on television of any type of performing artswith four average viewings per adult participant.
Although the average number of viewings per year isunchanged from 1992, the total number of viewings fellbecause of a smaller total audience. In 1992, there were91 million total viewings of opera programs, whichdeclined to 49 million viewings by 2002.
Visual ArtsRespondents to the 2002 SPPA were also asked if theyhad watched a program about artists, art works or artmuseums on television, including VCR or DVD pro-grams. Approximately 25 percent of respondentsreplied they had watched a visual arts program in 2002.This audience of 51 million adults is larger than the tel-evision audience for classical music and jazz, the twotypes of performing arts with the highest media partici-pation.
Percentage of adults participating via media. Asperforming arts media participation declined from 1992to 2002, so too did watching programs on the visual arts.The percentage of adults watching at least one visualarts program in a 12 month period declined from 34percent in 1992 to 25 percent in 2002, as shown inTable 10. The total audience declined from 63 millionviewers in 1992 to 51 million adults in 2002 (Table 13).
Women comprise 58 percent of the audience for tel-evision programs on the visual arts. (Table 11 shows thedemographic composition of this audience.)
Table 13.TV/VCR/DVD Viewing Frequency for 1992 and 2002
1992 2002Viewing Average Total number Viewing Average Total numberaudience number of of viewings audience number of of viewings
in millions viewings in millions millions viewings in millions
MUSICJazz 40.9 6.1 249.5 33.5 7.3 245.9Classical music 48.3 6.4 309.1 37.0 6.8 251.2Opera 22.3 4.1 91.4 11.9 4.1 48.7
PLAYSMusical plays 31.6 4.3 135.9 24.0 4.6 110.2Non-musical plays 33.4 8.0 267.2 19.2 6.9 133.2
DANCE 37.2 6.3 234.4 25.7 4.9 126.2
VISUAL ARTS 63.2 8.9 562.5 51.0 8.6 436.1
Source: 1992 and 2002 Surveys of Public Participation in the Arts.

2002 Survey of Public Participation in the Arts
29
National Endowment for the Arts
Likelihood of watching programs on the visual artsclosely correlates with education. As reported in Table12, 44 percent of people with a graduate education saidthey viewed a visual arts program in 2002, but only 17percent of high school graduates had viewed such a pro-gram. Viewing varies little by age group. Hispanics andAfrican Americans are less likely to view visual artsprograms.
Frequency of viewing. Adults who saw a program onthe visual arts in 2002 watched an average of ninetimes, the highest of any art form. The average numberof viewings of visual arts programs was stable between1992 and 2002. Total number of viewings dropped from562 million in 1992 to 436 million in 2002.
LiteratureThe SPPA asks respondents whether they listened topoetry, novels or books being read, either live or record-ed. In 2002, about 12 percent of adults had listened tothese forms of literature being read within the past 12months at least once. More had listened to a novel orbook being read (9 percent of adults) than had listenedto poetry being read (6 percent of adults).
These questions were also asked in 1992. While thepercent listening to poetry declined from 1992’s rate of9 percent of adults, the rate of listening to novels orbooks increased from 1992’s rate of 8 percent. Bothchanges are statistically significant. Table 10 portraysthese results.
Women listen to poetry and novels at slightly high-er rates than men. For poetry, listeners tend to be in theyoungest age group, 18 to 24 years old, and the middleage group, 45 to 54 years old. African Americans aremore likely to listen to poetry than other groups.
Listening to novels draws its bigger audiences frompeople 35 to 54 years of age. Listening to poetry andnovels is highly correlated with education.
InternetIn 2002, the SPPA added questions about Internethabits as related to the arts. Overall, 54 percent ofSPPA respondents, or 109 million adults, use theInternet. The age profile of Internet users is quite differ-ent from most of the arts activities discussed in thisreport. The 18- to 24-year-old age group had the high-est rate of Internet participation.
Individuals responding “yes” to the question on anyInternet use were then asked a series of questions aboutexploring specific types of arts on the Internet. Table 14ranks arts topics by the percentage of adults who saidthey use the Internet to explore the topic.
Music. More SPPA respondents said that theyexplore music on the Internet than any other art form.Adults exploring music on the Internet are young.Internet use for music does not vary by educationlevel.
Literature. About 9 percent of U.S. adultsexplored literature on the Internet in 2002. Adults witha college degree are about twice as likely to explore lit-erature on the Internet than those with a high schooldiploma. Younger adults have higher rates of participa-tion, similar to Internet use in general. There are no dif-ferences by income.
Visual arts. About 6 percent of survey respondentssaid that they explored visual arts topics on the Internet.They were from a broad cross-section of demographicgroups.
Theater. Four percent of adults explored theater onthe Internet in 2002. In contrast to other art forms,adults ages 35 to 54 are most likely to explore theateron the Internet.
Dance. About 2 percent of adults explore dance onthe Internet. Younger audiences are the most likely toexplore dance. Hispanics are more likely to use theInternet to explore dance than other groups.
Opera. About 1 percent of adults explore opera onthe Internet based on 2002 SPPA results.
Table 14.U.S. Adults’ use of the internetto explore the arts, 2002Internet Topic Percent Exploring
Music 13.1%Literature 9.2Visual arts 5.9Theater 4.1Dance 2.0Opera 1.3
Source: 2002 Survey of Public Participation in the Arts.

2002 Survey of Public Participation in the Arts
31
National Endowment for the Arts
The 2002 SPPA researched personal participation in the arts through questionson performing and creating art. This section of the report also examines arteducation.
Performing and Creating ArtThe SPPA asks adults whether they had personally per-formed or created different types of performing andvisual arts in the past 12 months. Depending on theiranswer, they are then asked whether they had per-formed or exhibited their work publicly. Each SPPAsurvey since 1982 asked personal participation ques-tions, although the 1982 SPPA examined only publicperformance. In total, 44 percent of the 2002 surveyrespondents said that they had performed or created atleast one of the art forms examined in the survey.
Performing music, plays or dance. The SPPA sug-gests that 8 percent of American adults performed orcreated at least one type of music, plays or dance in2002. Some of these performances were public, butmost were for personal enjoyment.
In descending order of participation, the 2002SPPA examined personal performance in:
• Singing in a chorale, choir, or glee club or othertype of vocal group;
• Doing any dancing other than ballet such as mod-ern, folk or tap;
• Singing music from a musical play or operetta;• Performing classical music;• Acting in a public performance of a non-musical
play (or rehearsing for a performance);
• Performing jazz music;• Singing music from an opera; and• Dancing ballet.
Singing in a choir or other vocal group. Amongthe performing arts, singing in a choir or other vocalgroup draws the most participants, as shown in Figure 5.
With 9.8 million adults participating, singing in achoir or other group had double the number of partici-pants of any other type of personal performance otherthan dance. However, fewer people sang in a choir in2002 than in 1992 (see Table 15).
The SPPA question on choir singing only includedthose that had sung in a public performance with achorale, choir, or glee club or other type of vocal group,or rehearsed for a public performance. When the otherforms of personal participation in the arts are restrictedto public performance or public display, the number ofpersons singing in choirs stands out even more as themost popular activity (see Table 16).
Table 15 examines rates of personal participationfor performing arts, visual arts and literature for 1992and 2002. In 1992, 6.3 percent of adults surveyed saidthat they sang in a choir or chorale. The decline to 4.8percent personal participation in 2002 is statisticallysignificant. The total number of adults singing in a choirdeclined from about 12 million people in 1992 to 9.8million in 2002. Over 60 percent of people who sing inchoirs or other vocal groups are women. Table 17 ana-lyzes the demographic distribution of adults personallyparticipating in each art form.
African Americans are more likely to sing in a choiror other vocal group than people of other races or
CHAPTER 5
personal participation in the arts
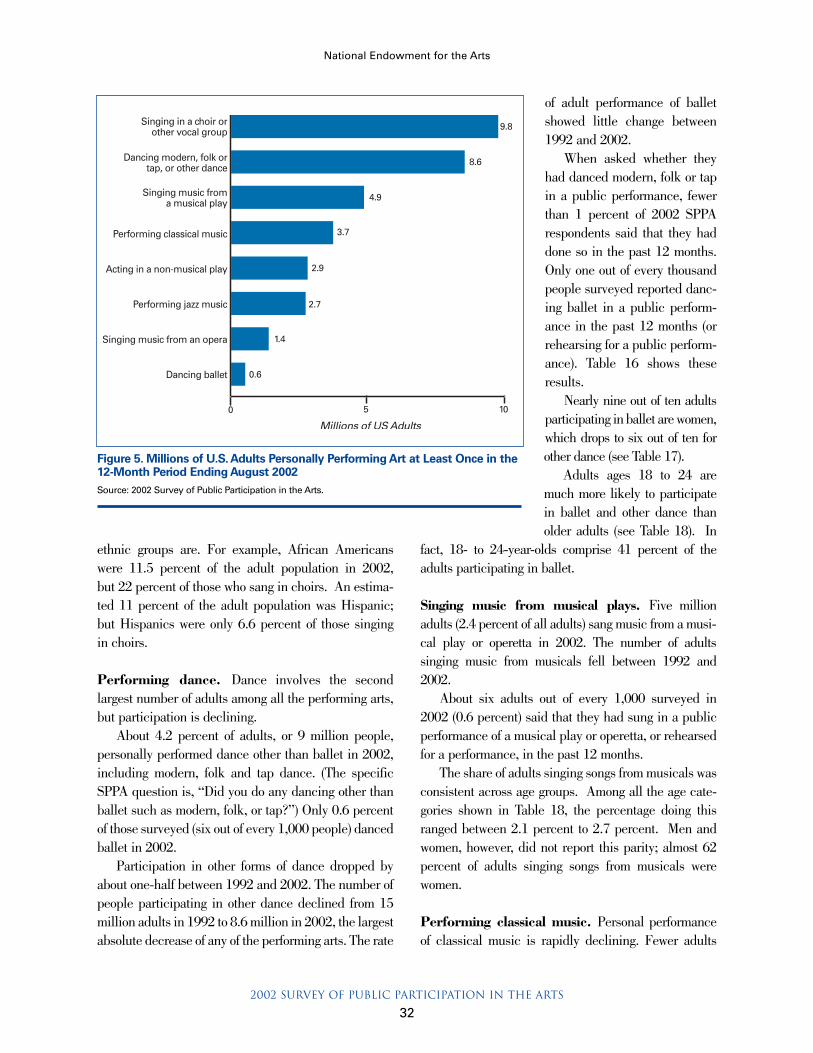
2002 Survey of Public Participation in the Arts
32
National Endowment for the Arts
ethnic groups are. For example, African Americanswere 11.5 percent of the adult population in 2002, but 22 percent of those who sang in choirs. An estima-ted 11 percent of the adult population was Hispanic; but Hispanics were only 6.6 percent of those singing in choirs.
Performing dance. Dance involves the secondlargest number of adults among all the performing arts,but participation is declining.
About 4.2 percent of adults, or 9 million people,personally performed dance other than ballet in 2002,including modern, folk and tap dance. (The specificSPPA question is, “Did you do any dancing other thanballet such as modern, folk, or tap?”) Only 0.6 percentof those surveyed (six out of every 1,000 people) dancedballet in 2002.
Participation in other forms of dance dropped byabout one-half between 1992 and 2002. The number ofpeople participating in other dance declined from 15million adults in 1992 to 8.6 million in 2002, the largestabsolute decrease of any of the performing arts. The rate
of adult performance of balletshowed little change between1992 and 2002.
When asked whether theyhad danced modern, folk or tapin a public performance, fewerthan 1 percent of 2002 SPPArespondents said that they haddone so in the past 12 months.Only one out of every thousandpeople surveyed reported danc-ing ballet in a public perform-ance in the past 12 months (orrehearsing for a public perform-ance). Table 16 shows theseresults.
Nearly nine out of ten adultsparticipating in ballet are women,which drops to six out of ten forother dance (see Table 17).
Adults ages 18 to 24 aremuch more likely to participatein ballet and other dance thanolder adults (see Table 18). In
fact, 18- to 24-year-olds comprise 41 percent of theadults participating in ballet.
Singing music from musical plays. Five millionadults (2.4 percent of all adults) sang music from a musi-cal play or operetta in 2002. The number of adultssinging music from musicals fell between 1992 and2002.
About six adults out of every 1,000 surveyed in2002 (0.6 percent) said that they had sung in a publicperformance of a musical play or operetta, or rehearsedfor a performance, in the past 12 months.
The share of adults singing songs from musicals wasconsistent across age groups. Among all the age cate-gories shown in Table 18, the percentage doing thisranged between 2.1 percent to 2.7 percent. Men andwomen, however, did not report this parity; almost 62percent of adults singing songs from musicals werewomen.
Performing classical music. Personal performanceof classical music is rapidly declining. Fewer adults
Figure 5. Millions of U.S. Adults Personally Performing Art at Least Once in the12-Month Period Ending August 2002Source: 2002 Survey of Public Participation in the Arts.

2002 Survey of Public Participation in the Arts
33
National Endowment for the Arts
reported playing classical music in 2002 than in 1992. In 1992, 4.2 percent of those surveyed said that they
had played classical music in the past 12 months. By2002, this rate had dropped to 1.8 percent of respon-dents. Extrapolating to the adult population, this meansthat nearly 8 million adults were performing classicalmusic in 1992 and fewer than 4 million were perform-ing this type of music in 2002. This was the largest rel-ative decrease of any type of performing arts.
Public performance of classical music has held
steady at about 1 percent of U.S.adults since 1992.
Personal performance of classicalmusic is highly correlated with educa-tional level, more so than other per-forming arts. Adults with a collegedegree are seven times more likely topersonally perform classical musiccompared with high school graduates,as shown in Figure 6.
In contrast, highly educated indi-viduals are only three times more likelyto dance ballet than those with a highschool education. People with at least acollege degree are only twice as likely tosing in a choir or other vocal group aspeople whose formal education stoppedwith a high school degree. Measured onthis scale, educational differences inpersonal performance have grown since 1992.
Level of formal education may beimportant in explaining other demo-graphic differences in rates of arts per-formance. For example, non-Hispanicwhites and people from “other racesand ethnicities” (largely AsianAmericans and Native Americans) aremuch more likely to perform classicalmusic than Hispanics and AfricanAmericans.
Acting. About 3 million adults actedin at least one non-musical play in2002 (about the same number as in 1992).
About 1.4 percent of people surveyed in 2002 saidthat they acted in a public performance, or rehearsedfor a public performance, in the past 12 months.Participation in acting has held steady since 1992.More than personal performance of other types of per-forming arts, acting cuts across gender, education, raceand ethnicity, and income. Younger adults are morelikely to act in plays than older adults.
Performing jazz music. Playing jazz music also
Table 15.U.S. Adults performing or creating art at Least Once in a 12-Month period: 1992 and 2002
Percent of Adults Millions of AdultsPersonally Performing Personally Performing
or Creating or Creating
1992 2002 1992 2002
PERFORMING ARTSMUSIC
Jazz 1.7 % 1.3 % 3.2 2.7Classical music 4.2 1.8 7.8 3.7Opera 1.1 0.7 2.0 1.4Choir/chorale1 6.3 4.8 11.7 9.8Composing music 2.1 2.3 3.9 4.7
PLAYSMusical plays 3.8 2.4 7.1 4.9Non-musical plays 1.6 1.4 3.0 2.9
DANCEBallet 0.2 0.3 0.4 0.6Other dance2 8.1 4.2 15.0 8.6
VISUAL ARTSCREATING ART
Painting/drawing 9.6 8.6 17.8 17.6Pottery/jewelry 8.4 6.9 15.6 14.1Weaving/sewing 24.8 16.0 46.1 32.7Photography 11.6 11.5 21.6 23.5
OWN ORIGINAL ART 22.1 19.3 41.1 39.5
LITERATUREPlays/poetry/novels/
short stories 7.4 7.0 13.7 14.4
1 Only includes those singing in a public performance or rehearsing for one.2 “Other dance” refers to dance other than ballet, including modern, folk and tap.
Source: 1992 and 2002 Surveys of Public Participation in the Arts.
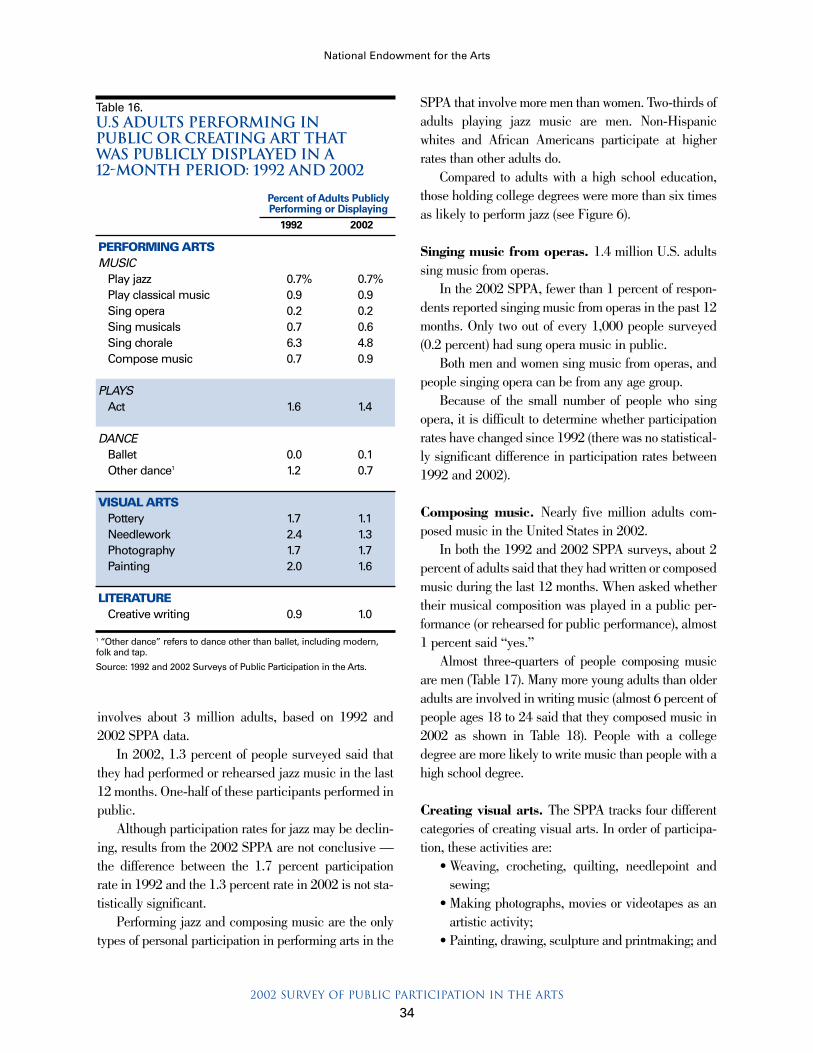
2002 Survey of Public Participation in the Arts
34
National Endowment for the Arts
involves about 3 million adults, based on 1992 and2002 SPPA data.
In 2002, 1.3 percent of people surveyed said thatthey had performed or rehearsed jazz music in the last 12 months. One-half of these participants performed inpublic.
Although participation rates for jazz may be declin-ing, results from the 2002 SPPA are not conclusive ––the difference between the 1.7 percent participationrate in 1992 and the 1.3 percent rate in 2002 is not sta-tistically significant.
Performing jazz and composing music are the onlytypes of personal participation in performing arts in the
SPPA that involve more men than women. Two-thirds ofadults playing jazz music are men. Non-Hispanicwhites and African Americans participate at higherrates than other adults do.
Compared to adults with a high school education,those holding college degrees were more than six timesas likely to perform jazz (see Figure 6).
Singing music from operas. 1.4 million U.S. adultssing music from operas.
In the 2002 SPPA, fewer than 1 percent of respon-dents reported singing music from operas in the past 12months. Only two out of every 1,000 people surveyed(0.2 percent) had sung opera music in public.
Both men and women sing music from operas, andpeople singing opera can be from any age group.
Because of the small number of people who singopera, it is difficult to determine whether participationrates have changed since 1992 (there was no statistical-ly significant difference in participation rates between1992 and 2002).
Composing music. Nearly five million adults com-posed music in the United States in 2002.
In both the 1992 and 2002 SPPA surveys, about 2percent of adults said that they had written or composedmusic during the last 12 months. When asked whethertheir musical composition was played in a public per-formance (or rehearsed for public performance), almost1 percent said “yes.”
Almost three-quarters of people composing musicare men (Table 17). Many more young adults than olderadults are involved in writing music (almost 6 percent ofpeople ages 18 to 24 said that they composed music in2002 as shown in Table 18). People with a collegedegree are more likely to write music than people with ahigh school degree.
Creating visual arts. The SPPA tracks four differentcategories of creating visual arts. In order of participa-tion, these activities are:
• Weaving, crocheting, quilting, needlepoint andsewing;
• Making photographs, movies or videotapes as anartistic activity;
• Painting, drawing, sculpture and printmaking; and
Table 16.U.S Adults performing in Public or Creating Art That Was Publicly Displayed in a 12-Month period: 1992 and 2002
Percent of Adults Publicly Performing or Displaying
1992 2002
PERFORMING ARTSMUSIC
Play jazz 0.7% 0.7%Play classical music 0.9 0.9Sing opera 0.2 0.2Sing musicals 0.7 0.6Sing chorale 6.3 4.8Compose music 0.7 0.9
PLAYSAct 1.6 1.4
DANCEBallet 0.0 0.1Other dance1 1.2 0.7
VISUAL ARTSPottery 1.7 1.1Needlework 2.4 1.3Photography 1.7 1.7Painting 2.0 1.6
LITERATURECreative writing 0.9 1.0
1 “Other dance” refers to dance other than ballet, including modern,folk and tap.
Source: 1992 and 2002 Surveys of Public Participation in the Arts.
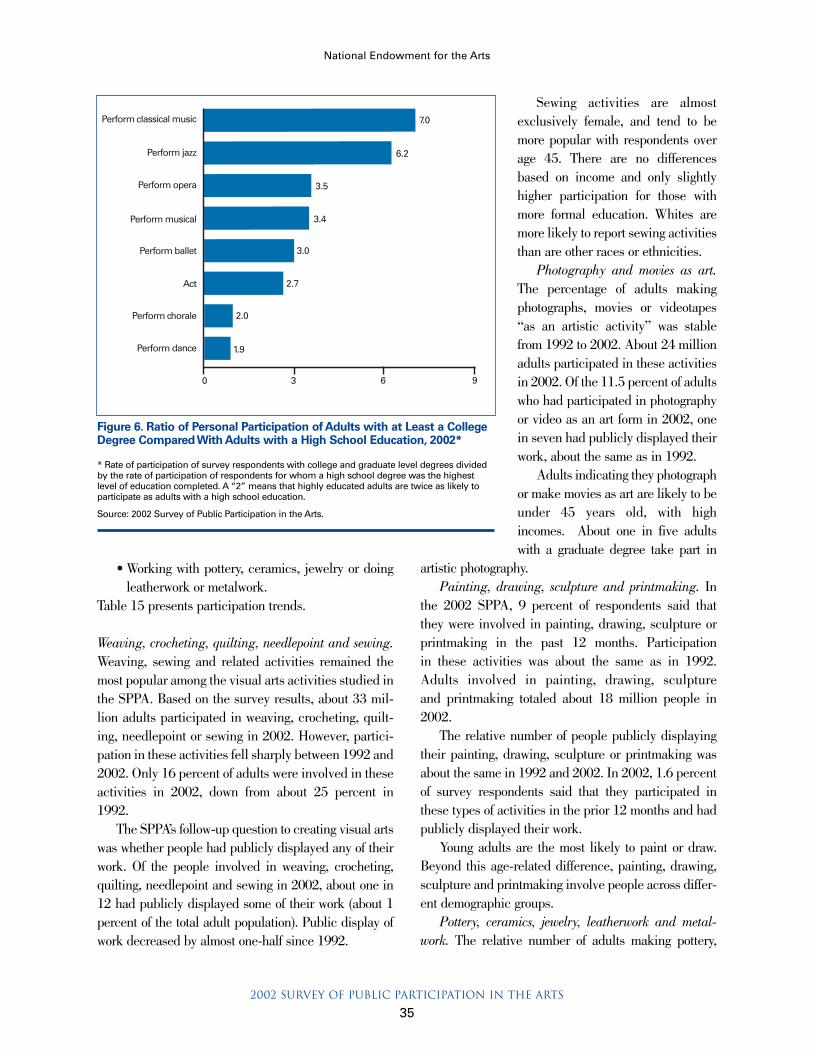
2002 Survey of Public Participation in the Arts
35
National Endowment for the Arts
• Working with pottery, ceramics, jewelry or doingleatherwork or metalwork.
Table 15 presents participation trends.
Weaving, crocheting, quilting, needlepoint and sewing.Weaving, sewing and related activities remained themost popular among the visual arts activities studied inthe SPPA. Based on the survey results, about 33 mil-lion adults participated in weaving, crocheting, quilt-ing, needlepoint or sewing in 2002. However, partici-pation in these activities fell sharply between 1992 and2002. Only 16 percent of adults were involved in theseactivities in 2002, down from about 25 percent in1992.
The SPPA’s follow-up question to creating visual artswas whether people had publicly displayed any of theirwork. Of the people involved in weaving, crocheting,quilting, needlepoint and sewing in 2002, about one in12 had publicly displayed some of their work (about 1percent of the total adult population). Public display ofwork decreased by almost one-half since 1992.
Sewing activities are almostexclusively female, and tend to bemore popular with respondents overage 45. There are no differencesbased on income and only slightlyhigher participation for those withmore formal education. Whites aremore likely to report sewing activitiesthan are other races or ethnicities.
Photography and movies as art.The percentage of adults makingphotographs, movies or videotapes“as an artistic activity” was stablefrom 1992 to 2002. About 24 millionadults participated in these activitiesin 2002. Of the 11.5 percent of adultswho had participated in photographyor video as an art form in 2002, onein seven had publicly displayed theirwork, about the same as in 1992.
Adults indicating they photographor make movies as art are likely to beunder 45 years old, with highincomes. About one in five adultswith a graduate degree take part in
artistic photography.Painting, drawing, sculpture and printmaking. In
the 2002 SPPA, 9 percent of respondents said that they were involved in painting, drawing, sculpture orprintmaking in the past 12 months. Participation in these activities was about the same as in 1992.Adults involved in painting, drawing, sculpture and printmaking totaled about 18 million people in2002.
The relative number of people publicly displayingtheir painting, drawing, sculpture or printmaking wasabout the same in 1992 and 2002. In 2002, 1.6 percentof survey respondents said that they participated inthese types of activities in the prior 12 months and hadpublicly displayed their work.
Young adults are the most likely to paint or draw.Beyond this age-related difference, painting, drawing,sculpture and printmaking involve people across differ-ent demographic groups.
Pottery, ceramics, jewelry, leatherwork and metal-work. The relative number of adults making pottery,
Figure 6. Ratio of Personal Participation of Adults with at Least a CollegeDegree Compared With Adults with a High School Education, 2002*
* Rate of participation of survey respondents with college and graduate level degrees dividedby the rate of participation of respondents for whom a high school degree was the highestlevel of education completed. A “2” means that highly educated adults are twice as likely toparticipate as adults with a high school education.
Source: 2002 Survey of Public Participation in the Arts.

2002 Survey of Public Participation in the Arts
36
National Endowment for the Arts
Table 17.Demographic Distribution of U.S. Adults Personally Participating in the Arts at least Once in the 12-Month period ending august 2002
U.S. Adult Population Choir/ Musical Act inMillions Percent Jazz Classical Opera Chorale Play Plays
GENDERMale 98.7 47.9% 65.1% 40.0% 37.4% 38.2% 37.6% 44.3% 1Female 107.2 52.1 34.9 60.0 62.6 61.8 62.4 55.7
Total 205.9 100.0 100.0 100.0 100.0 100.0 100.0 100.0 10
RACE AND ETHNICITYHispanic 22.7 11.0 4.6 4.4 6.7 6.6 3.8 10.4White* 150.1 72.9 83.0 87.1 80.8 68.1 87.4 68.4 7African American* 23.7 11.5 10.8 2.4 6.2 22.0 6.6 17.6 1Other* 9.5 4.6 1.6 6.0 6.4 3.4 2.2 3.6
Total 205.9 100.0 100.0 100.0 100.0 100.0 100.0 100.0 10
AGE18-24 26.8 13.0 18.7 17.9 12.6 13.4 14.0 27.425-34 36.9 17.9 15.8 14.0 14.6 14.8 15.9 17.5 135-44 44.2 21.5 24.5 21.3 18.3 21.6 19.4 26.345-54 39.0 18.9 28.2 26.5 23.2 20.1 22.0 15.455-64 25.9 12.6 7.2 10.6 14.9 14.7 13.9 8.365-74 17.6 8.5 3.2 6.7 9.5 9.6 7.7 3.975 and over 15.5 7.5 2.5 3.0 6.9 5.8 7.0 1.2
Total 205.9 100.0 100.0 100.0 100.0 100.0 100.0 100.0 10
EDUCATIONGrade School 11.6 5.6 0.5 0.2 0.9 1.3 0.6 0.1Some High School 20.1 9.8 1.9 1.5 2.1 5.3 2.1 6.6High School Graduate 63.8 31.0 10.2 10.4 16.9 22.4 16.7 18.1 1Some College 56.9 27.6 37.3 27.6 31.2 34.7 32.3 35.3College Graduate 36.1 17.5 30.1 35.0 25.2 23.5 27.1 29.5Graduate School 17.4 8.5 19.8 25.3 23.7 12.8 21.2 10.3
Total 205.9 100.0 100.0 100.0 100.0 100.0 100.0 100.0 10
INCOMELess than $10K 14.4 7.0 3.2 6.2 3.9 5.4 4.2 2.9 1$10K to $20K 22.7 11.0 8.1 5.5 10.3 12.3 6.8 8.4$20K to $30K 25.0 12.1 6.8 4.0 4.0 11.3 6.7 11.1 1$30K to $40K 24.2 11.8 13.5 16.0 9.0 14.9 13.8 17.5$40K to $50K 17.6 8.5 10.2 14.9 10.1 10.6 13.3 16.4 1$50K to $75K 34.7 16.9 21.1 25.0 19.8 21.8 20.3 20.7 1$75K and over 45.8 22.2 37.1 31.4 42.9 23.7 35.0 23.1
Total 205.9 100.0 100.0 100.0 100.0 100.0 100.0 100.0 10
Note: Percentages may not equal 100 due to rounding.* Not including Hispanics.
Source: 2002 Survey of Public Participation in the Arts.

2002 Survey of Public Participation in the Arts
37
National Endowment for the Arts
Other Music PurchasedBallet Dance Composition Painting Writing Photography Pottery Sewing Own Art Art Recently
14.1% 38.3% 72.9% 35.7% 39.5% 45.0% 34.2% 7.1% 44.7% 45.0%85.9 61.7 27.1 64.3 60.5 55.0 65.8 92.9 55.3 55.0
100.0 100.0 100.0 100.0 100.0 100.0 100.0 100.0 100.0 100.0
6.6 11.2 3.0 8.7 6.3 6.5 8.2 8.6 4.0 5.176.5 72.7 78.0 79.9 78.2 81.2 80.6 80.3 87.3 85.413.1 9.7 14.6 7.4 12.1 7.6 6.9 6.8 5.3 6.43.7 6.4 4.4 3.9 3.4 4.7 4.3 4.3 3.4 3.1
100.0 100.0 100.0 100.0 100.0 100.0 100.0 100.0 100.0 100.0
41.0 19.0 31.8 23.3 23.3 14.6 17.6 8.5 6.4 8.912.6 19.4 25.3 21.3 20.2 19.3 20.3 14.6 14.3 19.026.4 20.1 21.3 20.1 20.4 26.2 22.9 20.4 23.2 24.59.2 19.1 14.8 18.0 18.2 19.9 20.7 22.0 25.4 24.06.7 10.4 5.0 9.9 8.9 11.5 10.2 15.1 16.0 14.20.4 7.6 1.4 4.7 5.0 6.0 5.7 11.0 8.9 7.23.8 4.5 0.3 2.7 3.9 2.5 2.6 8.5 5.8 2.2
100.0 100.0 100.0 100.0 100.0 100.0 100.0 100.0 100.0 100.0
n/a 0.9 1.5 1.1 0.8 0.8 1.3 4.2 0.8 0.65.8 8.2 4.7 5.9 3.9 3.9 5.6 6.8 2.4 1.9
15.2 21.1 19.5 22.6 18.0 21.9 27.6 29.0 16.3 12.937.7 37.6 36.8 37.3 35.8 32.3 36.3 31.7 31.1 29.921.2 20.5 24.4 22.3 26.2 26.3 20.2 19.0 29.7 31.520.3 11.6 13.2 10.8 15.2 14.8 8.9 9.3 19.8 23.2
100.0 100.0 100.0 100.0 100.0 100.0 100.0 100.0 100.0 100.0
15.7 5.9 9.8 6.5 8.5 4.4 7.3 7.5 2.9 2.3n/a 9.5 11.4 9.9 9.5 7.4 9.6 13.2 5.8 4.219.8 15.0 9.7 11.4 10.6 7.8 10.9 13.2 7.3 6.54.8 14.6 15.1 14.4 13.8 11.6 12.8 13.4 11.7 10.5
12.4 9.8 10.1 10.2 9.9 11.3 9.2 10.4 9.3 7.514.6 21.1 19.6 18.0 18.4 21.3 21.7 19.4 22.0 22.932.7 24.1 24.2 29.6 29.2 36.2 28.5 23.0 41.0 46.0
100.0 100.0 100.0 100.0 100.0 100.0 100.0 100.0 100.0 100.0
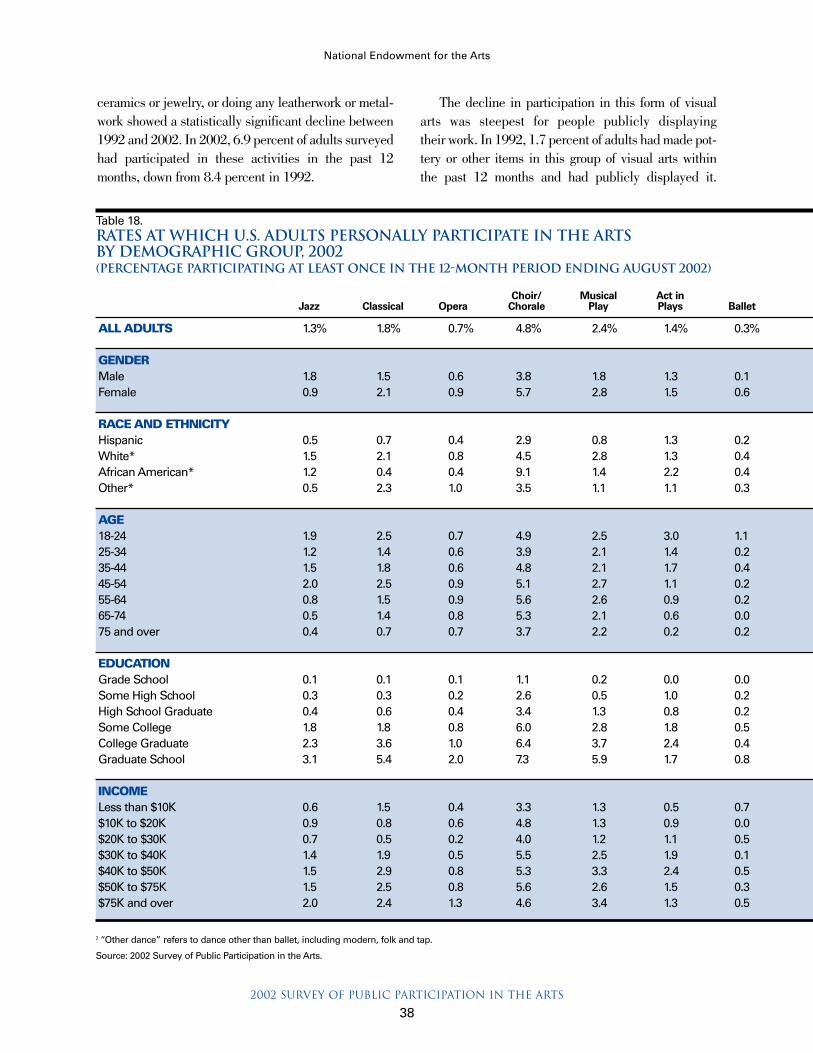
2002 Survey of Public Participation in the Arts
38
National Endowment for the Arts
ceramics or jewelry, or doing any leatherwork or metal-work showed a statistically significant decline between1992 and 2002. In 2002, 6.9 percent of adults surveyedhad participated in these activities in the past 12months, down from 8.4 percent in 1992.
The decline in participation in this form of visualarts was steepest for people publicly displaying their work. In 1992, 1.7 percent of adults had made pot-tery or other items in this group of visual arts within the past 12 months and had publicly displayed it.
Table 18.Rates at Which U.S. Adults Personally Participate in the Arts by Demographic Group, 2002(Percentage Participating at Least Once in the 12-month period ending august 2002)
Choir/ Musical Act inJazz Classical Opera Chorale Play Plays Ballet D
ALL ADULTS 1.3% 1.8% 0.7% 4.8% 2.4% 1.4% 0.3%
GENDERMale 1.8 1.5 0.6 3.8 1.8 1.3 0.1Female 0.9 2.1 0.9 5.7 2.8 1.5 0.6
RACE AND ETHNICITYHispanic 0.5 0.7 0.4 2.9 0.8 1.3 0.2White* 1.5 2.1 0.8 4.5 2.8 1.3 0.4African American* 1.2 0.4 0.4 9.1 1.4 2.2 0.4Other* 0.5 2.3 1.0 3.5 1.1 1.1 0.3
AGE18-24 1.9 2.5 0.7 4.9 2.5 3.0 1.125-34 1.2 1.4 0.6 3.9 2.1 1.4 0.235-44 1.5 1.8 0.6 4.8 2.1 1.7 0.445-54 2.0 2.5 0.9 5.1 2.7 1.1 0.255-64 0.8 1.5 0.9 5.6 2.6 0.9 0.265-74 0.5 1.4 0.8 5.3 2.1 0.6 0.075 and over 0.4 0.7 0.7 3.7 2.2 0.2 0.2
EDUCATIONGrade School 0.1 0.1 0.1 1.1 0.2 0.0 0.0Some High School 0.3 0.3 0.2 2.6 0.5 1.0 0.2High School Graduate 0.4 0.6 0.4 3.4 1.3 0.8 0.2Some College 1.8 1.8 0.8 6.0 2.8 1.8 0.5College Graduate 2.3 3.6 1.0 6.4 3.7 2.4 0.4Graduate School 3.1 5.4 2.0 7.3 5.9 1.7 0.8
INCOMELess than $10K 0.6 1.5 0.4 3.3 1.3 0.5 0.7$10K to $20K 0.9 0.8 0.6 4.8 1.3 0.9 0.0$20K to $30K 0.7 0.5 0.2 4.0 1.2 1.1 0.5$30K to $40K 1.4 1.9 0.5 5.5 2.5 1.9 0.1$40K to $50K 1.5 2.9 0.8 5.3 3.3 2.4 0.5$50K to $75K 1.5 2.5 0.8 5.6 2.6 1.5 0.3$75K and over 2.0 2.4 1.3 4.6 3.4 1.3 0.5
2 “Other dance” refers to dance other than ballet, including modern, folk and tap.
Source: 2002 Survey of Public Participation in the Arts.

2002 Survey of Public Participation in the Arts
39
National Endowment for the Arts
By 2002, this percentage had fallen to 1.1 percent of adults (a statistically significant decrease).
Women are more likely to make pottery and otheritems than men, and younger age groups are more like-ly to participate in these activities than older age
groups. There are no income-related differences. Thosewith some college education are the most likely to make pottery and other items. Whites are slightly morelikely than other ethnicities and races to make theseitems.
Other Music Purchased ArtDance Composition Painting Writing Photography Pottery Sewing Own Art Recently
4.2% 2.3% 8.6% 7.0% 11.5% 6.9% 16.0% 19.3% 29.5%
3.3 3.6 6.4 5.8 10.8 4.9 2.4 18.0 29.74.9 1.2 10.6 8.2 12.1 8.7 28.5 20.5 29.3
4.2 0.6 6.8 4.0 6.7 5.1 12.5 7.0 37.54.1 2.5 9.4 7.6 12.8 7.6 17.6 23.1 28.93.5 3.0 5.6 7.4 7.6 4.1 9.4 8.8 35.95.8 2.3 7.4 5.3 11.9 6.5 14.9 14.5 26.3
6.0 5.7 15.4 12.7 12.9 9.3 10.4 9.4 41.04.5 3.3 10.2 7.9 12.3 7.8 13.0 15.3 39.13.9 2.3 8.1 6.7 14.1 7.4 15.3 20.9 31.24.2 1.8 8.2 6.8 12.1 7.5 18.6 25.8 27.93.4 0.9 6.7 5.0 10.5 5.6 19.1 24.5 26.13.7 0.4 4.8 4.1 8.1 4.6 20.5 20.1 23.72.5 0.1 3.1 3.7 3.8 2.4 18.0 14.8 11.4
0.7 0.6 1.7 1.0 1.7 1.6 12.0 2.6 22.83.5 1.1 5.2 2.8 4.7 3.9 11.1 4.7 24.12.8 1.5 6.3 4.1 8.1 6.1 15.0 10.1 23.25.7 3.1 11.6 9.1 13.4 9.0 18.3 21.6 28.34.9 3.3 11.0 10.6 17.3 8.0 17.4 32.8 31.45.7 3.7 11.0 12.7 20.1 7.3 17.6 45.3 34.4
3.1 3.0 7.3 7.8 6.7 6.6 15.7 7.4 23.43.2 2.2 7.1 5.5 7.1 5.5 17.5 9.3 21.64.5 1.7 7.4 5.6 6.8 5.7 15.9 10.6 26.54.6 2.8 9.7 7.6 10.5 6.9 16.8 17.6 26.94.2 2.5 9.4 7.4 13.8 6.8 17.8 19.0 24.14.6 2.5 8.4 7.0 13.3 8.1 16.9 23.0 31.04.0 2.4 0.6 8.5 17.2 8.1 15.2 32.7 33.6
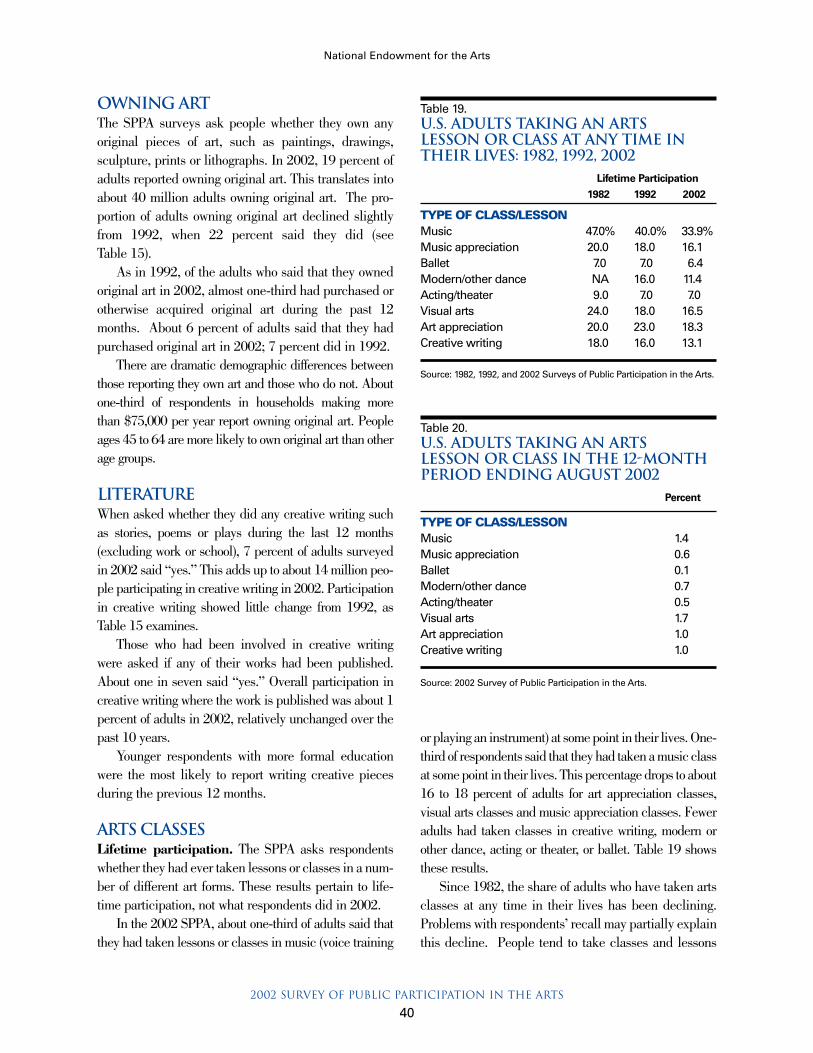
2002 Survey of Public Participation in the Arts
40
National Endowment for the Arts
Owning Art The SPPA surveys ask people whether they own anyoriginal pieces of art, such as paintings, drawings,sculpture, prints or lithographs. In 2002, 19 percent ofadults reported owning original art. This translates intoabout 40 million adults owning original art. The pro-portion of adults owning original art declined slightlyfrom 1992, when 22 percent said they did (see Table 15).
As in 1992, of the adults who said that they ownedoriginal art in 2002, almost one-third had purchased orotherwise acquired original art during the past 12months. About 6 percent of adults said that they hadpurchased original art in 2002; 7 percent did in 1992.
There are dramatic demographic differences betweenthose reporting they own art and those who do not. Aboutone-third of respondents in households making more than $75,000 per year report owning original art. Peopleages 45 to 64 are more likely to own original art than otherage groups.
LiteratureWhen asked whether they did any creative writing suchas stories, poems or plays during the last 12 months(excluding work or school), 7 percent of adults surveyedin 2002 said “yes.” This adds up to about 14 million peo-ple participating in creative writing in 2002. Participationin creative writing showed little change from 1992, asTable 15 examines.
Those who had been involved in creative writing were asked if any of their works had been published.About one in seven said “yes.” Overall participation increative writing where the work is published was about 1percent of adults in 2002, relatively unchanged over thepast 10 years.
Younger respondents with more formal educationwere the most likely to report writing creative piecesduring the previous 12 months.
Arts ClassesLifetime participation. The SPPA asks respondentswhether they had ever taken lessons or classes in a num-ber of different art forms. These results pertain to life-time participation, not what respondents did in 2002.
In the 2002 SPPA, about one-third of adults said thatthey had taken lessons or classes in music (voice training
or playing an instrument) at some point in their lives. One-third of respondents said that they had taken a music classat some point in their lives. This percentage drops to about16 to 18 percent of adults for art appreciation classes,visual arts classes and music appreciation classes. Feweradults had taken classes in creative writing, modern orother dance, acting or theater, or ballet. Table 19 showsthese results.
Since 1982, the share of adults who have taken artsclasses at any time in their lives has been declining.Problems with respondents’ recall may partially explainthis decline. People tend to take classes and lessons
Table 19.U.S. Adults taking an arts lesson or class At Any Time inTheir Lives: 1982, 1992, 2002
Lifetime Participation
1982 1992 2002
TYPE OF CLASS/LESSONMusic 47.0% 40.0% 33.9%Music appreciation 20.0 18.0 16.1Ballet 7.0 7.0 6.4Modern/other dance NA 16.0 11.4Acting/theater 9.0 7.0 7.0Visual arts 24.0 18.0 16.5Art appreciation 20.0 23.0 18.3Creative writing 18.0 16.0 13.1
Source: 1982, 1992, and 2002 Surveys of Public Participation in the Arts.
Table 20.U.S. Adults taking an arts lesson or class in the 12-monthperiod ending august 2002
Percent
TYPE OF CLASS/LESSONMusic 1.4Music appreciation 0.6Ballet 0.1Modern/other dance 0.7Acting/theater 0.5Visual arts 1.7Art appreciation 1.0Creative writing 1.0
Source: 2002 Survey of Public Participation in the Arts.

2002 Survey of Public Participation in the Arts
41
National Endowment for the Arts
when they are young. As the population ages, as it didin 1992 and 2002, more SPPA respondents may simplynot remember taking art classes, causing the reportedshare taking classes at any time to decline.
Participation in past year. The 2002 SPPA askedrespondents who said they had taken a specific type ofclass at some point in their lives whether they had takenthat type of class in the past 12 months.
As shown in Table 20, more adults took a visual artsor music class in 2002 than other types of lessons andclasses. In 2002, 1.7 percent of adults took a visual artsclass. About 1.4 percent of adults took a music lessonor class.
About 1 percent of respondents said that they hadtaken a class in art appreciation or art history in 2002.An equal number of adults took a creative writing class.Fewer adults took a modern or other type of dance class(0.7 percent), a music appreciation class (0.6 percent)or acting or theater class (0.5 percent). Very few surveyrespondents said that they had taken a ballet class inthe past 12 months.

2002 Survey of Public Participation in the Arts
43
National Endowment for the Arts
The 2002 SPPA asked two series of ques-tions about preferences for attending dif-ferent arts events and preferences fortypes of music. Survey results for thesequestions give further insight into the
level of interest or demand for different art forms. Tounderstand arts participation in the context of overallleisure, the 2002 SPPA asked about other leisure activ-ities as well.
Arts PreferencesIn order to learn more about their preferences forattending arts events, respondents were read a list ofactivities and asked, “If you could go to any of theseevents as often as you wanted, which ones would yougo to more often than you do now?”
Respondents could identify any, all or none of thearts activities mentioned as activities they would like togo to more often, or none of them.
Desire to attend more. Visiting an art museum orgallery was cited by 37 percent of adults as an artsactivity they wanted to go to more often. This was alsothe leading response in 1992, as shown in Table 21.
After the list of activities was read and answered,the respondent was asked which of the events he or shewould like to do most. Again, more respondentsanswered they would most like to visit an art museumthan any other arts activity.
As shown in Table 22, 23 percent of adultsanswered that they would most like to visit an art muse-um, while attending a musical was the next most com-mon response. Jazz was the third most commonly cited
activity. About 12 percent of adults responded therewas “no one thing” they wanted to do most.
Demographic differences. Men chose art muse-ums and jazz performances more often than women asthe event they would most like to attend more often.Women’s number one choice was attending a musical.
About 43 percent of African Americans choseattending a jazz performance more frequently. This is asignificantly higher percentage than the 14 percent ofwhites and 15 percent of Hispanics choosing jazz. Fornon-African Americans, visiting an art museum was thenumber one choice.
People ages 65 and older most frequently chosemusicals as the event they would like to see most, while
CHAPTER 6
ARTS preferences andleisure participation
Table 21.U.S. Adults’ Preferences forAttending Additional ArtsEvents: 1982, 1992, 2002
Desire to Attend MoreArts Performances
1982 1992 2002
TYPE OF EVENTJazz 18.0% 25.0% 24.3%Classical music 18.0 25.0 22.7Opera 7.0 11.0 11.5Musicals 33.0 36.0 29.8Plays 25.0 34.0 27.1Ballet 12.0 18.0 13.8Other dance NA 24.0 20.4Art museums 31.0 38.0 37.3
Source: 1982, 1992, and 2002 Surveys of Public Participation in the Arts.

2002 Survey of Public Participation in the Arts
44
National Endowment for the Arts
other age groups chose visiting an art museum.As the level of formal education increases, a higher
percentage of respondents indicate they would prefer to see a musical over other art forms. For those with a college degree and higher, about 20 percent said they would most like to see a musical. This is aboutequal to the number of people with a college educationchoosing to visit an art museum as their preferred activity.
Music PreferencesSince 1982, SPPAs have asked people whether or notthey liked certain types of music and what type of musicwas their favorite. Even though the categories of musichave been expanded and refined in the last 20 years,the types of music that people say they like and that arechosen as respondents’ favorite style of music have notchanged much.
Music people like. Table 23 presents the percent-age of people responding that they liked each specifiedtype of music. Almost one-half of adults like to listen toclassic rock or oldies. Four in ten people like country-western.
Blues/R&B, mood/easy listening, jazz, classical/chamber music and hymns/gospel music are each“liked” by more than one-quarter of U.S. adults. The2002 SPPA divided the rock music category into“rock/heavy metal” and “classic rock/oldies.” Aboutone-quarter of U.S. adults said that they likedrock/heavy metal.
As types of music researched in the SPPA haveexpanded, the number of adults saying that they likedany particular form of music has declined. Only thepercentage of respondents reporting they like to listen
to rap music increased from 1992 to 2002 (from 12 to17 percent).
Music people like best. After being reminded ofthe types of music they said they liked, SPPA respon-dents were asked which type they liked best (Table 24).
Table 22.Type of Arts Event U.S. AdultsWould Prefer to Attend Most,2002Type of Arts Event Preferred “Most” Percent
Art Museum/Gallery 23%Musical 18Jazz 17No one thing 12
Source: 2002 Survey of Public Participation in the Arts.
Table 23.Types of Music liked by U.S.Adults: 1982, 1992, 2002
Percent of Adult Population Liking Each Type of Music
1982 1992 2002
TYPE OF MUSICClassic Rock/Oldies NA% NA% 48.3%Country-Western 58.0 52.0 40.4Blues/R&B NA 40.0 29.9Mood/Easy 48.0 49.0 29.1Jazz 26.0 34.0 27.5Classical/chamber 28.0 33.0 27.4Hymns/Gospel 36.0 38.0 27.4Rock/Heavy Metal NA NA 23.6Big Band 33.0 35.0 23.4Bluegrass 25.0 29.0 20.2Latin/Salsa NA 20.0 20.0Ethnic/National NA 22.0 17.2Rap NA 12.0 17.1Electronic NA NA 16.8Show tunes/operettas 23.0 28.0 16.7Reggae NA 19.0 15.7Folk (Contemporary) 25.0 23.0 14.8New Age NA 15.0 12.3Parade/March NA 18.0 11.8Opera 10.0 12.0 10.2Choral Glee Club NA 14.0 9.4Soul 26.0 24.0 NARock 35.0 44.0 NA
Note: “NA” indicates, “Not Asked.”
Source: 1982, 1992, and 2002 Surveys of Public Participation in the Arts.
Table 24.type of Music U.S. Adults LikedBest, 2002Type of Music Liked Best Percent
Classic Rock/Oldies 16%Country 15No one specific type 14
Source: 2002 Survey of Public Participation in the Arts.

2002 Survey of Public Participation in the Arts
45
National Endowment for the Arts
The favorite was classic rock/oldies, selected by 16 per-cent of survey respondents, followed by country music(15 percent). For 14 percent of respondents, no one spe-cific type of music was liked best
From Table 25 it is clear that the types of preferredmusic picked have remained fairly consistent in the lasttwenty years. Although the order changed slightly in2002 when classic rock/oldies moved into first place,the same types of music appeared in the top five for1992 and 2002.
Demographic differences. Demographic differ-ences in preferences for different types of music are aspronounced as for participation in performing and visual arts.
Women showed more of a preference for mood/easy
listening music and hymns, whilemen preferred classic rock androck/heavy metal music.
Whites tend to prefer classic rockmusic and country music, whileAfrican Americans more often preferhymns, jazz and rap music. Hispanicrespondents said that they preferredLatin music far more frequently thanother types of music. People of racesand/or ethnicities other than white,
Hispanic or African American (largely AsianAmericans and Native Americans) tend to prefer clas-sical and ethnic music.
Younger respondents (18 to 24 years old) are morelikely to prefer rap, reggae and rock/heavy metal thanother age groups.
Other Leisure ActivitiesPlacing arts attendance in context with participation inother activities is an important step in interpreting thechanges in arts’ participation levels. Table 26 displaysresults from 1982, 1992 and 2002 SPPA questions onnon-arts activities.
Participation rates. More people go to the moviesthan any other leisure activity studied in the SPPA.About six in ten people went to the movies in 2002, arate that has held steady since 1982. Over one-half ofrespondents said that they participated in an exerciseprogram in 2002. Nearly one-half of adults participatein gardening for pleasure. Attendance at any one of thebenchmark arts events had about the same participa-tion in 2002 as making repairs or improvements to one’shome or going to an amusement or theme park. Goingto the arts involved more adults than going to sportingevents (not including youth sports).
Fewer respondents said that they played sports, vis-ited amusement parks and gardened in the 2002 SPPAthan in 1992.
The average number of hours that SPPA respon-dents report watching television has not changed signif-icantly since 1982.
Demographic differences. The demographicprofiles of those participating in these non-arts activi-ties are somewhat similar to those participating in thearts (See tables 27 and 28). People with higher incomes
Table 25.U.S. Adults’ Music Preferences: 1982, 1992, 2002
Music Preference Rankings––Top 5 Music Types
1982 1992 2002
1. Country-Western Country-Western Classic Rock/Oldies2. Mood/Easy Mood/Easy Country-Western3. Hymns/Gospel Rock Blues/R&B4. Rock Blues/R&B Mood/Easy5. Big Band Hymns/Gospel Hymns/Gospel
Source: 1982, 1992, and 2002 Surveys of Public Participation in the Arts.
Table 26.Participation in Other LeisureActivities: 1982, 1992, 2002
Percent of Adults Participating
1982 1992 2002
TYPE OF ACTIVITYMovies 63.0% 59.0% 60.0%Exercise 51.0 60.0 55.1Gardening 60.0 55.0 47.3Home improvements 60.0 48.0 42.4Amusement parks 49.0 50.0 41.7Benchmark arts events 39.0 41.0 39.0Sporting events 48.0 37.0 35.0Outdoor activities 36.0 34.0 30.9Active sports 39.0 39.0 30.4Volunteer/charity 28.0 33.0 29.0TV hours per day 3.0 3.0 2.9
Source: 1982, 1992, and 2002 Surveys of Public Participation in the Arts.

2002 Survey of Public Participation in the Arts
46
National Endowment for the Arts
Table 27.Demographic Distribution of Adults Participating in Other LeisureActivities at Least Once in the 12-Month period ending august 2002
HomeU.S. Adult Population Sports Amusement Exercise Playing Outdoor Charity Improvement/
Millions Percent Movies Events Park Program Sports Activities Work Repair Gardening
GENDERMale 98.7 47.9% 47.4% 56.5% 46.4% 47.8% 61.0% 53.2% 42.2% 52.2% 37.6%Female 107.2 52.1 52.6 43.5 53.6 52.2 39.0 46.8 57.8 47.8 62.4
Total 205.9 100.0 100.0 100.0 100.0 100.0 100.0 100.0 100.0 100.0 100.0
RACE AND ETHNICITYHispanic 22.7 11.0 9.6 8.3 10.3 8.0 8.1 5.3 5.8 7.3 8.1White* 150.1 72.9 76.5 79.9 74.8 78.2 79.1 88.1 81.6 82.0 80.5African American* 23.7 11.5 9.4 8.9 10.1 9.6 8.7 3.1 9.0 7.1 7.4Other* 9.5 4.6 4.5 2.9 4.8 4.2 4.1 3.5 3.5 3.7 4.0
Total 205.9 100.0 100.0 100.0 100.0 100.0 100.0 100.0 100.0 100.0 100.0
AGE18-24 26.8 13.0 17.9 17.1 17.9 14.5 21.1 15.8 11.3 6.5 5.725-34 36.9 17.9 22.0 21.4 24.2 19.6 23.4 22.5 16.1 17.4 15.735-44 44.2 21.5 24.2 25.7 27.3 23.1 25.7 27.0 24.5 26.7 23.445-54 39.0 18.9 19.0 19.4 16.8 20.1 17.8 20.2 21.8 24.5 22.155-64 25.9 12.6 9.8 9.2 8.2 11.1 6.6 8.9 12.2 13.3 15.165-74 17.6 8.5 4.6 4.8 3.8 7.3 3.9 4.2 8.5 7.8 10.475 and over 15.5 7.5 2.4 2.4 1.7 4.3 1.5 1.4 5.5 3.9 7.6
Total 205.9 100.0 100.0 100.0 100.0 100.0 100.0 100.0 100.0 100.0 100.0
EDUCATIONGrade School 11.6 5.6 1.8 1.5 2.3 2.2 1.3 1.1 1.6 2.6 3.9Some High School 20.1 9.8 6.4 4.9 7.2 5.8 5.5 4.9 4.2 5.7 6.4High School Graduate 63.8 31.0 26.7 25.0 28.2 25.7 23.1 25.0 21.6 26.0 28.7Some College 56.9 27.6 31.7 31.5 32.4 31.2 32.0 32.3 31.4 30.3 29.0College Graduate 36.1 17.5 22.5 25.5 21.0 23.2 26.0 24.4 25.7 23.1 20.7Graduate School 17.4 8.5 10.9 11.6 8.9 11.9 12.1 12.4 15.5 12.3 11.3
Total 205.9 100.0 100.0 100.0 100.0 100.0 100.0 100.0 100.0 100.0 100.0
INCOMELess than $10K 14.4 7.0 4.9 3.6 5.5 5.1 3.7 3.7 4.3 3.5 5.2$10K to $20K 22.7 11.0 8.5 6.9 8.8 9.2 7.3 6.8 7.8 6.7 10.0$20K to $30K 25.0 12.1 10.7 8.8 11.0 10.9 9.3 9.1 9.5 8.9 11.6$30K to $40K 24.2 11.8 12.3 10.9 12.0 12.4 11.1 12.3 12.0 12.6 12.7$40K to $50K 17.6 8.5 9.9 9.3 9.5 9.4 9.0 10.2 9.4 10.2 9.8$50K to $75K 34.7 16.9 21.4 23.6 22.1 21.1 21.7 22.7 22.4 23.2 21.4$75K and over 45.8 22.2 32.2 36.9 31.1 31.9 37.9 35.2 34.5 34.9 29.1
Total 205.9 100.0 100.0 100.0 100.0 100.0 100.0 100.0 100.0 100.0 100.0
*Not including Hispanics.Note: Totals may not equal 100.0 percent due to rounding.
Source: 2002 Survey of Public Participation in the Arts.

2002 Survey of Public Participation in the Arts
47
National Endowment for the Arts
and more advanced formal education are also morelikely to participate in non-arts leisure activities.However, the influence of education on the participa-tion rates of non-arts leisure activities is much smallerthan for the arts. The greatest effects of education
appear to be on the likelihood of volunteering or doingcharity work — college graduates are more than twiceas likely as those with high school degrees to say thatthey are involved in these activities.
Men are more likely than women to attend sporting
Table 28.percentage of U.S. Adults Who participated at Least Once in the 12-Month period ending august 2002
HomeSports Amusement Exercise Playing Outdoor Charity Improvement/
Movies Events Park Program Sports Activities Work Repair Gardening
ALL ADULTS 60.0% 35.0% 41.7% 55.1% 30.4% 30.9% 29.0% 42.4% 47.3%
GENDERMale 59.5 41.4 40.4 55.0 38.8 34.3 25.6 46.3 37.1Female 60.5 29.2 42.9 55.1 22.7 27.7 32.1 38.9 56.7
RACE AND ETHNICITYHispanic 52.5 26.4 38.9 40.1 22.3 14.9 15.3 28.0 34.8White* 63.0 38.4 42.8 59.1 33.0 37.3 32.5 47.7 52.3African American* 49.2 27.0 36.6 46.1 23.1 8.2 22.7 26.3 30.3Other* 58.1 22.3 43.9 50.4 26.9 23.9 22.5 33.8 41.3
AGE18-24 82.8 46.0 57.6 61.3 49.4 37.7 25.3 21.1 20.725-34 73.3 41.8 56.2 60.2 39.6 38.8 26.0 41.1 41.435-44 68.0 42.2 53.3 59.5 36.6 39.0 33.2 53.0 51.45-54 60.4 35.8 37.1 58.6 28.6 33.0 33.4 54.9 55.455-64 46.6 25.5 27.1 48.4 16.0 21.7 28.1 44.8 56.665-74 32.2 19.7 18.4 47.0 13.7 14.9 28.8 38.4 57.275 and over 19.5 11.1 9.6 31.3 6.0 5.8 21.3 22.1 47.9
EDUCATIONGrade School 19.5 9.4 17.2 21.0 6.9 6.0 8.2 19.5 32.5Some High School 39.4 17.4 30.6 32.7 17.2 15.7 12.5 24.9 31.2High School Graduate 51.7 28.3 37.9 45.6 22.6 24.8 20.2 35.6 43.8Some College 68.7 39.9 48.9 62.3 35.2 36.1 33.1 46.5 49.6College Graduate 77.1 51.0 50.1 73.2 45.2 43.0 42.6 56.0 56.1Graduate School 77.5 48.3 44.0 77.3 43.6 45.3 53.1 61.6 63.3
INCOMELess than $10K 38.7 16.5 30.4 36.5 15.0 15.2 16.2 19.7 32.2$10K to $20K 41.8 20.1 30.7 42.0 18.5 17.4 18.8 23.5 38.8$20K to $30K 48.3 23.0 34.7 45.2 21.4 21.2 20.7 28.4 40.9$30K to $40K 57.5 30.0 39.3 53.3 26.6 29.8 27.4 42.0 46.6$40K to $50K 63.1 34.8 42.6 55.0 29.3 33.7 29.1 46.0 49.1$50K to $75K 69.3 44.8 50.2 63.0 36.0 38.2 35.3 53.6 54.4$75K and over 79.4 53.3 54.0 72.5 48.0 45.3 41.5 61.2 56.3
*Not including Hispanics.
Source: 2002 Survey of Public Participation in the Arts.

2002 Survey of Public Participation in the Arts
48
National Endowment for the Arts
events, play sports, participate in outdoor activities anddo home improvement or repair projects. Women aremore likely to garden and do charity work.
Non-Hispanic whites are generally more likely toparticipate in all leisure activities surveyed than otherethnicities or races. African Americans have a particu-larly low rate of participating in outdoor activities (e.g.,camping and hiking) compared with other ethnicitiesand races.
Younger respondents are more likely to go to themovies, sporting events and amusement parks thanolder respondents. Young adults are more likely to playsports. Older respondents are more likely to garden.

2002 Survey of Public Participation in the Arts
49
National Endowment for the Arts
Arts attendance and media participationvary by region of the United States. Thefollowing results tabulate attendance byhome address of the respondent.Therefore, if a resident from Colorado
attended the ballet in New York City, that attendance iscounted in the Mountain Region. Only 2002 results areanalyzed, as the 1992 SPPA did not detail geographicresults and data in the 1997 SPPA are not directly com-parable to the 2002 survey.
AttendanceResidents of some regions of the United States are morelikely to go to arts activities than found for the countryas a whole.
Residents of the Mountain and Pacific regions hadthe highest reported attendance rate for “benchmark”arts activities. About 47 percent of Mountain Regionresidents and 45 percent of Pacific Region residentsreporting that they went to a jazz, classical music,opera, musical or non-musical play, ballet, or art muse-um between September 2001 and August 2002. Artsattendance of residents of the East South Central andthe West South Central regions lagged other parts of thecountry.
Table 29 shows attendance at benchmark activitiesby region. It also presents reported attendance rates foreach art form studied in the SPPA.
Figure 7 shows the United States broken intoregions, including how those regions rate in attendingspecific arts events.
The following discussion examines each region inorder of reported benchmark attendance. Note that, in
most cases, there is not a statistically significant differ-ence in attendance rates between the “first place”region and “second” or “third place” region.
Mountain Region. The Mountain Region is com-prised of Montana, Idaho, Nevada, Utah, Wyoming,Colorado, Arizona and New Mexico. For the specifictypes of art attendance, the Mountain Region rankedfirst in the percentage of adults reporting that they:
• Attend jazz performances;• Attend classical music performances;• Attend opera performances;• Attend other dance performances (not including
ballet);• Visit art museums or galleries; • Visit historic sites; and • Read literature.
Pacific Region. The Pacific Region includesCalifornia, Oregon, Washington, Alaska and Hawaii.Residents of this region had the highest rates of attend-ing art festivals and fairs. They had the second highestrate of attending benchmark arts activities.
New England. New England residents (Maine, NewHampshire, Vermont, Massachusetts, Rhode Island andConnecticut) had the highest rate of attending non-musical plays and ballet.
Middle Atlantic Region. The Middle AtlanticRegion, including New York, New Jersey andPennsylvania, ranked first in attendance of musicalplays and second for non-musical plays. Residents of
CHAPTER 7
regional differences in arts participation
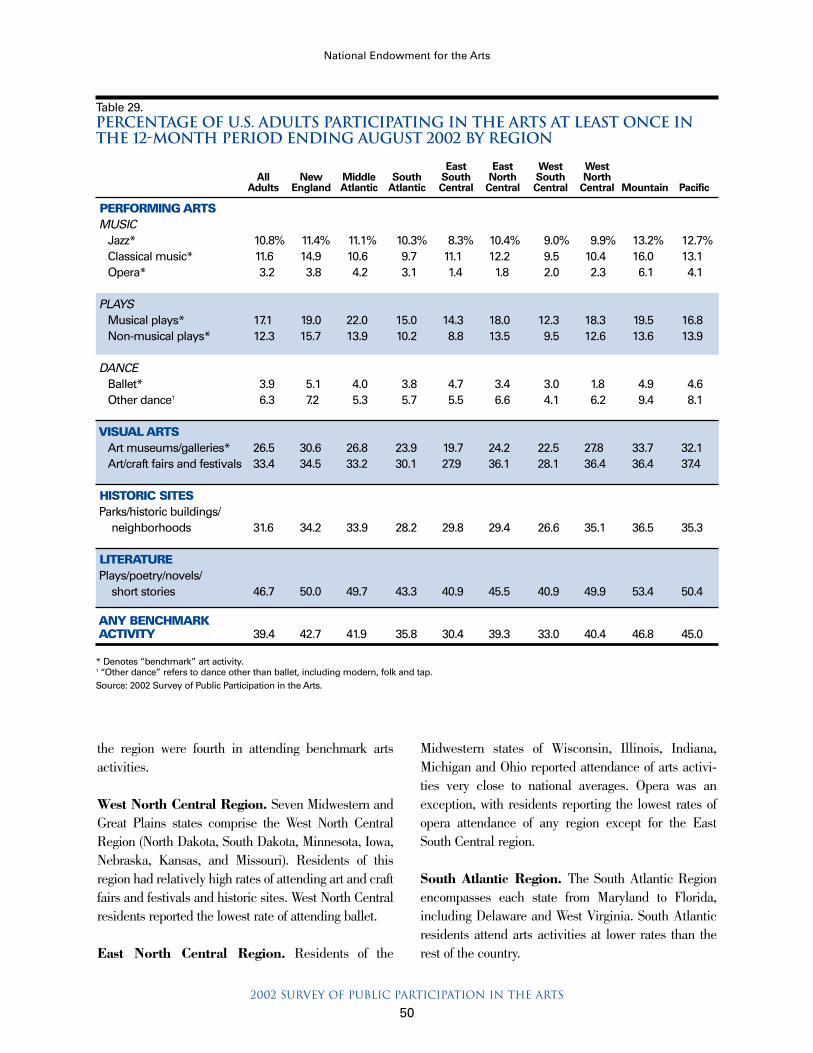
2002 Survey of Public Participation in the Arts
50
National Endowment for the Arts
the region were fourth in attending benchmark artsactivities.
West North Central Region. Seven Midwestern andGreat Plains states comprise the West North CentralRegion (North Dakota, South Dakota, Minnesota, Iowa,Nebraska, Kansas, and Missouri). Residents of thisregion had relatively high rates of attending art and craftfairs and festivals and historic sites. West North Centralresidents reported the lowest rate of attending ballet.
East North Central Region. Residents of the
Midwestern states of Wisconsin, Illinois, Indiana,Michigan and Ohio reported attendance of arts activi-ties very close to national averages. Opera was anexception, with residents reporting the lowest rates ofopera attendance of any region except for the EastSouth Central region.
South Atlantic Region. The South Atlantic Regionencompasses each state from Maryland to Florida,including Delaware and West Virginia. South Atlanticresidents attend arts activities at lower rates than therest of the country.
Table 29.Percentage of U.S. Adults Participating in the Arts at Least Once inthe 12-Month period ending August 2002 by Region
East East West WestAll New Middle South South North South North
Adults England Atlantic Atlantic Central Central Central Central Mountain Pacific
PERFORMING ARTSMUSIC
Jazz* 10.8% 11.4% 11.1% 10.3% 8.3% 10.4% 9.0% 9.9% 13.2% 12.7%Classical music* 11.6 14.9 10.6 9.7 11.1 12.2 9.5 10.4 16.0 13.1Opera* 3.2 3.8 4.2 3.1 1.4 1.8 2.0 2.3 6.1 4.1
PLAYSMusical plays* 17.1 19.0 22.0 15.0 14.3 18.0 12.3 18.3 19.5 16.8Non-musical plays* 12.3 15.7 13.9 10.2 8.8 13.5 9.5 12.6 13.6 13.9
DANCEBallet* 3.9 5.1 4.0 3.8 4.7 3.4 3.0 1.8 4.9 4.6Other dance1 6.3 7.2 5.3 5.7 5.5 6.6 4.1 6.2 9.4 8.1
VISUAL ARTSArt museums/galleries* 26.5 30.6 26.8 23.9 19.7 24.2 22.5 27.8 33.7 32.1Art/craft fairs and festivals 33.4 34.5 33.2 30.1 27.9 36.1 28.1 36.4 36.4 37.4
HISTORIC SITESParks/historic buildings/
neighborhoods 31.6 34.2 33.9 28.2 29.8 29.4 26.6 35.1 36.5 35.3
LITERATUREPlays/poetry/novels/
short stories 46.7 50.0 49.7 43.3 40.9 45.5 40.9 49.9 53.4 50.4
ANY BENCHMARK ACTIVITY 39.4 42.7 41.9 35.8 30.4 39.3 33.0 40.4 46.8 45.0
* Denotes “benchmark” art activity.1 “Other dance” refers to dance other than ballet, including modern, folk and tap. Source: 2002 Survey of Public Participation in the Arts.

2002 Survey of Public Participation in the Arts
51
National Endowment for the Arts
West South Central Region. Residents from tworegions in the South — the West South Central and EastSouth Central regions — attended arts events in lowernumbers than residents in other regions of the UnitedStates. The West South Central Region includes Texas,Oklahoma, Arkansas and Louisiana. Residents of thisregion reported the lowest rates of attendance for classical music, musical plays and other dance. Theywere the least likely to go to a historic site or to read literature.
East South Central Region. Kentucky, Tennessee,Alabama and Mississippi are the states in the EastSouth Central Region. About 30 percent of adults inthis region attended one or more benchmark arts activ-ities in 2002 compared with a national average of 39percent. The East South Central had the lowest report-ed attendance of jazz, opera, non-musical plays, artmuseums and art festivals.
Media ParticipationResidents of the Pacific Region have the highest ratesof media participation in the arts for nearly all forms ofart studied in the SPPA. For example, residents ofPacific states are more likely to listen to jazz or opera onthe radio or watch musicals on television than otherparts of the country. Residents of Mountain states andNew England are also more likely to watch or listen todifferent types of performing arts than other parts of thecountry.
Residents of the East South Central and West SouthCentral regions reported relatively low rates of mediaparticipation for most art forms.
Table 30 provides detail for media participation forall regions.
Trips Taken for ArtIn 2002, a question new to the SPPA asked if therespondent had taken a trip that included attending a
Figure 7. Key Findings for Study Area Regions, 2002Source: 2002 Survey of Public Participation in the Arts.

2002 Survey of Public Participation in the Arts
52
National Endowment for the Arts
Table 30.percentage of U.S. Adults Who Watched or Listened to the Arts in the 12-Month period ending august 2002 by region
East East West WestAll New Middle South South North South North
Adults England Atlantic Atlantic Central Central Central Central Mountain Pacific
PERFORMING ARTSMUSIC
JazzTV/VCR/DVD 16.4% 18.6% 16.1% 16.5% 15.3% 15.8% 14.1% 12.1% 17.3% 20.1%Radio 23.5 23.9 22.2 22.6 18.4 23.4 20.0 22.2 27.4 29.0Audio recordings 17.2 18.9 16.6 17.4 13.3 16.3 14.1 14.6 20.3 21.4
Classical musicTV/VCR/DVD 18.1 20.2 21.7 15.9 15.2 18.3 13.5 16.3 19.4 21.1Radio 23.9 29.0 25.8 20.0 17.1 22.7 22.0 24.8 29.7 27.8Audio recordings 19.3 22.1 22.5 15.9 13.5 18.2 15.7 18.7 25.5 23.3
OperaTV/VCR/DVD 5.8 5.9 6.8 4.9 3.7 5.5 5.4 4.0 5.9 7.8Radio 5.7 7.0 7.0 4.6 4.2 5.3 5.2 4.0 5.2 7.8Audio recordings 5.5 6.5 6.1 4.1 5.1 5.3 3.5 4.8 7.2 7.8Internet, exploring opera 1.3 1.3 1.2 1.5 0.3 0.8 1.9 1.1 2.1 1.4
Internet, exploring all types of music 13.1 15.9 13.1 12.2 10.5 11.9 13.0 14.4 15.0 14.2
PLAYSMusicalsTV/VCR/DVD 11.7 11.3 13.2 9.7 10.2 12.7 8.9 11.6 13.6 13.7Radio 2.4 2.5 3.1 1.6 1.6 2.7 2.0 1.3 2.3 3.4Audio recordings 4.3 4.7 6.5 2.9 2.7 4.4 2.3 4.2 5.2 5.2
Non-musical playsTV/VCR/DVD 9.4 10.7 12.1 9.1 6.3 9.3 7.3 7.8 9.1 10.7Radio 2.1 2.5 1.8 1.5 2.1 2.1 1.8 1.9 1.9 3.1Internet, exploring all
types of theater 4.1 6.3 4.6 3.8 2.5 3.5 4.0 2.8 4.7 4.8
DANCE, INCLUDING BALLETTV/VCR/DVD 12.6 12.1 13.2 10.9 10.2 13.3 10.6 11.3 13.8 15.9Internet, exploring dance 2.0 2.9 1.8 2.1 0.8 1.4 2.4 2.1 2.9 2.2
VISUAL ARTSTV/VCR/DVD 25.0 23.4 23.8 22.4 22.7 23.1 23.6 25.3 30.1 30.9Internet, exploring
visual arts 5.9 6.7 5.2 5.9 4.1 5.2 6.0 5.8 8.1 6.5
LITERATUREListen to poetry or novels 12.4 12.2 12.5 11.3 9.1 12.7 10.0 12.0 16.5 14.8Internet, exploring novels,
poetry or plays 9.2 9.8 8.6 8.5 8.2 9.5 9.5 8.6 10.9 9.9
Source: 2002 Survey of Public Participation in the Arts.

2002 Survey of Public Participation in the Arts
53
National Endowment for the Arts
performing arts event or visiting an art museum.Although it is not known if the respondent traveled outof their home state, these responses may provide insightinto the prevalence of traveling to attend an art event.Only people who went to at least one arts event areincluded in the data.
Among the people who attended an arts event in2002:
• 57 percent took a trip where they attended a per-forming arts event or visited an art museum;
• 47 percent took a trip more than one hour fromhome where they went to an event or an art muse-um;
• 43 percent took a trip of more than 50 miles fromhome where they went to an arts event or an artmuseum; and
• 37 percent of arts attenders took an overnight tripwhere they attended an arts event or went to an artmuseum.
Table 31 displays the results of all respondents.Arts attenders from the East North Central Region
are the least likely to travel to view an arts performanceor museum. Only 51 percent of respondents who hadattended a performance or visited an art museum tooka trip that included the arts.
People from New England who go to the arts are themost likely to take a trip that includes the arts. Amongarts attenders in New England, 63 percent took at leastone trip including the arts in the twelve months endingAugust 2002.
Table 31.Trips to Performing Arts Events Among Arts Attenders,* 2002
Trips More Trips 50+ Than One Hour Miles Overnight
Number of Trips Any Trip From Home From Home Trips
None 43.3 % 52.6 % 57.4 % 62.8 %1-2 37.4 34.8 31.9 28.33+ 19.3 12.6 10.7 8.8
Total 100.0 % 100.0 % 100.0 % 100.0 %
*People who attended at least one arts event.Source: 2002 Survey of Public Participation in the Arts.

2002 Survey of Public Participation in the Arts
55
National Endowment for the Arts
Art Museums and GalleriesArt museums and galleries are attended by more adultsthan any benchmark arts activity. The percentage ofpeople reporting that they would like to visit art muse-ums more is also the highest of any art form. Attendancerates for art museums or galleries remained steadybetween 1992 and 2002. Watching programs on artistsdeclined significantly between 1992 and 2002.
Women are slightly more likely to visit art museumsand galleries, as are people ages 45 to 54.
Worthwhile Facts• More than half of U.S. adults with a graduate level
degree visited an art museum or art gallery in 2002.This is unique among benchmark arts participation— more people in this demographic group visitedthan did not visit in 2002.
• Art museum attendance rates jumped from 30 per-cent for adults in households making $50K to $75Kto 45 percent for adults in households earning morethan $75K.
• One-third of adults 45 to 54 visited an art museumor gallery in 2002. Attendance drops sharply foradults older than 75 years.
• Survey respondents selecting “other race,” whichincludes Asians and Native Americans, are the mostlikely to have visited an art museum. Non-Hispanicwhites are second.
• Crossover of art museum attendance and attendanceat other art activities is extremely high. At least 50percent of attenders at jazz, classical music, opera,ballet, other dance, art festivals and historic sitesalso visited an art museum in 2002.
• Approximately 71 percent of adults who purchasedoriginal art within the last year also visited an artmuseum or gallery in 2002.
• Residents of the Mountain Region are most likely togo to art museums and galleries.
Ballet and DanceAbout 8 million adults (4 percent) went to ballet per-formances in 2002. Ballet attendance rates haveremained steady since 1982. Attendance is second low-est among benchmark activities, exceeding only opera.Watching ballet on television, video or DVD declinedfrom 1992 to 2002.
Women are more likely to attend, watch or performballet. Additionally, education is an important predictorof ballet participation.
Worthwhile Facts• Adults ages 35 to 54 are the most likely to attend a
ballet performance; young adults perform ballet atmuch higher rates than other age groups.
• Opera has the most crossover with ballet. People
CHAPTER 8
summary results forbenchmark activities
Table 32.key facts for Art Museums and Galleries
Percent of U.S. Adults
1982 1992 2002
Visit a museum or gallery 22% 27% 27%Watch on TV, Video or DVD 23 34 25Like to go to more often 31 38 37
More than one-quarter of adults went to art museumsor art galleries in 2002.

2002 Survey of Public Participation in the Arts
56
National Endowment for the Arts
attending “other dance,” including modern, folk andtap, are also more likely to attend ballet.
• The highest ballet crossover from non-arts leisureactivities comes from people who volunteer.Approximately 8 percent of volunteers attended aballet performance in 2002.
• Nearly half of those performing ballet also attendeda ballet performance in 2002.
• Women are more than 12 times more likely thanmen to have taken a ballet class at some point intheir lives.
• Young adults explore dance (including ballet as wellas other types of dance) on the Internet more oftenthan other age groups.
• New England residents are most likely to have goneto the ballet in 2002.
Classical MusicThe percentage of adults attending a classical musicperformance remained at about 12 to 13 percent of theadult population from 1982 to 2002. People watchingperformances via television, video or DVD dropped sig-nificantly between 1992 and 2002. The share of adultslistening on the radio and to classical music recordingsalso dropped between 1992 and 2002, as did the per-centage of adults responding that they like classicalmusic.
As with other forms of art, education is an importantfactor in describing the classical music audience. Theattendance rate for adults with a high school degree isaround 5 percent, regardless of income, while about 25percent of adults with at least a college degree attendeda performance in 2002. College graduates are threetimes more likely than high school graduates to listen toclassical music on the radio.
Worthwhile Facts• Women are more likely to watch classical music per-
formances on TV, VCR or DVD, as well as morelikely to listen to classical music on the radio andvia recordings. Women are slightly more likely toattend performances.
• While 45- to 64-year-olds are the most likely toattend performances, older adults are more likely towatch via television, VCR and DVD.
• Adults attending a ballet or opera performance aremuch more likely to attend a classical music per-formance.
• Nearly one in every four people who volunteer intheir free time attended a classical music perform-ance in 2002.
• Almost 30 percent of those who have taken a musicappreciation class in their lifetime attended a clas-sical music performance in 2002. About 20 percentof those taking music lessons to play an instrumentattended a 2002 performance.
• Though women perform classical music at slightlyhigher rates than men, men perform more in public.
• Mountain Region residents are most likely to attenda classical music performance.
JazzOne-quarter of adults listen to jazz on the radio, abouttwice the number that go to jazz performances. All formsof media participation in jazz declined between 1992and 2002. A small number of adults report that they per-form jazz.
The live audience for jazz performances is balanced
Table 33.key facts for Ballet and Dance
Percent of U.S. Adults
1982 1992 2002
Attend a performance (ballet) 4% 5% 4%Watch on TV, Video or DVD* –– 20 13Like to go to more often (ballet) 12 18 14
*All types of dance.
Four percent of adults went to a ballet performance in 2002.
Table 34.key facts for classical music
Percent of U.S. Adults
1982 1992 2002
Attend a performance 13% 13% 12%Watch on TV, Video or DVD 25 26 18Listen to on the radio 20 31 24Listen to recordings 22 24 19Perform –– 4 2Like to listen to classical music 28 33 27Like to go to more often 18 25 23
About one-quarter of adults listen to classical music onthe radio.

2002 Survey of Public Participation in the Arts
57
National Endowment for the Arts
between men and women, but more women than menlisten to jazz or watch jazz on television. Unlike othertypes of performing arts studied in the SPPA, a higherpercentage of African Americans attend jazz perform-ances than any other racial or ethnic group.
Worthwhile Facts• Adults ages 25 to 54 are more likely to go to jazz
performances than older people.• Compared with people with only a high school
degree, college graduates are more than twice aslikely to attend a jazz performance and three timesas likely to perform jazz. However, college graduatesare only slightly more likely to watch jazz on televi-sion or prefer jazz music.
• People who go to opera or ballet often go to jazz per-formances. More than four in ten adults who saidthey attended an opera or ballet performance in thepast twelve months also went to a jazz performance.There is also high crossover with classical musicperformances.
• Writers are also jazz participants. Over one-quarterof people who say they have written poems, novelsor plays in the last twelve months also attended ajazz performance in the past year.
• People who attend sporting events are more likelythan others to go to jazz performances.
• Although low-income men do not attend, watch orlisten to jazz as much as higher income men, theyhave relatively high participation in performing jazz.
• Two-thirds of people who go to jazz performanceslisten to jazz on the radio.
• Residents of Mountain and Pacific states are mostlikely to go to jazz performances.
Musical PlaysIn 2002, more people reported attending a musical playthan any other type of performing arts. Attendance ratesfor musicals were stable from 1982 to 2002, but mediaparticipation declined since 1992. The percentagereporting they like to listen to show tunes or operettasalso decreased from 1992 to 2002.
As with other art forms, highly educated adults aremuch more likely to attend musicals.
Worthwhile Facts• The audience for musicals is more than 60 percent
female. The only other performing art with a morefemale-dominated audience is ballet (68 percentfemale).
• There is a large jump in all forms of participation inmusicals for individuals with more formal education.
• Non-Hispanic whites attend musicals at a muchhigher rate than other ethnicities or races.
• There is very high crossover for attenders of balletand opera with musicals. Over 60 percent of operaattenders also attended a musical in 2002.
• About 44 percent of those viewing a musical on tel-evision also attended a performance of a musical.This is the highest watching/attending crossover ofany of the performing arts.
• Residents of the Middle Atlantic Region, whichincludes New York City, are the most likely to go toa musical.
Table 35.key facts for jazz
Percent of U.S. Adults
1982 1992 2002
Attend a performance 10% 11% 11%Watch on TV, Video or DVD 18 22 16Listen to on the radio 18 28 24Listen to recordings 20 21 17Perform –– 2 1Like to listen to jazz music 26 34 28Like to go to more often 18 25 24
About one-quarter of adults listen to jazz on the radio.
Table 36.key facts for musicals
Percent of U.S. Adults
1982 1992 2002
Attend a performance 19% 17% 17%Watch on TV, Video or DVD 21 17 12Listen to on the radio 4 4 2Listen to recordings 9 6 4Perform –– 4 2Like to listen to
show tunes/operettas 23 28 17Like to go to more often 33 36 30
One in six adults saw a musical in 2002.

2002 Survey of Public Participation in the Arts
58
National Endowment for the Arts
Non-Musical PlaysAttendance at plays has ranged from 12 to 14 percentof the adult population since 1982. The percentage ofadults viewing plays on television, VCR or DVDdeclined from 26 to 9 percent of the population between1982 and 2002. Nearly 4 percent of adults reported thatthey read a play in 2002.
People with more formal education, and with higherincomes, are more likely to attend non-musical plays.
Worthwhile Facts• About 27 percent of adults report they would like to
attend a play more often, the second highest rate ofany of the benchmark performing arts (behind musi-cals at 30 percent).
• Over 30 percent of writers also attended a play in2002.
• About one in every four people who volunteer intheir leisure time attended a play in 2002.
• More people attend non-musical plays than watchthem at home. Among performing arts, this is trueonly for plays and musicals. The reverse is true forother benchmark performing arts.
• Adults who are 45 to 54 years old are the most like-ly to attend a play. As with other arts, the primeaudience for watching plays at home is older (65 to74 years old).
• New England residents attend plays more frequent-ly than adults in other regions.
OperaOpera attendance has remained steady at about 3 per-cent of the adult population since 1982. Participationthrough the media has dropped. People reportingwatching opera on television dropped from 12 to 6 per-cent of the adult population from 1992 to 2002. Thenumber of adults listening on the radio also droppedsince 1992.
The relationship between formal education and par-ticipation is more pronounced for opera than for other artforms. One percent of adults without any college educa-tion attended opera in 2002, while 11 percent of adultswith advance degrees said that they attended an opera.
Worthwhile Facts• Compared with other art forms, relatively more peo-
ple attending, listening or watching opera are 65 to74 years old.
• Participation in all opera activities is more commonamong non-Hispanic whites than among Hispanicsand African Americans.
• People with advanced degrees are much more like-ly to participate in opera than people with collegedegrees.
• Those who attend ballet performances have highcrossover with those attending opera. Crossover isalso high for attenders of classical music perform-ances.
• A greater share of Mountain Region residents reportgoing to opera than any other region.
Table 37.key facts for PLAYS
Percent of U.S. Adults
1982 1992 2002
Attend a performance 12% 14% 12%Watch on TV, Video or DVD 26 18 9Listen to on the radio 4 3 2Perform –– 2 1Like to read plays –– –– 4Like to go to more often 25 34 27
About 12 percent of adults attended a non-musicalplay in 2002.
Table 38.key facts for opera
Percent of U.S. Adults
1982 1992 2002
Attend a performance 3% 3% 3%Watch on TV, Video or DVD 12 12 6Listen to on the radio 7 9 6Listen to recordings 8 7 6Perform –– 1 1Like to listen to opera 10 12 10Like to go to more often 7 11 12
Opera has the lowest rate of attendance among thebenchmark arts activities.
2002 Survey of Public Participation in the Arts
59
National Endowment for the Arts
In 1982, the National Endowment for the Arts(NEA) initiated the Survey of PublicParticipation in the Arts (SPPA) to examine thepublic’s involvement in a variety of arts and artforms. The survey examines general participa-
tion in the performing arts, visual arts, historic site vis-its, music and literature.
1982 and 1985 Surveys of PublicParticipation in the ArtsThe U.S. Census Bureau administered the first SPPAin conjunction with the 1982 National Crime Survey,which surveyed over 72,000 individuals. More than17,000 respondents over 18 years of age were inter-viewed for the SPPA.
The survey concentrated primarily on live arts par-ticipation, consisting of ten questions. The survey askedthe live arts questions of all survey respondents. On arotating basis, it asked questions pertaining to arts edu-cation, non-arts leisure activities, arts facilities, musicpreferences, arts creation and other participation,media engagement and barriers to attending live per-formances categories. As a result, the sample sizes forthe latter questions were smaller than for the live artscategory. Approximately 25 percent of the interviewswere completed by phone.
In 1985, the NEA sponsored a second SPPAthrough the U.S. Census Bureau as part of the newlynamed National Crime Victimization Survey. It wasnearly identical to the 1982 survey.
1992 Survey of PublicParticipation in the ArtsThe third SPPA, conducted in 1992, surveyed 12,736individuals over 18 years of age and followed the sameformat as previous surveys. However, questions aboutarts education, non-arts leisure activities, etc. wereasked in the last 6 months of the year, thereby provid-ing a larger sample size for these questions than in the1982 survey. Additionally, the NEA refined the surveyinstrument by adding, omitting and modifying variousquestions and sections. For example, the arts educationcategory included new questions about the location ofarts education and if survey respondents had taken artseducation lessons in the last year. The survey droppedquestions about craftwork lessons. Some questions con-cerning live attendance, recreation lifestyle, musicpreferences, arts creation and media participation werealso modified.
1997 Survey of PublicParticipation in the ArtsFrom June to October of 1997, the NEA conducted afourth edition of the SPPA. This survey was not admin-istered through the U.S. Census Bureau’s NationalCrime Victimization Survey. Instead, the NEA retainedWestat Corporation of Rockville, Maryland, a privateresearch firm, to conduct a stand-alone telephone sur-vey. Using a random-digit dial telephone survey plan,over 12,000 individuals over 18 years of age were inter-viewed. The survey instrument included a number ofquestions not asked on prior SPPA surveys. Due to theconsiderable differences in survey methodologies, the1997 telephone survey produced results that are not
APPENDIX Asurvey of public participation in the arts,
background and methodology

2002 Survey of Public Participation in the Arts
60
National Endowment for the Arts
comparable to previous or subsequent surveys. The1997 survey can only be analyzed as a stand-alone,point-in-time survey, and not in an SPPA historicalanalysis.
2002 Survey of PublicParticipation in the ArtsIn 2002, the NEA sponsored its fifth and most recentSPPA. For the first time, the 2002 SPPA was imple-mented as a supplement to the U.S. Census Bureau’sCurrent Population Survey (CPS), a research instru-ment issued monthly to approximately 60,000 house-holds throughout the nation for use by the U.S. Bureauof Labor Statistics. The U.S. Census Bureau weightedeach survey record so that the survey sample wouldreflect the nation’s estimated demographic and geo-graphic profile.
A total of 17,135 respondents in the August 2002CPS participated in the 2002 SPPA. Respondents wereasked all of the 2002 SPPA questions, resulting in anoverall sample size applicable to the entire survey.
In general, the 2002 survey instrument followed thatused in the 1992 SPPA, only incorporating slight mod-ifications. For instance, the media engagement catego-ry added a video discs (DVD) option to questions aboutwatching arts programs via television. The music pref-erences category added and omitted various music cat-egories, and two new sections were added to the end ofthe survey. The first new section asked about trips awayfrom home to attend arts events or art museums, and thesecond new section asked the individual’s frequency ofreading about, discussing, or accessing informationabout the arts via the Internet.

2002 Survey of Public Participation in the Arts
61
National Endowment for the Arts
The basic CPS collects primarily laborforce data about the civilian non-institu-tional population. Interviewers ask ques-tions concerning labor force participationabout each member 15 and over in every
sample household.The present monthly CPS sample was selected from
the 1990 Decennial Census files with coverage in all 50states and the District of Columbia. The sample is con-tinually updated to account for new residential con-struction. To obtain the sample, the United States wasdivided into 2,007 geographic areas. In most states, ageographic area consisted of a county or several con-tiguous counties. In some areas of New England andHawaii, minor civil divisions are used instead of coun-ties. These 2,007 geographic areas were then groupedinto 754 strata, and one geographic area was selectedfrom each stratum.
About 60,000 occupied households are eligible forinterview every month out of the 754 strata.Interviewers are unable to obtain interviews at about4,500 of these units. This occurs when the occupantsare not found at home after repeated calls or areunavailable for some other reason.
Each month’s sample is composed of eight rotationgroups that rotate on a schedule of four months in sam-ple, eight months out, and four months back again.
August 2002, Survey of PublicParticipation in the Arts (SPPA)SupplementIn addition to the basic CPS, interviewers asked sup-plementary questions on public participation in thearts. Households in the outgoing rotation groups areeligible sample households for the supplement; there-fore only 25 percent of the basic CPS households weresampled. The SPPA supplement attempted to obtainself-responses from household members ages 18 andover. Proxy responses were allowed if attempts for aself-response were unsuccessful.
The supplement contained questions about thehousehold member’s participation in various artisticactivities from August 1, 2001 to August 1, 2002. Itasked about the type of artistic activity, the frequency ofparticipation, training and exposure, music prefer-ences, length of travel for trips to artistic events, school-age socializations, and computer usage related to artis-tic information. Interviews were conducted during theperiod of August 18-24, 2002.
APPENDIX bdata collection

2002 Survey of Public Participation in the Arts
62
National Endowment for the Arts
The tests for statistical significance con-ducted in this study used standard statis-tical methods for calculating standarderrors and conducting difference of pro-portions tests or other hypothesis tests.
As the SPPA data were not collected using a simplerandom sample, and were weighted to represent theU.S. adult population, the standard errors were adjust-ed for the design effect. The following describes thedesign effect figure used in the 2002 SPPA SummaryReport analysis.
The “design effect” measures the increase in vari-ance in a sample due to the sample design and perform-ance. It is calculated using a complex formula thatincludes the CPS replicate weights, or is derived withknowledge of the primary sampling units used in col-lecting the data. The Demographic Statistical Methods
Division (DSMD) of the U.S. Census Bureau calculatedthe design effect to be used in the analysis of 2002SPPA data.
DSMD computed an average design effect of 2.8 forthe 2002 SPPA. The comparable design effect for 1992was 4.75.
This 2002 SPPA report reflects the use of 4.75 asthe design effect for 1992 data, and 2.8 as the designeffect for 2002 data in all statistical significance testing.
Please see Technical Paper 63RV, found at:www.bls.census.gov/cps/tp/tp63.htm, for more informa-tion on the calculation of the design effect for the 2002SPPA.
Readers can obtain the Census Bureau’s Sourceand Accuracy Statement for the CPS and SPPA sup-plement by contacting the NEA Research Division at202-682-5424.
APPENDIX cstandard errors, hypothesis testing
and design effect

2002 Survey of Public Participation in the Arts
63
National Endowment for the Arts
The following is a reader-friendly interpretation of the2002 SPPA.
This month we are asking some additional questionsabout leisure activities in which each household mem-ber participated.
The Bureau of the Census is collecting this informa-tion for the National Endowment for the Arts. The sur-vey is authorized by Title 20, United States Code, sec-tion 954 and Title 13, United States Code, section 8.Participation in this interview is voluntary and there areno penalties for not answering some or all of the ques-tions.
The information you give is important and it willhelp us better understand the characteristics of peoplewho participate in the arts and those that do not. It alsoprovides information about the factors that may influ-ence your decision to participate.
The following questions are about your activitiesduring the last 12 months between August 1, 2001 andAugust 1, 2002. Unless otherwise indicated, the answerformat for questions is assumed to be yes/no.
Participation via Attendance1. With the exception of elementary or high school
performances, did you go to a live jazz perform-ance during the last 12 months? If yes, how manytimes did you do this during the last 12 months?
2. [With the exception of elementary or high schoolperformances] Did you go to a live classical musicperformance such as symphony, chamber, orchoral music during the last 12 months? If yes,how many times did you do this during the last 12months?
3. [With the exception of elementary or high school
performances] Did you go to a live opera duringthe last 12 months? If yes, how many times didyou do this during the last 12 months?
4. [With the exception of elementary or high schoolperformances] Did you go to a live musical stageplay or an operetta during the last 12 months? Ifyes, how many times did you do this during thelast 12 months?
5. [With the exception of elementary or high schoolperformances] Did you go to a live performance ora nonmusical stage play during the last 12months? If yes, how many times did you do thisduring the last 12 months?
6. [With the exception of elementary or high schoolperformances] Did you go to a live ballet perform-ance during the last 12 months? If yes, how manytimes did you do this during the last 12 months?
7. [With the exception of elementary or high schoolperformances] Did you go to a live dance perform-ance other than ballet, such as modern, folk, or tapduring the last 12 months? If yes, how many timesdid you do this during the last 12 months?
8. [During the last 12 months] Did you visit an artmuseum or gallery? If yes, how many times didyou do this during the last 12 months?
9. [During the last 12 months] Did you visit an artfair or festival, or a craft fair or festival? If yes, howmany times did you do this during the last 12months?
10. [During the last 12 months] Did you visit an his-toric park or monument, or tour buildings orneighborhoods for their historic or design value? Ifyes, how many times did you do this during thelast 12 months?
APPENDIX d2002 survey of public participation
in the arts (SPPA)

2002 Survey of Public Participation in the Arts
64
National Endowment for the Arts
11. With the exception of books required for work orschool, did you read any books during the last 12months? If yes, how many did you read during thelast 12 months?
12. [During the last 12 months] Did you read any:a. Plays? b. Poetry?c. Novels or short stories?
Participation via MEDIA 1. [During the last 12 months] Did you listen to a read-
ing of poetry, either live or recorded?
2. [During the last 12 months] Did you listen to a read-ing of novels or books, either live or recorded?
3. [During the last 12 months] Did you watch a jazz per-formance on television, a video (VCR) tape, or a video(DVD) disc? If yes, how many did you watch on tele-vision, a video (VCR) tape, or a video (DVD) disc?
4. [During the last 12 months] Did you listen to jazz:a. On the radio?b. On records, tapes, or compact discs?
5a. [During the last 12 months] Did you watch a clas-sical music performance on television, a video(VCR) tape, or a video (DVD) disc? If yes, howmany did you watch on television, a video (VCR)tape, or a video (DVD) disc?
5b. [During the last 12 months] Did you listen to clas-sical music:a. On the radio?b. On records, tapes, or compact discs?
6a. [During the last 12 months] Did you watch anopera on television, a video (VCR) tape, or a video(DVD) disc? If yes, how many did you watch ontelevision, a video (VCR) tape, or a video (DVD)disc?
6b. [During the last 12 months] Did you listen to operamusic:a. On the radio?b. On records, tapes, or compact discs?
7. With the exception of movies, did you watch amusical stage play or an operetta on television, a
video (VCR) tape, or a video (DVD) disc duringthe last 12 months? If yes, how many did youwatch on television, a video (VCR) tape, or a video(DVD) disc?
8a. With the exception of movies, situation comedies,or TV series, did you watch a nonmusical stageplay on television, a video (VCR) tape, or a video(DVD) disc during the last 12 months? If yes, howmany did you watch on television, a video (VCR)tape, or a video (DVD) disc?
8b. [During the last 12 months] Did you listen to aradio performance of a nonmusical stage play?
i. With the exception of music videos, did you watchon television, a video (VCR) tape, or a video(DVD) disc dance, such as ballet, modern, folk, ortap during the last 12 months? If yes, how manydid you watch on television, a video (VCR) tape,or a video (DVD) disc?
ii. [During the last 12 months] Did you watch a pro-gram about artists, art works, or art museums ontelevision, a video (VCR) tape, or a video (DVD)disc? If yes, how many did you watch on televi-sion, a video (VCR) tape, or a video (DVD) disc?
LEISURE ActivitiesThe following activities are about your participation inother leisure activities. 1a. Approximately how many hours of television do
you watch on an average day?1b. During the last 12 months, did you go out to the
movies?1c. With the exception of youth sports, did you go to
any amateur or professional sports events duringthe last 12 months?
1d. During the last 12 months, did you go to anamusement or theme park, a carnival, or a similarplace of entertainment?
1e. During the last 12 months, did you jog, liftweights, walk, or participate in any other exerciseprogram?
1f. During the last 12 months, did you participate inany sports activity, such` as softball, basketball,golf, bowling, skiing, or tennis?
1g. Did you participate in any outdoor activities, suchas camping, hiking, or canoeing during the last 12months?
2002 Survey of Public Participation in the Arts
65
National Endowment for the Arts
1h. Did you do volunteer or charity work during thelast 12 months?
1i. Did you make repairs or improvements on yourown home during the last 12 months?
1j. Did you work with indoor plants or do any garden-ing for pleasure during the last 12 months?
2. [During the last 12 months] Did you work withpottery, ceramics, jewelry, or do any leatherworkor metalwork? If yes, what type?
3. [During the last 12 months] Did you do any weav-ing, crocheting, quilting, needlepoint, or sewing?If yes, what type?
4. [During the last 12 months] Did you make photo-graphs, movies, or videotapes as an artistic activi-ty? If yes, what type?
5. [During the last 12 months] Did you do any paint-ing, drawing, sculpture, or printmaking activities?If yes, what type?
6a. With the exception of work or school, did you doany creative writing such as stories, poems, orplays during the last 12 months?
6b. Were any of your writings published?
7a. Did you write or compose any music during thelast 12 months?
7b. Was your musical composition played in a publicperformance or rehearsed for a public performance?
8a. Do you own any original pieces of art, such aspaintings, drawings, sculpture, prints, or litho-graphs?
8b. Did you purchase or acquire any of these piecesduring the last 12 months?
9a. During the last 12 months, did you perform orrehearse any jazz music?
9b. Did you play any jazz in a public performance orrehearse for a public performance?
10a. During the last 12 months, did you perform orrehearse any classical music?
10b. Did you play classical music in a public perform-ance or rehearse for a public performance?
11a. During the last 12 months, did you sing any musicfrom an opera?
11b. Did you sing in a public opera performance orrehearse for a public performance?
12a. During the last 12 months, did you sing musicfrom a musical play or operetta?
12b. Did you sing in a public performance of a musicalplay or operetta or rehearse for a public perform-ance?
12c. During the last 12 months, did you sing in a pub-lic performance with a chorale, choir, or glee clubor other type of vocal group, or rehearse for a pub-lic performance?
13. [During the last 12 months] Did you act in a pub-lic performance of a nonmusical play or rehearsefor a public performance?
14a. [During the last 12 months] Did you dance anyballet?
14b. Did you dance ballet in a public performance orrehearse for a public performance?
15a. [During the last 12 months] Did you do any danc-ing other than ballet such as modern, folk, or tap?
15b. Did you dance modern, folk, or tap in a publicperformance?
PreferencesFor the questions below, please select all that apply.1a. The following is a list of events that some people
like to attend. If you could go to any of theseevents as often as you wanted, which ones wouldyou go to more often that you do now? Pleaseselect one or more of the following categories.(1) Jazz and music performances(2) Classical music performances(3) Operas(4) Musical plays or operettas(5) Nonmusical plays(6) Ballet performances(7) Dance performances other than ballet(8) Art museums or galleries(9) All(10) None of these
2002 Survey of Public Participation in the Arts
66
National Endowment for the Arts
1b. Of the events mentioned above, which of thesewould you like to do most?
2a. The following is a list of some types of music.Which of these types of music do you like to listento? Please select one or more of the following cat-egories. (1) Classical/Chamber music(2) Opera(3) Operetta/Broadway musicals/Show tunes(4) Jazz(5) Reggae(6) Rap/Hip-hop(7) Dance music/Electronica(8) Blues/Rhythm and blues(9) Latin/Spanish/Salsa(10) Big band/Swing(11) Parade/Marching band(12) Country and western(13) Bluegrass(14) Classical rock/Oldies(15) The music of a particular Ethnic/National
tradition(16) Contemporary folk music(17) Mood/Easy listening(18) New age/World music(19) Choral/Glee club(20) Hymns/Gospel(21) Rock/Heavy metal(22) All(23) None/Don’t like to listen to music
2b. Of the music types mentioned above that you saidyou liked, which do you like best?
Arts LEARNING1. Have you ever taken lessons or classes in music
— either voice training or playing an instrument?a. Did you take these lessons or classes when youwere:i. Less than 12 years old?ii. 12-17 years old?iii. 18-24 years old?iv. 25 or older?
b. [If taken prior to 18 years old] Were the lessons orclasses offered by the elementary or high schoolyou were attending or did you take these lessonselsewhere?
i. Elementary or high schoolii. Elsewhereiii. Both
c. Did you take any of these lessons or classes in thepast year?
2. [Have you ever taken lessons or classes] in visualarts such as sculpture, painting, printmaking,photography, or filmmaking?
a. Did you take these lessons or classes when youwere:i. Less than 12 years old?ii. 12-17 years old?iii. 18-24 years old?iv. 25 or older?
b. [If taken prior to 18 years old] Were the lessons orclasses offered by the elementary or high schoolyou were attending or did you take these lessonselsewhere?i. Elementary or high schoolii. Elsewhereiii. Both
c. Did you take any of these lessons or classes in thepast year?
3. [Have you ever taken lessons or classes] in actingor theater?
a. Did you take these lessons or classes when youwere:i. Less than 12 years old?ii. 12-17 years old?iii. 18-24 years old?iv. 25 or older?
b. [If taken prior to 18 years old] Were the lessons orclasses offered by the elementary or high schoolyou were attending or did you take these lessonselsewhere?i. Elementary or high schoolii. Elsewhereiii. Both
c. Did you take any of these lessons or classes in thepast year?
4. [Have you ever taken lessons or classes] in ballet?a. Did you take these lessons or classes when you
were:i. Less than 12 years old?
2002 Survey of Public Participation in the Arts
67
National Endowment for the Arts
ii. 12-17 years old?iii. 18-24 years old?iv. 25 or older?
b. [If taken prior to 18 years old] Were the lessons orclasses offered by the elementary or high schoolyou were attending or did you take these lessonselsewhere?i. Elementary or high schoolii. Elsewhereiii. Both
c. Did you take any of these lessons or classes in thepast year?
5. [Have you ever taken lessons or classes] in dance,other than ballet such as modern, folk or tap?
a. Did you take these lessons or classes when youwere:i. Less than 12 years old?ii. 12-17 years old?iii. 18-24 years old?iv. 25 or older?
b. [If taken prior to 18 years old] Were the lessons orclasses offered by the elementary or high schoolyou were attending or did you take these lessonselsewhere?i. Elementary or high schoolii. Elsewhereiii. Both
c. Did you take any of these lessons or classes in thepast year?
6. [Have you ever taken lessons or classes] in cre-ative writing?
a. Did you take these lessons or classes when youwere:\i. Less than 12 years old?ii. 12-17 years old?iii. 18-24 years old?iv. 25 or older?
b. [If taken prior to 18 years old] Were the lessons orclasses offered by the elementary or high schoolyou were attending or did you take these lessonselsewhere?i. Elementary or high schoolii. Elsewhereiii. Both
c. Did you take any of these lessons or classes in thepast year?
7. [Have you ever taken lessons or classes] in artappreciation or art history?
a. Did you take these lessons or classes when youwere:i. Less than 12 years old?ii. 12-17 years old?iii. 18-24 years old?iv. 25 or older?
b. [If taken prior to 18 years old] Were the lessons orclasses offered by the elementary or high schoolyou were attending or did you take these lessonselsewhere?i. Elementary or high schoolii. Elsewhereiii. Both
c. Did you take any of these lessons or classes in thepast year?
8. [Have you ever taken a class] in music apprecia-tion?
a. Did you take these lessons or classes when youwere:i. Less than 12 years old?ii. 12-17 years old?iii. 18-24 years old?iv. 25 or older?
b. [If taken prior to 18 years old] Were the lessons orclasses offered by the elementary or high schoolyou were attending or did you take these lessonselsewhere?i. Elementary or high schoolii. Elsewhereiii. Both
c. Did you take any of these lessons or classes in thepast year?
9a. What is the highest grade [or year) of regularschool your Father completed?(1) Less than 1st grade(2) 1st, 2nd, 3rd, or 4th grade(3) 5th or 6th grade(4) 7th or 8th grade(5) 9th grade

National Endowment for the Arts
(6) 10th grade(7) 11th grade(8) 12th grade, no diploma(9) High School graduate – high school diploma
or the equivalent (For example: GED)(10) Some college but no degree(11) Associate degree in college – Occupa-
tional/vocational program(12) Associate degree in college – Academic pro-
gram(13) Bachelor’s degree (For example: BA, AB, BS)(14) Master’s degree (For example: MA, MS,
MEng, MEd, MSW, MBA)(15) Professional School Degree (For example:
MD, DDS, DVM, LLB, JD)(16) Doctorate Degree (For example: PhD, EdD)
9b. What is the highest grade [or year) of regularschool your Mother completed? (1) Less than 1st grade(2) 1st, 2nd, 3rd, or 4th grade(3) 5th or 6th grade(4) 7th or 8th grade(5) 9th grade(6) 10th grade(7) 11th grade(8) 12th grade, no diploma(9) High School graduate – high school diploma
or the equivalent (For example: GED)(10) Some college but no degree(11) Associate degree in college – Occupa-
tional/vocational program(12) Associate degree in college – Academic pro-
gram(13) Bachelor’s degree (For example: BA, AB, BS)(14) Master’s degree (For example: MA, MS,
MEng, MEd, MSW, MBA)(15) Professional School Degree (For example:
MD, DDS, DVM, LLB, JD)(16) Doctorate Degree (For example: PhD, EdD)
Travel/TripsEarlier in the supplement, you were asked about tripstaken in the last 12 months that included attending atleast one performing arts event (classical music or jazzconcert, musical or stage play, dance or opera perform-ance) or visiting art museums or galleries.
Sometimes you may take trips that include attend-ing a performing arts event or visiting an art museumwhere you are away from home for one or several nightsor return home in one day.
1. In total, how may trips did you take that includedattending a performing arts event or visiting an artmuseum in the last 12 months? If yes:
a. How many of these trips were one hour or moreaway from home?
b. How many were 50 miles or more, one way, awayfrom home?
Internet1a. Do you use the Internet?1b. Do you use the Internet to learn about, listen to, or
discuss topics related to:a. Any kind of music?b. Dance?c. Theater?d. Opera?
1c. Do you use the Internet to learn about, view, ordiscuss topics related to the visual arts – painting,sculpture, or so on?
1d. Do you use the Internet to learn about, read, ordiscuss topics related to literature – novels, poet-ry, or plays?
1e. In a typical week, about how many total minutesor hours do you use the Internet to explore (i.e.visit websites or interact on chat rooms, Usenetgroups, discussion forums, bulletin boards, etc.)these topics (music, the visual arts, dance, theater,opera, literature or related topics)? Exclude e-mailor downloads of large music, video, or data files.
2002 Survey of Public Participation in the Arts
68
2002 Survey of Public Participation in the Arts
69
National Endowment for the Arts
NotesNote # 8. Studies of the Arts Public: A Status Report(March 1984)
Note # 12. Audience Crossover: Media Participationand Attending Live Events (June 1985)
Note # 14. Age, Desire, and Barriers to IncreaseAttendance at Performing Arts Events and ArtMuseums (February 1986)
Note # 16. Public Participation in the Arts by Urbanand Rural Residence (May 1986)
Note # 18. Population Location and the Barriers of‘Art Form Not Available’ and ‘Too Far To Go’(September 1986)
Note # 27. Public Participation in the Arts: 1982 and1985 Compared (December 1987)
Note # 50. Public Participation in the Arts: 1982 and1992 (October 1993)
Note # 51. Demographic Differences in ArtsAttendance: 1982-1992 (February 1994)
Note # 52. Demographic Differences in ArtsParticipation Via Broadcast and Recorded Media:1982-1992 (February 1994)
Note # 55. Public Participation in the Arts in Regionaland Metropolitan Areas, 1982-1992 (June 1995)
Note #70. Survey of Public Participation in the Arts:Half of U.S. Adults Attended Arts Performances orExhibitions, 1997 (September 1998)
Note #71. Demographic Characteristics of ArtsAttendance: 1997 (January 1999)
Note #72. Arts Participation by Region, State, andMetropolitan Area (January 1999)
Note #81. 2002 Survey of Public Participation in theArts (July 2003)
Note #82. Demographic Characteristics of ArtsAttendance, 2002 (July 2003)
ReportsReport # 21. Socialization and Participation in theArts
Report # 22. Who Reads Literature: The Future of theUnited States As a Nation of Readers
Report # 23. The Audience for American ArtMuseums
Report # 24. Expanding the Audience for thePerforming Arts
Report # 25. Race, Ethnicity, and Arts Participation
Report # 26. Summary Report: 12 Local Surveys ofPublic Participation in the Arts
Report # 27. Arts Participation in America: 1982-1992
APPENDIX Eresearch division reports and
notes of related interest
2002 Survey of Public Participation in the Arts
70
National Endowment for the Arts
Report # 30. A Practical Guide to Arts ParticipationResearch
Report # 31. Jazz in America: Who’s Listening
Report # 32. American Participation in Opera andMusical Theater 1992
Report # 33. Turning On and Tuning In: PublicParticipation in the Arts Via Media in the UnitedStates
Report # 34. Age and Arts Participation with a Focuson the Baby Boom Cohort
Report # 35. American Participation in Theater
Report # 36. Effects of Arts Education onParticipation in the Arts
Report # 39. 1997 Survey of Public Participation inthe Arts: Summary Report
Report #41. The Geography of Participation in theArts and Culture
Report #42. Age and Arts Participation: 1982-1997
Further information on these Research Notes andReports can be found on the National Endowment forthe Arts web site:
Notes — www.arts.gov/pub/ResearchNotes.htmlReports — www.arts.gov/pub/ResearchReports.html
For a broader overview of arts participation literature,see: Guide to the Literature on Participation in the Arts (McCarthy, et. al., www.rand.org/publications/DRU/DRU2308)