national education trust · pdf filel pupil premium funded activity is appropriate for...
TRANSCRIPT

www.sheffield.gov.uk/education
Sheffield Pupil PremiumAction Research GroupTackling Educational Disadvantageby Understanding What Works
EDITED BY MARC ROWLAND
May 2015
National Education TrustNET

National Education TrustNET
Contents
A Foreword . . . . . . . . . . . . . . . . . . . . . . . . . . . . . . . . . . . . . . . . . . . . . . . . . . . . . . . . . . . . . . . . . . . . . . . . . . . . . 1
B The Project. . . . . . . . . . . . . . . . . . . . . . . . . . . . . . . . . . . . . . . . . . . . . . . . . . . . . . . . . . . . . . . . . . . . . . . . . . . . 2
C What the Data Tells Us . . . . . . . . . . . . . . . . . . . . . . . . . . . . . . . . . . . . . . . . . . . . . . . . . . . . . . . . . . . . . . . . . 5
D Action Research Reports . . . . . . . . . . . . . . . . . . . . . . . . . . . . . . . . . . . . . . . . . . . . . . . . . . . . . . . . . . . . . . 9
Stocksbridge Junior School . . . . . . . . . . . . . . . . . . . . . . . . . . . . . . . . . . . . . . . . . . . . . . . . . . . . . . . . . . . . . . . . . . . . 9
Ballifield Primary School . . . . . . . . . . . . . . . . . . . . . . . . . . . . . . . . . . . . . . . . . . . . . . . . . . . . . . . . . . . . . . . . . . . . . . 16
Stocksbridge High School. . . . . . . . . . . . . . . . . . . . . . . . . . . . . . . . . . . . . . . . . . . . . . . . . . . . . . . . . . . . . . . . . . . . . 23
Talbot Specialist School . . . . . . . . . . . . . . . . . . . . . . . . . . . . . . . . . . . . . . . . . . . . . . . . . . . . . . . . . . . . . . . . . . . . . . . 25
Tinsley Meadows School . . . . . . . . . . . . . . . . . . . . . . . . . . . . . . . . . . . . . . . . . . . . . . . . . . . . . . . . . . . . . . . . . . . . . . 29
Mansel Primary School. . . . . . . . . . . . . . . . . . . . . . . . . . . . . . . . . . . . . . . . . . . . . . . . . . . . . . . . . . . . . . . . . . . . . . . . 32
Hucklow Primary School . . . . . . . . . . . . . . . . . . . . . . . . . . . . . . . . . . . . . . . . . . . . . . . . . . . . . . . . . . . . . . . . . . . . . 34
Handsworth Grange Community Sports College . . . . . . . . . . . . . . . . . . . . . . . . . . . . . . . . . . . . . . . . . . . . . . 36
Carfield Primary School . . . . . . . . . . . . . . . . . . . . . . . . . . . . . . . . . . . . . . . . . . . . . . . . . . . . . . . . . . . . . . . . . . . . . . 42
Hunter’s Bar School . . . . . . . . . . . . . . . . . . . . . . . . . . . . . . . . . . . . . . . . . . . . . . . . . . . . . . . . . . . . . . . . . . . . . . . . . . 43
E Ten Reflections to Inform Future Pupil Premium Use . . . . . . . . . . . . . . . . . . . . . . . . . . . . . . . . . . 45
F Acknowledgements . . . . . . . . . . . . . . . . . . . . . . . . . . . . . . . . . . . . . . . . . . . . . . . . . . . . . . . . . . . . . . . . . 45

1
National Education TrustNET
A The Foreword
When we started our Pupil Premium Action ResearchProject eighteen months ago, we were very keen toinvestigate best practice in schools at regional andnational levels, in order to develop our own innovativeapproaches here in Sheffield.
The selection of schools involved reflects a wide anddiverse range – seven primaries (including one infantand one junior), one from each locality; twosecondaries which are feeder schools for at least oneeach of the primaries; and a specialist school. Eachadds its unique context and, without doubt, this hascontributed to the generation of a rich bank ofexpertise and experience.
The regular opportunities for colleagues to collaborateon aspects of the project and meet to discuss progress,has been integral to the success of the venture. It hasgiven us the chance to share developing practice butalso to analyse the challenges schools are facing anddiscuss possible solutions – including stopping anactivity altogether if it wasn’t working and trying something different! Many of the creative and effectivestrategies developed are evident in the following school action research reports and there are alreadyencouraging signs of impact.
Many thanks to all those involved for your commitment and enthusiasm and a big thank you also to MarcRowland, National Education Trust, who has been an excellent partner, working with us to lead, challenge andsupport in our drive to ensure all Sheffield pupils, including those eligible for Pupil Premium funding, areimproving outcomes and achieving success.
Sheila Haigh – Headteacher at Ballifield Primary School
Lorna Culloden – Headteacher at Carfield Primary School
Anne Quaile – Headteacher at Handsworth Grange Community Sports College
Peter Hardwick – Executive Headteacher at Hucklow Primary School
Catherine Carr – Headteacher at Hunter’s Bar Infant School
Nicola Shipman – Executive Principal at Mansel Primary School
Steve Davies – Headteacher at Stocksbridge High School
Samantha Gaymond – Headteacher at Stocksbridge Junior School
Carolyn Sutcliffe – Headteacher at Talbot Specialist School
Becky Webb – Executive Headteacher at Tinsley Meadows Primary School
Pam Smith, Head of Primary and Targeted Intervention, Inclusion and Learning Services, Sheffield CityCouncil, May 2015

2
National Education TrustNET
Timing couldn’t be better for the publication of thisreport. Whilst a new government is taking shape, theissue of tackling educational disadvantage will remaina key priority of any government. This is correct. Alltoo often in the past the cold wind of disadvantagehas blown away the seeds of opportunity for somelearners. One of the great joys of working on thisproject has been learning about how schools havebeen using the Pupil Premium and the time devotedto this project to overcoming the many barriers tolearning that poverty brings.
At the same time, all indications are that budgets willbe tighter, therefore, understanding what works –what is high impact with best value for money – willbecome an even greater imperative!
This report tells the stories of the 10 schools – all verydifferent in terms of context, phase and ‘where theyare’ on their improvement journey.
Mind the Gap
The term ‘narrowing the gap’ can be unhelpful and setlimits on what individual children and young peoplecan achieve. The purpose of the Pupil Premium shouldbe to ensure educational excellence for all, regardlessof socio-economic background. Narrowing theattainment gap is a bi-product of that approach,rather than an aim in itself.
Action Research
Much has been said about the importance ofengagement in research to improve the achievementof disadvantaged learners.
Research can tell us a great deal, but there are somereally important things to consider about context andthe barriers to learning that individual pupils facebefore launching into an evidence-lite approach. Forexample, it is fruitless expending a great deal ofenergy on improving feedback if a school has poorattendance that is left untackled.
In all cases Interventions that are being researchedshould focus on the specific needs of individualpupils. From a research perspective, supplementingEEF toolkit information on the effectiveness ofdifferent interventions on average with case-by-caseunderstanding of individual pupils and theinterventions they will benefit most from.
Action Research Cannot Be an Island
Action research into effective approaches with thePupil Premium can only be beneficial alongsidegeneral good practice. In my work nationally there arefive active ingredients for effective use of the funding:
These are the active ingredients for success inachieving great outcomes for disadvantaged learners:
l Leadership of the Pupil Premium is strong.
l The barriers to learning in the school communityare carefully identified. It’s much more nuanced that‘you should see the estate many of these pupilscome from’.
l Pupil Premium funded activity is appropriate forovercoming these barriers. Activities are carefullyplanned, delivered with quality and informed byevidence. They are normally timelimited. Objectivesare clear, ambitious and tight.
l Activity is closely monitored at regular milestonesfor both quality and impact. Changes are made asnecessary.
l Leadership evaluates impact rigorously andunemotionally.
B The Project

3
National Education TrustNET
The Importance of Leadership
One of the benefits of the Action Research Project hasbeen to ensure that disadvantaged pupils have a highprofile across the participating school. A light is shoneon them and they are expected to attain well. In theseschools the Pupil Premium is an important element ofthe school development plan.
Where other professionals are involved in supportinglearners, leaders ensure decision making is joined upwith the needs of the pupil. Teachers, leaders andintervention leads agree appropriate action, focussedon gaps in learning and not national curriculum levels.Additional support is exactly that – additional andextra to the teaching in the classroom.
Funding is spent evenly throughout each year group.Schools which intervene and support early, as gapsbecome evident, are far less likely to be ‘cohortvulnerable’.
Focusing on the Barriers
One of the keys to success with the leadership of thePupil Premium is getting it out of Headteacher'soffices and into classrooms. Challenging educationaldisadvantage should be a key driver for MiddleLeaders. And teachers in the classroom should feelaccountable for the outcomes of their disadvantagedpupils. This project has shown that where a schoolgets it right for its disadvantaged pupils, it gets it rightfor all.
The purpose of the Pupil Premium is to improveattainment for disadvantaged learners. It follows thatthe funding should be used to ensure these pupilsreceive consistently excellent teaching. The ActionResearch case studies highlight how schools havetackled this issue.
In some cases, it should be used to maximise access toquality first teaching. This may be through evidencebased intervention programmes, challengingnegative attitudes to learning, curriculum enrichmentand in some cases, wellbeing.
Sometimes the barriers lie within schools. Do teachersand support staff understand children’s ‘back stories’?Does educational disadvantaged have a sufficientlyhigh profile across the school? In some cases it isabout ensuring that systems are strong, and thataccountability structures are appropriate:
In each case it should be with a very clear purpose –to get pupils learning in the classroom every daythrough quality first teaching.
Monitoring and Evaluation
Some of the powerful learning points for the grouphave come from this part of the project.
Evaluation should not be about proving thatsomething worked. It’s about finding out whethersomething has worked. This is about cultural changein schools. Finding out about activities that have notworked have been shared across the group, and thereare many stories about how schools have adjustedand changed their approach within the case studies.
We also learned:
l That those involved in Pupil Premium fundingactivity should be constantly evaluating theirimpact, and not waiting for milestones if they feelthe activity is not working for a particular individual.
l When evaluating, remember to evaluate theprocess as well as the outcome. Don’t just abandona breakfast club because it hasn’t improvedattendance. Check whether the breakfast club wasany good!
“One of the benefits of the ActionResearch Project has been to ensurethat disadvantaged pupils have ahigh profile across the participatingschools”

4
National Education TrustNET
l That the commissioning of additional and extra‘time limited’, with very specific success criteriaidentified? Do teachers input into thecommissioning of interventions so that ‘whatsuccess looks like’ is clear. Being specific about whatis trying to be achieved, by who and by when isfundamental to successful impact evaluation.
l Don’t let evaluation become your Sargasso Sea. Ifyou fund a breakfast club don’t try to show causalimpact on National Curriculum levels. Not ‘We needto improve attendance’ but ‘We need to improveattendance by x % by dd/mm by…’. ‘Improveattainment’ is too vague.
l Those leading initiatives and activities should beconfident in saying ‘this isn’t working’.
Leadership needs to instil a relentless sense of followup, whatever the activity being evaluated.
Wider Benefits
There are many powerful stories that have come outof this project. Activities that will improve outcomesfor the long term because they are aboutorganisational change and focus on educationaldisadvantages faced by the children and youngpeople in their classrooms. This is the consistentthreat – the golden ticket to success – in each of thecase studies. But there have been other key elementsof the project that have helped secure success. Theseare my reflections:
l The structure of the project – regular, half termlymeetings of all participating schools coupled bytwo in-school visits have been important forcontinuity, learning and success.
l It has been very helpful to get a deeper knowledgeof the schools. The one to one visits complimentedthe regular meetings. This has been a greatstrength.
l Consistency of personnel from individual schoolshas been important. This has been important forbuilding good relationships across the project.
l Getting under the skin of schools has helpedunderstand context and avoid the ‘one size fits all’approach.
l There has been strong progress on the leadership ofPupil Premium during the project.
l The structure has created a sense of ‘accountability’through the follow up / ongoing nature of theproject.
l There has been a lot of sharing good practice andlearning – between schools, learning from ‘outside’– through visits and discussion.
l The opportunities to ask difficult questions (in anice way!) have led to reflection and changes.
l Schools have become better at monitoring processas well as outcome – so there are no surprises at theend of initiatives.
l There is a much greater clarity over what schoolsare trying to achieve with their Pupil Premiumfunding, and why – both in respect of their ActionResearch but with the grant more generally.
l There has been good practice disseminationoutside of the project through events and schoolstelling their action research through their ownnetworks.
Marc Rowland, May 2015, National Education Trustand Pupil Premium Action Research Group Member.
*Footnote: I have deliberately not ‘over-edited’ theindividual school action research reports. They should –as much as possible – tell the story of the actionresearch from the school’s own perspective. MR

5
National Education TrustNET
Background
Individual level attainment data was collected fromautumn 2013 for all the schools that are part of theAction Research Group. The previous sectionhighlights the importance of understanding that it’snot all about the data. Attainment data gives a narrowview of pupil outcomes which may well be broaderthan achievement in a particular subject. However, asa key aim is to narrow the gap, it would be hoped thateven interventions that were not intended to have adirect impact on attainment should, in time, improveattainment outcomes for Pupil Premium children.
This section reports on the headline findings from thein-year data collection. Results from individual schoolsare not included as schools have provided their ownsupporting data within the case studies. Theinterpretation of the results comes with a few caveats:
l Although data was collected for a reasonably largenumber of children (nearly 1,200) in total, once thisis split by subject and year group some of theresults are based on small numbers of pupils.
l We only have one year of data to track pupilprogress. Arguably, this may not be long enough tosee an improvement in attainment outcomes. Wealso don’t have access to historic data so it hasn’tbeen possible to provide a ‘before’ and ‘after’ pictureof pupil progress.
Data Collection
Pupil level data was provided each term from autumn2013 for pupils from Reception to Year 9. Primaryschools provided data for reading, writing and mathsand secondary schools provided data for English andmaths. From autumn 2013 to summer 2014 data wascollected for 1171 pupils in ten schools.
Results
The data collected from schools confirms that theattainment of pupils eligible for the Pupil Premium is
f Figure 1: Progress in Reading, Autumn 2013 to Summer 2014
5.0
4.5
4.0
3.5
3.0
2.5
2.0
1.5
1.0
0.5
0.0Y1 Y2 Y3 Y4 Y5 Y6
Reading, Autumn2013 to Summer2014 PPAR
Reading, Autumn2013 to Summer2014 expected
Aver
age
poin
ts p
rogr
ess
C What the Data Tell Us?

6
typically below age-related expectations. This is nosurprise given that one aim of the Action Researchproject is to narrow the attainment gap. Rather thanfocusing on attainment this reports looks at theprogress made by pupils throughout the 2013/14school year. Whilst attainment may take a while to
reach age-related expectations, the hope is thatpupils are making accelerated progress and thereforegradually closing the gaps.
Progress data is presented in Figure 1 to Figure 4. Thecharts show how the progress made by PupilPremium Action Research Group (PPAR) pupilsbetween the autumn term in 2013 and the summerterm in 2014 compares to typically progress made bypupils who are at age-related expectations.1 Eachsubject and year group is presented separately. Forexample, Figure 1 shows that PPAR pupils made aboveexpected progress between the autumn term in 2013and the summer term in 2014 in every year groupfrom Y2 to Y6. The largest difference is in year 6 wherePPAR pupils made more than double typical progress
National Education TrustNET
f Figure 2: Progress in Writing, Autumn 2013 to Summer 2014
6.0
5.0
4.0
3.0
2.0
1.0
0.0
Y1 Y2 Y3 Y4 Y5 Y6
Writing, Autumn2013 to Summer2014 PPAR
Writing, Autumn2013 to Summer2014 expected
Aver
age
poin
ts p
rogr
ess
f Figure 3: Progress in Maths, Autumn 2013 to Summer 2014
6.0
5.0
4.0
3.0
2.0
1.0
0.0
Y1 Y2 Y3 Y4 Y5 Y6 Y7 Y8 Y9
Maths, Autumn2013 to Summer2014 PPAR
Maths, Autumn2013 to Summer2014 expected
Aver
age
poin
ts p
rogr
ess
“The data collected for the PPARschools do suggest that PupilPremium pupils are makingaccelerated progress across mostsubjects in most year groups ”

7
between the autumn and spring terms (this result isbased on data from only 2 schools and so should betreated with caution).
A similar trend is seen in writing (Figure 2) and maths(Figure 3). In both of these subjects the PPAR pupilsmade less progress than expected in Y1 and Y2 andaccelerated progress from Y3 onwards.
For pupils in the secondary phase pupils again makeabove expected progress and this seems moreevident in the latter part of Key Stage 3 (see Figure 3for maths and Figure 4 for English).
National Education TrustNET
2.5
2.0
1.5
1.0
0.5
0.0
Y7 Y8 Y9
English, Autumn2013 to Summer2014 PPAR
English, Autumn2013 to Summer2014 expected
Aver
age
poin
ts p
rogr
ess
f Figure 5: Average Attainment Gap Between PPAR Pupils and Age-relatedExpectations for Reading (Y1-Y6) and English (Y7-Y9) in 2013/14
-3.50
-3.00
-2.50
-2.00
-1.50
-1.00
-0.50
0.00Y1 Y2 Y3 Y4 Y5 Y6 Y7 Y8 Y9
Averageattainment gapfor reading/English
Att
ainm
ent g
ap (a
vera
ge p
oint
s)
f Figure 4: Progress in English, Autumn 2013 to Summer 2014

8
Interpretation
The data collected for the PPAR schools do suggestthat Pupil Premium pupils are making acceleratedprogress across most subjects in most year groups.However, the key question is to what extent thisaccelerated progress will narrow the attainment gapsand enable disadvantaged pupils to attain well. Is itdifficult to answer this question with only one year ofdata to analyse, especially when the full impact of theAction Research Project may not yet have beenrealised. A rough estimate can be made by comparingthe average attainment gaps with average progress.Figure 5 shows the average attainment gap betweenPPAR pupils and age-related expectations for readingand English.
The first point to note from Figure 5 is that theattainment gap becomes wider each year which maysuggest that closing gaps in the early years of primaryeducation may be beneficial for reducing theattainment gaps in later years.
Comparing the attainment gaps with the progress dataprovides an indication of how quickly the attainmentgaps might be expected to close. For example Figure 5shows that the average attainment gap for Y4 pupils inreading is about 1.25 points. Figure 1 shows that Y4pupils could make around 0.75 points progress in excessof expectations. Therefore if this accelerated progresscontinues then the attainment gaps may close within 2years for Y4 pupils. The picture is slightly different for theolder age groups. For example, the average gap for Y9 is3 points and Figure 4 shows that Pupil Premium pupils
are making gains of around 0.25 points per year in termsof accelerated progress. In this case it would takeconsiderably longer for the attainment gaps to close.
Therefore we could draw a very tentative conclusionthat it is possible that the project could have areasonable chance of closing attainment gaps withina couple of years and that this is likely to be easierwith young age groups where the attainment gapsare typically smaller.
Further Work
The data collected as part of the Action Researchproject has its limitations due to the size of thesample and the relatively short evaluation timescales.The data does suggest that Pupil Premium pupils aremaking accelerated progress and that this has thepotential to close attainment gaps if it were to besustained for further years.
The end of levels in September 2014 has provided afurther difficulty by making it impossible to trackpupil progress from the end of the summer term in2014 into the next academic year. The changes in thenational curriculum mean that assessments under theold and new curriculum are not comparable. Therehas been insufficient data collected under the newcurriculum at this point in time to track pupil progressthrough the 2014/15 school year which would help toprovide a longer term picture of the impact of theAction Research Project.
Kate Wilkinson, Sheffield City Council
1 Expected progress relates to the progress required for a pupil tomaintain attainment at age-related expectations. Age-relatedattainment is calculated based on national averages published inRAISEonline.
National Education TrustNET

9
National Education TrustNET
Stocksbridge Junior School
Number on roll: 331
Proportion of disadvantagedlearners: 23.1%
About: Outstanding outcomesfor all pupils through
excellence in the classroom every day
Stocksbridge Junior is a larger than average schoolwith 345 pupils currently on roll. The vast majority ofpupils are of white British heritage. Twenty-threepercent are eligible for Pupil Premium funding whichis used to support the outcomes for disadvantagedpupils. The percentage of disabled pupils and thosewith special educational needs is broadly in line withnational averages. The majority of our pupils are fromStocksbridge's three council estates although, a smallnumber of pupils join us from outside our catchmentarea. Increasingly, attainment on entry is judged to bearound national average at the end of KS1, for the vastmajority of our pupils.
Our pupils enjoy coming to school and displayrespectful behaviour towards their peers and others,along with positive attitudes to their learning.
In summary, we are a stable school with no significantkey contextual indicators and consistently maintaingood to outstanding achievement across the keystage.
Narrowing the Gap in School
Attainment across the school is very high comparedto national and LA average, and pupils fromdisadvantaged backgrounds do very well comparedwith their peers nationally and locally. Indeed,disadvantaged children at Stocksbridge Junior Schoolperform better than ‘all’ children within the LA andnationally however, the increasing challenge set outfor the school and its community, was to reduce thegap between our disadvantaged learners and theirpeers, especially when attaining higher levels acrossall subjects.
Analysis and Challenge
Before deciding upon our action plan, we consideredsome key questions:
l Is there clarity around the barriers to learning,desired outcomes and success criteria?
l Has there been an evaluation of current strategiesand could better strategies be used?
l Which strategies are already working well?
l Which strategies are not yet having the desiredimpact, but will deliver impact if things are donedifferently, or staff receive support to develop?
l Which strategies are unlikely to deliver impact andshould be withdrawn?
Several priorities were highlighted, as part of ouraction plan of which two main foci were identified:
l High expectations in the delivery of quality firstteaching and learning.
l All staff being accountable for the provision anddesired outcomes for all our Pupil Premiumchildren.
Aim: Ensure the quality of teaching and learning isconsistently good and outstanding across the school.
Ours was a relentless focus on improving of teachingand learning throughout the school. It was no surpriseto learn that highly effective teachingdisproportionately benefits disadvantaged children.So, if you teach well and they learn well, the gap
D Action Research Reports

10
National Education TrustNET
should narrow. Conversely, poor teaching alsodisproportionately affects the disadvantaged.
The Senior Leadership Team and governancerecognise the importance of quality CPD, but part ofthis challenge is knowing exactly what CPD is neededto enable the school and staff to make significantgains when investing in training.
The school had already completed a full training daylooking at cooperative learning structures and, as aresult, has experienced the positive impact this hashad on the quality of teaching from existing staff andchildren’s resulting achievement.
Action: The implementation and commitment tofurther train and embed ‘Kagan – cooperative learningstructures’ throughout school.
“Research on cooperative learning is overwhelminglypositive, and the cooperative approaches areappropriate for all curriculum areas. The more complexthe outcomes (higher-order processing of information,problem solving, social skills and attitudes), the greaterare the effects.” Bruce Joyce
Aim: Instil a culture where every member of staff has apart to play in the provision and desired outcomes fordisadvantaged children in our school.
Actions: Through a variety of activities such as: halftermly pupil progress meetings; robust and routinetracking; assessments focussed on disadvantagedchildren; reports and evidence trails carried out by allleaders in school; individual and personalised supportand interventions, implemented as a result ofdiscussions, these have led to a changed culture in
school where achievement is not left to chance. Theunquestionable expectation is that all of our PupilPremium children will be highly successful in schooland their achievements and academic success will beoutstanding.
Monitoring and Evaluation
When writing our action plan, we tried to ensure thatour considered milestones were measurable, in anattempt to be able to successfully monitor andevaluate our actions and intended positive impact.
Our systems, when monitoring, were robust andconsistent and this has been our approachthroughout the project. Our evaluations have beensupported by clearly identified success criteria andmeasurable outcomes.
A realisation was that evaluation is not about provingthat something works, it was about understandingthe impact or maybe in some cases, lack of it.
Outcomes and Impact
Developing and changing teaching practices, throughextensive professional development, has been themost powerful classroom strategy for closing ourgaps. In particular ‘cooperative learning’ hassignificantly raised outcomes.
Whole school strategy: Improving the quality andconsistency of teaching & learning, across the school,supported by a strong CPD culture. E.g. Kagan:
l It involves all the children actively in the learningprocess. As a result, children’s progress hasaccelerated and the gap in school between PupilPremium and non-Pupil Premium children isnarrowing.
l It models problem solving techniques and criticalthinking and, as a result, it has facilitated ‘deeplearning’ especially for more able PP children.
l It is especially helpful in motivating children inspecific curriculum areas and as a result this hasincreased children’s positive attitudes towards their learning and has noticeably helped build theself-esteem of some PP children.
Targeted strategies: Early and targeted learning andpastoral interventions which are rigorously monitoredand evaluated for all individual disadvantagedlearners:

11
National Education TrustNET
Stat
istic
al si
gnifi
canc
e te
sts h
ave
been
per
form
ed o
n th
e da
ta u
sing
a 9
5% c
onfid
ence
inte
rval
and
, whe
re th
e sc
hool
val
ue d
iffer
s sig
nific
antly
from
the
corr
espo
ndin
g na
tiona
l val
ues f
or th
is g
roup
, it i
shi
ghlig
hted
in g
reen
(sig
+) o
r red
(sig
-)
Valu
e A
dded
Valu
e A
dded
by
Subj
ect 2
014
2012
2013
2014
Mat
hem
atic
sRe
adin
gW
riti
ng (T
A)
No
of p
upils
Scho
olN
atio
nal
Scho
ol
Nat
iona
lSc
hool
Nat
iona
lSc
hool
Nat
iona
lSc
hool
Nat
iona
lSc
hool
Nat
iona
lin
late
st y
ear
All
pupi
ls85
100.
910
0.0
99.6
100.
010
0.3
100.
010
0.2
100.
010
0.2
100.
010
0.7
100.
0
Boys
3310
1.3
100.
099
.810
0.0
101.
110
0.1
101.
110
0.4
101.
299
.910
1.0
99.6
Girl
s52
100.
799
.999
.499
.899
.999
.899
.699
.699
.699
.910
0.7
100.
3
Free
sch
ool m
eals
2310
1.7
99.7
98.9
99.8
100.
699
.710
0.5
99.7
100.
899
.710
0.5
99.8
Non
free
sch
ool m
eals
6210
0.8
100.
099
.910
0.0
100.
310
0.1
100.
110
0.1
100.
010
0.0
100.
910
0.0
Child
ren
look
ed a
fter
-10
4.5
99.6
99.8
99.8
-99
.8-
99.7
-10
0.0
-99
.8N
on c
hild
ren
look
ed a
fter
8510
0.9
99.9
99.6
99.9
100.
310
0.0
100.
210
0.0
100.
299
.910
0.8
99.9
Dis
adva
ntag
ed p
upils
2310
1.7
99.7
98.9
99.8
100.
699
.710
0.5
99.7
100.
899
.710
0.5
99.8
Oth
er p
upils
6210
0.8
100.
099
.910
0.0
100.
310
0.1
100.
110
0.1
100.
010
0.0
100.
910
0.0
Prio
r att
ainm
ent –
low
1110
4.5
100.
110
0.4
100.
210
3.4
100.
210
3.4
100.
210
4.2
100.
110
2.7
100.
2Pr
ior a
ttai
nmen
t –m
iddl
e44
100.
899
.999
.410
0.0
100.
510
0.0
100.
610
0.0
100.
399
.910
0.7
99.9
Prio
r att
ainm
ent –
high
3099
.799
.799
.699
.898
.999
.898
.499
.898
.799
.810
0.2
99.8
Pupi
ls o
n ro
ll th
roug
h yr
s 5/
680
100.
810
0.0
99.6
100.
010
0.3
100.
010
0.1
100.
010
0.1
100.
010
0.8
100.
0
Firs
t lan
guag
e –
Engl
ish
8510
1.0
99.8
99.6
99.8
100.
399
.810
0.2
99.8
100.
299
.910
0.8
99.8
Firs
t lan
guag
e –
othe
r-
-10
0.8
-10
0.8
-10
0.8
-10
1.1
-10
0.2
-10
0.6
Unc
lass
ified
--
99.1
-99
.2-
99.1
-99
.0-
99.4
-98
.9
Non
SEN
6610
0.3
100.
199
.510
0.1
100.
010
0.1
99.7
100.
299
.710
0.1
100.
610
0.1
SEN
with
out a
sta
tem
ent
1910
3.0
99.3
100.
599
.410
1.7
99.4
101.
799
.410
1.8
99.4
101.
499
.3Sc
hool
Act
ion
810
3.1
99.6
101.
599
.610
0.0
99.6
100.
399
.699
.199
.610
0.5
99.6
Scho
ol A
ctio
n Pl
us11
103.
098
.999
.899
.110
2.9
99.1
102.
899
.210
3.8
99.0
102.
298
.9SE
N w
ith a
sta
tem
ent
--
97.6
94.3
97.9
-97
.9-
98.0
-97
.8-
97.6
fTa
ble
1: Ke
y St
age
1 to
Key
Stag
e 2
Valu
e A
dded
Sum
mar
y Re
port

12
l A very strong commitment, shared by staff andgovernors, to do everything possible to remove anybarriers that might hinder a pupil’s development.
l Effective leadership which makes informed choiceson a flexible basis that match the particular needsof our Pupil Premium children. As a result, wecontinue with interventions that are successful andamend our practice where it is less successful.
l As already stated, it is important that children haveaccess to outstanding teaching; a key part of this isthat they are supported by skilled and well trainedteaching assistants.
What Makes the Difference?
The overall package of support for our eligible pupilsis comprehensive, well integrated and responsive totheir changing needs. Our leadership teams put inplace a balanced programme of whole schooltargeted and specialist support that takes intoaccount the needs of all our pupils.
In 2014, greater value was added to disadvantagedpupils than to our other pupils, with ourdisadvantaged pupil value added figure being 0.9greater than National (see Table 1).
A higher percentage of disadvantaged pupils madeexpected and more than expected progress inreading than their counterparts within school andnationally. 100% of disadvantaged pupils madeexpected progress in reading (see Table 2).
100% of disadvantaged pupils made expectedprogress in writing compared to 97% of theircounterparts within school and 94% nationally (seeTable 3).
Sustaining and Building on Success
In the majority of areas, the school proportions showthat disadvantaged pupils have made in line with orgreater than the national figures for national non-disadvantaged pupils, thus being highlighted yellow.
In Reading, 12 children achieved Level 2 at KS1. Ofthese 4 children achieved 3 levels progress. 2 more ofthe 12 children achieving Level 2 at KS1 needed toachieve level 5 in order for the difference to be greaterthan the National percentage of other children.
In Writing, 14 children achieved Level 2 at KS1. Ofthese 2 children achieved 3 levels progress. 4 more ofthe 14 children achieving Level 2 at KS1 needed toachieve level 5 in order for the difference to be greaterthan the National percentage of other children (seeTable 4).
General Reflections
Taking an evidence-based approach at StocksbridgeJunior School has enabled us to realise that, whilst it istrue that each school is unique, it is equally true thatoutstanding teaching and leadership and a relentlessfocus on improvement, are what will make a realdifference whatever the context of, or degree ofchallenge within the school. We know this becausethere is compelling evidence which demonstratesthat high quality teaching and leadership are vital inraising attainment. We also know that schools that aremost effective in improving outcomes fordisadvantaged pupils always use evidence aboutwhat makes a real difference to prompt change intheir practice and therefore can do so withconfidence.
Sam Gaymond, Headteacher – Stocksbridge JuniorSchool
National Education TrustNET
“A higher percentage ofdisadvantaged pupils made expectedand more than expected progress inreading than their counterparts withinschool and nationally ”

13
National Education TrustNET
This
tabl
e sh
ows
the
num
ber o
f pup
ils a
ttai
ning
eac
h re
adin
g Ke
y St
age
2 at
tain
men
t lev
el a
nd th
eir c
orre
spon
ding
read
ing
Key
Stag
e 1
prio
r att
ainm
ent
Num
ber o
f pup
ilsKe
y St
age
2 re
adin
g le
vel
Expe
cted
pro
gres
sM
ore
than
exp
ecte
d pr
ogre
ss
W1
23
45
6
00
00
00
00
00
0%0%
2%-
--
-
W0
00
00
10
01
110
0%0%
61%
110
0%0%
31%
10
00
00
22
04
410
0%10
0%85
%4
100%
100%
64%
2C0
00
00
21
03
310
0%88
%85
%1
33%
0%21
%
22B
00
00
05
30
88
100%
100%
96%
338
%54
%39
%
2A0
00
00
10
01
110
0%10
0%99
%0
0%58
%66
%
30
00
00
06
06
610
0%74
%91
%0
0%0%
1%
40
00
00
00
00
00%
0%7%
--
--
Sum
mar
y23
2310
0%90
%92
%9
39%
34%
34%
Tota
l coh
ort o
f dis
adva
ntag
ed p
upils
23
fTa
ble
2: E
xpec
ted
Prog
ress
in R
eadi
ng K
ey S
tage
1 to
Key
Sta
ge 2
for D
isad
vant
aged
Pup
ils, S
ub-le
vel V
aria
tion
Other or no KS2 result
Total no ofdisadvantaged pupils
Disadvantaged pupilsachieving expected
progress
Disadvantaged pupils% achieving expected
progress
School (other pupils)% achieving expected
progress
National (other pupils)% achieving expected
progress
Disadvantaged pupilsachieving more than
expected progress
Disadvantaged pupils% achieving more
than expected progress
School (other pupils) % achieving more
than expected progress
National (other pupils)% achieving more
than expected progress
KS1
read
ing
leve
l
Oth
er o
r no
prio
r ava
ilabl
e
Sub level
Pupi
ls m
akin
g m
ore
than
exp
ecte
d pr
ogre
ssPu
pils
mak
ing
expe
cted
pro
gres
sPu
pils
mak
ing
less
th
an e
xpec
ted
prog
ress
Pupi
ls w
hose
pro
gres
s co
uld
not b
e de
term
ined
and
hav
e th
eref
ore
been
exc
lude
d fr
om th
e sc
hool
cal
cula
tion.
The
se p
upils
are
incl
uded
in th
e fig
ure
for t
he to
tal c
ohor
t

14
National Education TrustNET
This
tabl
e sh
ows
the
num
ber o
f pup
ils a
ttai
ning
eac
h w
ritin
g Ke
y St
age
2 at
tain
men
t lev
el a
nd th
eir c
orre
spon
ding
writ
ing
Key
Stag
e 1
prio
r att
ainm
ent
Num
ber o
f pup
ilsKe
y St
age
2 w
riti
ng le
vel
Expe
cted
pro
gres
sM
ore
than
exp
ecte
d pr
ogre
ss
W1
23
45
6
00
00
00
00
00
0%10
0%15
%-
--
-
W0
00
01
00
01
110
0%0%
67%
110
0%0%
42%
10
00
00
30
03
310
0%10
0%94
%3
100%
100%
56%
2C0
00
00
50
05
510
0%83
%88
%0
0%0%
9%
22B
00
00
06
00
66
100%
100%
98%
00%
42%
30%
2A0
00
00
12
03
310
0%10
0%10
0%2
67%
67%
65%
30
00
00
05
05
510
0%94
%92
%0
0%19
%12
%
40
00
00
00
00
00%
0%55
%-
--
-
Sum
mar
y23
2310
0%97
%94
%6
26%
44%
34%
Tota
l coh
ort o
f dis
adva
ntag
ed p
upils
23
fTa
ble
3: E
xpec
ted
Prog
ress
in W
ritin
g Ke
y St
age
1 to
Key
Stag
e 2
for D
isad
vant
aged
Pup
ils, S
ub-le
vel V
aria
tion
Other or no KS2 result
Total no ofdisadvantaged pupils
Disadvantaged pupilsachieving expected
progress
Disadvantaged pupils% achieving expected
progress
School (other pupils)% achieving expected
progress
National (other pupils)% achieving expected
progress
Disadvantaged pupilsachieving more than
expected progress
Disadvantaged pupils% achieving more
than expected progress
School (other pupils) % achieving more
than expected progress
National (other pupils)% achieving more
than expected progress
KS1
writ
ing
leve
l
Oth
er o
r no
prio
r ava
ilabl
e
Sub level
Pupi
ls m
akin
g m
ore
than
exp
ecte
d pr
ogre
ssPu
pils
mak
ing
expe
cted
pro
gres
sPu
pils
mak
ing
less
th
an e
xpec
ted
prog
ress
Pupi
ls w
hose
pro
gres
s co
uld
not b
e de
term
ined
and
hav
e th
eref
ore
been
exc
lude
d fr
om th
e sc
hool
cal
cula
tion.
The
se p
upils
are
incl
uded
in th
e fig
ure
for t
he to
tal c
ohor
t

15
National Education TrustNET
2012
2013
2014
Expe
cted
pro
gres
sM
ore
than
Expe
cted
pro
gres
s M
ore
than
Expe
cted
pro
gres
s M
ore
than
expe
cted
pro
gres
sex
pect
ed p
rogr
ess
expe
cted
pro
gres
s
Dis
adva
ntag
ed p
upils
W-
-59
--
27-
--
53-
-23
--
-51
--
22-
Oth
er p
upils
--
--
--
--
--
--
--
-
Dis
adva
ntag
ed p
upils
12
100
8119
100
3763
--
82-
-39
-4
100
8416
5043
7O
ther
pup
ils2
100
1910
063
367
-15
0-3
94
100
1675
32
Dis
adva
ntag
ed p
upils
211
9191
073
3439
1788
91-3
036
-36
1410
093
743
385
Oth
er p
upils
4898
756
2228
100
943
737
100
735
-3
Dis
adva
ntag
ed p
upils
32
100
9010
015
-15
250
91-4
10
27-2
75
8092
-12
2037
-17
Oth
er p
upils
1794
412
-317
100
918
-921
81-1
124
-13
Dis
adva
ntag
ed p
upils
W-
--
--
--
--
63-
-31
-1
100
6139
100
3169
Oth
er p
upils
--
--
--
--
--
--
-61
--
Dis
adva
ntag
ed p
upils
1-
--
--
--
210
083
1710
056
444
100
8515
100
6436
Oth
er p
upils
--
--
-6
830
6711
310
015
100
36
Dis
adva
ntag
ed p
upils
2-
--
--
--
1493
930
740
-33
1210
095
533
47-1
4O
ther
pup
ils-
--
--
2396
335
-540
983
45-2
Dis
adva
ntag
ed p
upils
3-
--
--
--
367
88-2
10
2-2
610
091
90
1-1
Oth
er p
upils
--
--
-19
84-4
53
1974
-17
0-1
Dis
adva
ntag
ed p
upils
W-
--
--
--
--
70-
-43
-1
100
6733
100
4258
Oth
er p
upils
--
--
-1
100
300
-43
--
--
-
Dis
adva
ntag
ed p
upils
1-
--
--
--
410
093
710
051
493
100
946
100
5644
Oth
er p
upils
--
--
-4
100
710
049
410
06
100
44
Dis
adva
ntag
ed p
upils
2-
--
--
--
1385
95-1
031
32-1
1410
096
414
36-2
2O
ther
pup
ils-
--
--
3210
05
386
4298
250
14
Dis
adva
ntag
ed p
upils
3-
--
--
--
210
090
1050
1040
510
092
80
12-1
2O
ther
pup
ils-
--
--
1110
010
188
1694
219
7
fTa
ble
4: C
losi
ng th
e G
ap T
rend
–D
isad
vant
aged
Pup
ils. P
erce
ntag
e A
chie
ving
Exp
ecte
d Pr
ogre
ss a
nd M
ore
Than
Exp
ecte
dPr
ogre
ss fr
om D
iffer
ent S
tart
ing
Poin
ts
KS1 level
Mathematics Reading Writing (TA)
Cohort
School %
Nationalother %
Diff %
School %
Nationalother %
Diff %
Cohort
School %
Nationalother %
Diff %
School %
Nationalother %
Diff %
Cohort
School %
Nationalother %
Diff %
School %
Nationalother %
Diff %

16
National Education TrustNET
Ballifield Primary School
Number on roll: 497
Proportion of disadvantagedlearners: 14.7%
About: Focusing onindividual learners to
improve outcomes
Context
Ballifield is a large primary school in the South East ofSheffield, educating children from three to 11. Thevast majority of pupils are from a white Britishbackground. A small number speak English as anadditional language, though this number isincreasing. The percentage of children eligible for thePupil Premium is low, as is the number of childrenwith special educational needs. The latest RAISEonlinedata shows that in KS1 disadvantaged pupils didbetter than the national average in reading and mathsand the gap has closed between these pupils andothers. In KS2 disadvantaged pupils’ attainment islower than the national average but progress is betterin reading and maths, particularly for those childrenattaining level 2 in KS1 assessments. (See Table 1)
Barriers
From the outset of the project it became clear that themain barrier to achievement for disadvantaged pupilswas the level of accountability for this group of pupilsby the teaching staff.
We first highlighted the inconsistencies in this whenwe undertook a Triad project with two other localprimary schools. This was based around the provisionwe had in place for disadvantaged pupils. The head
teachers of the other schools visited Ballifield andcarried out a learning walk around school and hadconversations with all staff about the number of PupilPremium children they had in their class and how wellthose children were doing in comparison to theirpeers. From this it became clear that a small numberof staff were able to identify all the disadvantagedpupils in their class and could state exactly where theywere in comparison to their peers; however other staffwere unable to do this. If this was the case, it becamevery clear that the progress and attainment of thesepupils was at risk. Our action plan focused on thispoint and this became the area of development wefocused on initially.
Actions
From the work done on the Triad project it was clearthat we needed to look at improving theaccountability of the teaching staff for disadvantagedpupils, in order to improve the consistency ofapproach throughout the school. We started this byincluding disadvantaged children on the pupilprogress proforma so that staff had to analyse theprogress made by these children compared to theirpeers and what they were going to do about any gapsthat were apparent. This was a start but did not go farenough in raising the profile of disadvantaged pupilsin school which is what we really wanted to achieve.
Therefore we decided to hold a ProfessionalDevelopment Meeting (PDM) at the beginning of the
Year Group No of PP children
F2 6
Year 1 8
Year 2 6
Year 3 5
Year 4 6
Year 5 15
Year 6 10
f Table 1: Percentage of PupilPremium Children

17
school year to raise staff awareness and introducepupil passports (see Appendix 1) and increased pupilprogress meetings for disadvantaged pupils. Westarted the PDM by asking staff which children wereeligible for Pupil Premium, what the money could bespent on, what proportion of children in school wereeligible and how many children were in their class.This was a very useful exercise as it highlighted somemisconceptions about how money could be spentand who was eligible, which we were able to clear upduring the course of the meeting. It also highlightedthat TAs were unfamiliar with the terminology andwere not aware of the disadvantaged pupils that theywere working with, which again we were able to sortduring the meeting.
During the PDM we also introduced the policy thatthe reasoning behind this was to raise the profile ofthe children in school but also to ensure that allchildren were receiving some additionality as thisneeded to be evidenced on the passport, as well asthree achievable targets that the children would workon through the additionality. These passports wouldalso be shared with parents during parents’ eveningsso that they were clear about what their children weregetting and the impact it was having.
Alongside this we introduced the policy that wewould hold half-termly pupil progress meetings thatwould focus solely on the achievement and progressof our disadvantaged pupils. In general, staff wereopen to these changes because we presented them asa way of improving the provision for these childrenand stated that they would enable teachers toevidence more clearly what they were putting in placefor their disadvantaged pupils, which had become aperformance management target for all staff.
Impact
The pupil passports and pupil progress meetings haveundoubtedly raised the profile of disadvantagedpupils in school. During the first half-termly progressmeeting all teaching staff were able to confidentlystate who their disadvantaged pupils were and what
additionality they were receiving. They also all hadpupil passports set up with clear targets for thechildren and what they wanted them to achieve. Thiswas a huge improvement on previous meetings wherestaff were unclear about all their disadvantagedchildren and could not always state what was beingprovided for them. However the staff were still unsureabout the progress and achievement of these childrenand the conversations we had were more anecdotalthan a demonstration of hard evidence of what theadditionality was doing for the children.
One member of staff had provided information aboutwhere the children were when they joined her class,where they were at the time of the meeting andwhether or not they were on track to reach their endof year target. We decided that this was the sort ofinformation that we required from all staff in order tomake the meetings meaningful and purposeful (seeAppendix 2). We introduced the proforma to all staffduring a subsequent PDM. This proved to be moreuseful at the subsequent pupil progress meeting aswe were able to clearly see which pupils were makingprogress and who needed some additional support,which we could identify through the provision mapprocess. The meetings showed that the children wereall making progress; in some cases acceleratedprogress, although their attainment was lower thantheir peers, with very few working at ARE. Thisinformation is skewed a little due to the newassessment procedures in place, that have meant thelarge majority of pupils in school are currentlyworking below ARE, due to the ramping up ofexpectations with the new curriculum.
National Education TrustNET
“we introduced the policy that wewould hold half-termly pupil progressmeetings that would focus solely onthe achievement and progress of ourdisadvantaged pupils ”

18
National Education TrustNET
Name:
Class:
Class Teacher:
f Appendix 1: Pupil Premium Passport to Success
Photo
Strengths:
Difficulties:
Additional Support Given:
Target Date Set How will we know the target Date Achievedhas been achieved?
My role as parent/carer will be to My role as class teacher will be to My role as SENCO will be to

19
National Education TrustNET
Analysis of data from the previous year’s results showsthat in all year groups except year two, thatdisadvantaged children are behind their peers in
terms of attainment, but that the gap between thetwo is closing, with the difference between thedisadvantaged and non-disadvantaged groupsdecreasing (except in reading in year 6). In terms ofprogress the picture is less consistent- apart from year6 all year groups are in line with or ahead of theirpeers in terms of the progress they have made.However, in some groups the amount the children areahead is decreasing – e.g. in year 3 writing and maths,and in year 4 reading (see Appendix 3 and 4).Comparison between this year’s progress andattainment has been made more difficult with thechanges in assessments, but we expect to see animproving picture due to the raised profile of thesechildren in school. As well as the obvious benefits tothe children’s progress and attainment, the staff havealso benefited from the process, as they feel moreconfident when discussing their disadvantagedchildren and are able to see the benefits for thechildren involved. (See Appendix 5 for quotes fromstaff).
Clare Roddis – Assistant Head Ballifield PrimarySchool
Name:
f Appendix 2: Pupil Premium Children
Reading Writing SPAG Maths
On entry Step Step Step Step
Autumn 1
On target (Step: Autumn 1)
Spring
On target (Step: Spring)
Summer
On target (Step: Summer)
Analysis:
Area of need:
Support:

20
National Education TrustNET
Year
Gro
up
Aut
umn
2013
Sp
ring
201
4 Su
mm
er 2
014
APS
poi
nts
Com
pari
son
toA
PS p
oint
sCo
mpa
riso
n to
Com
pari
son
toA
PS p
oint
s Co
mpa
riso
n to
Com
pari
son
to
aver
age
aver
age
prev
ious
term
aver
age
prev
ious
term
TWO
(5)
Read
ing
12
.2
0.2
ahea
d14
.2
0.3
behi
nd
Diff
0.5
- 17
.8
1.8
ahea
d D
iff 2
.1+
Writ
ing
10.6
0.
4 be
hind
13.0
0.
3 be
hind
D
iff 0
.1-
14.6
0.
6 ah
ead
Diff
0.9
+
Engl
ish
11.4
0.
1 be
hind
13.6
0.
3 be
hind
D
iff 0
.2-
16.2
1.
2 ah
ead
Diff
1.5
+
Mat
hs
12.2
0.
2 ah
ead
14.6
0.
2 ah
ead
Sam
e 17
.0
1.0
ahea
d D
iff 0
.8+
THRE
E (7
)
Read
ing
12
.0
5.0
behi
nd14
.0
3.7
behi
ndD
iff 1
.3+
15.7
3.
3 be
hind
D
iff 0
.4+
Writ
ing
11.3
3.
7 be
hind
13.0
3.
7 be
hind
Sa
me
13.7
3.
3 be
hind
D
iff 0
.4+
Engl
ish
11.6
4.
4 be
hind
13
.5
3.7
behi
nd
Diff
0.7
+14
.7
3.3
behi
nd
Diff
0.4
+
Mat
hs
14.3
1.
7 be
hind
16.0
1.
9 be
hind
D
iff 0
.2-
16.4
1.
6 be
hind
D
iff 0
.3+
FOU
R (1
6)
Read
ing
18
.2
1.8
behi
nd
19.4
1.
5 be
hind
D
iff 0
.3+
20.6
1.
5 be
hind
Sa
me
Writ
ing
17.0
1.
0 be
hind
17
.8
2.1
behi
nd
Diff
1.1
- 18
.9
1.2
behi
nd
Diff
0.9
+
Engl
ish
17.6
1.
4 be
hind
18.6
1.
8 be
hind
D
iff 0
.4-
19.8
1.
3 be
hind
D
iff 0
.5+
Mat
hs
19.0
In
line
19
.3
1.8
behi
nd
Diff
1.8
- 20
.3
0.6
behi
nd
Diff
1.2
+
FIVE
(9)
Read
ing
20
.1
2.9
behi
nd
21.0
3.
2 be
hind
D
iff 0
.3-
22.6
2.
4 be
hind
D
iff 0
.8+
Writ
ing
19.0
2.
0 be
hind
20.1
3.
1 be
hind
D
iff 1
.1-
21.7
1.
3 be
hind
D
iff 1
.8+
Engl
ish
19.5
2.
5 be
hind
20.5
3.
2 be
hind
D
iff 0
.7-
22.2
1.
8 be
hind
D
iff 1
.4+
Mat
hs
20.1
1.
9 be
hind
21.4
3.
0 be
hind
D
iff 1
.1-
23.2
0.
8 be
hind
D
iff 2
.2+
SIX
(11)
Read
ing
23
.7
2.3
behi
nd24
.1
3.3
behi
nd
Diff
1.0
- 25
.4
3.6
behi
nd
Diff
0.3
-
Writ
ing
21.9
2.
1 be
hind
22
.8
3.6
behi
nd
Diff
1.5
- 24
.5
1.5
behi
nd
Diff
2.1
+
Engl
ish
22.8
2.
2 be
hind
23.5
3.
4 be
hind
D
iff 1
.2
25.0
2.
0 be
hind
D
iff 1
.4+
Mat
hs
23.7
1.
3 be
hind
24.8
2.
8 be
hind
Diff
1.5
- 27
.0
1.0
behi
nd
Diff
1.8
+
fA
ppen
dix
3: P
upil
Prem
ium
Chi
ldre
n A
ttai
nmen
t fro
m A
utum
n 20
13 –
Sum
mer
201
24

21
National Education TrustNET
Year
Gro
up
Aut
umn
2013
Sp
ring
201
4 Su
mm
er 2
014
APS
poi
nts
Com
pari
son
toA
PS p
oint
sCo
mpa
riso
n to
Com
pari
son
toA
PS p
oint
s Co
mpa
riso
n to
Com
pari
son
to
aver
age
aver
age
prev
ious
term
aver
age
prev
ious
term
TWO
(5)
Read
ing
0.
4 1.
4 be
hind
4.
2 1.
1 be
hind
D
iff 0
.3+
6.0
0.5
ahea
d D
iff 1
.6+
Writ
ing
1.2
0.5
behi
nd
4.8
0.1
behi
nd
Diff
0.4
+ 5.
0 0.
1 be
hind
Sa
me
Engl
ish
0.8
0.9
behi
nd
4.5
0.6
behi
nd
Diff
0.3
+ 5.
5 0.
2 ah
ead
Diff
0.8
+
Mat
hs
1.2
0.7
behi
nd
5.6
0.4
ahea
d D
iff 0
.3+
6.
0 0.
5 ah
ead
Diff
0.1
+
THRE
E (7
)
Read
ing
1.
0 In
line
2.
5 1.
1 ah
ead
Diff
1.1
+ 4.
7 1.
8 ah
ead
Diff
0.7
+
Writ
ing
0.6
0.3
behi
nd
2.3
0.5
ahea
d D
iff 0
.8+
3.0
0.4
ahea
d D
iff 0
.1-
Engl
ish
0.1
0.1
behi
nd
2.4
0.8
ahea
d D
iff 0
.9+
3.9
1.2
ahea
d D
iff 0
.4+
Mat
hs
0.3
0.3
behi
nd
2.3
0.5
ahea
d D
iff 0
.8+
2.6
In li
ne
Diff
0.5
-
FOU
R (1
6)
Read
ing
4.
7 0.
7 ah
ead
6.1
1.5
ahea
d D
iff 0
.8 +
7.
4 1.
0 ah
ead
Diff
0.5
-
Writ
ing
4.9
1.4
ahea
d 5.
8 0.
8 ah
ead
Diff
0.6
- 7.
0 1.
4 ah
ead
Diff
0.6
+
Engl
ish
4.0
0.3
ahea
d 6.
0 1.
2 ah
ead
Diff
0.9
+ 7.
2 1.
2 ah
ead
Sam
e
Mat
hs
4.6
1.0
ahea
d 4.
4 0.
6 ah
ead
Diff
1.6
- 5.
4 0.
4 ah
ead
Diff
1.0
+
FIVE
(9)
Read
ing
9.
1 1.
9 ah
ead
9.7
1.8
ahea
d D
iff 0
.1-
11.6
2.
1 ah
ead
Diff
0.3
+
Writ
ing
7.8
1.4
ahea
d 8.
9 0.
6 ah
ead
Diff
0.8
- 10
.4
1.9
ahea
d D
iff 1
.3+
Engl
ish
8.4
1.6
ahea
d 9.
3 1.
2 ah
ead
Diff
0.4
- 11
.0
2.0
ahea
d D
iff 0
.8+
Mat
hs
7.5
0.9
ahea
d 8.
9 0.
6 ah
ead
Diff
0.3
- 10
.7
2.1
ahea
d D
iff 1
.5+
SIX
(11)
Read
ing
10
.0
0.8
behi
nd10
.4
0.7
behi
nd
Diff
0.1
- 11
.6
1.7
behi
nd
Diff
1.0
-
Writ
ing
8.9
0.7
behi
nd
9.8
1.7
behi
nd
Diff
1.0
- 11
.5
0.2
behi
nd
Diff
1.5
+
Engl
ish
9.4
0.8
behi
nd
9.3
1.1
behi
nd
Diff
0.3
- 11
.6
0.6
behi
nd
Diff
0.5
+
Mat
hs
9.6
0.2
behi
nd
8.9
1.0
behi
nd
Diff
0.8
- 12
.7
0.8
ahea
d D
iff 1
.8+
fA
ppen
dix
4: P
upil
Prem
ium
Chi
ldre
n Pr
ogre
ss fr
om A
utum
n 20
13 –
Sum
mer
201
4

22
National Education TrustNET
F2 teacher
“Knowing that it is closely monitored/ managed by SLT raises its importance in the classroom.”
Year 5 teacher
“I think that the extra pupil progress meetings and passports have been useful because they have kept the Pupil Premiumchildren at the forefront of our minds. On the downside I have found that the targets I have written have not been specificenough and so haven’t had the effect I wanted. This is something I need to work on.”
F2 teacher
“We have to show what extra support we are providing and the meetings promote this. It should all be in place anyway as it’spart of our job but it helps to ensure that things are in place in the classroom. It also gives SLT and teachers dedicated time todiscuss the needs of this group and to explore together what support options are available. The only issue we have found atour end is the introduction of universal free school meals, so as there are some children who are eligible but not currentlygetting the funding.”
Year 2 teacher
“It has made a difference as it has made me more aware of my Pupil Premium children and helped me keep on top of whatthey are doing. Including the TAs in the process has been good as they are more aware of the children and are able to targetspecific children. The passports are useful, especially as we have been annotating them all the time with any progress made.They are also easy to fill in and not too time consuming. The pupil progress meetings have meant that the children are notdropping off the radar, and keep staff on their toes regarding what to do next for them.”
Year 1 teacher/phase leader
“It has made everyone aware of the children’s needs and that the support for them needs to be something additional. It alsomakes you think more creatively about how to use your time in class and your TA support. I also like that we look at thechildren’s strengths as it’s nice to be positive.”
Nurture leader (TA level 3)
“The feedback from the meetings and passports has helped us a lot in what we plan for the children and extra things that wecan include for them e.g. word zappers and everyday writing books. I can also keep up-to-date profiles on the children andlook at what I can do to help them achieve their targets on their passport.”
f Appendix 5: Quotes From Staff re Pupil Premium Action Research Project

23
National Education TrustNET
Stocksbridge High School
Number on roll: 857
Proportion of disadvantagedlearners: 22%
About: Focusing Pupil Premiumon the classroom and adopting
model practice in process improvement
Context
Prior to embarking on this project, Pupil Premiumfunding was allocated to a range of additionalprovisions such as breakfast clubs, catch upintervention and incentives round attendance andpunctuality.
While there was some evidence of impact around theparticular focus of each intervention, improvedprogress overall had not been embedded and ourgaps in attendance, behaviour and therefore pupilprogress, had not narrowed.
In looking at our data and taking lessons fromresearch, we concluded that an ‘intervention culture’had grown up which was having the unintendedconsequence of reducing the sense of accountabilitythat each teacher feels for the progress of studentswith the most significant barriers to learning.
In response to this, we redirected time and moneyaway from additional intervention and towardimproving training and systems which support highquality teaching every lesson. We did this through:
Investment in improved data tracking systems toinform quality assurance and improvement planning:
l Investment in training and support for our middleleaders in quality improvement strategies, actionplanning and impact evaluation
l Increased investment in professional developmentfor teachers, through:– Use of the Outstanding Teacher Programme
and Improving Teacher Programme – Creation of a team of ‘lead learners’– Institution of the ‘lesson study’ approach to self
improvement
We applied to take part in the Action Research Projectas we hoped to learn from others, locally andnationally. We hoped, specifically, that the actionresearch approach would help us to be much moreeffective in evaluating the impact of our work. We
recognised that we had been doing lots of goodthings with the best of intentions, but in the end wedidn’t have a clear picture of what had or hadn’tworked or why this was the case.
I had been fortunate to be part of some NHS trainingon the science of ‘Quality Improvement’ and I hadbeen personally inspired by the evidence oftransformational work in many different fields. Thisproject excited me as it was a chance to learn moreabout how to apply this approach in school.
We began with a ‘global aim’ for the project. The keyhere was not to aim at something we were certain wewould achieve. Instead we were bold enough to namewhat we really wanted to achieve, safe in theknowledge that we almost certainly wouldn’t! Thisprovided a clear framework within which we couldevaluate our success (& failure) and also ensured thatwe didn’t set out simply to find a quick fix for asymptom instead of tackling the underlying causes ofthe problem.
Global Aim
We believe that a measure of quality in education isthe extent to which excellence is achieved by allstudents, irrespective of disadvantage or barrier toachievement.
Our aim in this project is to eliminate variation inachievement between Pupil Premium students andnon-Pupil Premium students through a focus onquality provision, informed by a rigorous cycle ofreview and planning.
Project Actions
Through the project, we chose to track the impact ofsome of our improvement strategies on our mostdisadvantaged students:

24
National Education TrustNET
l Partnership working with Stocksbridge JuniorSchool to implement the use of Kagan structuresin order to improve cooperative learning at theHigh School: By adopting classroom approachesrecognised from primary school, we hoped tosmooth transition. We also wanted to test the ideathat supporting children to be effective cooperativelearners would have the most significant impact onthe most disadvantaged students.
l Use of attendance panels: As well as a gap inachievement, there was a clear gap in typical levelsof attendance between our Pupil Premium andnon-Pupil Premium students. Through the projectwe wanted to evaluate the specific impact of thisstrategy on our Pupil Premium children.
l Academic mentoring: We introduced a moresystematic programme of academic mentoringinvolving subject teachers and form tutors workingwith students to develop targets round datacollection and reports. Through the Action ResearchProject we sought to assess the impact of the systemon the progress of our Pupil Premium students.
Impact of the Project Actions and OtherLearning
We do have a pattern of narrowing gaps between theprogress made by Pupil Premium children and others,evident in GCSE outcomes and in the progress trackingdata for students in lower years (please see Table 1).
Our overall attendance figures improved from 2013 to2014, though the level of persistent absence amongstPupil Premium children actually increased as did thegap between this figure and that for other children inthe school.
It is still too early to reflect on the specific impact ofKagan and indeed on our academic mentoring work.
The most significant impact of the project to date hasbeen the way we now think differently aboutimprovement planning. The action researchmethodology has found its way into every aspect ofour appraisal, quality assurance, planning and reviewprocesses.
We have carried out training for senior and middleleaders on the quality improvement approach. I amconfident that this change in focus and approach hasled to genuine improvement in the quality of teachingwhich in turn has resulted in the narrowing of gaps inprogress that we are now seeing.
While we have not yet seen an impact of ourstrategies on the complex issue of persistent absence,I am confident that we now at least have a means toanalyse what has worked and what hasn’t. Thisimproves our chance of improving outcomes in thischallenging area.
Finally, we have been encouraged in our belief thatthere is no need to focus largely on additionalintervention which implies tacit acceptance that our‘standard’ provision cannot meet the needs ofdisadvantaged students. We have been givenconfidence to focus our resources on improving the‘day to day’ quality of practice as the best means toenable progress for all.
Steve Davies, Headteacher, Stocksbridge HighSchool
Nat 2013 Y11 2013 Y11 2014 Y10 2014 Y9 2014 Y8 2014 Y7 2014
3LP English -12 -23 -17 -16 -11 -26 9
4LP English -15 -12 -10 -8 -27 9
3LP Maths -16 -46 -17 -3 -20 -15 -4
4LP Maths -23 -17 -13 -29 -19 3
f Table 1: Gap Analysis – Difference in the Proportions Pupil Premium and Non Pupil Premium Students Making (or on Track to Make) 3 and 4 LevelsProgress from KS2 to KS4

25
National Education TrustNET
Talbot Specialist School
Number on roll: 164
Proportion of disadvantagedlearners: 38%
About: Research into howphysical exercise can support
students that have complex learning difficulties
Context
Talbot Specialist School provides education andlearning opportunities for students in years 7-14 whohave severe and complex learning difficulties. Manystudents have overlapping conditions includingsensory impairments and mental health difficulties.There are 164 students on roll. Due to the diversity ofneed and learning styles the curriculum is flexible andpersonalised in order to enable all students to havefull access and offer the greatest opportunities forsuccess.
The Action Research Project was carried out with agroup of six students who are in Years 9 and 10. All thestudents have multiple and complex learningdifficulties, including autism. The main aim of thisproject was to look at the effect of physical exerciseon engagement in learning and how this impacted onbehaviour in class throughout the day.
Barriers to Learning
The biggest barrier to learning for these students wasautism and the high levels of anxiety and stressassociated with this. The second major barrier was thestudents’ resistance to change in their daily routine,again due to their autism. A third barrier wasidentifying time within a highly structured timetablefor physical exercise, so time was prioritised at thestart of the day. Finally, students needed a positiveattitude towards the project and this was nurturedthrough trust and positive relationships with the staffinvolved in delivering the activities.
Actions
Structured exercise routines were developed inpartnership with the PE and school sport coordinatorand were carefully introduced from 9.00 – 9.30am. Byhaving the exercise routines at this time in themorning it was possible to see the effects it had onthe students’ behaviour throughout the day. Oneexercise routine was introduced per half term in order
to identify the effects it was having on that day and tocompare this to the rest of the week. The exerciseroutine started on Mondays because this was aparticularly difficult day for the students and they allregularly displayed negative behaviour on this day.
In trying to understand the barriers autism presentsfor the students, an exercise routine was designedwhich included activities that they all seemed toenjoy. It was important that the first exercise routinewas one that they would find fun and exciting. Theroutine is made up of a mini trampoline, step,skipping ropes and throwing beanbags into a target,and is set up as a circular activity so the studentsmoved from one activity to the next.
For the second half term (Autumn 2) the studentswere introduced to ‘idance’, which is a virtual dancesession using a website. The students followed theinstructions and actions given by a person on thescreen. This was done carefully as we were not surehow the students would react to either the music orthe dance routines. By staying in the classroom thefamiliarity of the room gave the students confidenceto try something new.
In the third half term (Spring 1) yoga was introducedon a Thursday morning as a different form of exercise and to see if a calmer and more relaxingexercise had the same positive effect on behaviour.(See Appendix 1)
Monitoring and Evaluation
In the first half term it took the students 3-4 weeks toget used to the new routine and there was initially

26
National Education TrustNET
little change in the students’/their behaviour. It thenbecame apparent that for the first time since the startof the school year, on Mondays none of the studentswere removing themselves from any lessons. At thebeginning of the second half term the students wereconfidently coming into class on Monday morningsand independently starting their exercise routineusing the equipment provided. They were beginningto indicate that they were enjoying themselvesthrough making positive noises, wanting to use theequipment for longer, and smiling and laughing.
By monitoring the students’ reactions to the ‘idance’ inthe second half term, it has been possible to transfer
the class to the sports hall to continue with thisactivity as part of their PE lessons. This is significantprogress as three of the students were previously veryreluctant to go to the hall. Another huge and positiveeffect is that all of the students are now able to remainin the hall and are calm for the entire PE lesson.
The students responded well to the yoga sessions andit only took two weeks for them to understand thechange in routine for their Thursday timetable. All ofthe students now come into the room, find a mat, taketheir shoes and socks off and follow the movementsdemonstrated by the yoga instructor.
Impact
The impact of introducing the exercise routines hasexceeded our expectations. The students are muchcalmer on the days that they do the routines and thenumber of behaviour incidents has decreasedsignificantly.
f Figure 1: The Decrease in Significant and Recorded Incidents of BehaviourFrom Summer Term 1 2014 to Spring Term 1 2015
45
40
35
30
25
20
15
10
5
0Summer halfterm 1 2014
Summer halfterm 2 2014
Autumn halfterm 1 2014
Autumn halfterm 2 2014
Spring half term1 2015
“The impact of introducing theexercise routines has exceeded ourexpectations. The students are muchcalmer on the days that they do theroutines and the number of behaviourincidents has decreasedsignificantly.”

27
National Education TrustNET
f Figure 2: Progress in Language and Literacy From Summer 2013 to Summer 2014
100
90
80
70
60
50
40
30
20
10
0Class equals CG
Perc
enta
ge o
f gro
up
4
1
5
Above expected progress
Expected progress
Below expected progress
Comparison of progress vs expectations, Summer 2013 (result) to Summer 2014 (result)Subject: Language and LiteracyBasis need for comparison against expectations: DefaultClass equals CG
Change in CASPA percentile ranking
f Figure 3: Progress in Language and Literacy From September 2014 to February 2015
100
90
80
70
60
50
40
30
20
10
0Class equals CG
Perc
enta
ge o
f gro
up
4
2
6
Above expected progress
Expected progress
Below expected progress
Comparison of progress vs expectations, Summer 2014 (result) to Current 2015 (result)Subject: Language and LiteracyBasis need for comparison against expectations: DefaultClass equals CG
Change in CASPA percentile ranking

28
National Education TrustNET
Figure 1 shows the decrease in significant andrecorded incidents of behaviour from Summer term 12014 to Spring term 1 2015.
The project started in Autumn 1 2014 and thereduction in behavioural incidents is convincing. InSpring 1 2015 there were only two incidentscompared to 39 in Summer 1 2014.
A further breakdown of the number of recordedbehaviour incidents for each individual student isgiven in Appendix 2.
The impact on engagement in learning and progresshas been equally significant.
Figure 2 and Figure 3 show the progress made bythese students in language and literacy. The studentswere all assessed using B squared and this data wasanalysed using CASPA (Comparison and Analysis ofSpecial Pupil Attainment).
The data shows that two pupils are now makingbetter than expected progress and all others aremaking expected progress. In addition, evidence fromobservations has shown that students are calmer,engaging for longer periods in learning activities,remaining in class throughout lessons and interactingmore with staff – and one student has beguncommunicating verbally, both in class and at home.
Other Learning
It has been incredible to see how the students haveprogressed so far this year and how they have reactedto the exercise routines. The students are sitting inlessons for longer and their ability to focus andsustain concentration has vastly improved. Their stressand anxiety levels have reduced and they are enjoyingtheir education more. The evidence for this is seen intheir reactions to activities by laughing, respondingmore, their eagerness to want to try and/or join in,positive noises/reactions and most importantly,positive behaviour.
Case study written by Carolyn Sutcliffe,Headteacher, Talbot Specialist School, and CherylGaughan, Phase Leader, Years 9/10
Acknowledgements and thanks to: Mark Dolan, PE and school sport coordinator Rowena Thorpe, HLTA Behaviour
Monday 9.00-9.30 Tuesday 9.00-9.30 Thursday 9.00-9.30
Autumn term 1 2014 Circuit of activities
Autumn term 2 2014 Circuit of activities idance
Spring term 1 2015 Circuit of activities idance Yoga
f Appendix 1: Programme of Activities
Student A Student B Student C Student D Student E Total
Summer half term 1 2014 4 6 11 8 10 39
Summer half term 2 2014 3 8 10 5 10 36
Autumn half term 1 2014 0 0 12 2 8 22
Autumn half term 2 2014 2 1 4 0 2 9
Spring half term 1 2015 1 0 1 0 0 2
f Appendix 2: Number of Behaviour Incidents

29
National Education TrustNET
Tinsley Meadows Primary School
Number on roll: 578
Proportion of disadvantagedlearners: 68.3%
About: A school where childrenovercome multiple barriers to
learning within a complex and deprived community.Pupil Premium award winners 2015
Context
The school is in an area of economic deprivationserving the community of Tinsley. Tinsley is an everchanging area. Once predominantly a Pakistanicommunity, Tinsley is now seeing a rise in the numberof Roma Slovak settlers. With the changingdemographic and historic persecution in their homecountries, some of our children experience culturalconflict resulting in low self-esteem and behaviouraldifficulties.
Despite the high level of deprivation we do not have ahigh number of children who are eligible for PupilPremium. This is currently 59%. Most of our familiesfall out of the categories needed to be eligible forbenefits. For some families this makes them evenmore vulnerable. We therefore treat every child as aPupil Premium child.
Almost all of our pupils speak English as an additionallanguage and a small percentage of children are newto English. The number of new arrivals in school ishigh (fluctuating between 25-30%). Our school hasthe highest mobility rate in Sheffield with the vastmajority of families arriving or leaving the country.Attendance is a particular challenge due to extendedleave to visit home countries or for religiousobservance. Many children leave the school part waythrough the key stage and return having missed asignificant amount of education.
Due to the levels of deprivation many of our childrenare very small in size and suffer from poor health dueto malnourishment. Also, many have seriousundiagnosed illnesses such as heart and lung defects.Hearing and vision is a particular concern.
Our children have a higher than average number ofchildren with Special Educational Needs and Disabilities.
An additional challenge is the number of pupils with a‘cause for concern’ or some form of involvement withsocial services is extremely high. Serious disclosures
are fairly common in our school and a large number ofchildren live with emotional trauma. Neglect isanother key area of cause for concern, as parentsstruggle to ensure that children’s needs are met onvery low incomes.
Most pupils’ attainment on entry is very low and thedevelopment of language and communication skills isa high priority.
Actions
The school bravely steered away from traditional in-class immersion for language development becausethe large numbers prevented the provision of qualitylanguage models from peers and more experiencedEnglish speakers of the same home language werereadily offering translation, preventing true immersion.To achieve effective immersion, dedicated classes havebeen established (2 in KS2 and 1 in KS1) wherebychildren with little or no English receive intensivelanguage provision in order to rapidly secure the skillswith which they can access the national curriculum.The school has invested in training for teachers thatpromote accelerated language development(Communicate in Print, Makaton and Stories forTalking) and this is proving to be particularly effective.We see every lesson as a language lesson and promotethe use of sentence openers to be used in every lessonand on display at all times.
The school has a robust programme in place for theimprovement of attendance which is fully embeddedinto school practice. Any absence is followed up by atelephone call or a home visit where appropriate.

30
National Education TrustNET
Extended leave is never authorised during term timeand attendance panels take place when a childreaches a trigger. Action plans are also put in place toensure attendance is improved. Incentives are used ona regular basis for children having 100% attendanceeach week, term and year. At the infants termly tripsfor children 100% were introduced as an additionalincentive for children to attend school. A whole schoolattendance board was established at the Infantswhere children are aiming to get the target in order toreceive additional prizes. This was also beingsupported by individual attendance passports.
Targeted support for all children is delivered based onthe findings of robust pupil progress meetings whichtake place throughout the year. Teachers provide‘additional and different’ support which takes placeoutside of classroom directed time to enable them toreach their targets. These are reviewed on a termlybasis to ensure maximum impact. In addition to this,the Y2 and Y6 timetable has been extended (8:10 – 4:30pm) to ensure every child has as muchsupport as necessary to maximise their achievement.
At the Infants the introduction of reciprocal reading inYear 1 and 2, Rainbow reading and talk for writing hasalso had a positive impact on narrowing gap. Theschool’s extra-curricular activities programme iscomprehensive and includes diverse and uniqueopportunities such as Judo, Latin, Cooking, Arabic andSamba.
The school provides a nutritious breakfast for everychild every day. Children are also provided with foodand clothing which is funded through donations andfundraising events. Questionnaires have beencompleted to ensure that parental and children’sviews influence what we provide.
Monitoring and Evaluation
The senior leadership team scrutinise and monitor allprovisions in school closely. This is through formalobservations, drop in’s, scrutinies of attendance atclubs, tracking, books and planning.
Robust pupil progress meetings and action plansallowing for regular scrutiny of interventions,additional and extra support that is being provided.This is then reviewed to ensure that what is beingprovided meets the needs of children.
All teachers are now confident to be able to reflect onthe ‘additional and extra’ being provided and alsointerventions and will come and discuss provision
2012/13 2013/14 Narrowing the Narrowing the(25 children (37 children gap (2012/13 gap (2013/14)
of which 7 were of which 14 were on the SEN register) on the SEN register
and 1 child had astatement for Special
Educational needs)
% of pupils achieving 29% 41% -12% -15.4%a good level of (non PP = 41%) (non PP = 56.4%)development
f Table 1: Previous Performance of Disadvantaged Pupils (pupils eligible for free school meals or in local authority care for at least six months)
“The school provides a nutritiousbreakfast for every child every day.Children are also provided with foodand clothing which is funded throughdonations and fundraising events.”

31
before pupil progress meetings, which enableschildren’s needs to be met at all times.
Impact
The school data shows significant improvements inattainment of disadvantaged pupils over the lastthree years (see Tables 1 and 2).
The strategies have also had a positive impact on thewider development of our disadvantaged pupils.Attendance across the whole school has improveddramatically since the introduction of the new policy.(2012/13: 93.2% compared to 2013/14: 94.85%)
Other Learning
Tinsley Meadows is a reflective school that is constantlyreviewing practise within school and researching newinitiatives to ensure that children can maximiseprogress. With this in mind, the school has engaged in‘Visible Learning ‘which focuses on John Hattie’sresearch and principles. The children at Tinsley are alsoengaged with the Education Endowment Foundationfunded Metacognition Project ‘ReflectEd’ withRosendale Primary School in Lambeth and workingwith Third Space Learning, maths tutors in India.
Helen Best, Head of Lower Meadows
National Education TrustNET
2012/13 2013/14 Narrowing the Narrowing the(22 children 1 LAC) (24 children 0 LAC) gap (2012/13) gap (2013/14)
% of pupils achieving Age related Expectations 55% (non PP = 78%) 79% (non PP = 84%) -23% -5%(Level2b+) in reading
% of pupils achieving Age related Expectations 41% (non PP = 72%) 71% (non PP = 84%) -31% -13%(Level2b+) in writing
% of pupils achieving Age related Expectations 55% (non PP = 83%) 75% (non PP = 84%) -28% -9%(Level2b+) in maths
f Table 2: KS1 Attainment
2012Narrowing
2013Narrowing
2014Narrowing
the gap % the gap % the gap %
PP Non PP PP Non PP PP Non PP
Level 4+ reading 84.2 95.2 -11% 89.5 96.9 -7.4% 87 92.9 -5.9%
Level 5+ reading 42.1 76.2 -34.1% 42.1 50 -7.9% 56.5 50 +6.5%
Level 4+ writing 47.4 95.2 -47.8 57.9 87.5 -29.6 73.9 82.1 -8.2
Level 5+ writing 26.3 26.6 -0.3 10.5 25.0 -10.5 47.8 32.1 +15.7
Level 4+ maths 68.4 95.2 -26.8 84.2 93.8 -9.6 82.6 85.7 -3.1
Level 5+ maths 15.8 52.4 -36.6 31.6 53.1 -21.5 43.5 42.9 +0.6
Level 4 R,W,M combined 47.4 95.2 -47.8 57.9 87.5 -29.6 73.9 78.6 -4.7
Reading 2+ (progress) 94.1 100 -5.9 88.2 100 -11.8 95 96 -1
Writing 2+ (progress) 94.1 100 -5.9 88.2 100 -11.8 95 96 -1
Maths 2+ (progress) 94.1 100 -5.9 88.2 100 -11.8 100 95.8 +4.2
f Table 2: KS2 Attainment
32
National Education TrustNET
Mansel Primary School
Number on roll: 407
Proportion of disadvantagedlearners: 69%
About: Challengingeducational disadvantage
through reflection and change
Context
Mansel Primary Academy is situated within ParsonCross in North Sheffield. We are a 60 IAN setting with a39 place nursery and currently have 407 pupils on roleyet have capacity in many of our year groups. WoolleyWood, a primary special school, was co-located on sitewith Mansel in April 2012. Mansel has approx 69% ofpupils that are Pupil Premium (FSM6)
Our pupils are increasingly coming from a diverserange of backgrounds and cultures with recentadmissions from Eastern European countries. We workas a community to provide a good start for ourchildren so that they can be confident learners for life.OfSTED Jan 15 stated that “Pupils are excited byopportunities to investigate and explore the worldaround them such as the natural world in theextensive grounds. Religious, personal and socialeducation, effective assemblies and the work of theschool council strongly develop pupils’ appreciationof different cultures awareness of democracy and thevalues of modern British society.
We have a highly-motivated and dedicated staff teamwho are committed to improving the achievementand well-being of our pupils, and as a result Manselrecorded results above KS2 floor standards for the firsttime in 5 years in 2014 and this will continue in 2015.Mansel has made accelerated progress sincebecoming an academy sponsored by Steel CitySchools Partnership, a Multi-Academy Trust, in April2013.
Following historical low attainment for a number ofyears of all pupils, but particularly disadvantagedpupils who make up 69% of the pupil population,Mansel applied to be part of the Sheffield PupilPremium research project with the National EducationTrust. The main focus for the Academy was to addressand close the gap not only at Mansel, but also acrossthe Trust by learning from excellent practice both
within Sheffield schools but also from thosenationally.
Nicola Shipman, Executive Principal became a PupilPremium reviewer during the project.
Barriers
Barriers faced at Mansel included a lack of awarenessof staff about the Pupil Premium pupils but alsoinitially the impact that the Pupil Premium fundingcould have on these pupils if co-ordinated in astrategic way. There was no strategic leadership ofPupil Premium / disadvantaged pupils when SCSPstarted working with Mansel and it was apparent thata lead member of staff but also a governor wasneeded to “champion” these children and expenditurefor them.
Low aspirations of the pupils by parents and thecommunity and by some staff was another challengefaced and as the school had been in and out of Ofstedcategories for a number of years and with KS2 resultsthe lowest in Sheffield in 2011, action was required tomake sure that the trend was reversed. Significantwork was undertaken to stabilise the school andstaffing in 2012 and 2013 but until the start of theresearch project there was limited impact with ourdisadvantaged pupils. Attainment and progress wasstill lower than expected and needed in order forMansel to improve. These barriers were recognisedthrough external moderation of Mansel, due diligencework by an NLE upon going into the school prior toAcademisation, historical and current data analysisand also league table outcomes.
Actions
l Undertook analysis of Pupil Premium with DfEanalysis tool
l Apply to be part of the research project
l Appoint a school based leader for Pupil Premium /Disadvantaged Pupils to be a champion for themand ensure their needs were being met
l Ensure wave 1 Quality First Teaching wasaddressing the needs of all Pupil Premium children– make sure all staff know who these pupils are!
l Identified a Governor to take a Disadvantaged PupilChampion Governor role, attending Pupil ProgressMeetings and reviews and is aware of allexpenditure and impact of this on progress andattainment

33
National Education TrustNET
l Review current provision and write a detailed actionplan to address key areas
l Review the Pupil Progress Review Meeting formatto address Pupil Premium as a key group
l Review the format of the Principal’s Report toGovernors to ensure that all data includesoutcomes for all cohorts of pupils but this is brokendown for Pupil Premium pupils
l The lesson planning format has been updated toidentify all disadvantaged pupils with specifictargets to be addressed in every lesson. All teachersand other adults are aware of which children areeligible for the Pupil Premium so targeting is moreconsistently applied
l Review the format of the Pupil Premium Impactreport at the end of each academic year to reporton progress, attainment and impact of expenditure
l Work across the Trust for all Inclusion Leaders toconsider Pupil Premium expenditure and impact onoutcomes in all year groups and not just Y2 or Y6
l Appoint a Trust Attendance Officer
l Undertake CPD with staff to ensure focus on PupilPremium pupils
l Review behaviour strategy and approach
l Attendance at and learning from others withinSheffield with the Pupil Premium project
l Attendance at Pupil Premium Conference with Sir John Dunford – Pupil Premium Champion
Monitoring and Evaluation
On-going monitoring of the Pupil Premium projectwork and the impact and monitoring of our PupilPremium expenditure and the outcomes for thesepupils is undertaken at a number of levels and by arange of leaders.
l Comprehensive Academy and Trust action plans arewritten based on previous pupil outcomes andtweaked with current data, identified pupil needand projected budget allocation
l Academy Monitoring, Evaluation and Reviewschedule builds in strategies to monitor the actionplan and outcomes for vulnerable pupils and tomake swift changes to provision as and whenrequired
l The project work has been monitored by LocalAuthority consultants and the NET advisor
l Executive Principal, Principal and Senior leadershipteam regularly review impact of teachers,curriculum, interventions, other staffing (inclusionand pastoral) and current data
l Half termly PPR led by Principal, Deputy Principal(Inclusion) and Pupil Premium Champion attendedby Pupil Premium Governor and all staff within ayear group ensures a focus on this group of pupils
l Half termly Principal report to Governors identifiesPupil Premium outcomes and progress for all yeargroups
l Our half termly Governors meetings havechallenged and monitored the impact ofexpenditure of our funding on interventionprogrammes
l Our half termly Governors meetings havemonitored the data of all our pupils including ourdisadvantaged pupils
l Directors of the SCSP Trust have monitored theoverall expenditure of our Pupil Premium fundingwith regard staffing, evaluated the impact ofadditional provision, including interventions andalso agreed additional expenditure based on needfrom more accurate data and analysis of outcomes
l External monitoring has also been focussed in PupilPremium including DfE and Ofsted
Impact
Impact from involvement in the project has beensignificant in that the attainment and outcomes of all

34
National Education TrustNET
pupils, but especially those Disadvantaged Pupils hasimproved significantly, so much so that their progressand attainment in some areas is higher than NonDisadvantaged Pupils. Our work and practice atMansel and across SCSP has been refined as a result oflearning from others, locally and nationally.
An Ofsted inspection of Mansel in January 2015recognised this stating in the report that “The use ofPupil Premium funding is increasingly effective inensuring disadvantaged pupils narrow the gap inattainment with other pupils. How welldisadvantaged pupils' achieve is closely analysed andinitiatives focus on boosting the learning of theindividual pupils and preparing them well for theirfuture learning. This is particularly evident in theirprogress compared with other pupils and is oftenhigher.”
“Disadvantaged pupils are narrowing the gap inattainment between the standards they reach andthose of other pupils. In 2014, the results of NationalCurriculum tests for these pupils in reading were inline with other pupils in the academy, in writing theywere almost a term above and in mathematics theywere less than a term below. The academy rigorouslyreviews how Pupil Premium expenditure is used on aregular basis and there is evidence of increasinglygood achievement by eligible pupils throughout theacademy and standards which are at least as high asother pupils.” – Ofsted Jan 15
Ofsted Jan 15 also stated that “Governors are fullyinvolved in decisions on the use of Pupil Premiumfunding that are leading to reducing the gap betweenlearners and improving behaviour and attendance.”
Other Learning
l Awareness of the Pupil Premium awards andlearning from the good practice of the awardwinners
l Learning from others on the project within Sheffieldbut also from the work of National Education Trust
l Engagement with Sir John Dunford – PupilPremium Champion
Nicola Shipman, Executive Principal
Hucklow Primary School
Number on roll: 439
Proportion of disadvantagedlearners: 69%
About: Exploring which types ofprovision would have the greatest impact onnarrowing the gap
At Hucklow Primary School we firmly believe that wework together, in partnership with parents, to providethe children in our care with all the necessary skillsthey need to be successful in their future life, bothacademically and pastorally. We hope that by the timechildren leave Hucklow they are independent learnerswho have a wealth of skills that will help them tosucceed in their educational journey and future lives.At Hucklow we feel that it is not only the academicsupport we provide that is vital, but also the pastoralcare and social development skills. The whole schoolteam continues to support this through excellentpersonal care, individual nurturing, and collectiveresponsibility- and with a strong emphasis on corevalues.
Hucklow is a very large primary school that faces adiverse range of challenges which the school aspiresto overcome. Most children are from a challengingcatchment area with a number of important factors.RAISE data places the school in the top 80% of thecategories of the school deprivation indicator (0.45),70% live in the most deprived category (IDACI) and afurther 29% are in the second most deprivedcategory. The percentage of pupils eligible for freeschool meals (in the last six years) is at 45% and thepercentage of pupils whose first language is notEnglish is 79%. One of the greatest challenges is thevery low level of basic skills that children have whenthey join the nursery, particularly in communicationand language skills and social skills.
The Hucklow community sees it as their mission togive our pupils and families the aspirations andambitions to achieve well and become successful inlife.
Barrier(s) and How They Are Identified
A significant majority of pupils start with a very lowlevel of basic skills, particularly in communication andlanguage skills and social skills.

35
National Education TrustNET
A significant number of pupils live in economicallychallenging circumstances and experience daily thepressures associated with economic challenges andpoverty. As a result many pupils and families bringsocial and emotional pressures to school and look tous to support them.
Actions
Review of Pupil Premium funding – how is fundingused to support and address the challengesdisadvantaged pupils face?
Using the enquiry method the leadership teamlooked at how Pupil Premium funding was used andthe impact this had on closing the gap and on pupilself-esteem. Questions to consider were determinedand staff looked at data from interventions, behaviourlogs, pupil questionnaires, book scrutiny andobservation. From this we implemented a plan toensure that we use gap analysis much moreeffectively, with gaps quickly identified in quality firstteaching and closed through timely intervention. Forexample: where gaps have been identified in mathslessons these gaps can be quickly closed that daythrough additional teaching.
We employed an additional learning mentor to focuson enrichment activities and extra-curricular activitiesthat would boost pupils’ self-esteem, aspiration andself-belief. Learning mentors have worked as part of ateam to implement a package of activities run before,during and after school time. These include abreakfast club (with a reading focus), a home learningclub (with use of ICT for homework), sporting clubs,craft clubs and lunchtime challenges. Children
comment on the fun they have during these activitiesand see them as an incentive to come to school andparticipate.
To explore and establish which type of provisionwould have the greatest impact on narrowing thegap for disadvantaged learners.
We worked with Teaching Assistants (TAs) to reviewinterventions that were taking place in school andunpick the impact they were having on progress.Through this we identified which interventions hadthe greatest impact and evidence of transference ofskills back into the classroom. We then established abespoke training package for TAs to ensure that theywere having maximum impact on pupil progress andattainment. TAs were released every Wednesdaymorning for one hour to participate in trainingactivities and discussions, and to share good practice.Through this we established coaching partnershipsand support networks. TAs identified the need to setmore time aside for quality communication with theteacher and team they work with. As an outcome fromthis feedback we now employ TAs for longer hours sothat they can attend phase meetings and planneddaily meetings to discuss teaching and learning. Theschool very much uses additional provision as a timelyintervention to address specific aspects of a child’slearning, and we have moved more towards sharpgap analysis and gap teaching as part of quality firstteaching. All interventions are tracked and dataanalysed to ensure pupils are making typical or betterprogress. To determine what wider aspects wouldsupport our aims
Core Values
The school set up a working party consisting of staff,pupils and parents to establish core values that wouldunderpin the ethos of the school and become verymuch the heart of our community. The core valueswould help support the mission to give our childrenthe best possible start in life. The working partysurveyed the whole school community and six corevalues were chosen. These were then shared withstakeholders through parent forums, assemblies and
“TAs identified the need to set moretime aside for quality communicationwith the teacher and team they workwith.”

36
National Education TrustNET
newsletters. To ensure that the core values areembedded and understood each core value isdiscussed in-depth in assemblies and circle time, andthe language is used throughout the school. Childrenlearn and sing songs linked to each core value whichthen form part of the school’s celebration events. Thecore values have helped us to adapt our behaviourpolicy so that it very much reflects British values and issolution-focused and restorative in its approach.
Monitoring and Evaluation
The school monitors different groups of learners, including disadvantaged learners, regularly throughphase, pupil progress and additional meetings for Y2and Y6 pupils. All staff at all levels have anunderstanding of the different groups of learners andthe progress they make. Slow moving pupils areidentified and action is taken to accelerate learningand progress. Both senior and middle leaderscomplete in-depth monitoring and evaluation,including data analysis. This informs the schooldevelopment plan and is shared with governors andother school staff. Alongside this, the school hasdeveloped a strong coaching ethos that supportsteaching moving from good to outstanding. Theschool also uses the enquiry method (involvinggovernors, pupils, parents and staff at all levels) toevaluate impact and raise further questions tosupport development.
Impact
l All pupils are rigorously tracked and slow moversidentified
l Data is used effectively and informs next steps
l Provision / intervention is timely and tailored toneed
l Gap analysis is tighter and teaching to the gapensures there is little or no ‘drift’
l Bespoke CPD for NQT and TAs
l Strong coaching ethos to support NQT, RQT andteachers moving from good to outstanding
l All staff very much aware of the different groups oflearners and the progress they make
l Enquiry method and action research developed andused throughout the school
l High expectations for all learners
Jane Irwin, Senior Inclusion Manager, HucklowPrimary School
Handsworth Grange CommunitySports College
Number on roll: 1016
Proportion of disadvantagedlearners: 37.5%
About: Building independentlearning skills and challenging
entrenched negative attitudes to learning. Pupil Premium award winners 2015
Aim
l Raise attainment of Pupil Premium students
l Raise the aspirations of Pupil Premium students
l Develop independent learning skills
l Engage students in additional learningopportunities
l To develop an alternative approach to homelearning for targeted Pupil Premium pupils throughthe use of EDLounge
Context
l Regional winner, National Pupil Premium Awards2015.
l Handsworth Grange Community Sports College isone of the most improved schools in Sheffield overa 4 year period and was one of the top 100 mostimproved schools in the country in 2012.
l The proportion of pupils for whom Pupil PremiumFunding supports (34%) is above the nationalaverage and is rising.
l We have been commended by the Department forEducation for our Pupil Premium work.
l VA scores for all groups (with the exception of SAand SA+) are all significantly above national scoreson Raise.
l Pupil Premium achievement Key Stage 4 in Englishand Maths is strong. The Attainment gap isnarrower than the national figure.
Key Actions
The main actions for the project were:
l Identifying EDLounge Champions
l Set Aspire Challenge on EDLounge

37
National Education TrustNET
l Identified Aspire Challenge trial cohort (Y7 PPstudents)
l Informed parents of EDLounge and distributedparental logon details
l Set up departmental races and tracking systems
l Monitor progress through EDLounge usage reports
l Develop Aspire Challenge to meet changing needsof other cohorts e.g. Y10 and Y11 to include specificcareer preparation activities, Year 9 to includeOptions Process guidance and activities
What We Did
EDLounge is an inclusive online learning, monitoringand assessment platform to help schools raisebehaviour, increase achievement and improveattendance. It allows staff to set specific pathways oflearning activities for individuals and groups ofstudents. Staff can create and upload their ownresources on drawn from a bank of over 2000 pre-prepared resources that match a range of examsyllabuses and meet requirements of the nationalcurriculum.
We set up a range of systems to allow different staff inschool to manage resources and learning task settingfor different students under different circumstances.
1. We created a pathway of learning activitiesdesigned to challenge and accelerate learning. TheAspire Challenge was targeted at 67 of our Y7 PupilPremium pupils. We tracked the English, Maths andScience data for these students before and duringtheir challenge.
2. Set up learning pathways for persistently absentpupils (medical, exclusion and school refusers) tosupport their learning and attainment outside ofschool. We tracked and monitored the learninghours gained by these pupils.
3. Tracked and monitored the learning hours lostthrough Persistent Absence (PA) and the hoursgained through EDLounge use for this cohort ofstudents. We compared the Pupil Premium cohortfigures to those of non Pupil-Premium students.
4. We used predominantly EDLounge Champions andpastoral staff (HOY, EWO) to drive EDLounge andmanage the set of pathways and resources fordepartmental and whole school use.
5. We engaged parents in the process through theintroduction and use of the Parent Page, as well asholding parental information sessions.
Project Barriers
The main barriers to the success of the project were:
1. As an online learning platform access to EDLoungeis a limited resource for students with no ICTfacilities or internet provision beyond school.
2. Increasing staff workload means individuals do nothave the time to actively update EDLoungecontent.
3. EDLounge has a wide range of uses and theoperational management of the service needed tobe distributed.
Overcoming the Barriers
l Using our in-school application system the projectwas granted additional funding from our SportsCollege Specialism. We invested in internet-readydongles and set up a system of hiring so thatstudents with limited ICT and internet facilitiescould access these resources from home. We alsohave a pool of laptops from which students canborrow in order to complete homework andcoursework; this resource provision has beenutilised along with dongle hire to allow access.
l Increasingly staff workload is an on-going issue inmany schools; EDLounge is a valuable learning toolbut in order to fully utilise all of its possibilities alevel of commitment is required for staff. In order toovercome to additional work burden for themajority of staff each subject area was asked tonominate an EDLounge Champion who would leadon the development of EDLounge and resources for

38
National Education TrustNET
the department. Each department Champion tookon the responsibility of developing and uploadingresources. Department resources are continuallydeveloped in line with our developing Curriculum2014 model and are uploaded in accordance withschemes of work. Department Champions areresponsible for the setting of homework tasks forthe half termly Homework Drives and also workwith Heads of Year and our EWO to set work overlonger time periods for students who arepersistently absent.
l EDLounge has a wide range of different uses. As aschool we primarily envisaged using EDLounge toraise the attainment, aspirations and engagementof our Pupil Premium cohort. As we developed ouruse and knowledge of EDLounge it was evident
that the platform could be used to effectivelysupport students in:
– Homework– Independent learning– Career preparation– Exclusions and reintegration– Exam preparation– Long term absence– Hospital and home education– Development of key skills
The management of each strand of the platformrequires specialist input from different staff:
l Heads of Year track and set work for long termabsentees
l Deputy Head, Assistant Head and Subject Leadersfor English and Maths set appropriate work forHospital and Home Educated students inpreparation for exams
l Pupil Progression Manager oversees usage forcareer preparation
l Assistant Head oversees usage for Year 9 OptionsProcess support
l EWO links with HOY to set, track and monitorprovision for persistent absentees
l Department EDLounge Champions set and monitorhomework tasks for their department
l Class teachers monitor homework for their classes
l Subject Leaders utilise and oversee usage of theExam Preparation tools for KS4 students
l Assistant Head oversees school usage reports andruns inter-department, house, year group, form andindividual races
l Heads of Year oversee usage reports for their yeargroups for purpose of whole school rewards
l Aspire Challenge, prizes, awards and racesmanaged by Assistant Head
Y7 Y8 Y9 Y10 Y11 Total Hrs
321 211 184 256 163 1135
f Table 1: EDLounge Use – HoursCompleted
Y7 Y8 Y9 Y10 Y11 Total Hrs
All students 321 211 184 256 163 1135
Pupil Premium students 258 142 129 174 101 804
Proportion 80.4 67.3 70.1 68.0 62.0 70.8
f Table 2: EDLounge – Usage by Disadvantaged Pupils
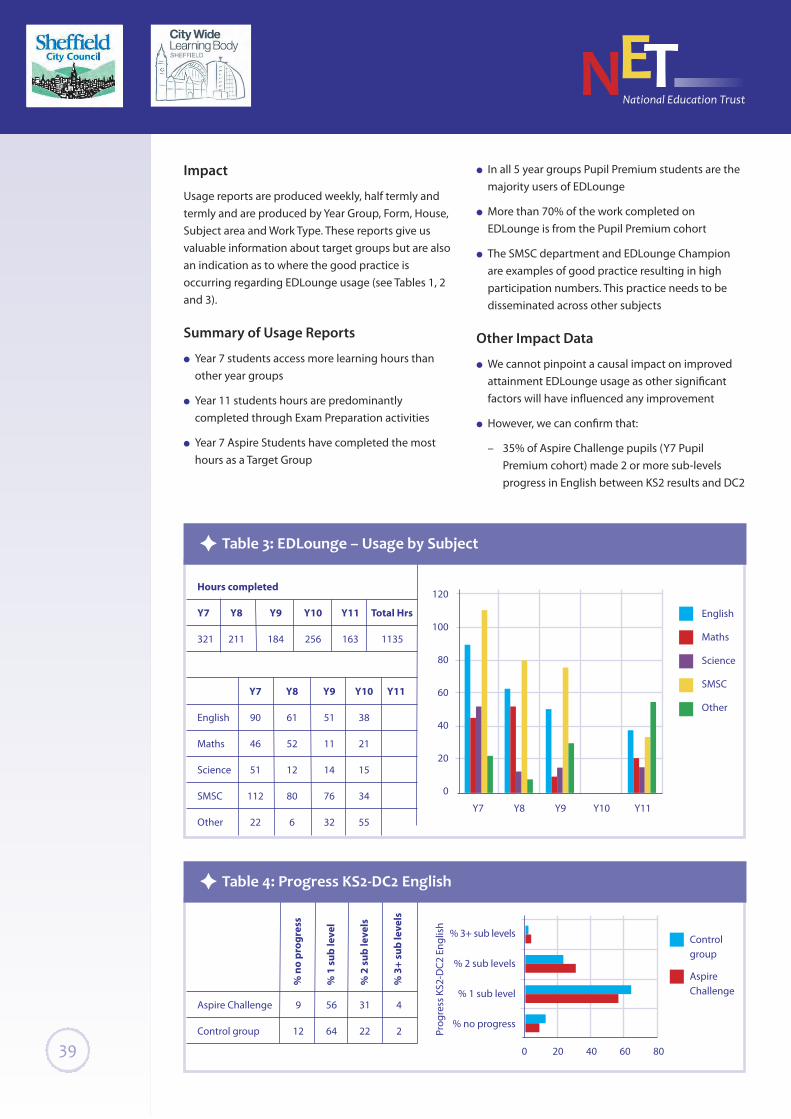
39
National Education TrustNET
Impact
Usage reports are produced weekly, half termly andtermly and are produced by Year Group, Form, House,Subject area and Work Type. These reports give usvaluable information about target groups but are alsoan indication as to where the good practice isoccurring regarding EDLounge usage (see Tables 1, 2and 3).
Summary of Usage Reports
l Year 7 students access more learning hours thanother year groups
l Year 11 students hours are predominantlycompleted through Exam Preparation activities
l Year 7 Aspire Students have completed the mosthours as a Target Group
l In all 5 year groups Pupil Premium students are themajority users of EDLounge
l More than 70% of the work completed onEDLounge is from the Pupil Premium cohort
l The SMSC department and EDLounge Championare examples of good practice resulting in highparticipation numbers. This practice needs to bedisseminated across other subjects
Other Impact Data
l We cannot pinpoint a causal impact on improvedattainment EDLounge usage as other significantfactors will have influenced any improvement
l However, we can confirm that:
– 35% of Aspire Challenge pupils (Y7 PupilPremium cohort) made 2 or more sub-levelsprogress in English between KS2 results and DC2
120
100
80
60
40
20
0
Y7 Y8 Y9 Y10 Y11
English
Maths
Science
SMSC
Other
Hours completed
Y7 Y8 Y9 Y10 Y11 Total Hrs
321 211 184 256 163 1135
Y7 Y8 Y9 Y10 Y11
English 90 61 51 38
Maths 46 52 11 21
Science 51 12 14 15
SMSC 112 80 76 34
Other 22 6 32 55
f Table 3: EDLounge – Usage by Subject
% 3+ sub levels
% 2 sub levels
% 1 sub level
% no progress
0 20 40 60 80
Controlgroup
AspireChallenge
Aspire Challenge 9 56 31 4
Control group 12 64 22 2
f Table 4: Progress KS2-DC2 English
% n
o pr
ogre
ss
% 1
sub
leve
l
% 2
sub
leve
ls
% 3
+ su
b le
vels
Prog
ress
KS2
-DC2
Eng
lish

40
National Education TrustNET
compared to 24% of the Control Group (seeTable 4).
– 37% of Aspire Challenge pupils (Y7 PupilPremium cohort) made 2 or more sub-levelsprogress in Science between KS2 results andDC2 compared to 32% of the Control Group (seeTable 5).
– 42% of Aspire Challenge pupils (Y7 PupilPremium cohort) made 2 or more sub-levelsprogress in Maths between KS2 results and DC2compared to 38% of the Control Group (seeTable 6).
Of 402 parental questionnaires returned 90% said thatthey felt that EDLounge helped improve their child’sattainment.
Do you feel EDLounge helps raise your child’sattainment? (see Table 7)
91% of students questioned (of which 62% were PP)felt that EDLounge improved their attainment.
Do you think EDLounge will help to raise yourattainment (see Table 8)?
An increased number of PP students are consideringSTEM careers/university (data from OptionsInterviews). 93% of students questioned (of which
% 3+ sub levels
% 2 sub levels
% 1 sub level
% no progress
0 20 40 60 80
Controlgroup
AspireChallenge
Aspire Challenge 12 53 29 6
Control group 9 59 28 4
f Table 5: Progress KS2-DC2 Science
% n
o pr
ogre
ss
% 1
sub
leve
l
% 2
sub
leve
ls
% 3
+ su
b le
vels
Prog
ress
KS2
-DC2
Sci
ence
% 3+ sub levels
% 2 sub levels
% 1 sub level
% no progress
0 20 40 60 80
Controlgroup
AspireChallenge
Aspire Challenge 2 56 37 5
Control group 3 59 35 3
f Table 6: Progress KS2-DC2 Maths
% n
o pr
ogre
ss
% 1
sub
leve
l
% 2
sub
leve
ls
% 3
+ su
b le
vels
Prog
ress
KS2
-DC2
Eng
lish
1 :-( 2 3 4 :-)
% 4 6 34 38
f Table 7: Percentage of ParentsWho Felt EDLounge Helps Raise Their Child’s Attainment
Yes No
Percentage 91 9
Pupil Premium 62 3
Non Pupil Premium 29 6
f Table 8: Percentage of StudentsWho Felt EDLounge ImprovedTheir Attainment

41
National Education TrustNET
56% were PP) felt that EDLounge helped them tounderstand their class work better
Does EDLounge help you to understand work you doin school (see Table 9)?
Of the 1,146,840 possible annual learning hours,14146 were potentially lost between June 2014 andJan 2015 due to Persistence Absence (66% of thesehours were Pupil Premium pupils). 5625 of these wereregained through the use of EDLounge (see Table 10).
Monitoring and Evaluation
We have used a variety of tools to monitor andevaluate the use and impact of EDLounge and theAction Research Project. Evaluation of the impact ofthe project is an on-going process. Monitoring andevaluation tools include:
l Student voice questionnaires
l Parent voice questionnaires
l EDLounge usage reports; we can generate reportsfor hours of learning completed and success ratesby year group, target group, form, house andindividual
l Data Collection; our data tracking systems allow toeffectively monitor the progress and attainment ofour students at 4 key points in the year. We can usethis data to demonstrate progress made in subjectsand link this directly back to additional use onEDLounge.
l Aspire Challenge allows us to track the progress of atarget group of Pupil Premium pupils; a control groupof non-PP students with similar data entry points isused as a measure of progress and attainment
l Hours-lost v hours gained data for PA pupils
Summary
In conclusion the use of EDLounge has had thefollowing benefits for the school:
l A decrease in lost learning time through medical,exclusions and school refusal.
l Pupils are able to complete classwork at homepreventing them from falling behind, therefore notwidening the achievement gap
l Attainment gaps for Pupil Premium students (andother target groups) have closed (Raise onlinefigures are significantly lower than national for allgroups with the exception of SA and SA+).
l Pupils are engaged in home learning and excited bychallenge and new learning opportunities
l Increased levels of homework being set across theschool
l Increase in awareness of careers and careerpreparation
l Additional exam preparation opportunities
l Improved contacts and links with parents andcarers through Parent Page.
Definitely Sometimes Not at all Not sure
Percentage 57 36 2 5
Pupil Premium 33 23 0 3
Non Pupil Premium 22 13 2 2
f Table 9: Does EDLounge Help You to Understand Work You Do in School?
PX&Ex SR HHE Med Hours lost Hours gained
Hours lost 2446 1958 2310 7432 PP 9125 3923
Hours gained 983 327 1329 2986 Non PP 5021 1702
Of the hours regained 70% of these were from the Pupil Premium cohort
f Table 10: PA Hours Lost v Gained June 2014 – January 2015

42
National Education TrustNET
Carfield Primary School
Number on roll: 588
Proportion of disadvantaged learners: 19%
About: Improving outcomes for disadvantagedlearners by improving systems, processes and takingan evidence based approach
Carfield is a large primary school in the Meersbrookarea in the south of Sheffield. There are 571 pupils onroll. Approximately 14% of pupils speak English as anadditional language, 12% of pupils are eligible for freeschool meals, 19% of pupils are eligible for PupilPremium funding and 10% of pupils have SpecialEducational Needs.
We were keen to be part of the Action ResearchProject as, despite previous attempts at allocating andmonitoring the impact of our Pupil Premium funding,gaps were not closing. Teachers were fully aware ofwho their Pupil Premium pupils were but there wasnot enough consistency or rigour in the way fundingwas being used across the school to identify andaddress gaps in attainment. One of the first things wedid at the start of the project was allocate the role of‘Pupil Premium coordinator’ to a member of the SLTteam (an assistant headteacher who, as SENCo, had astrong understanding of the attainment and progressdata across the school and, as line manager ofteaching assistants, could allocate support where itwas needed).
Despite having used the Sutton Trust research toidentify which approaches help pupils make the mostprogress, these initiatives had not been fullyembedded across the school and were therefore notmaking the desired impact.
Effective Feedback
Several models had been tried over the previous yearincluding HLTAs releasing class teachers to give PupilPremium pupils ‘effective feedback’ (1/2 hour per childthroughout the school), then focusing this on one ortwo year groups and having shorter, more regularfeedback sessions.
This did not have the desired impact because we werenot specific enough with staff as to what they neededto do in this time, and some class teachers werereluctant to spend too much time away from their
class, so in some cases asked the HLTA to give thefeedback instead.
We addressed this issue by making marking andfeedback a school priority during the project. Aproportion of the funding was spent on staff trainingand development on effective feedback, and onlabels, stickers, pens and markers to accompany thepolicy, which was implemented across the school.
Teachers now incorporate feedback time into lessonsand ensure all disadvantaged pupils receive verbalfeedback. The introduction of the new STATassessment materials has helped give teachers andpupils greater clarity on what objectives have beenachieved and which ones are areas for development.
One-to-One Tuition
After analysis of the data we identified that Y3 and Y4were where the gap between PP and non-PP pupils’attainment, particularly in writing, was the widest. Aone-to-one tutor was appointed for three days a weekusing Pupil Premium funding.
Eight pupils were selected per term to work for twosessions a week with the tutor on areas identified byclass teachers. Once started, the tutor asked whethershe could incorporate some of the areas that thepupils had asked to work on. As well as having thegreatest impact on raising attainment of all theapproaches used, we have also seen a significantimprovement in the self-esteem and confidence ofthe pupils who have worked with the tutor over theyear.
All pupils wrote a letter home to parents explainingwhat they would be doing over the term and whatthey hoped to get better at during this time. Theseletters built up the children’s ownership of the workthey did with the tutor and were very well received byparents as they offered a great way to engage them inthe work their children were doing at school.
“The introduction of the new STATassessment materials has helped giveteachers and pupils greater clarity onwhat objectives have been achievedand which ones are areas fordevelopment.”

43
Focused Allocation of Teaching AssistantTime
In the past, there had not previously been clearenough direction in the use of teaching assistants’time. The equivalent of four full-time TAs are fundedby the Pupil Premium but there was no consistentsystem in place for tracking or monitoring the impactof interventions and identifying which pupils hadreceived additional support.
Teachers identified which pupils they thoughtrequired additional intervention and this number wasinitially very high. Disadvantaged pupils, particularlythose with Special Educational Needs, were prioritisedfor additional support and TAs were allocated to thecurriculum area where their strengths lay.
Some Pupil Premium funding has been spent ontraining for TAs to focus on their own subjectknowledge and pedagogical approaches. Teacherscompleted a proforma for TAs to identify whichobjectives individual pupils needed to focus on andintervention groups were limited to four pupils. Arecord-keeping system was introduced for monitoringpupils’ progress towards their individual targets andalso to keep track of how many out of the specifiednumber of sessions took place. One thing we noticedwas that the same two TAs regularly missed theirintervention sessions as they were out on trips withclasses (because they were both first aiders), so wespent a proportion of PP funding on first aid trainingfor other TAs to prevent this happening. Throughoutthe year, the number of children in interventiongroups was reduced and teachers could instead ‘bid’for Pupil Premium funding to purchase resourceswhich would support these children in class instead.
Summary
Whilst the attainment of disadvantaged pupils is stillbelow that of other pupils, on average, disadvantagedpupils made more progress than their peers in mostsubjects in most year groups last year and during theAutumn term of 2014.
The Pupil Premium is clearly allocated, the impact ofeach approach is monitored and successfulapproaches are rolled out to other year groups.Tracking systems are in place and teachers accuratelyidentify where there are gaps in knowledge and whatwould be the best way to address these. The emphasisis on consistency in quality first teaching, supportedby effective feedback and targeted intervention toaddress gaps in understanding.
Hunter’s Bar Infant School
Number on roll: 270
Proportion of disadvantagedlearners: 11%
About: Narrow the gap inprogress for our Pupil Premium
children in Maths, Writing and Reading. Raise theaspirations of our Pupil Premium children. Engage allPupil Premium children in additional learningopportunities.
Context
At Hunter’s Bar Infant School we are committed to thedevelopment of the whole child. We believe thatpersonal development and well–being are just asimportant as academic attainment. We understandhow vital it is for everyone to appreciate one anotherand to celebrate the diversity which exists within theschool. Parents and carers are very much encouragedto be involved in their child’s infant school experience.
This is a larger than average-size infant school, with270 children on role and 41 staff. 14% of childrencurrently receive SEN support. The proportion ofpupils from minority ethnic groups is over twice thenational average. Pupils of Pakistani heritage make upthe largest of these groups. 17.7% of pupils speakEnglish as an additional language. A below averageproportion of pupils are known to be eligible forPupil-Premium funding. Our current attendance is96.2%.
Barriers and How They Were Identified
Following the initial discussion with Governors, SLT,Teaching Staff and Support Staff, it was clear thatPupil Premium children, although highlighted as avulnerable group in school, were not being targetedand monitored enough for all stake holders to have aclear understanding of priorities for these children.
There was a gap in progress between our PupilPremium children and our Non-Pupil PremiumChildren.
Actions
l Increase staff awareness of Pupil Premium children.
l Ensure that first quality teaching is happening forall children across school.
National Education TrustNET

44
l Raise the level of awareness of Pupil Premiumchildren amongst the Governing Body.
l Make Pupil Premium children a focus of staffperformance development.
l Monitor the effectiveness of interventions.
l Develop links with junior school to work togetheron projects effecting same families.
Increasing Staff Awareness of PupilPremium Children
All staff have now completed a Pupil Premium casestudy for each child eligible for PP. These passportsinclude:
l Barriers
l Interventions including attendance at clubs
l How will expenditure positively impact on learner
l Impact
Result
As a result of Pupil Passports staff feel that they aremore aware of the barriers to learning these childrenhave and that they can be proactive in their planningto ensure that expenditure is having a positive impactfor these children.
Initiatives in Learning and Teaching
We recognise the importance of first class qualityteaching in every classroom being essential to theraising of standards across the whole school.
The teaching team have continued their monthlyprofessional development programme of focussedStaff Development session, referred to as ‘Teaching
and Learning Community’ sessions-TLC. The approachis based upon that devised by the FormativeAssessment Guru Dylan William and is designed tosupport the school in its aim of moving the teachingto consistently good and outstanding. It involves onlycurrent practitioners (not the Head or Deputy) and assuch enables them to talk completely freely aboutareas of AFL which they are aiming to enhance andembed. The program is built around continuousopportunities to for Peer Observation/Coaching.
In addition to this, the Learning Support Assistantsrun their own TLC that has been adapted to suit theirpractice. Learning Support Assistants have accessedthe Fusion training to develop knowledge in socialemotional and mental health difficulties, an area thathas been highlighted for a significant number ofpupils.
Termly Standard Reviews have been introduced as ameans to monitor, the consistency in approach,differentiation and levels of challenge and accurateuse of assessment as well monitoring the positiveeffect of our new marking and feedback system.
Impact
Pupil Premium children are highlighted as avulnerable group and tracked rigorously. The gap isidentified early and interventions put in place that aremonitored to ensure needs are met.
LSA have attended training to meet the highlightedneeds of these children.
The majority of teaching across school is good andoutstanding, as a direct result of improved AFLstrategies supported through the TLC program.
Pupil Voice indicates that all children are aware of howmarking and feedback enables them to progress andimprove their learning.
We have continued to look at Pupil Premium childrenas a vulnerable group during half termly pupilprogress meetings.
Included the target of narrowing the gap for PupilPremium Children in reading, writing and maths aspart of staff performance management.
Met with Junior Deputy Head and Junior SENCos towork collaboratively on joint areas of concern.
Monitor the inclusion of Pupil Premium children inadditional enrichment activities.
Created opportunities for our more able PupilPremium children to enrich their learning.
National Education TrustNET

45
National Education TrustNET
3 There is no thing as a ‘typical’ Pupil Premium child.The funding offers a unique opportunity to focuson the individual.
3 The answers to cracking the code fordisadvantaged learners doesn't necessarily lie inthe HTs office. Get teachers to input into provision.Middle leaders should be championing the causeof disadvantaged learners every day. Parentsviews on how to effectively use the funding canbe invaluable.
3 Don't wait. Use the funding to enable moreregular Pupil progress meetings. Empower TAs toflag up where interventions are not working for aparticular child.
3 Evidence informed, not evidenced led. The EEFtoolkit offers a brilliant opportunity for PupilPremium activity to be informed by evidence. Butit was never intended to be used 'painting bynumbers’ style. Finding out what works for anindividual school context should be closer toindependent travel with a guidebook than acoach trip where you are told when and where toget off, when to eat etc…
3 Get assessment right. If assessment is inconsistentor poor it is disadvantaged learners that are morelikely to ‘slip through the net’.
3Monitor progress regularly, evaluate outcomesrobustly – but understand that effective qualityimprovement is not necessarily judgemental.
3 Be explicit about what you are trying to achieveand by when. ‘Improve numeracy levels’ is notclear enough. Hold yourself to account for this.
3 Strong values and moral purpose agreed across awhole school are key. Disadvantaged learnersneed a great experience at school in bothstructured and unstructured times during theschool day. Ensure that disadvantaged learnersplay a role in wider school life.
3 Disadvantaged learners are most successful whereteachers in the classroom feel accountable fortheir outcomes.
3Welcome external input. Working together over aperiod of time – with colleagues in your cluster orgroup of schools can be most valuable. A cultureof trust and shared ideas that has grown over timehas been of fundamental importance during thisproject.
With thanks to:
Helen BestSteve DaviesSandra DoyleThomas EdmondsDebbie FulkSam GaymondJane IrwinSteve MatherBev Matthews
Matt PercivalClare RoddisNicola ShipmanPam SmithDiane StokesCarolyn SutcliffeKate WilkinsonKate CheshireBecky WebbKate Grapes
E Ten Reflections to Inform Future Pupil Premium Use
F Acknowledgements

National Education TrustNET
Copyright Sheffield City Council / National Education Trust
www.sheffield.gov.uk/education www.nationaleducationtrust.netRegistered charity number: 1112893
Company number: 5603073