national drought management authority baringo county...
TRANSCRIPT

National Drought Management Authority Baringo County
Drought Early Warning Bulletin for February 2017
Short rains harvests
Short dry spell Reduced milk yields Increased HH Food
Stocks Land preparation
Planting/Weeding Long rains High Calving Rate Milk Yields
Increase
Long rains harvests A long dry spell Land preparation Increased HH Food
Stocks Kidding (Sept)
Short rains Planting/weeding
Jan Feb Mar Apr May Jun Jul Aug Sept Oct Nov Dec
Drought Situation & EW Phase Classification Drought Phase: ALARM Biophysical Indicators
The biophysical indicators show unusual fluctuations outside the expected seasonal range.
11 mm of rainfall received within the month of February.
The vegetation condition index VCI-3month for the County is below normal ranges in East Pokot, Eldamaravin, Baringo south, Baringo North and Mogotio. This is attributed to ongoing drought.
Water in the pans is below normal (10%-30%) Socio Economic Indicators (Impact Indicators) Production indicators:
The forage condition is poor in both quality and quantity. Most Livestock are currently accessing pasture and browse at their dry season grazing zones.
Livestock body condition is poor in all livelihood zones.
Milk production is below normal ranges but projected to reduce further in the next one month due to reducing quality of forage.
Over 2500 Livestock deaths reported in Pastoral and Agro-Pastoral Livelihood zones occasioned by drought.
Access indicators
Terms of trade are below normal range and unfavourable to pastoral livelihoods with a reducing trend.
Distances to water sources for households are above normal with an trend.
Utilization indicators:
Number of children at risk of malnutrition is 19% which above normal.
Occurrence of waterborne/water related diseases is above normal, water contamination reported in Tiaty, Baringo North and Baringo South.
normal, water contamination reported in Tiaty, Baringo North and Baringo South.
Early Warning Phase Classification
LIVELIHOOD ZONE EW PHASE TRENDS
PASTORAL ALARM WORSENING
AGRO PASTORAL ALARM WORSENING
IRRIGATED ALERT WORSENING
COUNTY ALARM WORSENING
Biophysical Indicators Value for the month Baringo & (Mogotio) [Tiaty]
LTA-Monthly Baringo & (Mogotio) [Tiaty]
Normal ranges Kenya %
Average rainfall MM (%)
11(16)[ 17] 147(45)[40] 80-120
VCI-3month 13(3)[ 15] 50 (55) [45] 35-50
% of water in the water pan
3(10-30%) 5-6
Production indicators Value Normal ranges
Livestock Migration Pattern Not Normal Normal
Livestock Body Condition 3(25-30%) 4-5
Milk Production (Ltr /HH/Month)
1.5 >2
Livestock deaths (for drought)
>2500 No death
Access Indicators Value Normal ranges
Terms of Trade (ToT) 40 >50
Milk Consumption (Ltr) 1.4 >1.5
Water for Households-trekking distance (km)
11,1 0-3
Crops area planted for the season (%)(by December)
80(maize) 183(bean)
LTA (1205Ha) LTA(1276Ha)
Crops Yield % for the season (90 kg bag)(by December 2016)
70(maize) 247(bean
LTA(15,400) LTA(10,773)
Utilization indicators Value Normal ranges
At Risk (%) 19 <15
Occurrence of Water borne disease-diarrhoea
> 20 wards reported
0-2 wards
FEBRUARY EW PHASE

2
A. BIOPHYSICAL INDICATORS 1.1. METEOROLOGICAL DROUGHT 1.1.1. RAINFALL PERFORMANCE
The month of February was characterised with hot dry and dusty weather conditions with no precipitation.
Though average rainfall of 11.00 mm was recorded in the month of February. In comparison to LTA, the current rainfall is below normal to the long-term rainfall
average of 96 mm. Temperatures recorded increased significantly during the month to (30-45ocelsius)
There were no other major climatological/ weather related events.
Rainfall station data (GROUND DATA)
Fig.1 1.1.2. RAINFALL ESTIMATES FOR THE 2 SUB COUNTIES BASED ON ARC DATA SOURCE
Fig.2
Mogotio Sub County received an approximate average rainfall of 16.00 mm within the month of February. In comparison to the long-term rainfall average of 33.0 mm, the current rainfall situation is below normal for this period of the year.

3
Fig.3
Tiaty Sub- County received an average rainfall of 17.00 mm within the month of February. In comparison to the long-term rainfall average of 24.00 mm, the current rainfall is below normal at this period of the year.
STANDARDISED PRECIPITATION INDEX (SPI) The February SPI (SPI 3M) values for Baringo County and East Pokot sub-county are projected to be below normal.
1.2 AGRICULTURAL DROUGHT 1.2.1 VEGETATION CONDITION INDEX (VCI)
The VCI value for February for Baringo County, Mogotio and East Pokot sub-county was 12.58, 3.47 and 14.57 respectively. Mogotio and Baringo North are currently below normal indicating extreme drought as reflected in Fig.5. With the whole County experiencing moderate drought.
COUNTY Sub County VCI as at 28th February 2017
BARINGO
County 12.58 Negative trend with 2 sub-counties in the extreme vegetation deficit band and 4 sub-counties in severe vegetation deficit. The short rains season has been inadequate, with insufficient recharge of water sources and poor regeneration of pasture. Unless there will be offseason rains in January and February, the VCI will continue to decline in the next quarter, with a probable severe vegetation deficit that will significantly impact on local livelihoods.
Central 13.42 Eldama 12. 29 Mogotio 3.47 North 8.63 South 17.69 Tiaty
14.57
Fig.4.Source BOKU
The information provided above indicates severe drought in all sub-counties in Baringo County, Tiaty, Baringo North and Mogotio being worst affected and currently facing extreme drought.

4
Fig.5.Source BOKU
Fig.6 Source
BOKU
In Fig.6 above, Baringo County had vegetation cover of 12.58, which has reduced compared to the month of January. This trend is expected to worsen with the ongoing drought in Baringo County.
1.2.2 Field Observations (Forage Conditions) Pasture
The pasture quality and quantity remained largely poor (5%) in all livelihood zones. The current situation is below normal.
Livestock from Orus, Pakka and Loyamarok have moved towards Rugus, Arabal grazing zones and neighbouring Elgeyo Marakwet and Samburu Counties. Livestock in Ribko and Kolloa wards have moved to Kulol, Kadungoi, Kasarani and Turkana borders grazing convergence zones. While those from Solar, Kapau, Napur, Chesawach and Pkatil hills have moved towards Lomelo, Lopeitom, and Kasarani and Kapururu borders of Turkana County in search of pasture and water.
Browse The browse conditions across all livelihoods are poor (10%). The situation is
abnormal at this time of the year. The browse is fairly palatable and quantity is poor for livestock. Sporadic precipitation affected quality of forage especially along Kerio valley region. The browse quality is expected to deteriorate with the ongoing drought.

5
1.3 .0 HYDROLOGICAL DROUGHT 1.3.1 Water Resource State of Water Sources
Fig.7
The main water sources for both domestic and livestock use were Borehole (21%), Pan
and dams (19%) and Traditional water wells (17%).
The availability of water in the wards is poor. No water point’s recharge was
reported.
Surface temperatures remained high during the month at above 30ocelsius.
Currently most water pans have dried up with existing ones having below 15%
of normal capacity and is expected to last less than a month especially in
pastoral and agro pastoral livelihood zones.
Water quantity and quality is poor & deteriorating in all livelihood zones with
over 20 wards reporting waterborne and diarrhoeal cases.
Ground observations and reports show that the state of water sources was
ranked at 2 in reference to the scale below.
INDEX STATE OF WATER
DESCRIPTION
1 EMERGENCY SITUATION
All main water sources have dried up; only few boreholes still yielding significant amounts.
2 STRONGLY INADEQUATE
Surface water sources have dried up while the underground water sources are yielding very little amounts of water. Breakages of boreholes contribute to worsen the situation. Acute water shortage in many areas within the livelihood.
3 INADEQUATE Surface water sources have dried up while the underground water sources are yielding modest amounts of water. Concentration of livestock around few water points contribute to the spread of communicable diseases and degradation of rangeland.
4 DECLINING The water availability is below normal for the period, but showing declining trends.
5 NORMAL The water availability is normal for the period. 6 GOOD The water availability is above normal for the period.

6
1.3.2 Household access and Utilization
Jan Feb Mar Apr May Jun Jul Aug Sep Oct Nov Dec
Long Term Mean 3,1 3,5 3,5 3,3 2,5 2,9 2,8 2,5 2,4 2,7 3,2 2,8
2016 2,2 2,8 3 2,3 1,7 1,3 2,2 1,35 1,59 4,48 4,59 8,5
2017 8,7 11,1
0
2
4
6
8
10
12
Wat
er S
ou
rce
Dis
tan
ceWater Source Distance 2017
Fig.8 The average distance from the households to water sources increased to 11.1
km in the month of February in comparison to that of 8.7 km in January. This is attributed to long dry spell, poor water sources recharge from the short rains and drying up of available sources. With the pastoral regions of the county being most affected. Households in pastoral and Agro-Pastoral livelihood covered the longest distances to water sources as compared to those in irrigated i.e. 20km and 7km respectively.
1.3.3 Livestock access
Fig.9
Grazing distance increased from 10.8 km in January to 11.3 km in February. This is attributed to declining pastures and browse together with increasing watering distances in pastoral areas coupled with livestock migration. Households in Pastoral all species livelihood zone covered the longest distances of 8-30km to grazing areas as compared to 1-4 km covered by those in the Irrigated cropping livelihood zone.

7
MEASURING DROUGHT IMPACT ON SOCIO-ECONOMIC INDICATORS 2.0.0 PRODUCTION INDICATORS 2.1.0 Livestock production 2.1.1 Livestock Body Condition
Livestock body condition is poor (critical) especially for cattle in pastoral livelihood zones but stressed in Agro-Pastoral and irrigated livelihood zones. This is attributed to deteriorating water and forage quality and quantity in the
county. 12th -13th ribs were visible in all livelihood zones. The current livestock body condition can be rated at index 3 as per the
threshold scale below for most livestock.
BODY CONDITIONS SCORE WARNING STAGE
Emaciated, little muscle left 1 Emergency Very thin no fat, bones visible 2 Thin fore ribs visible 3 Alert Worsening/Alarm Borderline fore-ribs not visible. 12th & 13th ribs visible 4 Alert Moderate. Neither fat nor thin 5 Normal/Alert Good smooth appearance 6 Very Good Smooth with fat over back and tail head 7 Normal Fat, Blocky. Bone over back not visible 8 Very Fat Tail buried in fat 9
Fig.10
2.1.2 Livestock Migration Patterns.
Most pastoralists have migrated to their last phase of fall-back grazing grounds due to scarcity of pasture, browse and water. Animals from Solar, Kapau, Napur, Chesawach and Pkatil hills are moving towards Lomelo, Lopeitom, Kasarani and Kapururu borders of Turkana County.
Some pastoralists from Orus and Amaya have moved towards Arabal and Mukutani. Significant migration was reported in Mogotio, Baringo Central, Baringo North and Koibatek sub-counties.
Outward migration towards Elgeyo Marakwet and Laikipia reported
2.1.3 Livestock Diseases
Cases Foot and mouth disease outbreak were reported in Eldama Ravine. CCPP and ECF are endemic in these areas.
Disease Area Reported Livestock Livestock lost CCPP Mukutani, Saimo soi, Loiwat, Kaptuya,
Kolloa, Akoret, Tirioko, Goats and Sheep. 68 sheep and goats
FMD Ilchamus, Tirioko,Ribkwo, Kerio Valley,Chemogoch, Kipsogon
Cattle
PPR Ribko, Tirioko, Ilchamus, Saimo soi, Katuwit, Koloa, Kositei,Kamar, majimoto,Emining,
Shoats 50 shoats
ECF Ribko, Kolloa, Saimo soi, Mukutani, Sinende, Kabuswo
Cattle
Heart water Saimo soi ,Kolloa Shoats 131 shoats MANGE Saimo soi Shoats 37 shoats Worms County wise All livestock
Red water Tirioko, Akoret cattle
New Castle Disease Mukutani Chicken
Fig.11 2.1.4 Milk Production
Average milk production per household decreased to 1.5 litres in February compared to 1.7 litres in January.
The decreased milk production is attributed to lack of adequate pasture and water.

8
Fig. 12
2.2 .0 Rain fed Crop Production 2.2.1 Stage and Condition of food Crops
Most farmers are preparing the lands with anticipation of long rains onset early next month. The maize crop in all the wards had been harvested. The land under irrigated crops especially in Perkerra has significantly reduced due to declining water levels in the river.
MARKET PERFORMANCE 3.0 LIVESTOCK MARKETING 3.1.1 Cattle Prices
Fig.13
The average prices of cattle dropped to Ksh.9,265 in February compared to January’s (Ksh 11,470. This is attributed to deteriorating forage quality and deteriorating animal’s body condition. The prices were below the long-term mean of Ksh.12, 133.
9
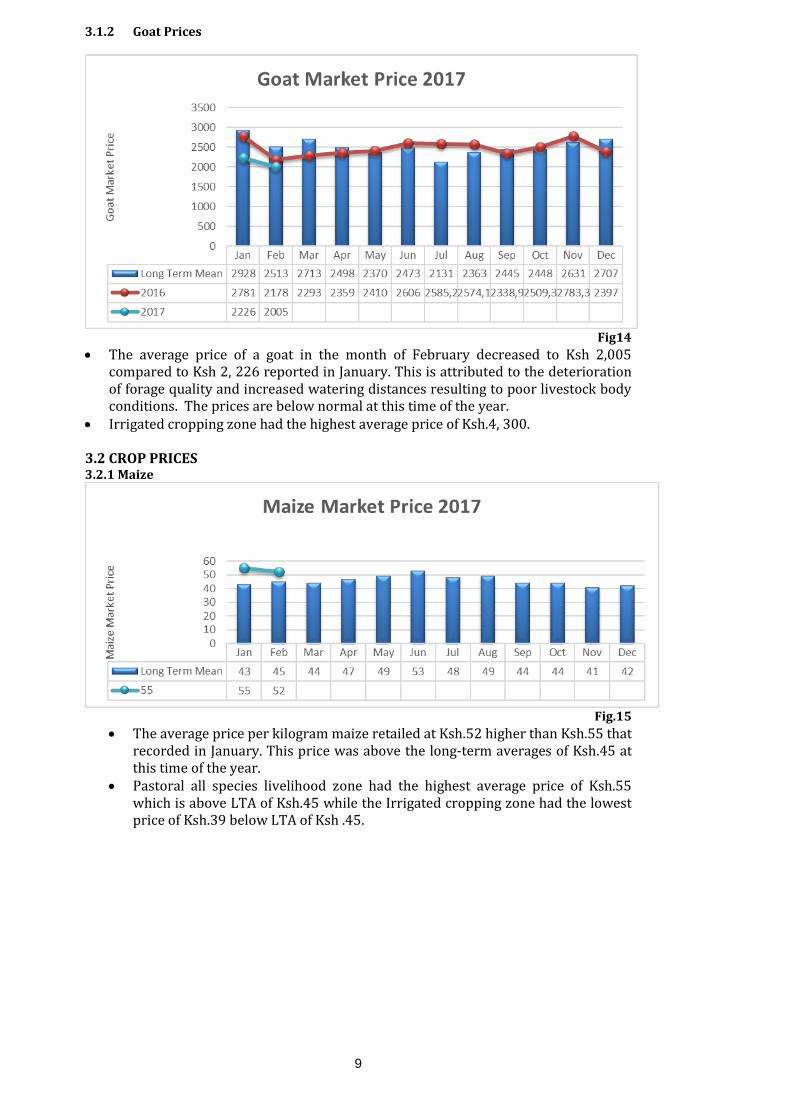
3.1.2 Goat Prices
Fig14
The average price of a goat in the month of February decreased to Ksh 2,005 compared to Ksh 2, 226 reported in January. This is attributed to the deterioration of forage quality and increased watering distances resulting to poor livestock body conditions. The prices are below normal at this time of the year.
Irrigated cropping zone had the highest average price of Ksh.4, 300. 3.2 CROP PRICES 3.2.1 Maize
Fig.15
The average price per kilogram maize retailed at Ksh.52 higher than Ksh.55 that recorded in January. This price was above the long-term averages of Ksh.45 at this time of the year.
Pastoral all species livelihood zone had the highest average price of Ksh.55 which is above LTA of Ksh.45 while the Irrigated cropping zone had the lowest price of Ksh.39 below LTA of Ksh .45.

10
3.2.2 Posho Prices
Fig.16
The average Posho price per kilogram was Ksh.58. in February, which was above the Long-term average of Ksh.52 at this time of the year. This is attributed to market dynamics at play in the local markets.
3.2.3 Beans Prices
Fig.17
The average price per kilogram of beans increased to Ksh. 112 in February as compared to Ksh.108 in January. This is attributed to Market dynamics in the local markets and households respectively.
Beans prices were highest in the agro pastoral livelihood zone (Ksh 116) and lowest in the irrigated livelihood zone (Ksh 78) this is attributed to unstable availability of the commodity in the local markets.
3.2.4 Livestock Price Ratio/Terms of Trade
Fig. 18

11
Average Terms of trade are currently at 43-kilogram cereal per goat sold. Compared to 40 kilogram per goat sold in the month of January, the terms of trade have improved. This is attributed to availability of relief food at community level and the ongoing interventions like the livestock off take.
The least ratio was recorded in the fishing livelihood zone at 48 while the pastoral livelihood zone recorded the highest ratio at 51. The Terms of Trade were below the long-term average of 61, indicating declining purchasing power to the pastoralists.
4.0. FOOD CONSUMPTION AND NUTRITION STATUS
4.1.1 Milk Consumption
On average the milk consumed per household decreased from 1.5 litres in the
month of January to 1.4 litres in February. This is attributed to poor milk
production and increased livestock movements. In comparison with a normal
year of 1.5 litres the current milk consumption rate per household is below
normal at this time of the year.
Jan Feb Mar Apr May Jun Jul Aug Sep Oct Nov Dec
Long Term Mean 1,5 1,4 1,4 1,4 1,5 1,6 1,7 1,7 1,7 1,6 1,7 1,7
2017 1,5 1,4
0,00,20,40,60,81,01,21,41,61,8
Milk Consumption(litre) 2017Amount
Fig 19
4.1.2 Food Consumption Score
Fig.20

12
The most prevalent county food consumption score for the month was
acceptable and borderline. Pastoral livelihood and Agro-Pastoral zone reported
some poor FCS.
Pastoral and Agro pastoral livelihood was the most food insecure due to poor
crop harvests and ongoing drought.
4.1.3 Current average nutritional status vs average nutritional status (2012-2014) MUAC % <135mm
Fig. 21 The percentage of children at risk of malnutrition in the County within the
month of February was 19% which is an increase compared to the LTA of 18%.
The nutritional status for children under the age of 5 years has worsened. 4.2 Coping Strategy 4.2.1 Coping Strategy Index
Fig.22
The pastoral livelihood zone employed most coping strategies at 23, followed by Agro-Pastoral and fishing livelihood zone at index 14.1. The irrigated zones employed least coping mechanisms at 4. 7 within the month of February.
On-Going Interventions 4.3.0 Non-food interventions
De-silting of water pans and provision of filters by GoK. Loyeya cattle dip construction ongoing Kipnai and Cheptaran dispensary, Chemakutan cattle dip and Cheptalamach
water pan are being constructed by County government. Water Trucking.(MOW)
Disease control (vaccinations against FMD and PPR (MOALF,BCG,RPLRP)

13
Kipsaraman –Sibilo road is being upgraded by county government JICA sunk Kipchemoi and Chesekem boreholes Baringo North CDF issued water tanks to Rormoch and Kosile primary schools Chemoe cattle dip is now operational Infrastructure development , WS – pipeline extension, Water Pans and General
Rehabilitations Repair & maintenance of boreholes(MOW) CFA projects ongoing in Kolloa, Tangulbei, Churo, Loiwat, Ngoron, Endao and
Ilchamus by WFP and REDCROSS. Livestock Feeds distribution by County Government and NDMA. Livestock offtake by MOALF (County), NDMA, GoK. Vitamin A Supplementation, Mass screening, Beyond zero, Zinc
Supplementation, Management of Acute Malnutrition (IMAM), IYCN Interventions (EBF and Timely Intro of complementary Foods), SMART Survey
Deworming by MOH and World Vision. Cash for work program by NYS.
4.4.0 Food intervention
Food aid was distributed to Tiaty, Baringo north, Baringo South and Mogotio comprising of bags of Maize, bags of beans , bags of rice and cartons each comprising of (500 millilitres *24 pieces) of cooking oil for the month of January-February. By GoK, County Government and Red Cross.
Slaughter destocking by NDMA-DCF and GoK
5.0.0 Emerging Issues 5.1.1 Insecurity/Conflict/Human Displacement
There were insecurity incidences reported in Marigat, Kiserian, Arabal, Chebinyiny and Chemorongion area in Baringo South where two politicians,
one teacher and woman were shot dead and hundreds of cattle and goats
were stolen. In Yatya, Ngaratuko, Chemoe and Loruk; bodaboda man, chief,
mother and baby were shot dead by bandits during raids.
5,882 children and 10,195 adults have been displaced from these affected
areas(Baringo South and Baringo North) Nyimbei, Kirim, Sosionde,
Chebinyiny, Chemorongion, Kasiela, Arabal, Kapindasum, Sambaka, Sinoni, Kabel, Lamaiwe, Salabani- Kokwo, Kaporion, Karimo, Chepkwel, Moinonin,
Akoreyan, Sibilo, Rondinin, Yatia, Ngenyin, Loruk and Kipsaraman.
Government security officers have been deployed to the conflict area to
flash out and restore peace. The tension is still high in those areas.
5.1.2 Human Wildlife Conflict The table below shows results of human/wildlife conflicts where livestock killed is highlighted.
Wild Animal Areas Reported Livestock
1. Baboons Ribko, Akoret 39 goats
2. Lynx Ribko 10 goats
3 Hyena Ribko 31-shoats
Fig.23 5.1.3 Migration - limited to migrations of persons. Over 1000 residents have moved from Arabal, Nasoguro, Mukutani and Kiserian have moved to Mochongoi and Marigat, From Yatya, Chemoe, Naatan Ngaratuko have moved to Moinonin, Rondinin and Kipsaraman due conflicts for pastoral resources and cattle rustling.

14
Food Security Prognosis
The County food security situation remains unstable and is likely to deteriorate due to poor performance of OND rains.
The drought situation worsened due to the prolonged dry spell across all wards. Water access and availability has continued to diminish and will likely worsen given the current prevailing conditions in the County especially in pastoral areas. The existing water sources never recharged fully and current water sources are at 15-30% volume of normal capacity. The ongoing Livestock movements from Orus, Pakka and Loyamarok have moved towards Rugus and Arabal grazing zones and Ribko and Kolloa wards to Kulol, Kadungoi, Kasarani and Turkana borders grazing convergence zones will avail the much need pasture and water to the animals but has triggered conflicts among the different pastoral groups. The pasture condition remains poor across pastoral and agro pastoral zones; browse condition is poor in all livelihood zones, the trend is likely to worsen in the coming months due to poor performance of OND rains.
6.0 SECTOR RECOMMENDATIONS 6.1.1 General Recommendations: i) County security teams need to upscale surveillance, peace building and patrols
in all dry season grazing zones especially in Nasoguro Rugus, Mukutani Kiserian
and Arabal where flare ups have arisen recently and along Kerio- Kolloa region.
The drought situation calls for close monitoring to ensure timely and effective
response.
ii) Upscale of drought response activities by all actors is needed.
6.1.2 Water Sector
a) The water pans facilities which require desilting include; -Kwarkawarian and Nawe in Yatya -Chewuwai pan dam in Akoret.
b) The following critical boreholes are not operational due to management challenges. -Barsuswo, Natan, and Kapkoi in Yatya -Kapau borehole in Akoret. -Loyeya borehole in Komolion -Chemolingot town borehole
c) Napetot, Karun and Cherelio boreholes in Kolloa are broken down and require repairs.
d) Kapedo Solar powered borehole was vandalized during conflict – requires reinstallation.
e) Chewarany, Orusion, Apakizo, Kakonykony and Katuben springs in Maron are silted. These being main water sources in Maron, desiltation intervention will ensure access to adequate clean water.
f) Provision of PVC tanks of10,000lts capacity to learning Institutions and Health Centres.
g) Provide fuel/diesel subsidy to community. h) Water trucking and Water treatment chemicals in areas with acute water
shortages. i) Design and Construction of Multi-purpose dams
6.1.3 Nutrition and Health Sector a) Komolion sentinel site have constantly recorded high level of malnutrition over
the years. From the surveys conducted, the situation is mainly caused by
rampant negligence of young children by parents who engage in alcoholism and
hygiene related challenges. The county administration, public health and
nutrition sector is called upon to come in and address this perennial menace.

15
b) The Health/Nutritional sector-working group to establish criteria for
geographical and beneficiary targeting and integrate to the four established
food and nutritional programs (facility based SFP, School Meals Programme,
FFA, and GFD by Presidency) targeting sentinel sites with high MUAC levels.
c) There is a request from the Nutrition sector to have MUAC/ Nutrition monthly
monitoring done in Mulok, Mugurin and Kisanana in Mogotio Sub-county and
Esageri and Bondeni in Koibatek. These can be taken up as part of the NDMA
Monthly monitoring and supported by partners / Stakeholders in the county.
The NDMA is willing to provide technical support if other costs implications are
met by sector/stakeholder.
d) Intensify Mass screening and referrals in 150 Health facilities in the Count all the 6 sub-counties.
e) Provision of food supplements in 150 facilities in the County
f) Enhance Integrated outreach services in 45 hot spots and hard to reach sites in
6 sub counties
6.1.4 Education Sector a) The following schools in East Pokot need support; Kongor, Chesawach,
Nyakwala and Napur School needs ECD teacher, Kamurio primary school needs a staffroom.
b) Loyeya, FCCK Tukolkol, Nyakwala primary schools needs a classroom, pupil’s study under trees.
c) Nginyang girls and Kolloa high school requires roof water catchment and storage tanks.
d) Regular feeding programme to all schools. e) Provision of improved seeds to the community, improving of food
storage techniques’ in schools and community. f) Mogotio be included in the HGSFP. g) Boarding facilities in primary schools to enhance retention in insecure
areas. h) Purchase of: -bee hives-goats-camels-cows and food stuffs (maize, beans)
for schools in Tiaty.
6.1.5 Livestock Sector a) CCPP cases were reported across all the sentinel sites therefore it is important
for the sector to take necessary action to control the spread of the disease. b) Disease control (vaccinations against FMD,CCPP,NCD,LSD) c) Beehives distribution. d) Pasture seed distribution. e) Distribution of hay and food supplements to the affected livestock. f) Water tracking to ease conflict between livestock, domestic and schools. g) Commercial offtake for 2,000 cattle.
6.1.6 Agriculture Sector a) Provision of relief inputs (seeds and Fertilizers) to farmers (Maize, Beans,
Cowpeas and Finger Millet) b) Subsidized Land preparation for affected households in 18 wards, Expansion of
irrigation, fencing of irrigation scheme. c) Mapping out of areas for construction of water dams for irrigation. d) Fruit Trees Establishment, Soil conservation and water harvesting, Drip kits,
Affruitation in Mogotio. e) Purchase of shade nets in dry areas instead of greenhouses.
REFERENCE TABLES Table 1: Drought Phase Classification Normal Alert Alarm Emergency All environmental Meteorological Environmental and All Environmental,

16
Agricultural and pastoral indicators are within the seasonal ranges
drought indicators move outside seasonal ranges
at least two production indicators are outside Long term seasonal ranges
Metrological and Production indicators are outside normal ranges.
Recovery: The drought phase must have reached at least Alarm stage. Recovery starts after the end of drought as signalled by the environmental indicators returning to seasonal norms; local economies starting to recover
Table 2: Standardized Precipitation Index (SPI) Color SPI Values Metrological Drought Category > +1.5or more Wet Conditions 0 to +1.5 No drought -0.1 to -0.99 Mild drought -1 to -1.99 Severe drought <-2 and less Extreme drought
Table 3: Vegetation Condition Index Values (VCI) Color VCI values Agricultural Drought Category
3-monthly average ≥50 Wet 35 to 50 No agricultural drought 21 to 34 Moderate agricultural drought 10 to 20 Severe agricultural drought <10 Extreme agricultural drought
Table 4: Livestock Body Condition Level Classification Characteristics (this describes majority of the herd and not individual isolated Stock) 1
Normal
Very Fat Tail buried and in fat
Fat, Blocky. Bone over back not visible
Very Good Smooth with fat over back and tail head Good smooth appearance
2 Moderate Moderate. Neither fat nor thin
3 Stressed Borderline fore-ribs not visible. 12th & 13th ribs visible
4 Critical Thin fore ribs visible
5 Emaciated Very thin no fat, bones visible
Emaciated, little muscle left
Definition of Early Warning Phases The EW phases are defined as follow:
NORMAL: The normal phase occurs when biophysical drought indicators (VCI and SPI) show no unusual fluctuations hence remain within the expected ranges for the time of the year in a given livelihood zone, division or county ALERT: The alert phase is when either the vegetation condition index or the standard precipitation index (biophysical indicators) show unusual fluctuations below expected seasonal ranges within the whole county/sub-county or livelihood zones.
ALARM: The alarm phase occurs when both biophysical and at least three production indicators fluctuate outside expected seasonal ranges affecting the local economy. The production indicators to be considered are livestock body condition, crop condition, milk production, and livestock migration and livestock mortality rate. If access indicators (impact on market, access to food and water) move outside the normal range, the status remains at “alarm” but with a worsening trend. Proposed access indicators include ToT, price of cereals, availability of cereals and legumes, and milk consumption. The trend will be further worsening when also welfare indicators (MUAC and CSI) start moving outside the normal ranges.
EMERGENCY: In the emergency phase, all indicators are outside of normal ranges; local production systems have collapsed within the dominant economy. The emergency phase affects asset status and purchasing power to extent that seriously threatens food security. As a result, coping strategy index, malnutrition (MUAC) and livestock mortality rates move above emergency thresholds
RECOVERY: Environmental indicators returning to seasonal norms. The drought phase must have reached at least Alarm stage. Recovery starts after the end of drought as signalled by the environmental indicators returning to seasonal norms while production indicators are still outside the normal seasonal range but local economies start to recover. The status changes to normal once the bio physical and production indicators are back to normal range.