national cooperative highway research program...
TRANSCRIPT

149
NATIONAL COOPERATIVE HIGHWAY RESEARCH PROGRAM 1 49 REPORT
BRIDGE RAIL DESIGN FACTORS, TRENDS, AND GUIDELINES
TRANSPORTATION RESEARCH BOARD NATIONAL RESEARCH COUNCIL

TRANSPORTATION RESEARCH BOARD 1974
Officers
JAY W. BROWN, Chairman MILTON PrKARSKY, First Vice Chairman W. N. CAREY, JR., Executive Director
Executive Committee
HENRIK B. STAFSETH, Executive Director, American Assn. of State Highway and Transportation Officials (ex officio) NORBERT T. TIEMANN, Federal Highway Administrator, U.S. Department of Transportation (ex officio) FRANK C. HERRINGER, Urban Mass Transportation Administrator, U.S. Department of Transportation (ex officio) ERNST WEBER, Chairman, Division of Engineering, National Research Council (ex officio) ALAN M. VOORHEES, President, Alan M. Voorhees and Associates (ex officio, Past Chairman 1972) WILLIAM L. GARRISON, Director, Inst. of Transp. and Traffic Eng., University of California (ex officio, Past Chairman 1973) JAY W. BROWN, Director of Road Operations, Florida Department of Transportation DOUGLAS B. FUGATE, Commissioner, Virginia Department of Highways ROGER H. GILMAN, Director of Planning and Development, The Port Authority of New York and New Jersey NEIL V. HAKALA, President, Exxon Research and Engineering Company ALFRED HEDEFINE, Senior Vice President, Parsons, Brinckerhoff, Quade and Douglas ROBERT N. HUNTER, Chief Engineer, Missouri State Highway Commission GEORGE KRAMBLES, General Operations Manager, Chicago Transit Authority
SCHEFFER LANG, Assistant to the President, Association of American Railroads BENJAMIN LAX, Director, Francis Bitter National Magnet Laboratory, Massachusetts institute of Technology HAROLD L. MICHAEL, School of Civil Engineering, Purdue University D. GRANT MICKLE, President, Highway Users Federation for Safety and Mobility JAMES A. MOE, Executive Engineer, Hydro and Community Facilities Division; Bechtel, inc. ELLIOTT W. MONTROLL, Professor of Physics, University of Rochester MILTON PIKARSKY, Chairman, Chicago Transit Authority J. PHILLIP RICHLEY, Director of Transportation, Ohio Department of Transportation RAYMOND T. SCHULER, Commissioner, New York State Department of Transportation
R. STOKES, Executive Director, American Public Transit Association ROBERT N. YOUNG, Executive Director, Regional Planning Council, Baltimore, Maryland
NATIONAL COOPERATIVE HIGHWAY RESEARCH PROGRAM
Advisory Committee
JAY W. BROWN, Florida Department of Transportation (Chairman) MILTON PIKARSKY, Chicago Transit Authority HENRIK E. STAFSETH, American Association of State Highway and Transportation Officials NORBERT T. TIEMANN, U.S. Department of Transportation ERNST WEBER, National Research Council ALAN M. VOORHEES, Alan M. Voorhees and Associates WILLIAM L. GARRISON, University of California W. N. CAREY, JR., Transportation Research Board
General Field of Design Area of Traffic Barrier Systems Advisory Panel C22-1 (Superseding Panels C15- 1(2) and C 12-8 combined)
W. A. GOODWIN, University of Tennessee (Chairman) J. L. BEATON, California Division of Highways J. N. CLARY, Virginia Department of Highways H. T. DAVIDSON, Connecticut Department of Transportation W. B. DRAKE, Kentucky Department of Highways A. L. ELLIOTT, California Division of Highways M. D. GRAHAM, New York State Department of Transportation D. L. HAWKINS, Texas Highway Department T. R. HIGGINS, American Institute of Steel Construction
Program Staff
C. L. HULSBOS, University of New Mexico E. M. LAURSEN, University of Arizona D. W. LOUTZENHEISER, Federal Highway Administration P. C. SKEELS, General Motors Proving Ground F. W. THORSTENSON, Minnesota Department of Highways
M. WEST, Bethlehem Steel Corporation G. VINER, Federal Highway Administration
W. J. WILKES, Federal Highway Administration L. F. SPAINE, Transportation Research Board
K. W. HENDERSON, JR., Program Director LOUIS M. MACGREGOR, Administrative Engineer HARRY A. SMITH, Projects Engineer JOHN E. BURKE, Projects Engineer DAVID K. WITHEFORD, Projects Engineer R. IAN KINGHAM, Projects Engineer HERBERT P. ORLAND, Editor ROBERT J. REILLY, Projects Engineer PATRICIA A. PETERS, Associate Editor

NATIONAL COOPERATIVE HIGHWAY RESEARCH PROGRAM REPORT 149
BRIDGE RAIL DESIGN FACTORS, TRENDS, AND GUIDELINES
ROBERT M. OLSON, DON L. IVEY, EDWARD R. POST
RICHARD H. GUNDERSON, AND AYHAN CETINER
TEXAS TRANSPORTATION INSTITUTE
TEXAS A&M RESEARCH FOUNDATION
COLLEGE STATION, TEXAS
RESEARCH SPONSORED BY THE AMERICAN ASSOCIATION OF STATE HIGHWAY AND TRANSPORTATION OFFICIALS IN COOPERATION WITH THE FEDERAL HIGHWAY ADMINISTRATION
AREAS OF INTEREST:
HIGHWAY DESIGN
BRIDGE DESIGN
HIGHWAY SAFETY
TRANSPORTATION RESEARCH BOARD NATIONAL RESEARCH COUNCIL
WASHINGTON, D.C. 1974

NATIONAL COOPERATIVE HIGHWAY RESEARCH PROGRAM
Systematic, well-designed research provides the most ef-fective approach to the solution of many problems facing highway administrators and engineers. Often, highway problems are of local interest and can best be studied by highway departments individually or in cooperation with their state universities and others. However, the accelerat-ing growth of highway transportation develops increasingly complex problems of wide interest to highway authorities. These problems are best studied through a coordinated program of cooperative research.
In recognition of these needs, the highway administrators of the American Association of State Highway and Trans-portation Officials initiated in 1962 an objective national highway research program employing modern scientific techniques. This program is supported on a continuing basis by funds from participating member states of the Association and it receives the full cooperation and support of the Federal Highway Administration, United States Department of Transportation.
The Transportation Research Board of the National Re-search Council was requested by the Association to admin-ister the research program because of the Board's recog-nized objectivity and understanding of modern research practices. The Board is uniquely suited for this purpose as: it maintains an extensive committee structure from which authorities on any highway transportation subject may be drawn; it possesses avenues of communications and cooperation with federal, state, and local governmental agencies, universities, and industry; its relationship to its parent organization, the National Academy of Sciences, a private, nonprofit institution, is an insurance of objectivity; it maintains a full-time research correlation staff of special-ists in highway transportation matters to bring the findings of research directly to those who are in a position to use them
The program is developed on the basis of research needs identified by chief administrators of the highway and trans-portation departments and by committees of AASHTO. Each year, specific areas of research needs to be included in the program are proposed to the Academy and the Board by the American Association of State Highway and Trans-portation Officials. Research projects to fulfill these needs are defined by the Board, and qualified research agencies are selected from those that have submitted proposals. Ad-ministration and surveillance of research contracts are responsibilities of the Academy and its Transportation Re-search Board.
The needs for highway research are many, and the National Cooperative Highway Research Program can make significant contributions to the solution of highway transportation problems of mutual concern to many re-sponsible groups. The program, however, is intended to complement rather than to substitute for or duplicate other highway research programs.
NCHRP Report 149
Project 12-8, FY '66 ISBN 0-309-02209-6 L. C. Catalog Card No. 74-6937
Price $4.00
Notice
The project that is the subject of this report was a part of the National Cooperative Highway Research Program conducted by the Transportation Research Board with the approval of the Governing Board of the National Research Council, acting in behalf of the National Academy of Sciences. Such approval reflects the Governing Board's judgment that the program concerned is of national impor-tance and appropriate with respect to both the purposes and re-sources of the National Research Council. The members of the advisory committee selected to monitor this project and to review this report were chosen for recognized scholarly competence and with due consideration for the balance of disciplines appropriate to the project. The opinions and con-clusions expressed or implied are those of the research agency that performed the research, and, while they have been accepted as appropriate by the advisory committee, they are not necessarily those of the Transportation Research Board, the National Research Coun-cil, the National Academy of Sciences, or the program sponsors. Each report is reviewed and processed according to procedures established and monitored by the Report Review Committee of the National Academy of Sciences. Distribution of the report is ap-proved by the President of the Academy upon satisfactory comple-tion of the review process. The National Research Council is the principal operating agency of the National Academy of Sciences and the National Academy of Engineering, serving government and other organizations. The Transportation Research Board evolved from the 54-year-old High-way Research Board. The TRE incorporates all former HRB activities but also performs additional functions under a broader scope involving all modes of transportation and the interactions of transportation with society.
Published reports of the
NATIONAL COOPERATIVE HIGHWAY RESEARCH PROGRAM
are available from:
Transportation Research Board National Academy of Sciences 2101 Constitution Avenue, N.W. Washington, D.C. 20418
(See last pages for list of published titles and prices)
Printed in the United States of America.

FOREWORD This report is recommended to bridge engineers, safety engineers, and others con- cerned with effective traffic barriers for use on and near bridges. It contains a
By Stafi discussion of current bridge rail design procedures and nomographs that will aid
Transportation designers. In addition, information presented on vehicle characteristics and human
Research Board tolerance in coffisions should be of interest to researchers.
Highway bridge railing system designs have evolved through need and experi-ence, but often have been based on questionable design information. In recent years, additional information has been provided by the many full-scale crash tests on bridge railings. Consequently, there has existed a need for assembly and cor-relation of the information generally accepted as valid for the purpose of outlining bridge railing service requirements. It is of prime importance to delineate the functions that railings are expected to satisfy for various site conditions, with due consideration being given to safety, economy, and appearance. Following the ahievement of a valid definition of service requirements, existing and new research data can be used to formulate comprehensive design criteria that will include various configurations and materials.
This report presents the results of the second phase of NCHRP Project 12-8, conducted at the Texas Transportation Institute. Phase I was a 12-month pilot study intended to ascertain the state of the art and to identify gaps in the knowledge concerning bridge rails. NCHRP Report 86 presented the results of Phase I, which included: a definition of service requirements for bridge rail systems; the develop-ment of a simple mathematical model to predict the behavior of a vehicle-guardrail collision; a relationship between vehicle deceleration rate and occupant safety; the formulation of structural design criteria; and a technique for determining design loadings for bridge rails.
Phase II, which lasted 18 months, was intended to build on the findings of the pilot study by seeking quantitative values for the bridge rail service requirements presented in NCHRP Report 86.
The researchers collected and analyzed information concerning accidents, vehicle characteristics, barrier configurations and heights, and the effects of curbs and Sidewalks in an attempt to develop design criteria. However, owing to the many varied bridge rail system geometries and the many possible vehicle configura-tions, they were unable to generalize design conditiOns. The report presents the information collected as a basis for others to use in future development of design criteria. A discussion of the tolerable rates of deceleration is also included. The investigators make recommendations for modifications in the test conditions used for evaluating the safety performance characteristics of bridge rails. They also pre-sent a technique for interpreting deceleration levels to arrive at an estimate of the adequacy of barriers from the safety standpoint.
The report outlines, the current barrier design process and examines strength and height requirements. It also updates two of the bridge rail service requirements

presented in NCHRP Report 86. The investigators found that the relevant pro-visions of the AASHO Standard Specifications for Highway Bridges are generally adequate with respect to retaining a vehicle and preventing vaulting, but the speci-fications offer the designer no guidance concerning the deceleration or redirection suffered by an errant vehicle. At present, neither analytical methods nor laboratory tests can adequately predict bridge rail performance under selected impact condi-tions. Therefore, full-scale crash tests and accident statistics are needed to assess the safety performance of a bridge rail design.

CONTENTS
1 SUMMARY
PART I
2 CHAPTER ONE Introduction and Research Approach
2 CHAPTER TVO Findings Accident Information Vehicle Characteristics Height of Barriers Curbs and Sidewalks
17 CHAPTER THREE Probability of Injury Tolerable Accelerations A Method for Relating Deceleration to Probability of Injury Appropriate Test Conditions
26 CHAPTER FOUR Interpretation and Appraisal Bridge Rail Service Requirements Discussion of Current Design Procedures Full-Scale Prototype Testing
30 REFERENCES
PART II
32 APPENDIX A Chronological Bibliography
38 APPENDIX B Design Nomographs
43 APPENDIX C Method for Reducing, Analyzing, and Evaluating Data from High-Speed Film
48 APPENDIX D Comparison of Predicted and Observed Average Unit Decelerative Forces Perpendicular to Barriers

ACKNOWLEDGMENTS
The research reported herein was conducted at the Texas Trans-portation Institute by the Structural Research Division. Robert M. Olson, Research Engineer, served as principal investigator; Don L. Ivey, Research Engineer, and Edward R. Post, Assist-ant Research Engineer, served as co-principal investigators. Richard H. Gunderson, Assistant Research Engineer (now a consultant with Engineering Analysts, Inc., of Houston, Tex.), and Ayhan Cetiner, Assistant Research Engineer, contributed to the research effort. C. J. Keese, Director, and T. J. Hirsch, Head of the Structural Research Division, served as technical and administrative advisors.
Many engineers in state highway departments and in the Federal Highway Administration gave assistance and coopera-tion to the researchers, and their efforts are greatly appreciated. Particular recognition is due Messrs. A. C. Estep, California Division of Highways; W. A. Frick, Illinois Division of High-ways; and E. M. Smith, Texas Highway Department.

BRIDGE RAIL DESIGN
FACTORS, TRENDS, AND GUIDELINES
SUMMARY Reports of accidents in which vehicles collided with barriers on and near bridges were examined, and factors causing the accidents were studied. From 1967 to 1969, California and Texas experienced a notable decrease—from 52 to 13 percent and 57 to 25 percent, respectively—in the proportion of single-vehicle accidents occur-ring at the ends of bridge rails or parapets. This probably reflects the emphasis placed on smooth transitions and safer rail terminations. The typical bridge rail accident involved an intermediate or standard sedan (84.3 percent of fatal acci-dents involve passenger vehicles) traveling 63 mph on a tangent section after dark. Of the fatal accidents with bridge rails, 4.3 percent involved truck-trailer combina-tion vehicles. In Texas, 22 percent occurred when some form of water was on the pavement. This percentage is rather high considering that pavements are in a wet condition only approximately 6 percent of the time.
Automobile and truck weight and dimension records were gathered and trends were noted concerning the current vehicle population. The median weight of a loaded automobile has increased from 3,450 lb in the late 1930's to 3,950 lb in the late 1960's; the range of weight for the middle 95 percent of the population has expanded from 1,100 lb (from 3,200 to 4,300 lb) to 3,000 lb (from 2,000 to 5,000 lb). This poses a severe problem to the designer in that he must design a barrier strong enough to withstand impacts by heavier vehicles and, at the same time, not too formidable for impacts by smaller vehicles. Relationships between vehicle length, width, center of gravity position, and weight are given for use by the designer.
Contemporary practice and recent revisions in barrier height requirements are discussed, as is the use of curbs and sidewalks on bridges. Barrier heights have gradually increased, and the current trend is toward a height in excess of 27 in. In general, curbs are not considered to be of value in redirecting vehicles and may aggravate the severity of a collision by having disabled the steering mechanism or produced a ramping condition on impact.
Probability of injury and tolerability to decelerative forces are examined in light of current technology. A basis for comparing. the safety aspects of barriers, which includes the effect of both longitudinal and transverse vehicle accelerations, is developed. Current bridge rail designs are compared on this basis. Studies indi-cate that the commonly used crash test parameters-25°, 60 mph, and 4,000 lb—may be too severe for an appropriate safety evaluation. Test conditions of 15°, 70 mph, and 4,000 lb are recommended.
Current requirements for conducting full-scale crash tests and methods for acquiring, analyzing, and evaluating data were studied. Recommendations for. revising these procedures are contained in this report.
Full-scale crash testing of barriers designed in accordance with methods sug-gested in this report is a necessary requirement for evaluating the safety aspects of barriers proposed in the future. Such testing will be required until comprehensive criteria have been formulated.

2
CHAPTER ONE
INTRODUCTION AND RESEARCH APPROACH
The study reported herein is a continuation of the research project reported in NCHRP Report 86, "Tentative Service Requirements for Bridge Rail Systems" (1). The objectives of this continuation study were (1) to extend, and if pos-sible to quantify, the tentative requirements in order to produce design criteria; (2) to seek estimates of human tolerance to forces induced in collisions with barrier sys-tems on and abutting bridges; and (3) to re-examine the validity of the impact forces predicted by the mathemati-cal model presented in NCHRP Report 86 in light of data obtained from full-scale crash tests conducted after 1970.
Information concerning development of barrier systems was obtained from technical publications, reports of full-scale crash tests, and highway departments. This informa-tion was examined and appraised from the viewpoints of the project objectives.
The research approach consisted of (1) obtaining infor-
mation concerning collisions with bridge barrier systems; (2) examining the vehicle population (automobiles, trucks, and buses); (3) reviewing current technology concerning barrier design and human tolerance in collisions; and (4) attempting to coalesce these elements into meaningful cri-teria that couldproduce safer traffic barriers.
The chapters that follow contain findings of the study, a discussion of probability of injury in collisions, and an interpretation and appraisal of the work. In addition to cited references, Appendix A lists a chronological bibli-ography of literature pertaining to the subject of this re-port. Appendices B, C, and D, respectively, further discuss design nomographs; the method for reducing, analyzing, and evaluating data from high-speed film; and the com-parison of predicted and observed average unit decelera-tive forces perpendicular to barriers.
CHAPTER TWO
FINDINGS
ACCIDENT INFORMATION
Police investigation reports of 5,881 fatal accidents that oc-curred in 1968 and 1969 on sections of the Interstate High-way System have been analyzed by Hosea (2). Nearly two-thirds (3,898) of the total involved only one vehicle, and about one-half (3,078) the total were the result of the vehicles leaving the road. Approximately four-fifths of the vehicles that ran off the road subsequently struck a fixed object. Thus, 2,518 (43 percent) of the total number of fatal accidents occurred when vehicles left the road and struck fixed objects. The objects struck are listed in Table 1. Hosea noted: "When first impacts were guardrails, bridge or overpass elements were the second objects most fre-quently struck." This tabulation does not include bridge rails as a line item; however, guardrails, curbs, and di-viders are structures that are often present on and near bridges and that account for half (1,062) of the 2,518 fatal accidents with fixed objects. In addition to these accidents, bridge and overpass elements were involved in 460 of the other collisions that resulted in fatal accidents. Figure 1 groups fatal accidents according to objects struck.
Detailed information concerning single-vehicle fatal ac-
cidents on elevated sections and bridges was furnished by the California Division of Highways (3), the Illinois Di-vision of Highways (4), and the Texas Highway Depart-ment (5). The data furnished by these agencies were care-fully examined and the results are presented in Tables 2 through 6. It must be emphasized that statistical signifi-cance has not been placed on these findings.
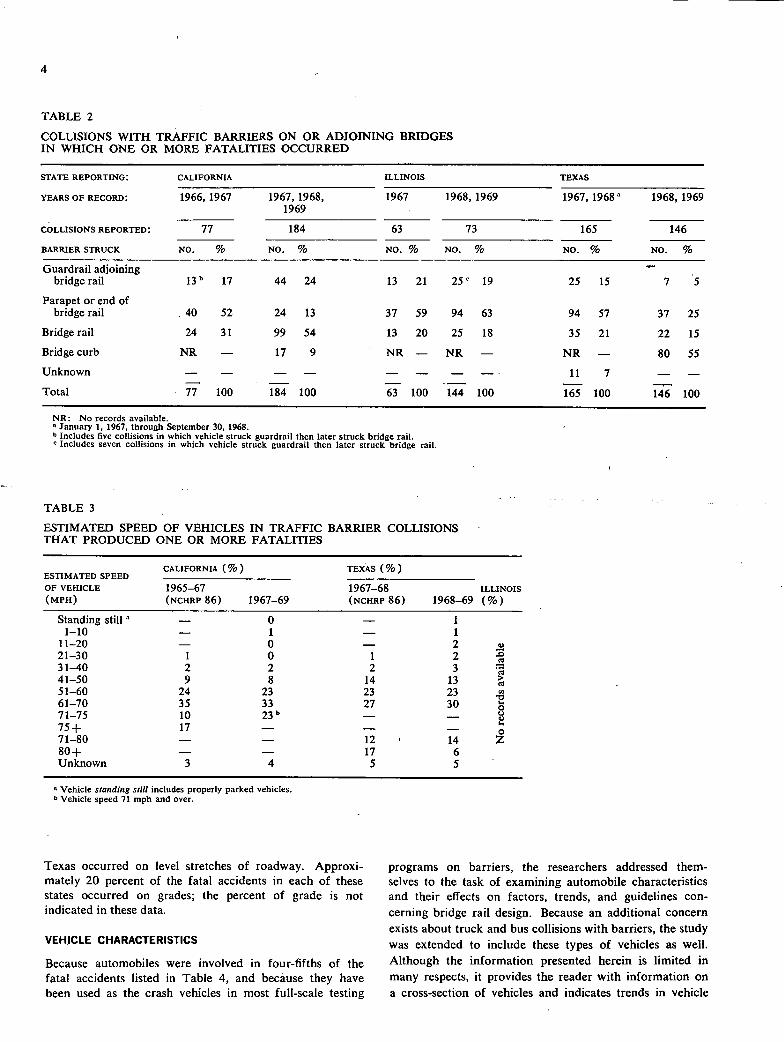
A comparison of single-vehicle fatal accidents reported in NCHRP Report 86 (1, p. 8) and more recent informa-tion is given in Table 2. Each of the collisions resulted in one or more fatalities. It is noted that 165 fatal acci-dents occurred in Texas during 1967-68, resulting in 204 fatalities (NCHRP Report 86 erroneously reported 204 fatal accidents). This is an average of 1.24 fatalities per fatal accident. A trend that may be significant is indicated by the data from California and Texas. The percentage of fatal accidents occurring at the end of a bridge rail or a parapet decreased from 52 to 13. percent for California and from 57 to 25 percent for Texas from the first reporting period to the most recent reporting period. This possibly reflects the emphasis that has been placed on the smooth, structurally sound transition between guardrails on bridge

approaches and the bridge rail. This trend is not shown in the Illinois data where the percentage increased from 59 to 63 percent.
A comparison of estimated speeds of vehicles in colli-sions with traffic barriers is given in Table 3. The data from California and Texas indicate that nearly 80 percent of the fatal accidents occurred at speeds in excess of 50 mph. These data are presented in graphical form in Fig-ure 2, which was produced by summing the percentages of accidents in each speed range for all four tabulated col-umns. This includes two periods for Texas and two pe-riods for California. The frequency distribution in the lower portion shows a preponderance of speeds estimated in the range of speeds dictated by speed limits (i.e., 50 to 70 mph). It would be interesting to compare this frequency distribution with the actual distribution of speed of the population of vehicles on these roads. The distribution of fatal accident speeds may not differ significantly from the population speed distribution. However, it should also be observed that these are "estimated" speeds, which may be subject to considerable error. The median estimated speed shown by the cumulative percentage in the upper half of Figure 2 is 63 mph.
Table 4 gives some rather incomplete information con-cerning the distribution of the types of vehicles involved in single-vehicle fatal accidents. In order to better describe the data, Figures 3 and 4 present cumulative frequency dis-tribution graphs. Figure 3 presents the cumulative data from California in 1965-67 and from Illinois in 1968 to give an estimate of the distribution of types of passenger vehicles, excluding buses. In Figure 4, the different types of passenger vehicles are lumped together to provide an-other cumulative estimate of the distribution between pas-senger vehicles and various types of trucks. As estimated in Figure 4, 84 precent of the vehicles involved in fatal accidents are passenger vehicles; and, from Figure 3, 75 percent of these are intermediate or standard-size pas-senger vehicles. Thus, approximately 60 percent of the fatal accidents have involved intermediate or standard size vehicles. As used here, the term passenger vehicles does not include buses. Further, in the three stales reporting, no fatal collisions with buses were reported.
Examination of Table 5 reveals that the majority of fatal accidents in the three reporting states occurred after dark when the weather was clear or cloudy on dry pavements that contained no defects. Hosea (2) reported that more than half of the accidents on the Interstate system during 1968 and 1969 occurred at night. The number of vehicle-miles traveled during daylight is estimated at two to three times the number of vehicle-miles traveled at night; this suggests that the chances of a fatal accident are at least two to three times greater at night, which may be a mani-festation of the predominant hours for consumption of alcohol as well as decreased visibility.
Furthermore, the Texas data indicate that only 9 percent of the accidents occurred on horizontally curved sections of highway. Information obtained from Texas and Illinois concerning the geometric conditions at accident sites is given in Table 6. More than half of the accidents in Illinois and more than three-fourths of the accidents in
TA BLE
FIXED OBJECTS STRUCK FIRST IN SINGLE-VEHICLE, OFF-TUE-ROAD FATAL ACCIDENTS ON COMPLETED SECTIONS OF THE INTERSTATE HIGHWAY SYSTEM, 1968-69
FIRST OBJECT STRUCK NUMBER PER- CENT
Guardrail a 778 30.9 Bridge or overpass 460 18.3 Sign 202 8.0 Embankment 201 8.0 Curb 146 5.8 Divider" 138 5.5 Pole C 130 5.2 Ditch or drain 137 5.4 Culvert 88 3.5 Fence 51 2.0 Tree 48 1.9 Other 139 5.5
Total 2,518 100.0
'Includes cable type. "Includes rail, concrete, and chainlink C Principally light poles.
Principally right-of-way fences. Source: Public Roads (2).
Number of Fatal Accidents 0 250 500 750 1000
Guardrail Curb or Divider
Bridge or Overpass F.lemantc
Signs and Poles
Ditches Drains and Culverts
Embankments
Fences
'Frees
Ocher Obstacles
Figure 1. Fatal accidents categorized by objects struck. Source: Alter Hosea (2).
4
TABLE 2
COLLISIONS WITH TRAFFIC BARRIERS ON OR ADJOINING BRIDGES IN WHICH ONE OR MORE FATALITIES OCCURRED
STATE REPORTING: CALIFORNIA ILLINOIS TEXAS
YEARS OF RECORD: 1966, 1967 1967, 1968, 1967 1968, 1969 1967, 1968' 1968, 1969 1969
COLLISIONS REPORTED: 77 184 63 73 165 146
BARRIER STRUCK NO. % NO. % NO. % NO. % NO. % NO. % Guardrail adjoining -.
bridge rail 13b 17 44 24 13 21 25' 19 25 15 7 5
Parapet or end of bridge rail 40 52 24 13 37 59 94 63 94 57 37 25
Bridge rail 24 31 99 54 13 20 25 18 35 21 22 15
Bridge curb NR - 17 9 NR - NR - NR - 80 55
Unknown - - - - - - - - 11 7 - - Total 77 100 184 100 63 100 144 100 165 100 146 100
NR: No records available. 'January 1, 1967, through September 30, 1968.
Includes five collisions in which vehicle struck guardrail then later struck bridge rail. Includes seven collisions in which vehicle struck guardrail then later struck bridge rail.
TABLE 3
ESTIMATED SPEED OF VEHICLES IN TRAFFIC BARRIER COLLISIONS THAT PRODUCED ONE OR MORE FATALITIES
ESTIMATED SPEED CALIFORNIA (%) TEXAS (%)
OF VEHICLE 1965-67 1967-68 ILLINOIS (MPH) (NCHRP 86) 1967-69 (NCHRP 86) 1968-69 (%)
Standing still' - 0 - I 1-10 - 1 - 1
11-20 - 0 - 2 21-30 1 0 1 2 31-40 2 2 2 3 41-50 9 8 14 13 51-60 24 23 23 23 61-70 35 33 27 30 71-75 10 23b - - U
75+ 17 - - - 71-80 - - 12 14 Z 80+ - - 17 6 Unknown 3 4 5 5
'Vehicle standing still includes properly parked vehicles. b Vehicle speed 71 mph and over.
Texas occurred on level stretches of roadway. Approxi-mately 20 percent of the fatal accidents in each of these states occurred on grades; the percent of grade is not indicated in these data.
VEHICLE CHARACTERISTICS
Because automobiles were involved in four-fifths of the fatal accidents listed in Table 4, and because they have been used as the crash vehicles in most full-scale testing
programs on barriers, the researchers addressed them-selves to the task of examining automobile characteristics and their effects on factors, trends, and guidelines con-cerning bridge rail design. Because an additional concern exists about truck and bus collisions with barriers, the study was extended to include these types of vehicles as well. Although the information presented herein is limited in many respects, it provides the reader with information on a cross-section of vehicles and indicates trends in vehicle

100
V
100
5
80
0
30
0
0 10 20 30 40 50 6fl 70 80+ Unknown
Speed, mph
Figure 2. Distribution of speed in fatal accidents. (Adapted from Table 3 data.)
100
4, a. 1. V
50. V a' a
t18. 5 a,
0 A3,
6.3 V 0
Compacts Intermediate Station And And Standard Wagons
Foreign Sedans a.
Figure 3. Distribution of types of passenger vehicles for California (1965-67) and Illinois (1968).
84.2
1.7
Semi's Single Panels Passenger Motor-
(Truck and Unit And Vehicles cycles
Trailer) Trucks Pickups And Misc.
Figure 4. Distribution of types of motor vehicles.

ri
TABLE 4
TYPES OF VEHICLES INVOLVED IN SINGLE-VEHICLE, FATAL ACCIDENTS (PERCENT)
CALIFORNIA TEXAS ILLINOIS
1965-67 1967, 1967-68° (NCHRP 1968, (NCHRP 1968,
VEHICLE TYPE 86) 1969 86) 1969 1967 1968
Passenger: Standard 60 b - - - - 73 b
Compacts and foreign 23 - - - - 8
Stationwagons 7 - - - - 4 Not stated - - 83 78 - 1
Total 90 - 83 78 - 86
Commercial: Panels and
pickups 4 - - - - 5 Single-unit
trucks - - 100 14° - 4 Combination (truck
and trailer) 4d - 6 7 - 2
Total 8 - 16 21 - 11
Other: - Motorcycle and
miscellaneous 2 - 1 1 - 3
° January 1, 1967, through September 30, 1968. - - - - - b Includes intermediate size automobiles. ° Includes pickup trucks.
Includes single-unit trucks.
dimensions and weights as well as parameters that have not appeared in other studies.
Automobiles
A great deal of information is available on automobile dimensions and weights—items that are easily measured. In contrast, there seems to be a dearth of information on auto-mobile dynamic properties. A gentle remonstration is given to the would-be dynamicist by Rasmussen, et al. (6)
Modern research directed at obtaining a quantitative technical understanding of the dynamic motions of road vehicles dates from the early 1950's. At first, only a few rather separated groups were working actively in this field, but more recently, a number of industry, univer-sity, government, and independent research organiza-tions have become involved with vehicle dynamics work.
There is a rather consistent pattern to the activities of any organization starting to work in the field of vehicle dynamics.
Large and complex mathematical models are derived.
Extensive computer programs are written. In some cases, sophisticated driving simulation
devices are designed. A search for vehicle and tire parameters to in-
sert in the equations begins.
The dynamicist is usually surprised to find that the last step is the most expensive and time consuming task of the four.
Rasmussen, et al., provide some rather informative data concerning "conventional domestic passenger cars." The following excerpts give the data that are of most interest to the designer of bridge rails. The values presented are for vehicles in curb condition with full gas tank and no pas-sengers, which are the conditions found in most crash tests on barriers.
The vehicles measured were domestic production ve-hicles. The vehicle sample was bracketed by the fol-lowing general characteristics:
Style Curb Weight Wheelbase 2-Door hardtop 2,600 lb 108 in.
to to to Station wagon 4,800 lb 129 in.
The drive train in these vehicles varied from "front engine-front drive (1 vehicle) to front engine-rear drive to rear engine-rear drive (1 vehicle)," according to Rasmus- sen, et al., who described the location of the center of gravity as follows: -
Vehicle curb center of gravity location is a parameter that is intrinsic to a given vehicle and can not be esti-mated without a complete set of pertinent data on that vehicle. The fore-aft weight distribution of the front engine-rear drive vehicles measured -varied from 44 to 56% front. If front engine-front drive and rear engine-rear drive cars are included, the range was extended from 61% front to 3 7 % front.
The center of gravity height is again a property of a given car and cannot be readily estimated. The total

TABLE 5
ENVIRONMENTAL AND ROADWAY CONDITIONS EXISTING WHEN A FATAL ACCIDENT OCCURRED
FATAL ACCIDENTS (%)
TABLE 6
GEOMETRIC CONDITIONS AT SITES OF FATAL ACCIDENTS IN VICINITY OF BRIDGE
FATAL ACCIDENTS (%)
7
CONDITIONS ILLINOIS CALIFORNIA TEXAS ALIGNMENT
TEXS ' ILLINOIS CALIFORNIA
Weather: Clear (including cloudy) 74 85 82 Raining 14 11 11 Snowing 3 1 3 Fog 1 2 2 Wind, blowing dust - 1 0 Smoke - 0 0 Not stated 8 0 0
Light: Daylight 35 32 45 Dusk or dawn 6 3 3 Dark 58 65 52 Not stated I - -
Pavement: Dry 70 84 80 Wet 18 15 14 Snow 6' 1 1 Frost or ice - 0 5 Not stated 6 - -
Road: No defects 87 _b 84 Holes, ruts, etc. - - - Defective shoulders 1 - - Foreign material 1 - - Flooded pavement 1 - 1 Slick surface 7 - 7 Loose gravel 1 - - Narrow bridge I - - Road under construction 1 - 8
Includes icy condition. "California has no data
vehicle center of gravity height at curb trim for the above mentioned range of vehicles can vary from ap-proximately 19 to 24 inches above ground. Center of gravity height varies directly with the vehicle trim height.
The lateral center of gravity location can be considered to be on the vehicle longitudinal center-line for most ride or handling analyses.
Thus, ranges of properties are presented in the report, and the summary emphasizes:
A given vehicle might have parameters that fall at one end of the range for one parameter and at the opposite end for another. The particular values of each parameter will depend on the compromises and constraints under which that vehicle was designed.
The report contains other vehicle parameter ranges for mass moments of inertia and ride characteristics, but no-where in the report are the various parameters determined referred to any specific vehicle. Thus it becomes necessary, when trying to use the information in specific vehicle dy-namics problems, to construct hypothetical vehicles rather than real ones. This is a serious limitation of usefulness.
Some relationships that are not based on complex mathe-
Level: 78 51 Straight 69 - - Curved 9 - -
Grade: 19 21 - Straight 14 - - Curved 5 - -
Hillcrest: 3 4 - Straight 3 - - Curved 0 - -
Unknown - 24 - 'Includes accident data from rural areas and for cities having
populations of, or fewer than, 5,000 citizens. b California has no data.
matical equations and that do not require computer solu-tions are later presented. In short, estimates are provided of average impact forces on barriers from the instant of impact of a vehicle until the time the vehicle becomes par-allel to the barrier. These estimates are based on the theo-retical considerations presented in NCHRP Report 86 and are extended to include several automobiles, trucks, and school buses. During the course of the current study, the reports of many earlier engineers concerned with highway design and highway safety were examined. A report by Barnett, who sought a method to describe design loads for guardrails, was informative.
In 1939, Joseph Barnett (7) reported the results of a study of the weight distribution of new automobiles regis-tered during 1936, 1937, and 1938. Figure 5 shows the resulting distribution of weights as a solid line, any point of which gives the percentage of all automobiles weighing less than the loaded weight shown. Allowances of 150 lb for water, gas, and oil and 400 lb for passengers and baggage were made.
The dashed line of Figure 5 represents the distribution of weights of automobiles taken from a 1937 report of the State-Wide Planning Survey of Iowa. All automobiles (re-gardless of age, condition, or load) were weighed at three pit-scale stations; 1920 to 1937 models were included in the survey.
A review of information published in Automotive Indus-tries (8) for the years 1965 through 1968 is plotted as a broken line in Figure 5. The 550-lb allowance for gaso-line and passengers assumed by Barnett was added to the shipping weight reported in the magazine.
It is interesting to note that the automobile weight dis-tribution between 1920 and 1937 remained fairly con-sistent; however, the weight distribution of automobiles for the years 1965 through 1968 shows a marked variation from the earlier models. The later curve reveals that ap-proximately 15 percent of the newer cars weigh less than

U., U) Ui -J
80 z Ui3 3o
W Cn 60 cn
0
OR 4 z 40 U- 4 0
Ui
20 0 cr
QL
/
NEW CAR REGISTRATIONS 7' 1936, 1937, and 1938 (7)
1/
//
IOWA PLANNING / "AUTOMOTIVE INDUSTRIES" DATA SURVEY DATA 1937 (1' / 1965, 1966, 1967, and 1968 (8)
1/
- -
I
2600 3000 3400 3800 4200 4600 5000 5400 0 2200
LOADED WEIGHT OF AUTOMOBILES (LBS)
Figure 5. Distribution of weights of automobiles.
3,000 lb and that the majority of the newer automobiles are heavier than those of the 1920's and 30's.
Barnett also made estimates of the location of the center of gravity of automobiles and discussed other parameters, such as kinetic energy of an automobile in a collision with a guardrail. Taking a case from his study, additional in-formation on the dimensions of contemporary automobiles was sought.
Observation of automobiles in operation on highways leads one to conclude, in general, that as weight increases length increases. This observation was tested by tabulating the over-all lengths and shipping weights of new automo-biles registered in the United States during the years 1965 through 1969. These data were plotted on semilog paper, as shown in Figure 6. The plotted points represent a sam-ple of 212 automobiles (54 models) produced by 6 manu-facturers (American, Chrysler, Ford, General Motors, Volkswagen, and Simca) (8). The solid straight line was visually fitted to show the trend of the data and to aid in making the nomographs presented in Appendix B.
A semilog plot of automobile weights as a function of over-all width is shown in Figure 7. The two solid lines have no statistical significance, but indicate the trend of the data. The data points were obtained from the same source referenced above. It is interesting to note that more than 50 automobiles have a width of approximately 80 in. and range in weight from 3,800 to 5,500 lb and that none of the cars exceeded 80 in. in width (9, 10).
Next was an attempt to locate the center of gravity of contemporary automobiles. Because tabulated data on this
parameter were not available, the values for height of cen-ter of gravity (19 to 24 in.) and lateral location at mid-width of an automobile are those of Rasmussen, et al. (6). Their values for weight distribution for front engine-rear drive cars were employed in Table 7. (Being aware of their caveat that location of center of gravity ". . . is intrinsic to a given vehicle . . ." the researchers, who were seeking trends, did not use this value in complex mathematical models.) The location of the center of gravity was com-puted for the automobiles shown, and the arithmetic mean, or average values, is tabulated. Overhang values were not published for later model cars, so the study was limited to 1965 models. The distribution of the weight of the ve-hicle (50 percent front, 50 percent rear) is mathematically equivalent to using the upper and lower values established by Rasmussen, et al.
Trucks
The information presented on weights and dimensions of automobiles indicates a wide, but reasonable, range of values. Determination of similar information on trucks was attempted; however, the range of dimensions and parame-ters was too broad. For example, the initial effort to ex-amine the available data for both single-unit (SU) trucks and truck combinations (tractor with semi-trailer, either with or without a full trailer) was finally narrowed to single-unit trucks excluding pickup trucks. Because their population is significant, pickup trucks should be consid-ered as a separate class.
Sales brochures for 1970-model International, Ford,

600C
500C
U)
3000 ex
. .a
70 180 190 200 210 220 230 Z40 500
60
I500 60 65 70 75 80 85
28, VEHICLE WiDTH (inches)
Figure 7. Relationship between manufacturer's shipping weight of vehicle and its over-all width.
1 3000
400
5000
6000
L, VEHICLE OVERALL LENGTH (inches)
Figure 6. Relationship between manufacturer's shipping weight of vehicle and its over-all length.
Chevrolet, Mack, White, and GMC trucks gave their di-mensions, gross weights, and maximum axle loads. The fore-and- aft location of the center of gravity was computed by using these weights and dimensions, and assuming the moment about the front axle to be zero, from
_RRXWB 1
GVW ()
in which
i= distance from front axle to center of gravity; RR - rear axle capacity, or rear axle supporting force;
WB = wheelbase; and GVW = gross vehicle weight.
The value for x was verified by summing moments about the rear axle. The distance (AL) of the center of gravity aft of the forward bumper point was computed by adding the overhang (OH) dimension to the computed value of Z
In calculations made for tandem-axle vehicles, the rear supporting force RR was assumed to act as shown in Fig-ure 8. More than 300 computations were made, and sam-ples are given in Table 8. The values are based on the assumption that the gross vehicle weight is distributed according to axle capacity and, hence, is not representative of single-unit truck loads on the highways. Arithmetic mean values were computed to serve as an estimate of center of gravity locations, and the values for coefficient A

From Statics: = -i- (c+bl)
AL
10
TABLE 7
POSITION OF CENTER OF GRAVITY OF AUTOMOBILES
VEHICLE
VEHICLE PROPERTIES
c a b (IN.)
I (IN.)
L (IN.) A
Ford (Falcon)- 0.50 0.50 29 110 182 0.46 Ford (Mustang) 34 108 182 0.48 Ford (Fairlane) 31 116 199 0.44 Ford (54Ser.) 34 119 210 0.45 Ford (T-Bird) 38 113 205 0.46 Mercury (Comet) 31 114 195 0.45 Mercury (50 Ser.) 37 123 218 0.45 Lincoln (53ASer.) 37 126 216 0.46 Rambler (Amer.) 29 106 177 0.46 Rambler (Classic) 31 112 195 0.45 Rambler (Ambass.) 31 116 200 0.44 Plymouth (Valiant) 33 106 188 0.46 Plymouth (Belv.) 33 116 203 0.45 Plymouth (Fury) 35 119 209 0.45 Chrysler (All) 35 124 218 0.45 Dodge (Dart) 34 111 196 0.46 Dodge (Coronet) 34 117 204 0.46 Dodge (AD 2 Ser.) 0.50 0.50 36 121 212 0.46
Arithmetic Mean =Average: 0.455
* The position of the center of gravity was determined for various 1965 four-door passenger vehicles using statistical data published by Automotive Industries (8). No data was available on the amount of overhang for vehicles manufactured by General Motors Corp.
given in the table have been used in developing nomo-graphs presented in Appendix B.
The transverse center of gravity is probably at mid-width in trucks loaded to capacity. The height of the cen-ter of gravity varies from about 3 ft (unloaded small trucks) to over 8 ft in large trucks, which, as Barnett wrote in 1939, ". . . is about all we can say about this value at present") (7, p. 142).
Using Eq. 5 in NCHRP Report 86 (1, p. 12), the esti-mated impact load imparted by a single-unit truck can be compared to the crash test conditions (4,000-lb passenger vehicle at 60 mph, and 25) suggested in HRB Circular
482 (11) as given in Table 9. For the same speed and angle of impact, the 18,000-lb truck has an average im-pact load on a rigid barrier of 97 kips while the 60,000-lb truck has an average impact force on a rigid barrier of 226 kips. The values given are for a rigid barrier and assume that the truck does not climb up and over the barrier and that adequate height of barrier is available to redirect the truck. The latter requirement led the research- ers to consider barrier height.
HEIGHT OF BARRIERS
AASHO Standard Specifications for Highway Bridges requires:
The height of traffic railing shall be no less than 2'-3", measured from the top of the roadway, or curb, to the top of the upper rail member. (12, p. 6)
A review of drawings of standard bridge traffic barriers from several states reveals that most installations meet this minimum requirement. Measurements of bridge barriers installed in more than 20 states indicate that a height of 27 in. prevails in recent installations.
The question is raised frequently as to whether this minimum height is adequate from the viewpoint of safety. A progress report by Graham on New York's Highway Barrier Research Program states that it is not.
The height of all of our systems needed to be iñcrëased due to the tendency of late-model cars to get over them during certain types of collisions. (13, p. 3)
The report continues:
Our analysis of barrier accidents disclosed that a surpris-ing percentage of vehicles were going over the installa-tion during collision. This was true of all of our systems, old and new, but was most prevalent with the W-beasn. No difficulty was reported with vehicles getting under the rail. Of course, none would be expected with our new configurations because the exclusive use of the light-weight post permits the vehicle to make post contact without the risk of snagging or spin-out. In order to minimize this vaulting tendency we investigated the fea-sibility of increasing the height of our systems.
Graham then describes the erection of a series of physi- cal models of W-beam guiderails installed at heights of 27, 30, and 33 in. Automobiles and trucks were photo-graphed adjacent to these models, and Graham states:
These pictures demonstrate quite clearly that the 27-inch height is certainly questionable for passenger cars and much too low for trucks. Furthermore, the shape of the automobile bumpers on recent vintage cars slopes up and out in sort of a "ski" effect which tends to assist the ve-hicle in moving up and over the rail. We also found that the chassis of passenger automobiles can be raised as much as 6 inches while the wheel is still in contact with the ground which we believe may happen in some barrier accidents. As a result of this combination of ve-hicle features the car in some collisions strikes the bar-rier near the top of the rail with its suspension extended and the shape of the bumper causes the vehicle to vault over the barrier. On the basis of this preliminary inves-tigation and the knowledge that wheel contact was not a problem with our lightweight posts, we ran two addi-tional tests on W-beam guiderail mounted at a height of 33 inches. Our full-scale test results at 60 miles per hour and 25° with a standard passenger vehicle and a sports

;Gvw
S CG
SINGLE REAR AXLE (CAB OVER)
w avw
TWO REAR AXLES (CAB OVER)
11
AL X I 2B
WB >1
L
THREE REAR AXLES (CONVENTIONAL CAB)
Figure . Typical single-unit trucks.

12
TABLE 8
WEIGHTS, DIMENSIONS, AND LOCATIONS OF CENTER OF GRAVITY FOR SEVERAL SINGLE-UNIT TRUCKS (1970 MODELS)
AXLE CAPACITY COMPUTED PARAMETERS
LISTED BY DIMENSIONS LISTED BY MANUFACTURER GROSS MANUFACTURER _______________________________
LOCATION OF VEHICLE ________________ OVER- WHEEL- OVERALL CENTER OF GRAVITY WEIGHT, FRONT, REAR, HANG, BASE, LENGTH, WIDTH, GVW R. Rn Oil WB L 2B X AL (LB) (LB) (LB) (IN.) (IN.) (IN.) (IN.) (IN.) (IN.) A
20,000 5,000 15,000 24.9 127 183.7 90.0 - 95.3 120.1 0.655
24,000 7,000 17,000 27.6 127 186.5 90.0 90.0 117.6 0.633
32,000 9,000 23,000 25.2 132 191.5 94.0 94.9 120.1 0.628 Zn
41,000 12,000 29,000 45.2 137 258.5 92.0 111.0 156.4 0.605
22,000 7,000 15,000 53.0 89 174.0 95.3 60.7 113.7 0.653
24,000 7,000 17,000 53.0 89 174.0 95.3 63.0 116.0 0.667 u
30,500 7,500 23,000 54.5 99 187.5 89.1 74.7 129.2 0.689
35,000 12,000 23,000 28.5 106 166.0 95.0 69.7 98.2 0.592
39,000 9,000 30,000 28.5 136 216.0 95.5 104.6 133.1 0.617
46,000 12,000 34,000 28.5 140 217.5 95.5 103.5 132.0 0.607 H
50,000 12,000 38,000 45.4 157 268.2 92.0 119.3 164.7 0.613 Z t
- Z 66,000 16,000 50,000 56.1 157 279.0 92.0 118.91 174.0 0.624 8 39,000 9,000 30,000 54.5 129 261.5 89.1 99.2 153.7 0.588 g o
43,000 9,000 34,000 54.5 147 279.5 89.1 116.2 170.7 - 0.611 0
46,000 12,000 34,000 28.5 142 219.0 95.0 105.0 133.5 0.609 no
55,000 16,000 39,000 40.6 187 306.6 96.0 132.6 173.2 0.564 Zn
58,000 16,000 42,000 40.6 187 306.6 96.0 135.4 176.0 0.574 8
car showed the performance to be practically identical to This progress report was concerned with guiderails and similar tests at 30, 27, and 24-inch heights. These data median barriers; however, as bridge rails abut such bar- satisfied us that the ability of this barrier to properly redirect vehicles under normal test conditions is rela- riers, the findings may be generally applicable to barriers. tively insensitive to rail height between 24 and 33 inches. Nordlin, et al., reported the results of dynamic full-scale Consequently, we have raised all our systems. The new impact tests of bridge barriers and found that an over-all heights of our various guiderail and median barrier de-signs are shown . . . [see Table 10].
TABLE 9
AVERAGE IMPACT FORCES OF TRUCKS COMPARED WITH AUTOMOBILES
COLLISION VEHICLE CONDITIONS AVERAGE
LATERAL IMPACT IMPACT
WEIGHT SPEED ANGLE FORCE TYPE (LB) (MPH) (0) (laPs)
Automobile 4,000 60 25 28
Truck 18,000 60 25 97
Truck 60,000 60 25 226
TABLE 10
EXISTING AND PROPOSED MOUNTING HEIGHTS
BARRIER
MOUNTING HEIGHT (IN.)
EXISTING PROPOSED
Guiderail: Cable 27 300 W-beam 27 33 6x6 Box beam 27 30b
Median barrier: W-beam 29 33 6x8 Box beam 27 30
0 To center of top cable. b Box guiderail at 33 in. outside superelevated curves Source: After Ref. 13, p. 6.

5' EXTRA HEAVY frSTEEL PIPE RAILING
AST STEEL POST
61. x 2"x I/4',,_..._l STRUCTURAL TUBE ,I
'. :. WELDED STE
35
RAIL POST
...O .p.•4.'4•
8t...j 11.5 CLASS A_
citTDCIJ
EEP BE RAIL
W 4 BOLT IANCHORAGI
6'x 2'x 1/4 STRUcTURAL PIPE
HEIGHT OF TRAFFIC BARRIER (INCHES)
- 60 -
50 -
40
30—
I
13
barrier height of 36 to 43 in. is adequate (/4, p. 140). The determination of minimum effective height was not made, thus there is no conflict between this finding and the find-ings of Graham.
Lundstrom, et al., described the development at the General Motors Proving Ground of a sloped-face parapet, shown in Figure 9.
It was fully realized that the 32-in, height of the con-crete wall was not sufficient to guarantee that larger trucks would be safe. Accordingly, a pipe rail was in-stalled on top to provide a higher barrier. . . . (15, p. 179)
The resulting height of the "GM barrier" is approxi-mately4½ ft.
Another example of a sloped-face concrete parapet, which has been subjected to full-scale dynamic tests, is the California Type 20 bridge barrier railing also shown in Figure 9. It has an over-all height of 39 in. Nordlin, et al., stated:
The Type 20 design provides better "see-through" char-acteristics than the General Motors design because the over-all height is about 16 in. less, the concrete parapet is about 5 in. lower, and the steel rail is narrower. (16, p. 58)
Examination of standard drawings of barriers being in-stalled by state highway departments reveals that heights vary from a minimum of 27 in. to those in excess of 40 in.
A recent FHWA notice (EN-20) concerning concrete median barriers and bridge parapets suggests that total bridge parapet height (for sloped-face concrete barriers) should be 32 in. minimum. The notice contains a summary of current designs from several states that indicates that several highway departments construct a metal railing on top of sloped-faced parapet on bridges.
CURBS AND SIDEWALKS
NCHRP Report 86 (1, p. 3 1 ) gives recommendations con-cerning construction of curbs. The recommendations are based on crash test information. A closer examination of current specifications, policies, and published reports is warranted in a study aimed at establishing design criteria.
Specifications
Article 1.1.8 of AASHO Standard Specifications for High-way Bridges (12) states:
The face of the curb is defined as the vertical or sloping surface on the roadway side of the curb. Horizontal measurements of roadway and curb width are given from the bottom [sic] of the face, or, in the case of stepped back curbs, from the bottom of the lower face for roadway width. Maximum width of brush curbs, if used, shall be 9 inches.
Where curb and gutter sections are used on the roadway approach, at either or both ends of the bridge, the curb height on the bridge may match the curb height on the roadway approach, or if preferred, it may be made higher than the approach curb. Where no curbs are used on the roadway approaches, the height of the bridge curb above the roadway shall be not less than 8 inches, and preferably not more than 10 inches.
Where sidewalks are warranted for pedestrian traffic on urban expressways, they shall be separated from the bridge roadway by the use of a traffic or combination railing as shown in Figure 1.19.'
Policies
Designers of traffic barriers for use on and near bridges must meet the provisions of the Specifications and follow the requirements of the AASHO Policy on Geometric Design of Rural Highways (Blue Book), which states:
Where full shoulders are provided safety curbs may or
* Figure 1.1.9 of the Specifications is reproduced here as Figure 10.
TEXAS T—1 CALIF. TYPE 9 BRIDGE RAIL BRIDGE BARRIER (JUNE , 1970) RAILING (MAY, 1967)
MODIFIED NEW JERSEY
MEDIAN BARRIER (TESTED BY CItH.,
1967)
GENERAL MOTORS PROViNG GROUND CONCRETE PARAPET
(1965)
CALIF. TYPE 20 BRIDGE BARRIER RAILING (APRIL,1969)
Figure 9. Comparative heights of rigid traffic barriers.

With simultaneous longitudinal load of /2 this amount, divided
among posts in a Continuous roil length.
PS * * P
/ F'12 T' •
- ' CI I2
cjI (t LL
Rail heights shown shall be measured from top of curb if the curb width exceeds
sin inches, but from the lop of roadway if the curb width is six inches or less.
TRAFFIC RAILING
1W w r
i- !4 . - - J ci Tfl
In
CY TLflL JLb95rali05
COMBINATION RAILING
w 1w
w wI
r— 1w I
I w i
'
,?l Iwl
I '' 1111
L
-"I 1+1
jO
'j_....._.Walltway Surface
PEDESTRIAN RAILING
P • 10,000 lbs. Note: The shapes of roil members
L • Post spacing for Traffic B Combination Roiling, are illustrative only. Any material
* 50 lbs. per un. ft. or combination of materials
Post spacing for Pedestrian Railing, listed in Article 1.1.9 may be
Rail load shown on left, used in any configuration. Post load shown on right.
14
a 0
Optional
Figure 10. Railing configurations. Source: Ref. 12, p. 7.
may not be used as shown in alternate I and alternate II of Figure IX-7A. [See Fig. 11.]
Figure LX-7A shows the case where the shoulder on the approach highway is flush with the traveled way, which is the usual case. If curbs are used on the approaches to a short overpass they preferably should be carried across the structure without lateral deviation. Such curbs should be mountable, and the clearance from the through pavement to the face of parapet or rail, or face of safety walk if one is used, should be the same as for the case with no curbs on the approaches. (17, p. 515)
The term "safety curb" was defined in the ninth edition of the AASHO Bridge Specifications, as follows:
Curbs widened to provide for occasional pedestrian traf-fic shall be designated "safety curbs." Safety curbs shall be not less than 1'6" wide. (18)
It is significant to note that the term safety curb does not appear in the tenth edition of the Bridge Specifications.
This represents a movement away from the use of safety curbs on the part of bridge engineers. Therefore, an obvi-ous inconsistency exists between the Blue Book and the Bridge Specifications, an inconsistency that should be rectified.
Crash Tests
For more than 15 years, full-scale crash tests of bridge traffic barriers having curbs or curbs and sidewalks have been conducted, and some observations by the researchers deserve consideration.
Beaton and Peterson (19) reported on dynamic testing of various curbing designs in 1953. These studies led Beaton (20) to conduct further full-scale dynamic tests of bridge curbs and rails and concrete bridge rails having a variety of curbing configurations. Later tests on barriers having a rubbing curb (see Fig. 12) led Nordlin, et al., to conclude:

111
LEFT CLEARANCE RIGHT CLEARANCE
ALTERNATE I ALTERNATE II ALTERNATE I ALTERNATE U
APPROACH SHOULDER APPROACH SHOULDER ,APPROACH SHOULDER WIDTH
WIDTH DES. AND MIN. WIDTH DES. AND MIN. .5 SAFETY . . .5 SAFETY
THROUGH CURB THROUGH THROUGH THROUGH CURB
(PAVEMENT PAVEMENT PAVEMENT PAVEMENT_______
//)///// ON LOW VOLUME. /1/1/ ROADS 3.5 DES., 2.5MIN.
A. ALL SHORT STRUCTURES, AND THOSE LONG STRUCTURES (EXCEPT WITH LONG SPANS) WHICH HAVE A RATIO OF DHV TO CAPACITY GREATER THAN 0.75
4.5' DES. 4.5 DES. , DES. 1.5' SAFETY
4.5 DES.
I 5 SAFETY 3.0 DES. 35 MIN. E5. 3.0' MIN.
, CURB 3.5' MIN.
CURB THROUGH r THROUGH THROUGH fl THROUGH
VEMENT . 11 VEMENT PAVEMENT ,-J PAVEMENT
MINIMUM ON LOW VOLUME ROADS I LESS
LONG SPAN STRUCTURES, AND OTHER LONG STRUCTURES WITH RATIO OF DHV TO CAPACITY OF LESS THAN 0.75
3.0 DES. . 1.5 SAFETY CURB 2.0 MIN. I I / 3.0 DES. 5.0 DES. .5.0 DES. 1.5 SAFETY
,AUXILIARY LANE /_-o.O MIN. 2.0' MIN'N 0.0 MIN\,— CURB
I ['THROUGH I THROUGH THROUGH I THROUGH I Ii PAVEMENT PAVEMENT7 PAVEMENT AVEMENT
i/i//i/i//I ///i//'ii. '/1//I//i//i
LONG AND SHORT STRUCTURES WITH AUXILIARY LANES
CLEARANCES AT OVERPASSES Figure 11. Permissible configurations. Source: Ref. 17, p. 516.
-------
_ H1 0
to
OD
18 OD
*4(6Req.) atI8'
:::t:1ii IH' 6—*6 at 12" F 1" 4at 18' 144 at
T 1j IxI
--
*4(6Req.)
*4 at 18"-44 I". I'I
*4at
-i 0
i "I[
I ---I
A. CALIFORNIA STANDARD B. CALIFORNIA STANDARD C. EXPERIMENTAL BRIDGE BARRIER RAILING BRIDGE BARRIER RAILING BRIDGE BARRIER RAILING
TYPE I . TYPE 2 MODIFIED TYPE 1
Figure 12. 1963 bridge barrier rail tests. Source: Ref. 14, p. 145.

16
Based on the results of this test series on the Type 1 and Modified 1 bridge barrier rails, the rubbing curb is con-sidered an unnecessary feature that complicates the forming for construction and adds to the cost. This rub-bing curb does not function as a wheel deflector as origi-nally intended. In all but the most narrow-angle, low-speed contacts, the front and side overhang on the mod-em domestic passenger vehicle prevents the tire from contacting this curb before the body scrapes the parapet. Should the face be extended to more than the present 4 in., in an attempt to redirect the vehicle wheel in cas-ual impacts, there is a strong possibility that a vehicle contacting the Type 1 at a narrow angle would mount the curb, climb the 21-in, high parapet, and vault the barrier. Therefore, if a wider rubbing curb is desired, the parapet wall should be 28 in. high as provided in the Type 2 design. (14, p. 140)
SUMMARY STATEMENT: Rubbing curbs are unneces-sary features and may contribute to ramping at low impact angles.
Graham, et al., reported the results of tests on barriers having curbs; these tests are summarized in Table 11. They observed:
The 10-in, high curb caused considerable steering damage and it was problematical where the car would stop after a severe collision with this height of curb. It was ob-served that car "jump" only occurred where the curb is offset from face of rail enough to allow the suspension system to recover before the car strikes the rail.
Impacts against a 6-in, curb without any railing were per-formed in a car controlled by a driver. These tests showed that a 6-in, high curb had almost no effect on the steering system. The 6-in, curb also had very little effect on the vehicle motion during several shallow-angle low-speed impacts. It was concluded that a 6-in, curb should not affect the motion of a car striking a box beam bridge rail if the rails were mounted close enough to the face of the curb to prevent car "jump" due to recovery of the suspension system. To verify this the bridge rail used in Tests 31 and 32 was erected on a curb 6 in. high for full-scale tests. (21, p. 133)
Four tests were performed on the 6-in, high curb, and it was noted that:
As predicted, the 6-in, curb had no noticeable effect on vehicle reactions. (21, p. 138)
Tests 44 and 45 demonstrated that the box beam bridge rail can redirect a car as well as can a 10-in. high curb during mild impacts. Test 47 and several low-speed, low-angle tests showed that a car is not adversely af-fected by a curb 6 in. high. (21, p. 138-139)
SUMMARY STATEMENT: A 10-in, curb causes con-siderable steering damage and contributes to car "jump" when the curb is offset from the face of the bridge rail. A 6-in, curb has no noticeable effect on vehicle reactions, pro-viding the curb is close enough to the rail to prevent car "jump."
TABLE 11
SUMMARY OF RESULTS FROM CRASH TESTS WITH BARRIERS MOUNTED ON CURBS
IMPACT CURB CONDITIONS DIMENSIONS
(IN.) TEST SPEED ANGLE NO. (MPH) (DEG) a b REMARKS
61 27 10 60 When the test car traversed the S-ft wide sidewalk, it did not jump. (21, p. 117) The 10-in, high curb damaged the steering system. (21, p. 117)
51 28 10 20 The 10-in, high curb damaged the steering system. (21, p. 117)
29 22 10 20 (14,000-lb school bus) The front wheel mounted the curb, . . . (21, p. 117)
45 35 10 18 The steering system was badly damaged by the 10- in, curb. . . . (21, p. 139)
55 25 10 18
60 25 10 20 The damage to the front wheel caused the car to 61 25 10 20 veer away from the rail in test 31 and toward
the rail in test 32 after the car left the rail.... (21, p. 127)
31 7 6 6 Vehicle damage was slight enough so that the 53 7 6 6 same car was used for both tests [44 and 45]
and was driveable after the second test. (21, p. 133, 138)
40 25 6 6 . . . a previously damaged car was used. However, the steering was not further damaged, and the car was driven away after the test. (21, p. 138)
45 35 6 6 . . . the 6-in, high curb had no noticeable effect on vehicle reactions. (21, p. 138)
10
11
16
29
30
31 32
44 45
47
48

CHAPTER THREE
PROBABILITY OF INJURY
17
TOLERABLE ACCELERATIONS
Once it became popular to characterize accident severity in terms of the accelerations imparted to the automobile, there has existed an apparently irresistible urge for techni-cal writers to set acceleration tolerance limits. Most of these published tolerance limits were based on the work of Ruff (22), Stapp (23, 24), Headley (25), and Zabo-rowski (26, 27). These publications cover the significant empirical research programs that have been conducted on live humans. The conclusions developed in these programs applied to healthy, adult males. In all cases, the only acceleration effects observed were those of the acceleration environment on elements of the body and the interaction of the body with lap belt, shoulder harness, and seat. Inter-actions with surrounding objects, such as those found in the interior of an automobile, were not a factor in these ex-periments. It is therefore recognized that extrapolation of these data to predict injury of passengers in a vehicle sub-jected to specified accelerations is an unpromising task. To illustrate the tenuous nature of predictions of this sort, two accidents will be described. Both incidents involved ve-hicles crashing head-on into barrel crash cushions (28), which are used widely at elevated gores in Texas and are installed at other sites throughout the United States (29). The purpose of these cushions is to decelerate an impacting vehicle at a rate that is survivable for occupants.
On October 12, 1969, a 1968 sedan crashed into a barrel crash cushion in Houston, Texas (30). The speed of the vehicle was at least 70 mph.* The measured stopping dis-tance of 17 ft resulted in an average deceleration of ap-proximately 9.5 g. Neither the 20-year-old male driver nor the 15-year-old female passenger wore seat belts or shoulder harnesses. Injuries experienced by the male consisted of a broken nose and rib. The female suffered a broken collar bone.
On January 21, 1971, a 1968 pickup truck driven by a 49-year-old male collided with a barrel crash cushion in Houston at a computed speed ' of 42 mph (31). The stopping distance determined by investigators was 7.5 ft. The average deceleration computed from the initial speed and stopping distance was 7.4 g. The unrestrained driver was killed when his chest was crushed by the noncollapsible steering column.
In summary, the 9.5-g deceleration resulted in minor injuries, in contrast to the 7.4-g deceleration that resulted in death. This comparison is possible because the known crushing properties of these crash cushions allow the de-termination of deceleration during vehicle impacts. The incident that produced a death is atypical of experience with barrel craTh cushions but is presented to illustrate the
* Based on the number of barrels crushed, the vehicle impact speed can be predicted with considerable accuracy (28).
tenuous nature of injury predictions based on acceleration levels. With data subject to this type of scatter, an alternate method of interpreting deceleration levels based on "prob-ability of injury" has been devised and is presented in the following paragraphs.
A METHOD FOR RELATING DECELERATION TO PROBABILITY OF INJURY
Michaiski (32) reported the results of a field study con-ducted in Oregon in 1967, in which injuries sustained in 951 traffic accidents were related to vehicle damage. Later, Olson (1) used the National Safety Council (NSC) photo-graphic damage rating scales (33) to connect probability of injury, vehicle damage rating, and deceleration. The connection was made by comparing photographs of auto-mobiles damaged in crash tests, in which decelerations were recorded, with photographs contained in the NSC bulletin. Olson suggested the following equations:
G15 - 10.0 P15. (2)
Gio,ig = 13.7 1'long.
in which
7iat. = average lateral deceleration; Gioi,g = average longitudinal deceleration; 'la, probability of injury due to lateral acceleration;
and
'long. = probability of injury due to longitudinal accel-eration.
The confidence limits of these equations are large because of the small number of tests in which decelerations were recorded, the type of object struck in the tests, and varia-tions in interpreting "front-end damage" and "front-quarter damage" as defined in the NSC bulletin. The arguable sig-nificance of these relationships is recognized, but the rounded-off relationships indicated in Figure 13 are used in developing a procedure for relating deceleration levels to probability of injury.
Graham, et al. (21) set limits of tolerable deceleration levels with respect to bridge rail or guardrail impacts based on the recommendations of Cornell Aeronautical Labora-tory. Michie and Bronstad (34) repeated these limits in their latest publication. These limits are given in Table 12.
Tolerable acceleration limits assumed by Weaver (35) are given in Table 13. Weaver proposes that these ac-celeration levels be used in a severity index (SI) equation presented by Hyde (36), which is based on the "ellipsoidal envelope for defining the multiaxial acceleration limits" concept. As applied by Ross and Post (37) to the two axes of primary interest during a guardrail collision, the severity index equation is

18
1.0
0.8
., 0.6k— o I
'
0.4 1 0.2
0C 0
4 8 12 16
Accelerations (g's)
Figure 13. Suggested relationship between probability of in-jury and acceleration Source: After Olsen -(1).
SI = + Note: Gvcrt is neglected. (4) G
where GXL and GYL are the maximum tolerable accelera-tions in the longitudinal and lateral directions and cor-respond to one-half of the major axes of the ellipse. Giojg. and Giat are the actual accelerations produced during a specific collision. Using the values GXL = 7 and GYL = 5, taken by Weaver for the unrestrained condition, Eq. 4 becomes
G
1
- long. 2 - 72 + 52 (5)
In effect, the severity index is the ratio of the vector sum of the critical accelerations encountered during a collision to the vector sum of the "tolerable" accelerations in the lateral and longitudinal directions. It it is less than 1, the collision is considered tolerable for unrestrained passengers. The rationale and assumptions behind this severity index, based on vector summation of multiaxial accelerations, are treated in detail by Hyde (36).
It was considered essential to compare the various ac-celeration limits that have been specified by means of a resultant probability of injury, P,. The equations shown in Figure 13 are linear relationships between P15. and G151 and between loflg. and Giong. It is certainly acceptable to take a vector sum of the acceleration levels along two axes in order to determine resultant acceleration. Relating this resulting acceleration to a limiting ellipsoidal envelope is subject to a number of rationalizations as discussed by Hyde; but, if this relationship is accepted, it is possible to use the relationships between G and P to determine the resultant probability of injury. This concept is illustrated by relating the SI value using Weaver's values for "toler-able" accelerations with probability of injury. Consider Eq. 5 and substitute Olsen's values, as shown in Figure 14,
= 10 P10. and Glong. = 14 Plong.. Substitution yields:
si = Vbo22b0t+ 142 2iong. (6) s
or
SI V4 P215 . + 4 12ong. (7)
resulting in
SI = 2'/P2101 + 2long. (8)
Thus the quantity under the radical is the vector sum of the probabilities of injury in the lateral and longitudinal direction, or
SI2Pr (9)
TABLE 13
TENTATIVE TOLERABLE ACCELERATION LIMITS
MAXIMUM ACCELERATION (G)
TABLE 12
CORNELL LIMITS OF TOLERABLE DECELERATION (TENTATIVE)
MAXIMUM DECELERATION (G)
LONGITU-
RESTRAINT LATERAL DINAL TOTAL
Unrestrained occupant 3 5 6
Lap belt 5 10 12
Lap belt and shoulder harness 15 25 25
Source: Graham (13).
LONGITU- LATERAL DINAL VERTICAL
RESTRAINT (Gy) (Gx) (Gz)
Unrestrained occupant . 5 7
Lap belt 9 12d . 10
Lap belt and shoulder harness 0 15 20 17
Suggested as 60 percent of lab belt restraint limits (35). b Limit suggested by Hyde (36) for safety and corroborated by IT!
research team field tests (35). (Represents 60 percent of established isp belt restraint vertical acceleration limit).
Suggested as 60 percent of lap belt and shoulder hamess restraint limits (35).
1 Commonly accepted limit for isp belt restraint in crash cushion and breakaway studies.
Maximum limitssuggested by Hyde (36).
7

10
0 I 2 3 4 5 6 7 8 9 10 .11 12 13 14
Longitudinal Acceleration, (g's) Figure 14. Comparison of Graham's and Weaver's allowable limits.
19
Further, it is of interest that the severity index based on Weaver's values of tolerable acceleration corresponds to a probability of injury of 0.5. In other words, in one-half of the automobiles involved in collisions where the severity index was equal to unity, injuries to passengers would be expected. This boundary of injury probability (50 percent) may roughly approximate a division between minor and severe injuries, although there would always be exceptions as previously discussed. Therefore, the acceleration levels chosen by Weaver, though rationalized in a somewhat arbi-trary manner, relate rather appropriately to the probability of injury. It seems a rather remote coincidence that the acceleration levels chosen by Weaver should correspond to the probability of injury 0.5. However, Weaver has con-firmed that his acceleration levels were set independently as described in his paper (35).
The curves shown in Figure 14 were drawn using the principal of vector addition:
P = '/P218. + loI1g. (10)
Each elliptical curve corresponds to a specific probability of injury. Values range from P = 0.1 to P = 1.0. Note
that the curve of P = 0.5 corresponds to a severity index
of 1.0 at all points. This curve is labeled "Weaver's Allow-able Limit."
The relationship between the probability of injury and Graham's allowable acceleration levels can also be deter-mined from Figure 14. Graham's values of G1,. = 3 and
G iông = 5 are used as one-half the length of the principal axes in the equation of an ellipse to plot the curve labeled "Graham's Allowable Limit." This shows that Grahams' allowable acceleration levels correspond to probabilities of injury varying from 0.3 to 0.36 as the resultant acceleration changes from the lateral to the longitudinal direction. Thus they are relatively consistent and are considerably more conservative than Weaver's values.
Michie and Bronstad (34) have repeated Graham's al-lowable accelerations with the endorsement of an advisory group of national experts and NCHRP Advisory Panel C22-1. These acceleration limits are given for the lap-belt-restrained and the lap-belt, shoulder-harness-restrained con-ditions as well as the unrestrained condition that has been previously discussed. Inasmuch as Michaiski's data were based on a population of vehicles in which lap and shoulder belts were used by a minority of the occupants, he provides no means of evaluating any of the acceleration levels except those corresponding to the unrestrained condition. In the

20
unrestrained condition, as previously demonstrated, the allowable accelerations correspond to a probability of in-jury varying from 0.3 (lateral) to 0.36 (longitudinal). This can be justified to some extent when one considers the im-provements in design that automobile manufacturers are making to protect passengers subjected to longitudinal ac-celerations (crushable steering columns, padded dashes, re-cessed knobs, and whiplash guards) compared with the minor improvements available to protect passengers sub-jected to lateral accelerations. Perhaps a more important question is whether these low levels are practically achiev-able. The following section treats this question in some detail.
APPROPRIATE TEST CONDITIONS
During the past 10 years, a variety of bridge rail and guard-rail crash tests have been conducted under the sponsorship of state and federal agencies. This text compares and dis-cusses 10 tests that correspond roughly to the upper-limit test condition requirements of HRB Circular 482 (11) (i.e., 60-mph speed, 25° impact angle, and 4,000-lb ve-hicle). The rail systems vary from rigid, sloped-face con-crete median barriers through contemporary and experi-mental barriers of considerable flexibility to flexible cable guardrails. Some of these barriers are included in NCHRP Report 118 (34); others are reported in ITI publications (37, 38, 47, 48). Figure 15 illustrates the barriers, and Table 14 outlines details of the tests. As shown in this table, the test data have been adjusted to the 60-25-4,000 test conditions by means of the procedure given in Ap-pendix C.
It is difficult to compare the seventies of different tests
on the basis of biaxial acceleration levels unless these levels are combined in some way to bring about a resultant ac-celeration. Even if this is done, one is confronted with the question of significant differences. Consider hypothetically, for example, that Barrier A imposed a resultant accelera-tion of 10 g and Barrier B imposed 8 g. It would appear that Barrier A is less desirable than Barrier B. But, is the difference really significant? A possible answer to this ques-tion is discussed on the basis of probability of injury. By plotting the average longitudinal and lateral accelerations that occur in a specific test on a probability of injury chart as shown in Figure 16, the probability of injury can be readily determined. Figure 16 is a plot of the adjusted data from the 10 tests described in Table 14. As shown, all tests of bridge rail and median barrier systems give prob-ability of injury levels above 0.5. The flexible cable guard-rail system is the only one that falls within the tolerable levels presented by Graham (13) and Weaver (35). How-ever, two of the tests-the New York strong beam, weak post (NY-A) and the Texas double flexbeam median bar-rier (T4-1)-come close to the Weaver criterion of a SI of 1 (a probability of injury of 0.5).
It may be concluded that the criterion of Graham (13) is not achievable with the contemporary bridge rail systems included in this discussion when the systems are subjected to the upper-limit test conditions of 60 mph, 25°, and 41000 lb. The next question then is whether HRB Circular 482 upper-limit conditions are reasonable for passenger injury considerations. It is the opinion of the authors that these upper-limit conditions (60-25-4,000) may be satis-factory for a structural evaluation of a rail system but are not appropriate for the evaluation of performance with
TABLE 14
DETAILS OF BARRIER TESTS
ITEM
ITS TEST NO.
T4-1 T-E3 CMB-1 NY-A TI-B Tl-D 595-C 595-D FT-A FT-B
Vehicle: Year 1963 1963 1963 1964 1961 1964 1963 1961 1963 1959 Make Ply. Ply. Ply. Dodge Ford Dodge Chev. Ply. Ply. Olds. Weight (lb) 3,640 3,610 4,000 3,800 3,920 3,620 3,430 3,000 3,200 4,720 Impact angle (deg) 25 25 .25 25 25 25 25 25 25 25
Observed: Initial speed (mph) 57.3 59.3 62.3 55.4 56.2 61.6 54.3 56.3 58.3 54.8 Dynamic deflection of barrier (ft) 1.3 0.5 0 1.5 0.4 0.3 5.0 6.0 0.5 1.2 Average longitudinal deceleration
to parallelism (g) 3.1 33 2.1 1.3 4.5 0.5 1.3 0.6 2.2 3.0 Average lateral deceleration to
parallelism (g) 4.4 6.2 8.0 4.8 5.4 6.9 2.3 2.3 6.5 4.6 Adjusted:
Vehicle weight (lb) 4,000 4,000 4,000 4,000 4,000 4,000 4,000 4,000 4,000 4,000 Impact angle (deg) 25 25 25 25 25 25 25. 25 25 25 Initial speed (mph) 60 60 60 60 60 60 60 60 60 60 Dynamic deflection of barrier (ft) 1.6 0.6 0 1.9 0.5 0.3 7.2 9.1 0.7 1.2 Average longitudinal deceleration
to parallelism (g) 3.2 2.8 2.0 1.3 5.0 0.5 1.3 0.5 2.2 3.7 Average lateral deceleration to
parallelism (g) 4.6 6.1 7.4 5.1 6.0 6.5 2.2 1.9 6.5 5.5

B (42) L—D (42) 3R—(c) (..)
21
respect to occupant injury. Justification for this opinion is developed in the following paragraphs.
A much quoted source of data on the subject of en-croachnient aiigles is the work of 1-lutchinson and Ken-
nedy (38). In their study of median encroaéhments, they accumulated data that result in the curve shown in Fig-ure 17. This curve shows that 8 percent of the angles observed were greater than 25°, which would seem to
Texas Highway Dept. bridge rail Texas Highway Dept. bridge rail with lower W—section added by Texas Transportation Inst.
-A and B(42) —(a) (44)
-A (4k) i—(f) (_)
Fragmenting tube bridge rail
New York strong beam, weak post median barrier
T—E3 () -1 (47)
Texas Highway Dept. type E3
Texas double—flexbeam median barrier railing
CMB—1 (47) ...4 595—C and D ()
5 (34)
°°°'-• YG—(c) ()
New Jersey concrete median Flexible cable quardrail barrier
Figure 15. Illustrations of the barrier systems tested for. which data are given in Table 14.

22
10
9
'—'8 (I)
be
0 1 2 3 4 5 6 7 8 9 10 11 12 13 14
Longitudinal Acceleration, (g's) Figure 16. Suggested chart to determine probability of injury.
indicate that the 25° angle is not extremely high with re-spect to collision safety. However, it is possible that this curve is conservative (i.e., the curve may give angles larger than might be expected in collisions with bridge rails) because:
I. Exit speeds cannot be determined from the data in the Hutchinson and Kennedy study (38). Therefore, it can be assumed that speeds varied over a wide range. It has been argued that as speed increases the angle of impact with a barrier decreases (e.g., Ref. 1, p. 7 et seq.) It is suggested that this argument may be extended to include encroach-ment angles. It is further suggested that if speed had been determined and if only those encroachments at exit speeds over a certain value were considered, the curve shown in Figure 17 would have dropped considerably, as indicated by the shaded zone.
2. Since the Hutchinson and Kennedy data were taken in a wide, unobstructed median zone, it is probable that driver performance was significantly different (i.e., less
inhibited) from driver performance on a bridge or elevated section. On an elevated roadway, the close proximity of bridge rails is probably a constant warning against radical steering maneuvers (i.e., performance should be more inhibited).
These two factors suggest that the impact angle of 25° is probably too high for use in evaluating the potential of a given barrier for producing injuries.
To continue this argument, consider Figure .18, which includes plots of the cumulative distribution of fatal acci-dent speeds and median encroachment angles. The abscissa scale of encroachment angle was matched to the scale of accident speed in the following way:
I. Encroachment angle was assumed to be inversely re-lated to speed. This has been demonstrated for the maxi-mum turning maneuver but has not been demonstrated for the general case of roadside encroachments.
2. Boundary conditions were assumed for the end points

23
I
After
/
1 H I. Hutchinson and Kennedy (38)
(266 Encroachments)
Speculated Shift in Curve if Only Encroachments Above a Certain Speed
T - Are Considered --------i:----
5 10 15 20 25 30 35
Encroachment Angle, Degrees
Figure 17. Distribution of encroachment angles.
100
IiI
40
20
of the Hutchinson and Kennedy encroachment angle data and the fatal accident speed data (i.e., 45°—the maximum from Hutchinson and Kennedy—corresponds to 10 mph, the minimum significant speed from Fig. 2; and 2*—the 98 percentile angle from Hutchinson and Kennedy—cor-responds to 100 mph, the approximate 98 percentile speed from Fig. 2).
3. Based on these assumed end conditions, arithmetic angle and speed scales were constructed. This construc-tion resulted in the following relationship between speed and angle:
0=-0.48V+49.78 (11)
in which
o = impact angle (deg); and V = impact speed (mph).
From the figure so constructed, the following informa-tion may be obtained:
The median (50 percentile) speed is 63 mph and the median encroachment angle is 80°.
90 percent of the speeds are less than 80 mph. This speed corresponds to an encroachment angle of 11.5°.
90 percent of the angles are less than 22.5°. This angle corresponds to a speed of 57 mph.
Probability of injury, as a first approximation, is as-sumed to be directly related to acceleration and thus to the impact force on the vehicle. The average lateral force,
Fiat., is used to compare Conditions 1, 2, and 3 with the HRB Circular 482 upper-limit conditions (60-25-4,000), using
W V1' sin2 (0) Fiat' (12)
2g{AL sin(0) - B[1 - cos(0)] + D}
in which W = 4,000 Ib, A = 0.454, L = 17.5 ft, 2B = 6.5 ft, and D = 0.

100
[GURE 2
We
20
24
AVERAGE
LATERAL FORCE, CONDITION
Fiat (Ku's)
63 mph, 8°, 4,000 lb 9.6 80 mph, 11.5°,4,000lb 22.4 57 mph, 22.5°, 4,000 lb 22.8 60 mph, 25°, 4,000 lb 28.1
It is seen that Condition 4, the most widely used test condition, requires a barrier to absorb a significantly larger lateral force than any of the other three. Conditions 2 and 3, which are believed to provide an upper boundary for more than 90 percent of the bridge rail impact conditions (considering the conservatism of the Hutchinson and Ken-nedy curve), give values of lateral forces of 22.4 and 22.8 kips, respectively. If a value of 23 kips is selected to represent this range, test conditions can be designed to
After Hutchinson and Kennedy (38)
20 40 60 80 100
Fatal Accident Speed,. (mph)
I I I I 1 .45 40 30 20 10 2
Median Encroachment Angles, Degrees Figure 18. interaction of speed and encroachment angle.

25
achieve this value. For example, if test speeds of 50, 60, and 70 mph were selected, impact angles of 29.3°, 20.7°, and 15.2°, respectively, would result in an average lateral force of 23 kips. Because the median fatal accident speed was 63 mph, the lower speeds (50 and 60 mph) may be considered somewhat low for comparing the safety aspects of barriers. Therefore, the 70-mph test speed is selected.
COMMENT: On the basis of the foregoing discussion, the combined test conditions of 70 mph and 15° are more appropriate for comparing barrier systems from the vie w-point of passenger injury.
Several other observations of a general nature can be derived from the comparison of the tests of ten different rail systems in the 25° impact condition. All systems con-tained the impacting vehicle and thus were shown to be structurally adequate. Figure 19 is a bar graph showing the ten tests arranged in order of increasing probability of in-jury. The order corresponds almost directly to the degree of lateral flexibility, varying from the flexible cable guard-rail with a lateral deflection under impact of 6 ft to the concrete median barrier that had a negligible lateral deflec-tion. This effect is shown in Figure 20. Two other tests were run on the concrete median barrier at reduced angles of impact. Details of these two tests are presented in Table 15. It is seen that the probability of injury decreases as the angle decreases. For the impact angles of 25°, 15°, and 7°, the probability of injury was 0.75, 0.48, and 0.22, respectively. Taken to the extreme as the angle approaches zero, all systems, or at least those with a smooth contact surface, become equal in their potential to cause injury. That is, all rail systems approach a zero probability of injury. Going to the other extreme where the impact angle is 90°, the difference in the various systems would be maximized, with the rigid concrete median barrier having the highest potential to cause injury. It is therefore con-cluded that the concrete median barrier may be quite ac-
TABLE 15
DETAILS OF TESTS
ITEM CMB-3 CMB-4
Vehicle: Year 1963 1963 Make Chev. Chev. Weight (lb) 4,210 4,210 Impact angle (deg) 7 15
Observed: Initial speed (mph) 60.9 60.7 Dynamic deflection of barrier (ft) 0 0 Average longitudinal deceleration
to parallelism (g) 0.4 1.3 Average lateral deceleration to
parallelism (g) 2.2 4.7
Probability of injury 0.22 0.48
Severity index 0.44 0.96
ceptable from the viewpoint of safety when the more realis-tic test conditions advocated in this chapter are used. Further, the CMB system's only drawback—extreme ri-gidity—is not as critical as has been previously contended.
Skeels (39) offered the following comment:
My experience with the General Motors parapet indi-cates that the impacting angle is much more important than the speed. At an angle of 7°, there was really not much difference in apparent severity to the driver or passenger between speeds of 45 and 60 mph, but a very noticeable increase between angles of 7° and 11° at the same speed. In Table 15, I believe that the Probability of Injury Index number [0.22] is high as I have made at least 50 runs against the GM parapet at a 7° angle at 5-60 mph, with and without passengers, and no one has been close to being injured. I would not quibble about the 0.48 figure for a 15° hit, though, as I think this is realistic. I would not volunteer to drive that test—the point being that for the GM parapet the severity is quite
0.8
0.6 Weaver's Limit
a'
o 0.4 a's
Li7 H 'H
a. /
.0 S
°' 0.2
6.0 I 5.0 I 1.5 I 1.3 I 1.2 1 0.3 I 0.5 0.5 I 0.4
Test Conditions Adjosted To 4000 lb and 60 mph
Figure 19. Comparison of the ten barriers tested.

1.0
0.8
26
low for low angles but increases rapidly at the 120 to 150 point.
One other point that might be brought out is that the so-called sloped-face rigid barriers are not really rigid so far as the car and its occupants are concerned. When the wheel climbs the slope, the flexibility of the tires, sus pension, car frame, wheels, and even the interior pad-ding are brought into play to modify the rigidity of the barrier. It also allows the lateral forces to be applied directly to the strongest part of the car; namely, the wheels and suspension, instead of trying to push on the weakest part—the sheet metal. This action also explains the improved performance of the barriers with a longer and higher sloped face as the car is banked higher and the above-named flexible elements are brought into play more effectively. An ideal barrier might have a concave face 10' high and 15' deep but this would not be practi-cal, so some compromise has to be reached. This report could bring out these points as there really is no mys-tery about the reason for the good performance of sloped barriers, but many do not understand it.
The purpose of this chapter has been to consider the different values of the tolerable acceleration limits that have been proposed and to suggest the most realistic way of determining compliance with these limits.
The conclusions are:
The test condition of a 25° impact angle is extreme with respect to passenger injury criteria. A more realistic condition of 70-15-4,000 is suggested.
The toleranee limits suggested by Graham are not achievable by the best contemporary bridge rail systems when tested under the conditions of 60-25-4,000. In many
Dynamic Deflection of Barrier, (ft.)
Figure 20. Relationship between deflection and probability of injury.
cases they may not be achievable when the test conditions are 70-15-4,000.
The Weaver limits, at the 50 percent probability of injury level, may indicate the approximate boundary be-tween - minor and severe passenger injuries and should be carefully considered in determining the suitability of a particular bridge rail system.
CHAPTER FOUR
INTERPRETATION AND APPRAISAL
BRIDGE RAIL SERVICE REQUIREMENTS
NCHRP Report 86 (1) presents 10 bridge rail service re-quirements. Of these, two requirements are considered with a view to updating the information contained in the report.
The first requirement is:
1. A bridge rail system must laterally restrain a se-lected vehicle.
Strength of Barriers
The basic requirement for restraining a selected vehicle is strength. Appendix B presents nomographs that per-mit one to estimate lateral impact forces for automobiles, trucks, and buses having certain vehicle parameters, pre-viously discussed. The designer is also provided with an
estimate of the average lateral unit impact force that might be anticipated when a selected vehicle strikes a barrier de-signed for the strength requirement. These curves have been prepared using (1, Eq. 5):
V12 sin2 (0) Giat (13)
2g{AL sin(0) - B[1 - cos (0)] + D)
in which
V1 = vehicle impact velocity (fps); 0 = vehicle impact angle (deg); g = acceleration due to gravity (ft/sec2);
AL = distance from vehicle's front end to center of mass (ft);
2B = vehicle width (ft); and D = lateral displacement of barrier railing (ft).

27
Although spectacular truck collisions have occurred in which trucks have broken through bridge barriers, the oc-currence of such accidents fortunately is infrequent at the present time. As the population of trucks increases, how-ever, it may become necessary to increase design loadings for barriers or to employ sloped-face configurations of ade-quate strength to redirect colliding trucks as well as pas-senger vehicles.
Height of Barriers
Another factor entering into the strength design of a bridge barrier is the height of the barrier, and a discussion of the results from full-scale dynamic tests of selected barriers has been presented in Chapter Two. It has been noted that the tenth edition of AASHO Standard Specifications for High-way Bridges requires that a traffic railing shall be at least 27 in. high. Because automobiles have been found to get over such barriers during certain types of collisions, Chap-ter Two recommends installation of barriers higher than 27 in. It has been suggested (by General Motors Proving Ground) that barrier heights up to 54 in. would be re-quired to serve large trucks. The maximum height for a barrier is a difficult parameter to select. Lundstrom, et al., suggested:
For a rough approximation, the height of the rail should approach the height of the center of gravity of any ve-hicle using the bride. (15, p. 179)
Measurements ha been made on school buses and the height of the center of gravity has been estimated to be greater than 3 ft (assuming all seats are occupied). Simi-lar measurements and estimates indicate that loaded trucks have heights of center of gravity to and greater than 6 ft, and that of a loaded, transit-mix concrete truck may ex-ceed this height, for example, as may trucks loaded with drag lines and similar heavy equipment.
Barrier heights of 6 ft or more can certainly be achieved, as can strength adequate to restrain any impact force; how-ever, the configuration of a barrier must be considered, as well as its height and strength. Automobiles and trucks can mount some barriers more readily than others, and this fact has been put to good use in the design of sloped-face barriers.
Where accident history has warranted a higher, stronger barrier, additional height and strength have been provided for certain barrier installations on sharp curves on elevated freeways. Such installations currently appear to be the exception rather than the rule.
The available evidence indicates that a height of 32.in. is proving satisfactory for sloped-face concrete median in-stallations and for sloped-faced concrete bridge barriers on high-speed expressways. As the vehicle population changes, the height criterion must be continually reviewed and re-vised. Smaller cars and larger trucks must be accommo-dated, and barriers must not be constructed at heights that obscure merging traffic.
The trend toward barriers higher than 27 in. above the pavement is accelerating, as is the employment of sloped-face medians and parapets. A recent compilation of in-formation on this subject has been prepared by the Federal Highway Administration (e.g., Notice EN-20, May 1971).
Sloped-face concrete median barriers are being con- structed across bridges in urban areas; and, in some in-stallations on elevated expressways or in cut sections, sloped-face barriers are being installed on outer edges of the traveled way. Photographs of some of these types of installations appear in an article in the October 1971 issue of Civil Engineering (40, p. 80). Also, sloped-face me-dian barriers have been constructed of steel for installation on certain bridges where the weight of the barrier must be reduced.
The second service requirement for bridge barriers is:
2. A bridge rail system must minimize vehicle decel-erations.
It is evident that traffic barriers for use on and near bridges can be designed and constructed with adequate strength to eliminate vehicle penetrations; or, in the words of Henault and Perron:
It is always possible to obtain a barrier which is suffi-ciently strong by strengthening its components. (41, p.61)
It is also clear that such strong barriers can severely damage an errant vehicle in a collision incident. Thus, a strong traffic barrier becomes a hazard at the edge of the traveled way.
Guardrails mounted on posts set in the ground provide a movable barrier because the ground yields on impact, and this behavior has been proven to reduce the hazardous nature of such traffic barriers. However, barriers on bridges do not have this movability because they are designed with strong connections at the bridge deck.
Several proven concepts for reducing the force of impact are to:
Provide a. sloped-face configuration for barriers (e.g., New Jersey median barrier, General Motors parapet, Cali-fornia Type 20 bridge barrier).
Employ breakaway devices (e.g., New York strong beam, weak post barrier).
Install collapsible materials between strong rail and strong post (e.g., FHWA-SWRI frangible tube barrier).
Each of these concepts has been proven by full-scale crash tests, and each has advantages as well as dis-advantages.
HRB Circular 482 is reproduced in Figure 21. This cir- cular sets out requirements for full-scale dynamic testing of barriers. Many barriers have been tested at or above the maximum speed and angle of impact. Test results have been reported in Proceedings HRB (20) and in various Highway Research Records; summaries of test results on guardrails and median barriers are given in NCHRP Re- ports 36, 54, 115, and 118. A review of these reports reveals that until recently (16) few tests were conducted at the lower impact angle of 70• Thus, as was emphasized in NCHRP Report 86 (1), the strength of some barriers to laterally restrain an errant automobile has been well documented; and many barriers have been proven to have inadequate strength, usually at connections.
It is clear that a method for evaluating the results of full-scale crash tests and the behavior of existing barriers is

28
SEPPEMBER 1962
CIRCULAR 482
Highway Research Board Committee Activity
COMMITTEE ON GUARDRAILS AND GUIDE POSTS
PROPOSED FULL-SCALE TESTING PROCEDURES FOR GUARDRAILS
The Committee on Guardzails and Guide Posts has been approached on occasions to supply broad outlines for guidance to manul'acturers or agencies wishing to con-duct tests on guardrail systems. In order that such tests be conducted on as uniform a basis as possible, the fundamental requirements for testing guardrail systems are outlined by the Subcommittee on Testing Procedures, as follows:
The objectives of a guardrail system are defined to be:
To prevent a vehicle from entering the protected area behind the rail. To redirect the vehicle without material change of speed to a course
parallel to the rail. To achieve these objectives with a lateral deceleration which is tolerable
to the passengers of the vehicle.
The test section of guardrail shall be erected as follows:
Rail shall' be Installed straight and level. Post embedment must be typical of that expected in the field. The approach surface shall be smooth and stabilized or paved. The minimum length of test section shall be 150 ft, complete with vertical
supports, horizontal members and end anchorages as necessary.
The test vehicle shall be of standard design, weighing 4,000 lb 200 lb, with load, and have a center of gravity approximately 21 in. above the pavement.
Tests shall be made at a speed of 60 mph at Impact angles of 70 and 25°. Specified performance shall be attained at any point within the length of
the test Installation, and shall include tests with impact at points between 15 ft and 20 ft from each end of the installation.
It is recognized that lateral deflection of the rail is related to highway design, and may be allowed in order to reduce lateral deceleration.
The general design of the guardrail system must be such as to recognize the need of maintainability, adequate connections to bridge parapets, and the reaction of vehicles striking the approach end.
By the Subcommittee on Testing ?rocedures Edmund R. Ricker, Chairman
J. L. Beaton, A. E. Brickman M. D. Graham, S. B. Larsen, P. C. Skeels
Figure 21. Full-scale testing procedures proposed for guardrails. Source: Ref. 11.
needed, but such an evaluation technique is not at hand. Additional insight toward meeting this service requirement has been presented in Chapter Three.
Selecting levels of tolerable deceleration remains the prerogative of individual administrators, although informa-tion contained herein permits an understanding of the re-sults of a specific selection. This report does not present an optimum solution, but it does present a technique that provides an estimate of the adequacy of barriers from the viewpoint of safety.
The technique is based on the idea that a prudent man
might expect that injuries to occupants of vehicles would increase as the damage to colliding vehicles increases. It is stipulated that such a "prudent man" concept is fraught with anomalies. A discussion of the evaluation technique is contained in Appendix C.
DISCUSSION OF CURRENT DESIGN PROCEDURES
Current design procedures vary, among the several states; in general, however, bridge barriers are designed in ac-cordance with the AASHO Standard Specifications for Highway Bridges (as revised periodically). A flow chart

29
INPUTS:
AASHO Loads* Height First Cost Estimates Maintenance Reports
Formulate Design Criteria Revise Details of Connections, Rail Strength, Etc.
Bridge Barrier Selection: Metal Railing, Posts, Concrete Walls
New Information: Prototypes in use, Crash Test Data, Accidents Reports
Stress Level (AASHO Specs) Computations
Decision Criteria: Limiting Stress Height
Prepare Standard Plans, Construct
Modify AASHO Specs*
No Satisfactory Observe
Behavior of Installation
Yes
*Tenth Edition Permits Crash Tests in Lieu Of Spec. Loads
Continue Using Established Specifications and Procedures
Figure 22. Flow chart of development of bridge barrier design methods.
of the development of current design. methods is presented in Figure 22. The chart indicates the piecemeal nature of the information available upon which design criteria are formulated to produce standards for design of new bar-riers. The flow chart leads one to conclude that current design methods are based on providing adequate strength to keep automobiles from going through or over bridge bar-riers. The flow chart is presented in a systems framework and describes a subsystem synthesis of design methods that do not permit quantitative evaluation of barrier perform-ance. In the procedure shown in the diagram, the inputs are (1) specified AASHO loads, (2) an arbitrary height, (3) cost information (usually taken from recent bid tabu-lations), and, frequently, (4) reports from maintenance and other field personnel on barrier repairs. This informa-
tion is used in selecting barrier configuration, and many states prepare construction plans having alternate barriers fabricated from steel, aluminum, or concrete. Having Se-lected a barrier, the designer proceeds with computations and uses the AASHO specifications as the decision cri-teria for limiting stress and height. Plans are prepared and barriers are constructed.
Installations are observed by field personnel, supervisors from headquarters, federal officials, media representatives, and the public. Although feedback is time dependent, it leads to eventual reevaluation of barriers in use. Primarily the evaluation is aimed at the strength of the design. When collisions occur and the vehicles are restrained, the design is usually considered satisfactory and the design procedure is perpetuated. As piecemeal reports of accidents indicate

30
that barriers are inadequate in some fashion, the AASHO Specifications are revised and some configurations elimi-nated or changed. Designers reexamine standard designs and revise drawings to conform to revised specifications; this process leads to formulation of new design criteria and the cycle is repeated.
The flow chart describes the design procedure within a systems framework. The over-all evaluation of the safety of a barrier remains a subject of conjecture, because quan-titative criteria for evaluation of barriers remain unestab-lished and will remain so until a clearer expression of the requirements for barrier behavior is presented.
FULL-SCALE PROTOTYPE TESTING
Methods of estimating average impact forces were sug-gested in NCHRP Report 86 and have been extended in Appendix B of this report. Examination of data from crash tests clearly indicates that peak decelerative forces occur during a collision incident. An excellent discussion and comparison of average and peak decelerations is pre-
sented by Michie, et al. (43). These comparisons support the hypothesis that peak decelerations appear to be two to three times larger than average decelerations estimated by Eq. B-i (contained in Appendix B). These peak forces may be short in duration but need to be considered in designing a barrier.
It is the opinion of the authors that connections in bar-riers should be designed by applying a dynamic factor of 2 to 3 to the average decelerative forces estimated by Eq. B-i. This dynamic factor is needed at beam-to-beam connections, beam-to-post connections, and at base con-nections. Proper application of this dynamic factor should produce adequate connections, which in turn will provide structural continuity in post and rail systems thus reducing the probability of the snagging and pocketing of colliding vehicles.
The foregoing discussion is intended to provide guide-lines for design. However, full-scale crash testing of proto-type barriers continues to be a necessary step in design, testing, and evaluation of barriers, as indicated in Figure 22.
REFERENCES
OLSON, R. M., POST, E. R., and MCFARLAND, W. F., "Tentative Service Requirements for Bridge Rail Sys-tems." NCHRP Report 86 (1970) 62 pp. HOSEA, H. R., "Fatal Accidents on Completed Sec-tions of the Interstate Highway System." Public Roads, Vol. 36, No. 6 (1971) pp. 133-135. Personal correspondence with Mr. A. C. Estep, Traffic Engineer, California Div. of Highways, Sacramento (June 1970). Personal correspondence with Mr. W. A. Frick, Engi-neer of Traffic, Illinois Div. of Highways, Springfield (March 1971). Personal correspondence with Mr. E. M. Smith, De-partment of Traffic Engineering, Texas Highway Dept., Austin (Sept. 1970). RASMUSSEN, R. E., HILL, F. W., and RIEDE, P. M., "Typical Vehicle Parameters for Dynamics Studies." A-2542, General Motors Proving Ground (April 1970) 20 pp. BARNETT, J., "Design Loads for Guardrails." Proc. HRB, Vol. 19 (1939) pp. 131-147. "Statistical Information on Trucks and Passenger Ve-hicles." Presented annually in March Issues. Auto-motive Industries (1965-70). STONEX, K. A., "Trends of Vehicle Dimensions and Performance Characteristics." SAE •Pre print No. 539A, Presented at Atlantic City, N.J. (1962).
STONEX, K. A., "Review of Vehicle Dimensions and Performance Characteristics." Proc. HRB, Vol. 39 (1960) pp. 467-478. "Proposed Full-Scale Testing Procedures for Guard-rails." HRB Circular 482. Comm. on Guardrails and Guide Posts (Sept. 1962). AASHO, Standard Specifications for Highway Bridges, 10th Ed. (1969) pp. 5-7, 20-21. GRAHAM, M. D., "Highway Barrier Research." Prog. Rep. on New York State's Highway Barrier Research Program (Jan. 1970). (Unpublished) NORDLIN, E. F., FIELD, R. N., and HACKETT, R. P., "Dynamic Full-Scale Impact Tests of Bridge Barrier Rails." Hwy. Res. Record No. 83 (1965) pp. 132-168. LUNDSTROM, L. C., SKEEL5, P. C., ENGLUND, B. R., and ROGERS, R. A., "A Bridge Parapet Designed for Safety." Hwy. Res. Record No. 83 (1965) pp. 169-187. NORDLIN, E. F., W000STROM, J. H., HACKETT, R. P., and FOLSOM, J. J., "Dynamic Tests of the California Type 20 Bridge Barrier Rail." Hwy. Res. Record No. 343 (1971) pp. 57-74. AASHO, A Policy on Geometric Design of Rural Highways (1965) pp. 515-516. AASHO, Standard Specifications for Highway Bridges, 9th Ed. (1965) pp. 5-7 and 19-20.

31
19. BEATON, J. L., and PETERSON, H. A., "Road Barrier lection, and Maintenance of Highway Traffic Bar- Curb Investigation." California Div. of Highways riers." NCHRP Report 118 (1971) 96 pp. (Dec. 31, 1953). 35. WEAVER, G. D., "The Relation of Sidç Slope Design
20. BEATON, J. L., "Full Scale Tests of Concrete Bridge to Highway Safety." Report 626-2. (NCHRP Proj- Rails Subjected to Automobile Impacts." Proc. HRB, ect 20-7) Texas Transportation Inst. (May 1970). Vol. 35 (1956) pp. 251-267. (Unpublished).
21. GRAHAM, M. D., BURr.ETT, W. C., GIBsoN, J. L., and HYDE, A. S., "Biodynamics and Crashworthiness of FREER, R. H., "New Highway Barriers: The Practi- Vehicle Structures." Report WR 68-3, Wyle Labora- cal Application of Theoretical Design." Res. Record tories, Vol. III (Mar. 1968) p. 44. No. 174 (1967) pp. 88-189. Ross, H. E., and POST, E. R., "Criteria For Guard-
22. RUFF, S., "Brief Acceleration: Less Than One Sec- rail Need and Location On Embankments." Report ond." German Aviation Medicine WWII, Vol. I, U.S. 140-4, Texas Highway Dept. (Oct. 1971). Gov't. Printing Office (1950). 38. HuTcHIN50N, J. W., and KENNEDY, T. W., "Medians
23. STAPP, J. P., "Voluntary Human Tolerance Levels." of Divided Highways-Frequency and Nature of Ve- Impact Injury and Crash Protection, C. C. Thomas hide Encroachments." Eng. Exper. Sta. Bull. 487, Publishers, Springfield, Ill. (1970). Univ. of Illinois (1966).
24. STAPP, J. P., WADC Air Force Tech. Rep. 5915: SKEELS, P. C., Personal correspondence (Nov. 20, Part 1, "Human Exposure to Linear Deceleration" 1972). (June 1949); Part 2, "Preliminary Survey of Aft- LOKKEN, E. C., "Concrete Median Barrier Safely Re- Facing Seated Position: The Forward Facing Posi- directs Impacting Cars." Civil Eng., Vol. 41, No. 10 tion and Development of a Crash Harness" (Dec. (Oct. 1971) pp. 77-80. 1951). HENAULT, G. 0., and PERRON, H., "Research and
25. HEADLEY, R. N., "Human Tolerance and Limitations Development of a Guide Rail System for a High- to Acceleration." AGARDograph No. 48. Speed Elevated Expressway." Hwy. Res. Record No.
26. ZABOROWSKI, A. B., "Human Tolerance to Lateral 152 (1967) pp. 36-65. Impact with Lap Belt Only." Proc. Eighth Stapp Car 42. OLSON, R. M., SMITH, H. L., IVEY, D. L., and HIRSCH, Crash Conf. T. J., "Texas Ti Bridge Rail Systems." Tech. Memo.
27. ZABOROWSKI, A. B., "Lateral Impact Studies: Lap Belt No. 505-10, Texas Transportation Inst. (Apr. 1971). Shoulder Harness Investigations." Proc. Ninth Stapp 43. MICHIE, J. D., CALCOTE, L. R., and BRONSTAD, M. E., Car Crash Con f., Univ. Minnesota Press (1966).. "Guardrail Performance and Design," NCHRP Re-
28. HIRSCH, T. J., and IVEY, D. L., "Vehicle Impact At- port 115 (1971) 70 pp. tenuation By Modular Crash Cushion." Rep. No. 44. HIRSCH, T. J., STOCKER, A. J., and IVEY, D. L., 146-1, Texas Transportation Inst. (June 1969). "Energy-Absorbing Bridge Rail (Fragmenting Tube)."
29. GREGORY, R. T., and HAYES, G. 0., "Effectiveness of Tech. Memo. 505-8, Texas Transportation Inst. (Feb. Barrel Impact Attenuation System." Tech. Memo. 1970). No. 619-2, Texas Transportation Inst. (Aug. 1970). 45. STOCKER, A. J., IVEY, D. L., and HIRSCH, T. J., "New
30. WHITE, M. C., IVEY, D. L., and HIRSCH, T. J., "In- York Box-Beam Bridge Rail-Guardrail." Tech. Memo. Service Experience on Installations of Texas Modular 505-12, Texas Transportation Inst. (May 1971). Crash Cushions." Rep. No. 146-2, Texas Transporta- 46. Data from tests conducted for the Texas Highway tion Inst. (Dec. 1969). Dept. in cooperation with the FHA. (Unpublished
31. Personal correspondence with Mr. R. L. Lewis, Re- report, 1971). searchEngineer, Texas Highway Dept. (Feb.9, 1971). 47. HIRSCH, T.J., POST, E. R., and HAYES, G. G., "Ve-
32. MICFIALSKI, C. S., "Model Vehicle Damage Scale: A hide Crash Test and Evaluation of Median Barriers Performance Test." Traffic Safety, Vol. 12, No. 2 for Texas Highways." Report No. 146-4, Texas Trans- (June 1968). portation Inst. (Sept. 1972).
33. "Vehicle Damage Scale for Traffic Accident Investi- 48. SMITH, H. L., IVEY, D. L., and TAYLOR, I. J., "Vehicle gators." Tech. Bull. No. 1, Traffic Accident Data Containment and Redirection by Minnesota-Type Ca- Project, National Safety Council (1968). ble Guardrail System." Unpublished report, Minne-
34. MICHIE, J. D., and BRONSTAD, M. E., "Location, Se- sota Dept. of Highways (Mar. 1969).

32
CHRONOLOGICAL BIBLIOGRAPHY
1971
CLARY, J. N., "New Highway Bridge Dimensions for Safety." Proc. ASCE J. Transp. Eng., Vol. 97, No. TE 2 (May 1971) 11 pp.
HILTON, M. H., and REDICK, D. R., "A Study of Acci-dents Involving Highway Bridges." VHRC 70-R34, Vir-ginia Highway Research Council (Mar. 1971).
TAMANINI, F. J., "Designing Fail Safe Structures for High-way Safety." Proc. ASCE J. Transp. Eng. (May 1971) pp. 305-324.
VINER, J. G., "Experience to Date with Impact Attenua-tors." Public Roads, Vol. 36, No. 6 (Oct. 1971) pp. 209-218.
1970
MICHIE, J. D., CALCOTE, L. R., and BRONSTAD, M. E., "Guardrail Performance and Design." NCHRP Report 115 (1971) 70 pp.
NOVAK, J. R., and HENDERSON, K. W., "Major Research Studies on Signs, Lights and Guardrails," Proc. ASCE
Transp. Eng. (Nov. 1970) pp. 523-541. OLSON, R. M., POST, E. R., and MCFARLAND, W. F., "Ten-
tative Service Requirements for Bridge Rail Systems." NCHRP Report 86 (1970) 62 pp.
STONEX, K. A., NELSON, W. D., SIEGEL, A. W., GARRETT, W., and MICHALSIU, C. S., "Collision Damage Se-
verity Scale." SAE Preprint No. 700136 (Jan. 1970) 5 pp.
1969
GARRETT, J. W., and THARP, K. J., "Development of Im-proved Methods for Reduction of Traffic Accidents." NCHRP Report 79 (1969) 163 pp.
"Investment in Flexible Median Barrier Pays Dividends." Public Works, Vol. 100, No. 7 (July 1969) pp. 100-101.
MICHIE, J. D., and BRONSTAD, M. E., "Dynamic Perform-ance of Guardrail Blockout." Presented at 55th Ann. Mtg. AASHO; Southwest Res. Inst. (Oct. 1969).
MICHIE, J. D., and BRONSTAD, M. E., "Guardrail Perform-ance: End Treatments." Presented at 2nd Western Summer Mtg., HRB; Southwest Res. Inst. (Aug. 1969).
NORDLIN, E. F., AMES, W. H., HACKETT, R. P., and F0L-SOM, J. J., "Dynamic Tests of Type 9 Bridge Barrier Rail and Type 8 Bridge Approach Guardrail—Series XVII." Res. Rep. No. M&R 36412, Materials and Research Dept., State of California (June 1969).
OLSON, R. M., POST, E. R., and MCFARLAND, W. F., "Ten-tative Service Requirements for Bridge Rail Systems." NCHRP Report 86 (1970) 62 pp.
"Summary of 1968-1969 Multidisciplinary Accident In-vestigations." National Highway Accident and Injury
Analysis Center, National Highway Safety Bureau, U.S. DOT (Dec. 1969).
WEINBERG, M. I., and THARP, K. J., "Application of Ve-hicle Operating Characteristics to Geometric Design and Traffic Conditions." NCHRP Report 68 (1969) 38 pp.
1968
GRAHAM, M. D., and VAN ZWEDEN, J., "Discussion of Dynamic Tests of Steel Box Beam and Concrete Median Barriers." Hwy. Res. Record No. 222 (1968) pp. 86-98.
HIRSCH, T. J., "Barrel Protective Barrier." Tentative prog-ress memorandum on Contract No. CPR-11-5851 for the U.S. Dept. of Transportation, FHA, by Texas Trans-portation Inst. (1968) 24 pp.
MICHALSKJ, C. S., "Model Vehicle Damage Scale: A.Per-formance Test." Traffic Safety, Vol. 12, No. 2 (June 1968) pp. 34-39.
MICHIE, J. D., and CALCOTE, L. R., "Location, Selection, and Maintenance of Highway Guardrails and Median Barriers." NCHRP Report 54 (1968) 63 pp.
NORDLIN, B. F., and FIELD, R. N., "Dynamic Tests of Steel Box-Beam and Concrete Median Barriers." Hwy. Res. Record No.222 (1968) pp. 53-85.
NORDLIN, E. F., FIELD, R. N., and FOLSOM, J. J., "Dy-namic Tests of Short Sections of Corrugated Metal Beam Guardrail." Res. Rep. No. 636392-4, Materials and Re-search Dept., State of California (Oct. 1968).
"Vehicle Damage Scale for Traffic Accident Investigators." Tech. Bull. No. 1, Traffic Accident Data Project, Na-tional Safety Council (1968) 18 pp.
1967
BEATON, J. L., NORDLIN, E. F., and FIELD, R. N., "Dy-namic Tests of Corrugated Metal Beam Guardrail." Hwy. Res. Record No. 174 (1967) pp. 42-88.
DELEYS, N. J., and MCHENRY, R. R., "Highway Guard-rails—A Review of Current Practice." NCHRP Report 36 (1967) 33 pp.
FITZGIBBON, D. P., and VOLLMER, R. P. "Crash Leads Environment Study." Technical Report D5-67-2 to FAA, Aircraft Development Service, Mechanics Research, Inc. (Feb. 1967).
GALATI, J. V., "Median Barrier Photographic Study." Hwy. Res. Record No. 170 (1967) pp. 70-81.
GLENNON, J. C., and TAMBURRI, T. N., "Objective Criteria for Guardrail Installation." Hwy. Res. Record No. 174 (1967) pp. 184-206.
GRAHAM, M. D., "New Concepts in Guardrail Design." Civil Eng., Vol. 37, No. 1 (Jan. 1967) pp. 64-69.
GRAHAM, M. D., BURNETT, W. C., GIBsON, J. L., and FREER, R. H., "New Highway Barriers: The Practical

33
Application of Theoretical Design." Hwy. Res. Record No. 174 (1967) pp. 88-183.
HENAULT, G. 0., and PERRON, H., "Research and De-velopment of a Guide Rail System for a High-Speed Elevated Expressway." Hwy. Res. Record No. 152 (1967) pp. 36-65.
"Highway Design and Operational Practices Related to Highway Safety." Report of the Special AASHO Traffic Safety Committee (Feb. 1967) 71 pp.
HUELKE, D. F., and GIKAS, P. W., "Nonintersectional Automobile Fatalities—A Problem in Roadway Design." Hwy. Res. Record No. 152 (1967) pp. 103-119.
JEHU, V. J., and LAKER, I. B., "The Wire-Rope Slotted-Post Crash Barrier." RRL Rep. LR 127, Road Res. Lab. (Brit.) (1967) 28 pp.
JEHU, V. I., and PRISK, C. W., "Research on Crash Bar-riers, Their Design, Warrants for Use, Safety Aspects, Testing and Research." Report of the Organization for Economic Cooperation and Development (Dec. 1967) 65 pp.
JuRKAT, M. P., and STARRETT, J. A., "Automobile-Barrier Impact Studies Using Scale Model Vehicles." Hwy. Res. Record No. 174 (1967) pp. 30-41.
"New Highway Barriers: The Practical Application of Theoretical Design." Rep. 67-1, Bur. Physical Res., New York Dept. of Public Works (May 1967).
NORDLIN, E. F., FIELD, R. N., and STOKER, I. R., "Dy-namic Tests of Concrete Median Barriers—Series XVI." Res. Rep. No. M&R 636392-2, Materials and Research Dept., State of California (Aug. 1967).
NORDLIN, E. F., FIELD, R. N., and STOKER, J. R., "Dy-namic Tests of Box Beam Median Barrier—Series XIV." Res. Rep. No. M&R 636392-1, Materials and Research Dept., State of California (Aug. 1967).
NORDLIN, E. F., FIELD, R. N., and STOKER, J. R., "Dy-namic Full-Scale Impact Tests of Steel Bridge Barrier Rails—Series XI." Res. Rep. No. M&R 36356, Mate-rials and Research Dept., State of California (June 1967) 37 pp.
TUTT, P. R., "Guard Rail and the Safe Operation of High-ways." Proc. ASCE I. Highway Div., Vol. 93, No. HW2, (Nov. 1967) pp. 53-65.
U.S. CONGRESS. Hearings Before the Special Subcommittee on the Federal Aid Highway Program, Committee on Public Works, House of Representatives (May, June, July 1967) 1243 pp.
1966
BEAUMIER, F. B., "Auto Safety." Iron Age, Vol. 197 (Apr. 14, 1966).
"Bituminous Base Coating Used on Highway Guard Rails Includes Colored Ceramic Granules." Materials Protec-tion, Vol. 5, No.4 (Apr. 1966).
BRAY, A., "Factors Affecting the Tightening Characteristics of Bolts." Experimental Stress, Vol. 6, No. 8 (Aug. 1966) pp. 409-419.
"Campaign to Reduce Accidents on Highways Started." North Carolina Roadways (July-Aug. 1966).
"Center Barriers Save Lives." New Jersey State DOT,
15 pp.
CLARK, C. C., Testimony Before the Committee on Inter-state and Foreign Commerce, House of Representatives, Congress of the United States (May 3. 1966).
FIELD, R. N., and DOTY, R. N., "A Dynamic Full Scale Impact Test on a Precast, Reinforced Concrete Median Barrier—Series XII." H.W.O. 14030-951127, Proj W.O. 36381, Materials and Research Dept., State of California (Oct. 1966).
FRASER, T. M., "Human Response to Sustained Accelera-tion." SP-103, NASA (1966) 136 pp.
HIRSCH, T. J., and EDWARDS, T. C., "Impact Load-Deformation Properties of Pile Cushioning Materials." Research Report 33-4, Texas Transportation Inst. (May 1966).
HUTCFLINSON, J. W., and KENNEDY, T. W., "Medians of Divided Highway—Frequency and Nature of Vehicle Encroachments." Eng. Exp. Sta. Bull. 487, Univ. Illinois (1966) pp. 1-35.
KASSEL, J. T., TAMBURRI, T. N., GLENNON, J. C., and PETERSEN, A., "Objective Criteria for Guardrail In-stallation." California Div. of Highways (July 20, 1966).
NORDLIN, E. F., STOKER, J. R., FIELD, R. N., and DOTY, R. N., "A Dynamic Full Scale Impact Test on a Precast Reinforced Concrete Median Barrier—Series XII." Highway Res. Rep. H.W.O. 14030-951127, State of California (Oct. 1966).
OLSON, R. M., "Instrumentation and Photographic Tech-niques for Determining Displacement, Velocity Change, and Deceleration of Vehicles with Break-Away Sign Structures." Res. Rep. 68-3, Texas Transportation Inst. (Sept. 1966) 119 pp.
"Part I: Impact!" Ford Science Front, Vol. 3, No. 1 (Mar. 1966).
1965
DUNLOP, D. R., "Safety Harness Research." Proc. Seventh Stapp Car Crash Conf., Springfield, III. (1965).
"Effective Test of Hydraulic Crash Barrier." Highways and Bridges (English) (Oct. 27, 1965) p. 17.
FIELD, R. N., and JOHNSON, M. H., "Dynamic Full Scale Impact Tests of Cable Type Median Barriers—Test Series IX." Project W.O. 6302, Materials and Research Dept., State of California (June 1965).
FIELD, R. N., and PRYSOCK, R. H., "Dynamic Full Scale Impact Tests of Double Blocked-Out Metal Beam Bar-riers and Metal Beam Guard Railing—Series X." Proj-ect W.O. 6337, Materials and Research Dept., State of California (Feb. 1965).
JoHNsoN, R. T., "Freeway Fatal Accidents: 1961 and 1962" Hwy. Res. Record No. 99 (1965) pp. 117-137.
LUNDSTROM, L. C., "A Bridge Parapet Designed for Safety." Hwy. Res. Record No. 83 (1965) pp. 169-187.
MCALPIN, G. W., GRAHAM, M. D., BURNETT, W. C., and MCHENRY, R. R., "Development of an Analytical Pro-cedure for Prediction of Highway Barrier Performance." Hwy. Res. Record No. 83 (1965) pp. 188-200.
NORDLIN, E. F., and FIELD, R. N., "Dynamic Full-Scale Impact Tests of Bridge Barrier Rails." Hwy. Res. Rec-ordNo. 83 (1965) pp. 132-168.

34
PLATUS, D. L., PLATIJS, D. H., CUNNINGHAM, P. J., Ep-STEEN, G. E., MAROVICH, F. A., FREERMAN, H. H., and MAZELSKY, B., "Concepts of Multiple Impact Study of Energy Absorption." CR 273, NASA (Aug. 1965).
ROBERTSON, J. A., "A Major Guide Rail Galvanizing Pro-gram." Public Works, Vol. 95, No. 10 (Oct. 1964) pp. 114-117.
SACKS, W. L., "Effect of Guardrail in a Narrow Median upon Pennsylvania Drivers." Hwy. Res. Record No. 83 (1965) pp. 114-131.
SHARP, J. E., "Problems with the Three-Point Belt Installa-tions and Possible Solutions, Part I." Proc., Seventh Stapp Car Crash Con/., Springfield, Ill. (1965).
"Something New in Guard Rail Design." Fence Industry, Vol. 8, No. 3 (Apr. 1965) p. 23.
"Tests of Energy-Absorbing Traffic Barriers." HRB Bull. 185 (1965).
VOSTREZ, J., and LUNDY, R. A., "Comparative Freeway Study." Hwy. Res. Record No. 99 (1965) pp. 157-199.
1964
AASHO, Interim Specifications for Bridge Railings. (1964).
BROWN, C. B., "A Review and Evaluation of Bridge Bar-rier Design and Experiment Procedures." Univ. of Cali-fornia, Berkeley (Dec. 1964) 66 pp.
CLARK, C. C., "Human Vibration and Impact Protection by Airbag Restraint Systems." Martin-Baltimore Eng. Rep. 13539, Life Sciences Dept., Martin Co., Baltimore, Md. (June 1964).
"Determination of Need and Geometric Requirements for Highway Guardrail." HRB Spec. 'Rep. 81 (1964) 41 pp.
"Dynamic Full-Scale Impact Tests of Bridge Barrier Rails." California Div. of Highways (1964).
"Geometric Requirements for Guardrail in Median." HRB Spec. Rep. 81 (1964) pp. 26-33.
JEHU, V. J., "Vehicle Guard Rails for Roads and Bridges." Seventh Congress, Rio de Janeiro, Aug. 10-16, 1964. Reprint from the Preliminary Publications, VIe 3, In-tern. Assoc. Bridge and Structural Eng. (Zurich, Switzer-land), pp. 1097-1106.
JEHU, V. J., "Safety Fences and Kerbs." Traffic Eng. Con-trol, Vol. 5, No. 9 (Jan. 1964) pp. 534-540.
JOHNSON, R. T., "Effectiveness of Median Barriers." Cali-fornia Div. of Highways (Aug. 1964).
KNOSLEY, H. L., "Wood Break-Away Posts Provide Safety for Motorists." Traffic Eng., Vol. 34, No. 11 (Aug. 1964).
"Road Research Laboratory." England Tests on Belgium Kerb Rail (1964).
"Safety Fences." The Engineer, Vol. 217, No. 5655 (1964) p. 1031.
1963
"Design and Static Stress Analysis of Bridge Guard Rail Posts." Steel Founders' Soc. of America (1963).
"Dynamic Tests of Aluminum Bridge Rails." Lehigh Univ. for ALCOA and Reynolds Metal Co. (1963).
"Dynamic Tests of Aluminum Bridge Rails." ALCOA, Reynolds Metal Co., and Howe Engineering Co. (1963).
"Dynamic Tests of Aluminum Guard Rails." Lehigh Univ. for ALCOA and Reynolds Metal Co. (1963).
GRIME, G., "Effect of Seat Harness on Movement of Car Occupant in a Head-on Collision." Hwy. Res. Record No. 4 (1963) pp. 76-90.
HENAULT, G. G., "Etudes sur differents genres de glissieres de securite Boulevard Metropolitan, Montreal." Eng. I., Vol. 46 (Dec. 1963) pp. 21-27.
HENAULT, G. G., "Highway Guide Rails." AGM 63-CIV-C. 77th Annual General Mtg. paper, Eng. Inst. of Canada, Quebec, May 22-24, 1963. Eng. J., Vol. 46, No. 4 (Apr. 1963) p. 59.
HULBERT, S., and WoJCnc, C., "Human Thresholds Re-lated to Simulation of Inertia Forces." Hwy. Res. Rec-ord No. 25 (1963) pp. 106-109.
JOHNSON, R. T., and TAMBURRI, T. N., "Freeway Guard-rail: Installation Made Where Genuine Hazard Exists." California Highways and Public Works, Vol. 42, Nos. 3-4 (Mar.-Apr. 1963) pp. 58-60.
LEVONIAN, E., CASE, H. W., and GREGORY, R., "Predic-tion of Recorded Accidents and Violations Using Non-driving Predictors." Hwy. Res. Record No. 4 (1963) pp. 50-61.
MICHELSON, I., ALDMAN, B., T0URIN, B., and MITCHELL,
J., "Dynamic Tests of Automobile Passenger Restrain-ing Devices." Hwy. Res. Record No. 4 (1963) pp. 62-75.
New York State Department of Public Works, "Develop-ment of an Analytical Approach to Highway Barrier Design Evaluation." Res. Rep. 63-2 (May 1963).
SEvERY, D. M., "Correlates of 30-Mph Intersection Col-lisions." Hwy. Res. Record No. 4 (1963) pp. 1-3 1.
STONEX, K. A., "Summary of Crash Research Techniques Developed by General Motors Proving Grounds." Gen-eral Motors Eng., Vol. 10, No. 4 (1963) pp. 7-11.
STONEX, K. A., and SKEELS, P. C., "Development of Crash Research Techniques at the General Motors Proving Ground." Hwy. Res. Record No. 4 (1963) pp. 32-49.
"Synopsis of Proposed Program for Establishing Test Specification for Bridge Railing Systems." National Castings Co. (1963).
1962
BEATON, J. L., FIELD, R. N., and M05K0WITz, K., "Me-dian Barriers: One Year's Experience and Further Con-trolled Full-Scale Tests." Proc. HRB, Vol. 41 (1962) pp. 433-468.
ELLIOTT, A. L., "A Structural Future for Alloy Steels." HRB Bull. 346 (1962) pp. 27-40.
ESGAR, J. B., "Survey of Energy Absorption Devices for Soft Landings of Space Vehicles." NASA -TND-1308 (June 1962).
"Full Scale Testing Procedures for Guardrails and Guide Posts." Committee on Guardrails and Guide Posts, pro-posed action for the committee, HRB Circular No. 482 (Sept. 1962).

35
Highway Hardware. U.S. Steel Corp., Tech. Notebook, Vol. 2, "Bridge Rail, Light Standards, Guard Rail, Right-of-Way Fence" (1962).
IRvING, A., "A Review of Work on the Design and Testing of Vehicle Crash Barriers." Res. Note No. LN/212/AI, Road Res. Lab. (Brit.) (1962).
IVES, H. S., "Cable-Chain Link Median Barrier Perform-ance Record in Connecticut." Am. Highways, Vol. 41, No. 2 (Apr. 1962) pp. 10-25.
MCGHEE, J. R., "A Preliminary Experimental Investiga-tion of an Energy Absorption Process Employing Frangi-ble Metal Tubing." NASA -TND-1477 (Oct. 1962).
PALMER, D. R. G., "Center Barriers Save Lives." New Jersey State DOT (1962).
"Put Logic into. Locating Guardrail." Western Construc., Vol. 37,No. 11(1962) p. 86.
"Suggested Specifications for Structures of Aluminum Al-loys 6061-T6 and 6062-T6." Paper No. 3341, Proc. ASCE J. Struct. Div., Vol. 88, No. ST6 (Dec. 1962) pp. 1-45.
"Suggested Specifications for Structures of Aluminum Al-loy 6063-T5 and 6063-T6." Paper No. 3342, Proc,ASCE I. Struct. Div., Vol. 88, No. ST6 (Dec. 1962) pp. 47-95.
ZURCHER, H., "Types, Design and Performance of Guard Rails." Eidgenassische Technesche Hochschule, Zurich (From Jehu, 1964, and Irving, 1962).
1961
ALBERT, C. J., "Prediction of the Lateral-Face Lateral-Deflection Characteristics of Highway Barriers." Cornell Aeron. Lab. (1961).
BASTONE, A. L., "Guard Rail Comparative Testing Pro-gram." Prepared by Owens-Corning Fiberglas Corp. for Rhode Island DOT (Jan. 1961) 40 pp.
CICHowsIu, W. G., SKEELS, P. C., and HAWKINS, W. R., "Appraisal of Guardrail Installations by Car Impact and Laboratory Tests." Proc. HRB, Vol. 40 (1961) pp. 13 7-178.
FRANCK, R. J., "Design and Shape Analysis of Cast Steel Guardrail Posts." Proc. HRB., Vol. 40 (1961) pp. 125-136.
KRAFFT, J. M., "On Effects of Carbon and Manganese Content and of Grain Size on Dynamic Strength Prop-erties of Mild Steel." U.S. Naval Research Laboratory, Bureau of Ships, Department of the Navy, Washington, D.C., Serial No. SSC-139, Final Report of Project SR-142 to the Ship Structure Committee, National Academy of Sciences, (Secretary, Ship Structure Committee, U.S. Coast Guard Headquarters, Washington, D.C.) (Dec. 27, 1961) 28 pp.
RYAN, J. J., "Reduction in Crash Forces." Fifth Stapp Automotive Crash and Field Demonstration Conf. (Sept. 14-16, 1961) pp. 48-89.
SEVERY, D. M., MATTHEWSON, J. H., and SIEGEL, A. W., "Barrier Collisions. IV. An Evaluation of Motorist Force and Injury Control Systems." Proc. HRB, Vol. 40 (1961) pp. 541-556.
1960
BEATON, J. L., and FIELD, R. N., "Dynamic Full-scale Tests of Median Barriers." HRB Bull; 266 (1960) pp. 78-125.
BEATON, J. L., and FIELD, R. N., "Dynamic Full-Scale Tests of Bridge Rails." California Div. of Highways (Dec. 1960).
CROSBY, J. R., "Cross-Median Accident Experience on the New Jersey Turnpike." HRB Bull. 266 (1960) pp. 63-77.
MosKowITz, K., and SCHAEFER, W. E., "California Me- dian Study-1958." HRB Bull. 266 (1960) pp. 34-62.
SHIELD, R., and COVINGTON, C., "High-Velocity Impact Cushioning." Univ. of Texas (Sept. 1960).
STONEX, K. A., "Roadside Design for Safety." Proc. HRB, Vol. 39 (1960) pp. 120-156.
STRASSENMEYER, D. A., "Highway Guide-Rail Study." Connecticut DOT (1960).
TAKAHASHI, N., "Experiments to Determine the Impacts Given to Several Road Guardrails." I. Japan Soc. Civil Eng., Vol.45 (1960) p. 21.
TAKAHASHI, N., "Report on D.A.V.-Auto Guard Strength Tests-Field Tests by Automobiles." Transport Tech-nical Research Inst. and Ministry of Transportation, Tokyo (1960).
1959
BEATON, J. L., and FIELD, R. N., JR., "Impact Tests: Bar-rier Test Crashes Reveal Valuable Data." California Highways and Public Works, Vol. 39, Nos. 7-8 (July-Aug. 1959) pp. 9-16.
EIBAND, A. M., "Human Tolerance to Rapidly Applied Accelerations: A Summary of Literature." NASA Memo 5-19-59 (June 1959) p. 6.
GRAY, R., "Slopes vs. Guardrails." Idaho Dept. of High-ways (1959) pp. 3 1-41.
"Guard Rails Cut Expressway 'Cross-over' Deaths." Traffic Safety Assoc. of Detroit Bull., Vol. 17, No. 10 (1959)
p. 5. LARSEN, P. M., and PETERSON, J. S., "Guard Fences in
Denmark." Intern. Road Safety and Traffic Rev., Vol. 6, No. 4 (Autumn 1958) pp. 37-38; Highway Res. Abstr., Vol. 29, No. 2 (February 1959) p. 18.
LVNDSTROM, L. C., and SKEELS, P. C., "Full-Scale Ap-praisals of Guardrail Installations by Car Impact Tests." Proc. HRB, Vol. 38 (1959) pp. 353-355.
"New Look at Bridges." Precision Metal Moulding, Vol. 17, No.3 (1959) p. 40.
"Race Track Railing of Reinforced Plastics." Modern Plastics, Vol. 37, No. 1 (Sept. 1959) p. 159.
SEVERY, D. M., MATHEWSON, J. H., and SIEGEL, A. W., "Automobile Head-On Collisions, Series II." SAE Trans., Vol. 67 (1959) pp. 238-262.
1958
"A Study of Accident Experience Before and After the Installation of a Median Barrier on the San Bernardino Freeway." California Div. of Highways (1958).

36
"Barrier Separates Traffic Lanes (Isle-Guard)." Public Works, Vol. 89, No. 9 (Sept. 1958) P. 114.
BEATON, J. L., "Inspection and Tests of Welding of High-way Bridges." Proc. ASCE J. Struct. Div., Vol. 84 (Dec. 1958) p. 24.
"Erection and Maintenance of Guardrail." (Michigan Practice) Public Works, Vol. 89, No. 9 (Sept. 1958) p. 102.
"Guard Fences in Denmark." Intern. Road Safety and Traffic Rev., Vol. 6, No. 4 (1958) p. 37.
"Highway Barriers." Eng. News-Record, Vol. 160, No. 20 (1958) P. 69.
MosKowlTz, K., and SCHAEFER, W. E., "California Me-dian Study-1958." California Div. of Highways (1958).
PEDERSON, N. L., MATHEWSON, J. H., and SEVERY, D. M., "An Energy-Absorbing Barrier for Highways." HRB Bull. 185 (1958) pp. 19-29.
"Results of Rail Post Tests Conducted 'by the Bridge Di-vision of the Texas Highway Department." Texas High-way Dept. (1958).
SEVERY, D. M., and MATHEWSON, J. H., "Automobile Bar-riers and Rear End Collisions Performance." SAE Pre-print 62C (1958)61 pp.
SEVERY, D. M., MATHEWSON, J. H., and PEDERSON, N. L., "An Energy-Absorbing Barrier for Highways." HRB Bull. 185 (1958) p. 19.
SKELTON, R. R., "Crash Barrier Tests on Multiflora Rose Hedges." HRB Bull. 185 (1958) pp. 1-18.
"Tests of Energy-Absorbing Traffic Barriers." HRB Bull. 185 (1958) 29 pp.
TRESIDDER, J. 0., "An Investigation into the Use of a Special Safety Kerb on Dangerous Bends." Res. Note No. RN/3244/J.OT Road Res. Lab. (unpublished) (1958).
1957
AASHO, Specifications for Highway Guards. (1957). BURG, W. A., "About Highway Guardrails." (Arizona
Practice) Rural Roads, Vol. 7, No. 5 (Sept.-Oct. 1957) pp. 38-40, 43-44.
FIELD, R. N., and BEATON, J. L., "Final Report of Full Scale 'Dynamic Tests of Bridge Curbs and Rails." Cali-fornia Div. of Highways (Aug. 30, 1957).
KUHLMAN, H. F., and SAYERS, V. M., "Strength and De-flection Tests of Various Materials Used as Guardrail Posts." California Div. of Highways (1957).
"Oregon to Use New Type Highway Median Barriers." Pacific Builder and Engineer, Vol. 63, No. 6 (June 1957) p. 89; Highway Res. Abstr., Vol. 27, No. 10 (Nov. 1957) p. 9.
SKELTON, R. R., "Crash Barrier Tests on Multi-Flora Rose Hedges." Public Roads, Vol. 29, No. 11(1957) p. 245.
"Strength and Deflection Tests of Various Materials Used as Guard Rail Posts." California Div. of Highways (1957).
"You Can Set 2,000 Feet a Day When You Streamline Your Methods of Setting Guard Rail." Construction Equipment, Vol. 16, No. 6 (Dec. 1957) pp. 32-34.
1956
AYRE, R. S., and HILGER, M. A., "Dynamics of Highway Guardrails: Laboratory Experiments (II)." Proc. HRB, Vol. 35 (1956) pp. 237-250.
BEATON, J. L., "Full-Scale Tests of Concrete Bridge Rails Subjected to Automobile Impacts." Proc. HRB, Vol. 35 (1956) pp. 251-267.
BILLION, C. E., "Effect of Median Dividers on Driver Be-havior." HRB Bull. 137 (1956) pp. 1-17.
FREDERICKS, R. H., "Current Crash Test Data." SAE I., Vol. 64 (Oct. 1956) pp. 25-27.
HAYNES, A. L., "Automobile Collision Impact Phenomena." HRB Bull. 142 (1956) pp. 1-10.
"Median Design, Effect on Traffic Behavior." HRB Bull. 137 (1956) 26 pp.
PESMAN, G. J., and EIBAND, A. M., "Crash Injury." NACA Technical Note 3775 (Nov. 1956) p. 13.
SEVERY, D. M., and BARBOUR, P., "Acceleration Accu-racy: Analyses of High-Speed Camera Film." J. Soc. Motion Picture Television Engs., Vol. 65, No. 2 (Feb. 1956) pp. 96-99.
SEVERY, D. M., and MATHEWSON, J. H., "When a Car Crashes." SAE I., Vol. 64 (Nov. 1956) p. 47.
1955
AYRE, R. S., and ABRAMS, J. I., "Dynamics of Highway Guardrails: Laboratory Experiments (I)." Proc. HRB, Vol. 34 (1955) pp. 162-172.
AYRE, R. S., ABRAMS, J. I., and HILGER, M. A., "Dynamics of Vehicle Impact Against Highway Guardrails." Dept. Civil Eng. Tech. Rep. No. 5, Johns Hopkins Univ. (Dec. 1955) 112 pp.
"Guard Rail Tests." Väg-och Vattenbyggnads-tyrelsen, Special rapport 4, Stockholm (1955).
"Summary of Guardrail Questionnaire." HRB Circular 306 (Dec. 1955) 16 pp.
1954
AYRE, R. S., and ABRAMS, J. I., "Dynamics of Guardrail Systems." Proc. HRB, Vol. 33 (1954) pp. 201-210.
ISRAEL, R. J., "Flared Guard Railing." California High-ways and Public Works, Vol. 33, Nos. 3-4 (Mar.-Apr. 1954) pp. 54-55.
KENYON, R. H., "Warrants for the Use of Guard Rails and Guide Posts." Proc. Western Assoc. State Highway Officials (1954) pp. 175-178.
SEVERY, D. M., and MATHEWSON, J. H., "Automobile-Barrier Impacts." HRB Bull. 91 (1954) pp. 39-54.
WEST, M. H., "Guard Railing Reduces Severity of Acci-dents." California Highways and Public Works, Vol. 33 (1954) pp. 25.
1953
BEATON, J. L., "Structural Weidment Inspection." Proc. ASCE, Vol. 79 (Aug. 1953).
BEATON, J. L., and PETERSON, H. A., "Road Barrier Curb Investigation." California Div. of Highways (Dec. 31, 1953).

37
"City and Railway Collaborate: Invent New Pavement Guard." Eng. News-Record, Vol. 151, No. 14 (Oct. 1, 1953) p. 37.
"Highway Guard Rail Holds Car to Road." Contractors and Eng., Vol. 50, No. 8 (Aug. 1953) p. 73.
TELFORD, E. T., and ISRAEL, R. J., "California Median Study." Proc. HRB, Vol. 32 (1953) pp. 208-231.
1952
BOESGAARD, E., "Safety Wall to Prevent Road Accidents—World Success of a Danish Invention." Danish Foreign Office Journal No.5 (1952).
"Bridge Has Five Miles of Aluminum Railings." Contrac-tors and Eng., Vol. 49, No. 2 (Feb. 1952) p. 62.
ISRAEL, R. J., "Guard Rails Have a Flare for Safety." Western Construc., Vol. 27, No. 6 (June 1952) pp. 94, 164.
1951
AASHO, Specification for Highway Guards. (1951) 19 pp. "Concrete Safety Guard for Highways." Roads and Eng.
Construct. (Canada), Vol. 89, No. 3 (Mar. 1951) p. 88. "Safe Shoulder: New Highway Railing Holds Swerving
Cars to Road." Life, Vol. 13, No. 9 (Aug. 27, 1951) pp. 43-44.
STAPP, J. P., "Human Tolerance to Deceleration." J. A via-tion Med. (Feb. 1951) pp. 42-45, 85; Tech. Data Digest, Vol. 16, No. 5 (May 1951); Highway Res. Abstr., Vol. 21, No.6 (June 1951) p. 5.
1950
FINKBINER, N. M., "Highway Guard Fence." Tech. Bull. No. 34, Oregon State Highway Div. (1950).
"Flex-Beam Increases Safety of New Intersection." High-way Magazine, Vol. 41 (Oct. 1950) pp. 224-226.
"Human Decelerator Which Duplicates Crash Landings Tells How Much Stopping Force Man Can Withstand." Central Air Documents Office, Tech. Data Digest, Vol. 15, No. 2 (Feb. 1, 1950); Highway Res. Abstr., Vol. 20, No. 3 (Mar. 1950).
KENYON, R. H., "Road Guard and Guide Posts." Proc. WASHO (1950) pp. 139-140.
1949
FINKBINER, N. M., "Beam Type Guardrail Tests." Proc. AASHO (1949) pp. 272-278.
STArr, J. P., "Iluniaji Expusures to Linear Deceleration. I. Preliminary Survey of Aft-Facing Seated Position." AF Tech. Rep. No. 5915 (June 1949) p. 16, USAF Air Material Command, Wright Patterson Air Force Base, Dayton, Ohio.
1942
"Design of Highway Guards." HRB Current Road Prob-lemsNo. 2 (1942).
1941
RAHN, G. A., "Report of Committee on Highway Guard—Tests and Studies, 1924-1941." Proc. HRB, Vol. 21 (1941) pp. 156-163.
1940
"Report on Erection and Maintenance of Highway Guard." Bull. No. 73, Am. Road Builders Assoc. (1940).
"Report of Tests on Highway Guard Posts for Bethlehem Steel Company." Pittsburgh Testing Lab. (1940).
1939
BARNETT, J., "Design Loads for Guardrails." Proc. HRB, Vol. 19 (1939) pp. 131-143.
BRICKMAN, A. E., "Discussion on Design Loads for Guard- rails." Proc. HRB, Vol. 19 (1939) pp. 144-147.
RAHN, G. A., "Report of Committee on Guard Rails." Proc. HRB, Vol. 19(1939) pp. 129-130.
1938
"Report of Problem Committee on Guard Rail." Bull. No. 53, Am. Road Builders Assoc. (1938).
1934
FREEMAN, P. J., "Tests of Highway Guardrail." Proc. HRB, Vol. 14 (1934) p. 113.
SLACK, S. B., "Guard Rails—Safe Design." Civil Eng. (1934) p. 413.
"Tests of Various Highway Guard Rails." Rep. 34-2, Missouri State Highway Comm. (1934).

38
APPENDIX B
DESIGN NOMOGRAPHS
In NCHRP Report 86 a mathematical equation was de-veloped to predict the average impact force perpendicular to a barrier following a collision. The equation for aver-age lateral impact force is:
WV12 sin(0) F12 = (B-i)
2g{AL sin(0) - B[i - cos(0)] + D}
Eq. B-i has been combined with an equation that predicts impact angle as a function of impact speed, coefficient of friction (1) between tires and pavement, and the lateral distance (d) between a vehicle and a barrier before the former turns into a collision course with the latter. The resulting equation is:
0 cos-111
fgdl (B-2)
Eq. B-2 is used to develop the nomographs shown in Fig-ures B-i through B-4. In each of the nomographs, the product of / and d has been taken as a parameter, thus permitting the nomograph user to vary the value of either one in making estimates. For example, taking / X d = 20, when! = 0.2, d = 100 ft; when 0.5, d = 40 It; or when .f=0.8,d=25ft. Or, if the roadway width is known, the coefficient of fric-tion may be varied to produce a range of values of the parameter I X d for use in the nomographs. A study of vehicle parameters is presented in Chapter Two, and this information was used to divide vehicle population into three groups: (i) automobiles, (2) trucks, and (3) buses.
Automobiles of varying weights are modeled in Figure B-i, and parameter D is shown for each of three vehicle weights. Trucks of varying weights are modeled in Fig-ure B-2 for unyielding barriers (D = 0) and in Figure B-3 for barriers capable of displacing 1 ft (D = i) while re-maining intact. Buses are modeled in Figure B-4.
USE OF NOMOGRAPHS
The nomographs may be entered either from the horizon-tal axis with a specified impact speed or from the vertical axis with a specified impact angle. An example of the first case (impact velocity specified) is shown in Figure B-i.
Entry to the lower nomograph is made from the horizontal axis (e.g., V1 = 60 mph) a vertical line (Line A) is con-structed to intersect a selected value of I X d (e.g., / X d 20) a horizontal line (Line B) may be constructed to per-mit an estimate of the impact angle (0 = 23°). The same results could be obtained by using Eq. B-2. The horizontal line also crosses the parametric values of barrier displace-ment for various vehicle weights. Assuming an automobile weight of 4,000 lb (dashed line), one can estimate the average impact force by proceeding as follows: construct a vertical line (Line C), from the intersection of Line B and the dashed line representing a 4,000-lb car, extend Line C until it intersects the specified impact speed (in the exam-ple, 60 mph), finally construct a horizontal line (Line D) and estimate the average impact force on the right as ap-proximately 26 kips. The average unit impact force per-pendicular to the barrier is read on the left as 6.5 G (which is also an estimate of the average vehicle deceleration perpendicular to the barrier). The same results could be obtained by using Eq. B-i.
The estimates of impact force obtained by this pro-cedure are based on several assumptions, which were stated in NCHRP Report 86. It is important to reiterate two of these assumptions: (1) decelerations are constant during the time interval required for the vehicle to become par-allel to the barrier, and (2) the lateral component of velocity is zero after the vehicle becomes parallel to the barrier. The first of these assumptions disregards the effect of peak decelerations, and the second implies that the impact force is reduced to zero when the vehicle becomes parallel to the barrier.
Application of the nomographs for estimating lateral impact forces will produce estimates of the average forces, which are below peak values. It is suggested that connec-tions may be designed by applying an appropriate dy-namic factor to the forces obtained from the nomographs. Current information suggests a dynamic impact factor for peak forces between 2 and 3. Thus, in the example cited the peak impact force on the system could be on the order of 52 kips to 78 kips for purposes of designing connections.

.' 10.0 0
. C 0
4C
IC
0
30.0- l-40.0-I----50.0
CA CL
240320
40.0 w
Cr C)
0 LL
- -18.0-- -24.0- - 30.0 C-)
a-
-J 4
12.0- -160— -200 I- 4 -J Lii CD
—6.0-- -8.0— -10.0 Ix
[.1oSIS]
3000.Ib.14000 lb.! 5000 lb.
39
17'
4 VI,2OmP
tro~'qo 0-~
.4J2! 5 - '. . - .30
4. .... -_
td ' 2o
/ - 10
72'i-7 MANUFACTURERS LISTED
AUTOMOBILES 4,000 -
, 5,000 C I I I
0 10 20 30 40 50 60 70 80
VL, VEHICLE SPEED (MPH)
Figure B-i. Average lateral deceleration and impact force of automobiles as a function of roadway, vehicle, and traffic railing characteristics.

Ml
4(
ci a)
21 LL
- / a
AOVO
--
VI 20mPh
D OF //X::\ '..-.---.----. 10
T . ,-' -,
/20
MANUFACTURERS LISTED GROSS VEHICLE WEIGHT (GVW)
60.000 50.000 30.000 TRUCKS 40.000 ---- 20.000 I I
40
VEHICLE WEIGHT IN KIPS 20 60
—200 4300-1-4001-500 4-600
iF 160-
j-24O--32O-4OO j 480 0.
U
0 120 1180244300360
Ii.
I-U
80 -JI20---I60-200-j-240 a: U I.- 4 -J
—4060 80 100 I40
Ui
4 a:
-01- 0101010
10 20 30 40 50 60 70 80
V1, VEHICLE SPEED (MPH)
Figure B-2. A verage lateral deceleration (D = 0 It) and impact, force of trucks as a function of roadway, vehicle, and traffic rail-ing characteristics.

I, 0
z 0 ec
w —j w U w 6.0 0
(LI
d 3:
4.0
-J 4 Ix Lu
2.0 -J
4c
200 +300+400-1-500 -1- 600
vi 160 t24o-I-320 -1-400}48o
LjJ
0 U. 120 180 240300360
I-U
80
40 +60+80+IOO+A40 Ui
- 0 + 0 + 0 + 0 + 0
E WEIGHT IN KIPS
41
06f
/ 71 Nee
/ 40_
IFT — --
rild
__/_7_•_ 10
I p MANUFACTURERS LISTED
( GROSS VEHICLE WEIGHT (GVW)
. - o'o TRUCKS —. 40000 ----- 20.000
0-1 I
0 10 20 30 40 50 60 70 60
V1. VEHICLE SPEED (MPH)
Figure B-3. Average lateral deceleration (D = I It) and impact force of trucks as a function of roadway, vehicle, and traffic rail-ing characteristics.

0
z o 8.0 I-
w C.) w 6.0 0
1 C-) x
4.0
-J
U I- < 2.( -J
4(
CL 128-1-192
I U I C) I Er I 0
Ii- 96 -I-' -
I C.)
CL
64 -j--- 96 I w I I-
I -J I w
32 ±48 I Er I Li
42
VEHICLE WEIGHT IN KIPS 16.0 24.0
160 -I- 240
/ 4
004, qj
g
v%.20m2
'
EE 4>€° / I . 14tt •q0
'o'' 7 /\ '-.. - 30
/ ¼• "--.. -.---.-------
'd /
/ MANUFACTURER'S LISTED GROSS VEHICLE WEIGHT (GVW) BUSES - - - 24.000 lbs.
"0 tO 20 30 40 50 60 70 80
V11 VEHICLE SPEED (MPH) Figure B-4. Average lateral deceleration and impaci force of buses as a function of roadway, vehicle, and traffic railing characteristics.

APPENDIX C
METHOD FOR REDUCING, ANALYZING, AND EVALUATING DATA FROM HIGH-SPEED FILM
43
A method for reducing, analyzing, and evaluating data from high-speed film was developed during the course of a study conducted by the Texas Transportation Institute for the Federal Highway Administration, U.S. Department of Transportation (42). A discussion of this method fol-lows, as do typical calculations for tests conducted at the Texas Transportation Institute.
In Chapter Three certain information obtained at vari-ous test conditions is discussed and evaluated for equiva-lent testing conditions of 60 mph, 45° impact angle, and 4,000-lb cars. The technique for computing equivalent conditions is also presented in this appendix.
DATA REDUCTION
1. Observe high-speed film, read and tabulate movement of car with respect to time (simultaneous values of S and t at each data point):
Displacement (S) of a fixed point (target) on the car and Time (t) at successive positions of the car. Start recording S and t prior to impact. Use film from data camera No. 1 (see Fig. C-i). Continue recording S and t after impact. Use film from data camera No. 2 (see Fig .C-1).
2. Plot the time-displacement data, as shown in Figure C-2.
3. Look at the high-speed film again, observe and record the displacement and time at which the car is parallel to the barrier.
Use film from data camera No. 2; record data (S, t). Use film from data camera No. 3; record data (5, t) as a check. Reconcile data obtained in Step 3a and Step 3b.
4. Observe film again, read and record displacement and time at which car leaves barrier; proceed as in Step 3.
5. Now, compute slope of curve plotted in Step 2 at the time:
Of impact-Use the average values of S and over a target displacement of approximately 4 ft (as indicated in Table C-i).
Car is parallel to barrier-Use average values over an interval similar to that indicated in Step 5a. Car leaves barrier-Proceed as in Step 5b.
6. The slope of the S-t curve is an estithate of the speed at each critical point, since V1 = iS1/ t1 where "I" indi-cates the instant of the car's (1) impact with, (2) being parallel with, and (3) leaving the barrier.
ANALYSIS OF DATA
The method employed to compute change in velocity and average deceleration components is illustrated in Figure C-3. The values substituted in the governing equations were taken from data acquired by frame-to-frame analysis of high-speed films of the collision incident in each test. Ex-ample data and results from computation are contained in Table C-i.
Velocities V1, V 2, and V3-the directed speeds of the colliding vehicle-were determined by measuring the dis-placement of a reference mark on the vehicle over an interval of time. V1 was calculated over a time interval just prior to impact; V 2, when the vehicle became parallel to the rail; and Va, when the vehicle lost contact with the rail.
TABLE C-i
HIGH-SPEED FILM DATA
TIME, t (MsEC)
DISPLACEMENT, S (PT)
TIME, t (MsEC)
DISPLACE-MENT, S (PT)
-69 -4.5-, Q
-46 -3.0 408 18.3 -23 -1.5 429 19.1
0 Impact 0 -i 449 19.9-i 10 0.7 469 20.7 Ii 20 1.3 490 21.4 31 2.0
: 510 22.3- a 41 2.6 531 23.1 51 3.3 551 23.8 61 3.8 571 24.6 71 4.4 592 25.3 82 4.9 612 26.1 92 5.5 633 26.8
102 5.9 653 27.5 112 6.4 674 28.3 122 6.8 . 694 29.0 143 7.6 714 29.8 163 8.4 735 30.4 184 9.2 755 31.1 204 10.1 776 31.8 225 10.9 796 32.5 245 11.7 816 33.2 265 12.5 837 33.8 286 13.4 857 34.5 306 14.2-1 uwo 878 35.2 327 15.0 1 898 35.8 347 15.9 918 36.4 367 16.6-' 6 939 37.1 388 17.5 959 37.7
Source: Test 505 Ti-A after Olson, et al. (42).

44
Data Camera No. 3 rrler
I/Id
FA
Figure C-i. High-speed photography camera positions.
The finite increment of displacement, 1S1at , is computed using Eq. 2 in Figure C-3. Dimension D1 is computed using AL and B measured for each vehicle and the angle 9 for each test. Dimension D2 is estimated from high-speed films obtained from a camera located parallel to the bridge rail.
The distance tS10,g. is observed from high-speed film in a camera placed perpendicular to the bridge rail.
The average decelerations perpendicular and parallel to the rail (average Giat and average Gioi,g ) are computed by Eq. 3 and Eq. 4, shown in Figure C-3. The average total deceleration (average Gtotai) is defined, Eq. 5, as the vec-tor sum of these components, as shown in Figure C-3.
EVALUATION OF RESULTS
High-speed films were examined to determine the reduc-tion in velocity produced by a collision incident and to estimate the average total impact force (average Gtotai) and its components parallel (average Giong.) 'and perpen-dicular (average Gjat ) to the barrier. A summary of the method of photographic analysis is contained in Figure C-3,
and the results are tabulated in Table C-2. It is recognized that peak values may be two to three or more times the magnitude of the average values presented in Table C-2; these peak values may be very significant in the design of barrier systems and connections. The relationship between average loads and peak loads is not resolved in this study. Average values of impact force have been computed and presented in this report and shed some light on the sig-nificance of the relationship of the forces parallel and perpendicular to a barrier as shown in Table C-2.
The 10 service requirements presented in NCHRP Re-port 86 serve as the basis for an evaluation of four barriers tested at the Texas Transportation Institute, as shown in Table C-3.
METHOD USED TO ADJUST DATA TO FIT A 4,000-LB CAR TRAVELING 60 MPH
It was first assumed that the predicted maximum dynamic deflection (Dr) of the barrier varied linearly with the ratio of the predicted initial kinetic energy (KE) to the ob-served initial kinetic energy (KE10).

V1 UI_I
Figure C-2. Data plot showing critical velocities.
S(From H.S. Film)
1.1 C)
0. Barrier I-.
- -
Car Parallel To Barrier rCar Leaves Barrier
45
Plan View Of Barrier Crash Test
Parallel
tLeaves Barrier
Time, t, (Seconds)
Plot Of Car Movement During Time Of Collision
AS2 AS3
V2'= V3=
At2 At3
Where
(C-I)
then D9 = (D0)K (C-2)
Because the dimensions of the car, as well as the initial impact angle, are not changed for a predicted test, the vehicle lateral displacement (Slat.) changes only by the difference between the predicted and observed maximum dynamic deflection. Displacements and accelerations are determined from impact until the car is parallel to the barrier. The formula used to obtain Sl,, t. is
S1, = AL sin 0 + B(l - cos 0) + D (C-3)
in which
AL = the longitudinal distance with respect to the car from the front to the center of gravity;
0= is the impact angle; B = the transverse distance with respect to the car from
the side of impact to the center of gravity; and D = is the maximum dynamic deflection of the barrier.
Then
8111 = S10 - D0 + DD (C4)
The predicted average lateral acceleration (ãint.p) is then
V2 ft, sin2 0 (C-5)
2g S12
in which
V j = the initial speed; and g = 32.2 ft/sec2
It was then assumed that the predicted vehicle longi-tudinal displacement (S1ongp) varied with the ratio of the predicted to observed lateral displacement, or
, -'long. - long.0 ( J (C6)
\ lat.P. /
In addition, the ratio of the initial kinetic energies (K) was assumed to be equal to the ratio of the changes in kinetic energy, so

46
VEHICLE VEHICLE IS CONTACTS PARALLEL TO BARRIER BARRIER VEHICLE
LEAVES BARRIER
GOVERNING EQUATIONS:
AV=V2 —V1
lS1at = Di - D2
(V, sin 0)2 Average Giat =
Average Glong
2 = (Vi Cog 0)2_ V2
2gAS long
1/2
- - -- - (5) Average Gtti = [(Ave. Giat)2 + (Avg. Gioflg)2J
Figure C-3 Geometric representation of photographic analysis. Source: Ref. 42.
i KE, K= KE
- m(V 2 - V,2) (C-7)
(V m0 02 _ V 02)
in which
V f = the speed of the car when parallel to the barrier. m - the mass of the car.
If we consider only that portion of kinetic energy which is due to the velocity component perpendicular to the barrier, we obtain:
m(V2 2 cos20 - V, 2) (C-8a)
m0(V 2 cos29 - V1 2)
or
V. 2 cos2O - V . m0
2 = K (V 2 cos20 •V1 2) (C-8b) MP
Then predicted average longitudinal deceleration (ãiongp) isnow
K TO (V ° 2 cos20 - ff2)
along. m
= Siat (C-9a) 2g Siong.0
5lat0
m0 Sla t = K (C9b)
m Siatp
It is recognized that the assumptions involved in this derivation are conjectural. If the new predictions for bar-rier displacement, longitudinal g, and transverse g have some validity—an assumption which is unproven—the authors strongly believe that the equations give reasonable estimates for only a relatively small range of impact speeds, barrier deflections, impact angles, and vehicle masses. For example, it is believed that the equations give reasonable estimates when converting to the idealized condition from ranges of speed (60 ± 5 mph), angle (250 ± 2°), and mass (4,000 ± 500 lb).

47
TABLE C-2
TEST DATA SUMMARY AND ANALYSIS
DATA FROM FILMS COMPUTED RESULTS
CHANGE IN SPEED DISPLACEMENT (Fr/sEc) AVERAGE DECELERA-
SPEED (FT/sEc) (FT) TION (G) (V1- (V1- (V2-
TEST Vi V.. V S10,,5. V2) V3) V) Gi,,. G10 5. G,,t,,1
Ti-A 65.2 40.2 39.2 2.5 13.1 25.0 26.0 1.0 4.7, 2.2 5.2 Ti-B 82.7 41.3 39.1 3.5 13.0 41.4 43.6 2.2 5.4 4.7 7.2 Ti-C 85.0 61.1 58.3 5.2 15.0 23.9 26.7 2.8 3.9 2.2 4.5 Ti-D 90.1 80.4 79.7 3.3 14.5 9.7 10.4 0.7 6.8 0.2 6.8
* v1 is the speed of the vehicle at impact; V. is the speed of the vehicle when it becomes parallel to the rail; and V., is the speed of the vehicle at loss of contact with the rail. s F,,,t. = vehicle weight x G,,,5 ;
F,,,,,5 = vehicle weight X F,,,50, = vehicle weight )( G,,,,,,; and
= F,,,,,,,/F,,,
COMPUTED AVERAGE IMPACT FORCE *
F,,,,(lb) F,,,,,5 0b) F,,,1 (1b) is TEST
Ti-A 8,740 4,090 9,670 0.47 Ti-B 21,170 18,420 28,220 , 0.87 Ti-C 14,310 8,070 16,520 '0.56
Ti-D 24,620 720 ' 24,620 0.03
Source: After Olson, et al. (42).
TABLE C-3
EVALUATION OF BARRIERS USING TENTATIVE SERVICE REQUIREMENTS
SERVICE T-i BRIDGE RAIL MODIFIED REQUIRE- TRANSITION RAIL T- 1 BRIDGE RAIL MEN'!' TEST Ti-A TEST Ti-B . TEST Ti-C TEST T1-D
1 Adequate lateral restraint is provided by each of these barriers; penetration and vaulting do not occur.
G =5.2 =7.2 , G,,,,,, =4.5 G,,,,,,, =6.8 Vehicle damage rating: Vehicle damage rating: Vehicle damage rating: Vehicle damage rating:
2 4.9 , 6.4 3.9 4.5 Probability of injury: Probability of injury: Probability of injury: Probability of injury:
50% 85% 30% 45%
Good redirection, Poor redirection, Good redirection. Fair redirection. 3 slight snagging. severe snagging.
4 Each barrier remained intact following the collision.
5 Not applicable Not applicable Not applicable Not applicable
6 Yes '-V - Yes This approach rail is Yes compatible geometrically and has adequate connec- tion to bridge rail.
7 Each barrier satisfies the requirement for delineation and does not obstruct drivçr's sight distance.
8 - No curb No curb No curb . No curb
9 No repairs required Replaced W-section Replaced posts and No repairs required W-section
Safety: 3 Safety: 4 Safety: i Safety: 2 Economics: Economics: Economics: Economics:
10 Vehicle repair: 2 Vehicle repair: 4 Vehicle repair: 1 Vehicle repair: 3 Barrier repair: 2 Barrier repair: 3 Barrier repair: 4 Barrier repair: 1
Aesthetics: 1 Aesthetics: 1 Aesthetics: 1 Aesthetics: I
Source: After Olsen, et al. (42)

48
APPENDIX D
COMPARISON OF PREDICTED AND OBSERVED AVERAGE UNIT DECELERATIVE FORCES PERPENDICULAR TO BARRIERS
Data obtained from high-speed films of collisions with bar-riers were reduced and analyzed by the method described in Appendix C. The values of average lateral unit impact force (perpendicular to the barrier) obtained from the ifim data are compared in Figure D-1 with the estimated aver-age lateral unit impact force computed by using the mathe-
matical expression developed in NCHRP Report 86 (1). The results shown include values from crash tests con-ducted at the Texas Transportation Institute during 1969 through 1971, which have been added to the values re-ported in Appendix A of NCHRP Report 86. The com-parisons are very satisfactory..

49
+20% t.i
7 I / -20%
0 2 4 6 8 10
Mathematical Model (Average g's) (Equation 5, Ref. 1, p. 12)
O New York Tests (Ref. 1, p. 12)
E Montreal Tests (Ref. 1, p. 39)
TTI Tests on Barriers (1969-71)
X FHWA-SWRI Fragmenting Tube Barrier (Ref. 44)
* New York Strong Beam Barriers (Ref. 45)
Texas Ti Barriers (Ref. 42)
Texas Concrete Median Barrier (Ref. 46)
Figure D-1. Comparison of average q forces.
10
8
6
4
fr2

Published reports of the
NATIONAL COOPERATIVE HIGHWAY RESEARCH PROGRAM
are available from:
Highway Research Board National Academy of Sciences
2101 Constitution Avenue Washington, D.C. 20418
Rep. No. Title
- A Critical Review of Literature Treating Methods of Identifying Aggregates Subject to Destructive Volume Change When Frozen in Concrete and a Proposed Program of Research—Intermediate Report (Proj. 4-3(2)), 81p., $1.80
1 Evaluation of Methods of Replacement of Deterio- rated Concrete in Structures (Proj. 6-8), 56 p., $2.80
2 An Introduction to Guidelines for Satellite Studies of Pavement Performance (Proj. 1-1), 19 p., $1.80
2A Guidelines for Satellite Studies of Pavement Per- formance, 85 p.+9 figs., 26 tables, 4 app., $3.00
3 Improved Criteria for Traffic Signals at Individual Intersections—Interim Report (Proj. 3-5), 36 p., $1.60
4 Non-Chemical Methods of Snow and Ice Control on Highway Structures (Proj. 6-2), 74 p., $3.20
5 Effects of Different Methods of Stockpiling Aggre-gates—Interim Report (Proj. 10-3), 48 p., $2.00
6 Means of Locating and Communicating with Dis-abled Vehicles—Interim Report (Proj. 3-4), 56 p. $3.20
7 Comparison of Different Methods of Measuring Pavement Condition—Interim Report (Proj. 1-2), 29 p., $1.80
8 Synthetic Aggregates for Highway Construction (Proj. 4-4), 13p., $1.00
9 Traffic Surveillance and Means of Communicating with Drivers—Interim Report (Proj. 3-2), 28 p., $1.60
10 Theoretical Analysis of Structural Behavior of Road Test Flexible Pavements (Proj. 1-4), 31 p., $2.80
11 Effect of Control Devices on Traffic Operations— Interim Report (Proj. 3-6), 107 p., $5.80
12 Identification of Aggregates Causing Poor Concrete Performance When Frozen—Tnterim Report (Proj. 4-3(l)), 47p., $3.00
13 Running Cost of Motor Vehicles as Affected by High- way Design—Interim Report (Proj. 2-5), 43 p., $2.80
14 Density and Moisture Content Measurements by Nuclear Methods—Interim Report (Proj. 10-5), 32 p., $3.00
15 Identification of Concrete Aggregates Exhibiting Frost Susceptibility—Interim Report (Proj. 4-3(2)), 66 p., $4.00
16 Protective Coatings to Prevent Deterioration of Con- crete by Deicing Chemicals (Proj. 6-3), 21 p., $1.60
17 Development of Guidelines for Practical and Realis- tic Construction Specifications (Proj. 10-1), 109 p., $6.00
18 Community Consequences of Highway Improvement (Proj. 2-2), 37 p., $2.80
19 Economical and Effective Deicing Agents for Use on Highway Structures (Proj. 6-1), 19 p., $1.20
Highway Research Board Special Report 80.
Rep. No. Title
20 Economic Study of Roadway Lighting (Proj. 5-4), 77 p., $3.20
21 Detecting Variations in Load-Carrying Capacity of Flexible Pavements (Proj. 1-5), 30 p., $1.40
22 Factors Influencing Flexible Pavement Performance (Proj. 1-3(2)), 69 p., $2.60
23 Methods for Reducing Corrosion of Reinforcing Steel (Proj. 6-4), 22p., $1.40
24 Urban Travel Patterns for Airports, Shopping Cen- ters, and Industrial Plants (Proj. 7-1), 116 p., $5.20
25 Potential Uses of Sonic and Ultrasonic Devices in Highway Construction (Proj. 10-7), 48 p., $2.00
26 Development of Uniform Procedures for Establishing Construction Equipment Rental Rates (Proj. 13-1), 33 p., $1.60
27 Physical Factors Influencing Resistance of Concrete to Deicing Agents (Proj. 6-5), 41 p., $2.00
28 Surveillance Methods and Ways and Means of Com- municating with Drivers (Proj. 3-2), 66 p., $2.60
29 Digital-Computer-Controlled Traffic Signal System for a Small City (Proj. 3-2), 82 p., $4.00
30 Extension of AASHO Road Test Performance Con- cepts (Proj. 1-4(2)), 33 p., $1.60
31 A Review of Transportation Aspects of Land-Use Control (Proj. 8-5), 41 p., $2.00
32 Improved Criteria for Traffic Signals at Individual Intersections (Proj. 3-5), 134 p., $5.00
33 Values of Time Savings of Commercial Vehicles (Proj. 2-4), 74 p., $3.60
34 Evaluation of Construction Control Procedures— Interim Report (Proj. 10-2), 117 p., $5.00
35 Prediction of Flexible Pavement Deflections from Laboratory Repeated-Load Tests (Proj. 1-3(3)), 117p., $5.00
36 Highway Guardrails—A Review of Current Practice (Proj. 15-1), 33 p., $1.60
37 Tentative Skid-Resistance Requirements for Main Rural Highways (Proj. 1-7), 80 p., $3.60
38 Evaluation of Pavement Joint and Crack Sealing Ma- terials and Practices (Proj. 9-3), 40 p., $2.00
39 Factors Involved in the Design of Asphaltic Pave- ment Surfaces (Proj. 1-8), 112 p., $5.00
40 Means of Locating Disabled or Stopped Vehicles (Proj. 3-4(1)), 40 p., $2.00
41 Effect of Control Devices on Traffic Operations (Proj. 3-6), 83 p., $3.60
42 Interstate Highway Maintenance Requirements and Unit Maintenance Expenditure Index (Proj. 14-1), 144.p., $5.60
43 Density and Moisture Content Measurements by Nuclear Methods (Proj. 10-5), 38 p., $2.00
44 Traffic Attraction of Rural Outdoor Recreational Areas (Proj. 7-2), 28 p., $1.40
45 Development of Improved Pavement Marking Ma- terials—Laboratory Phase (Proj. 5-5), 24 p., $1.40
46 Effects of Different Methods of Stockpiling and Handling Aggregates (Proj. 10-3), 102 p., $4.60
47 Accident Rates as Related to Design Elements of Rural Highways (Proj. 2-3), 173 p., $6.40
48 Factors and Trends in Trip Lengths (Proj. 7-4), 70 p., $3.20
49 National Survey of Transportation Attitudes and Behavior—Phase I Summary Report (Proj. 20-4), 71 p., $3.20 -

Rep. No. Title 50 Factors Influencing Safety at Highway-Rail Grade
Crossings (Proj. 3-8), 113 p., $5.20 51 Sensing and Communication Between Vehicles (Proj.
3-3), 105 p., $5.00 52 Measurement of Pavement Thickness by Rapid and
Nondestructive Methods (Proj. 10-6), 82 p., $3.80
53 Multiple Use of Lands Within Highway Rights-of- Way (Proj. 7-6), 68 p., $3.20
54 Location, Selection, and Maintenance of Highway Guärdrails and Median Barriers (Proj. 15-1(2)), 63 p., $2.60
55 Research Needs in Highway Transportation (Proj. 20-2), 66 p., $2.80
56 Scenic Easements—Legal, Administrative, and Valua- tion Problems and Procedures (Proj. 11-3), 174 p., $6.40
57 Factors Influencing Modal Trip Assignment (Proj. 8-2), 78 p., $3.20
58 Comparative Analysis of Traffic Assignment Tech-niques with Actual Highway Use (Proj. 7-5), 85 p., $3.60
59 Standard Measurements for Satellite Road Test Pro- gram (Proj. 1-6), 78 p., $3.20
60 Effects of Illumination on Operating Characteristics of Freeways (Proj. 5-2) 148 p., $6.00
61 Evaluation of Studded Tires—Performance Data and Pavement Wear Measurement (Proj. 1-9), 66 p., $3.00
62 Urban Travel Patterns for Hospitals, Universities, Office Buildings, and Capitols (Proj. 7-1), 144 p., $5.60
63 Economics of Design Standards for Low-Volume Rural Roads (Proj. 2-6), 93 p., $4.00
64 Motorists' Needs and Services on Interstate Highways (Proj. 7-7), 88 p., $3.60
65 One-Cycle Slow-Freeze Test for Evaluating Aggre-gate Performance in Frozen Concrete (Proj. 4-3(1)), 21p., $1.40
66 Identification of Frost-Susceptible Particles in Con- crete Aggregates (Proj. 4-3(2)), 62 p., $2.80
67 Relation of Asphalt Rheological Properties to Pave- ment Durability (Proj. 9-1), 45 p., $2.20
68 Application of Vehicle Operating Characteristics to Geometric Design and Traffic Operations (Proj. 3- 10), 38 p., $2.00
69 Evaluation of Construction Control Procedures—Aggregate Gradation Variations and Effects (Proj. 10-2A), 58 p., $2.80
70 Social and Economic Factors Affecting Intercity Travel (Proj. 8-1), 68 p., $3.00
71 Analytical Study of Weighing Methods for Highway Vehicles in Motion (Proj. 7-3), 63 p., $2.80
72 Theory and Practice in Inverse Condemnation for Five Representative States (Proj. 11-2), 44 p., $2.20
73 Improved Criteria for Traffic Signal Systems on Urban Arterials (Proj. 3-5/1), 55 p., $2.80
74 Protective Coatings for Highway Structural Steel (Proj. 4-6), 64 p., $2.80
74A Protective Coatings for Highway Structural Steel— Literature Survey (Proj. 4-6), 275 p., $8.00
74B Protective Coatings for Highway Structural Steel— Current Highway Practices (Proj. 4-6), 102 p., $4.00
75 Effect of Highway Landscape Development on Nearby Property (Proj. 2-9), 82 p., $3.60
Rep. No. Title 76 Detecting Seasonal Changes in Load-Carrying Ca-
pabilities of Flexible Pavements (Proj. 1-5(2)), 37 p., $2.00
77 Development of Design Criteria for Safer Luminaire Supports (Proj. 15-6), 82 p., $3.80
78 Highway Noise—Measurement, Simulation, and Mixed Reactions (Proj. 3-7), 78 p., $3.20
79 Development of Improved Methods for Reduction of Traffic Accidents (Proj. 17-1), 163 p., $6.40
80 Oversize-Overweight Permit Operation on State High- ways (Proj. 2-10), 120 p., $5.20
81 Moving Behavior and Residential Choice—A Na- tional Survey (Proj. 8-6), 129 p., $5.60
82 National Survey of Transportation Attitudes and Behavior—Phase II Analysis Report (Proj. 20-4), 89 p., $4.00
83 Distribution of Wheel Loads on Highway Bridges (Proj. 12-2), 56 p., $2.80
84 Analysis and Projection of Research on Traffic Surveillance, Communication, and Control (Proj. 3-9), 48 p., $2.40
85 Development of Formed-in-Place Wet Reflective Markers (Proj. 5-5), 28 p., $1.80
86 Tentative Service Requirements for Bridge Rail Sys- tems (Proj. 12-8), 62 p., $3.20
87 Rules of Discovery and Disclosure in Highway Con- demnation Proceedings (Proj. 11-1(5)), 28 p., $2.00
88 Recognition of Benefits to Remainder Property in Highway Valuation Cases (Proj. 11-1(2)), 24 p., $2.00
89 Factors, Trends, and Guidelines Related to Trip Length (Proj. 7-4), 59 p., $3.20
90 Protection of Steel in Prestressed Concrete Bridges (Proj. 12-5), 86 p., $4.00
91 Effects of Deicing Salts on Water Quality and Biota —Literature Review and Recommended Research (Proj. 16-1), 70 p., $3.20
92 Valuation and Condemnation of Special Purpose Properties (Proj. 11-1(6)), 47 p., $2.60
93 Guidelines for Medial and Marginal Access Control on Major Roadways (Proj. 3-13), 147 p., $6.20
94 Valuation and Condemnation Problems Involving Trade Fixtures (Proj. 11-1(9)), 22 p., $1.80
95 Highway Fog (Proj. 5-6), 48 p., $2.40 96 Strategies for the Evaluation of Alternative Trans-
portation Plans (Proj. 8-4), 111 p., $5.40 97 Analysis of Structural Behavior of AASHO Road
Test Rigid Pavements (Proj. 1-4(1)A), 35 p., $2.60
98 Tests for Evaluating Degradation of Base Course Aggregates (Proj. 4-2), 98 p. $5.00
99 Visual Requirements in Night Driving (Proj. 5-3), 38 p., $2.60
100 Research Needs Relating to Performance of Aggre- gates in Highway Construction (Proj. 4-8), 68 p., $3.40
101 Effect of Stress on Freeze-Thaw Durability of Con- crete Bridge Decks (Proj. 6-9), 70 p., $3.60
102 Effect of Weldments on the Fatigue Strength of Steel Beams (Proj. 12-7), 114.p., $5.40
103 Rapid Test Methods for Field Control of Highway Construction (Proj. 10-4), 89 p., $5.00
104 Rules of Compensability and Valuation Evidence for Highway Land Acquisition (Proj. 11-1), 77 p., $4.40

Rep. No. Title
105 Dynamic Pavement Loads of Heavy Highway Vehi- cles (Proj. 15-5), 94 p., $5.00
106 Revibration of Retarded Concrete for Continuous Bridge Decks (Proj. 18-1), 67 p., $3.40
107 New Approaches to Compensation for Residential Takings (Proj. 11-1(10)), 27 p., $2.40
108 Tentative Design Procedure for Riprap-Lined Chan- nels (Proj. 15-2), 75 p., $4.00
109 Elastomeric Bearing Research (Proj. 12-9), 53 p., $3.00
110 Optimizing Street Operations Through Traffic Regu- lations and Control (Proj. 3-11), 100 p., $4.40
111 Running Costs of Motor Vehicles as Affected by Road Design and Traffic (Proj. 2-5A and 2-7), 97 p., $5.20
112 Junkyard Valuation—Salvage Industry Appraisal Principles Applicable to Highway Beautification (Proj. 11-3(2)), 41 p., $2.60
113 Optimizing Flow on Existing Street Networks (Proj. 3-14), 414 p., $15.60
114 Effects of Proposed Highway Improvements on Prop- erty Values (Proj. 11-1(1)), 42 p., $2.60
115 Guardrail Performance and Design (Proj. 1571(2)), 70 p., $3.60
116 Structural Analysis and Design of Pipe Culverts (Proj. 15-3), 155 p., $6.40
117 Highway Noise—A Design Guide for Highway En- gineers (Proj. 3-7), 79 p., $4.60
118 Location, Selection, and Maintenance of Highway Traffic Barriers (Proj. 15-1(2)), 96 p., $5.20
119 Control of Highway Advertising Signs—Some Legal Problems (Proj. 11-3(1)), 72 p., $3.60
120 Data Requirements for Metropolitan Transportation Planning (Proj. 8-7), 90 .p. $4.80
121 Protection of Highway Utility (Proj. 8-5), 115 p., $5.60
122 Summary and Evaluation of Economic Consequences of Highway Improvements (Proj. 2-11), 324 p., $13.60
123 Development of Information Requirements and Transmission Techniques for Highway Users (Proj. 3-12), 239 p., $9.60
124 Improved Criteria for Traffic Signal Systems in Urban Networks (Proj. 3-5), 86 p., $4.80
125 Optimization of Density and Moisture Content Mea-surements by Nuclear Methods (Proj. 10-5A), 86 p., $4.40
126 Divergencies in Right-of-Way Valuation (Proj. 11- 4), 57 p., $3.00
127 Snow Removal and Icc Control Tcchniques at Inter- changes (Proj. 6-10), 90 p., $5.20
128 Evaluation of AASHO Interim Guides for Design of Pavement Structures (Proj. 1-11), 111 p., $5.60
129 Guardrail Crash Test Evaluation—New Concepts and End Designs (Proj. 15-1(2)), 89 p., $4.80
130 Roadway Delineation Systems (Proj. 5-7), 349 p., $14.00
131 Performance Budgeting System for Highway Main- tenance Management (Proj. 19-2(4)), 213 p., $8.40
132 Relationships Between Physiographic Units and Highway Design Factors (Proj. 1-3(1)), 161 p., $7.20
Rep. No. Title
133 Procedures for Estimating Highway User Costs, Air Pollution, and Noise Effects (Proj. 7-8), 127 p., $5.60
134 Damages Due to Drainage, Runoff, Blasting, and Slides (Proj. 11-1(8)), 23 p., $2.80
135 Promising Replacements for Conventional Aggregates for Highway Use (Proj. 4-10), 53 p., $3.60
136 Estimating Peak Runoff Rates from Ungaged Small Rural Watersheds (Proj. 15-4), 85 p., $4.60
137 Roadside Development—Evaluation of Research (Proj. 16-2), 78 p., $4.20
138 Instrumentation for Measurement of Moisture—Literature Review and Recommended Research (Proj. 21-1), 60 p., $4.00
139 Flexible Pavement Design and Management—Sys- tems Formulation (Proj. 1-10), 64 p., $4.40
140 Flexible Pavement Design and Management—Ma- terials Characterization (Proj. 1-10), 118 p., $5.60
141 Changes in Legal Vehicle Weights and Dimensions—Some Economic Effects on Highways (Proj. 19-3), 184.p., $8.40
142 Valuation of Air Space (Proj. 11-5), 48 p., $4.00
143 Bus Use of Highways—State of the Art (Proj. 8-10), 406 p., $16.00
144 Highway Noise—A Field Evaluation of Traffic Noise Reduction Measures (Proj. 3-7), 80 p., $4.40
145 Improving Traffic Operations and Safety at Exit Gore Areas (Proj. 3-17) 120 p., $6.00
146 Alternative Multimodal Passenger Transportation Systems—Comparative Economic Analysis (Proj. 8-9), 68 p., $4.00
147 Fatigue Strength of Steel Beams with Welded Stiff- eners and Attachments (Proj. 12-7), 85 p., $4.80
148 Roadside Safety Improvement Programs on Freeways —A Cost-Effectiveness Priority Approach (Proj. 20- 7), 64 p., $4.00
149 Bridge Rail Design—Factors, Trends, and Guidelines (Proj. 12-8), 49 p., $4.00

Synthesis of Highway Practice
No. Title
1 Traffic Control for Freeway Maintenance (Proj. 20-5, Topic 1), 47 p., $2.20
2 Bridge Approach Design and Construction Practices (Proj. 20-5, Topic 2), 30 p., $2.00
3 Traffic-Safe and Hydraulically Efficient Drainage Practice (Proj. 20-5, Topic 4), 38 p., $2.20
4 Concrete Bridge Deck Durability (Proj. 20-5, Topic 3), 28 p., $2.20
5 Scour at Bridge Waterways (Proj. 20-5, Topic 5), 37 p., $2.40
6 Principles of Project Scheduling and Monitoring (Proj. 20-5, Topic 6), 43 p., $2.40
7 Motorist Aid Systems (Proj. 20-5, Topic 3-01), 28 p., $2.40
8 Construction of Embankments (Proj. 20-5, Topic 9), 38 p., $2.40
9 Pavement Rehabilitation—Materials and Techniques (Proj. 20-5, Topic 8), 41 p., $2.80
10 Recruiting, Training, and Retaining Maintenance and Equipment Personnel (Proj. 20-5, Topic 10), 35 p., $2.80
11 Development of Management Capability (Proj. 20-5, Topic 12); sop., $3.20
12 Telecommunications Systems for Highway Admin-istration and Operations (Proj. 20-5, Topic 3-03), 29 p., $2.80
13 Radio Spectrum Frequency Management (Proj. 20-5, Topic 3-03), 32 p., $2.80
14 Skid Resistance (Proj. 20-5, Topic 7), 66 p., $4.00 -
15 Statewide Transportation Planning—Needs and Re- quirements (Proj. 20-5, Topic 3-02), 41 p., $3.60
16 Continuously Reinforced Concrete Pavement (Proj. 20-5, Topic 3-08), 23 p., $2.80
17 Pavement Traffic Marking—Materials and Applica tion Affecting Serviceability (Proj. 20-5, Topic 3- 05), 44 p., $3.60
18 Erosion Control on Highway Construction (Proj. 20-5, Topic 4-01), 52 p., $4.00
19 Design, Construction, and Maintenance of PCC Pavement Joints (Proj. 20-5, Topic 3-04), 40 p., $3.60
20 Rest Areas (Proj. 20-5, Topic 4-04), 38 p., $3.60
21 Highway Location Reference Methods (Proj. 20-5, Topic 4-06), 30 p., $3.20
22 Maintenance Management of Traffic Signal Equip- ment and Systems (Proj. 20-5, Topic 4-03) 41 p., $4.00
23 Getting Research Findings into Practice (Proj. 20-5, Topic!!) 24p., $3.20
24 Minimizing Deicing Chemical Use (Proj. 20-5, Topic 4-02), 58 p., $4.00

THE TRANSPORTATION RESEARCH BOARD is an agency of the National Research Council, which serves the National Academy of Sciences and the National Academy of Engineering. The Board's purpose is to stimulate research concerning the nature and performance of transportation systems, to disseminate information that the research produces, and to encourage the application of appropriate research findings. The Board's program is carried out by more than 150 committees and task forces composed of more than 1,800 administrators, engineers, social scientists, and educators who serve without compensation. The program is supported by state transportation and highway departments, the U.S. Department of Transportation, and other organizations interested in the development of transportation.
The Transportation Research Board operates within the Division of Engineering of the National Research Council. The Council was organized in 1916 at the request of President Woodrow Wilson as an agency of the National Academy of Sciences to enable the broad community of scientists and engineers to associate their efforts with those of the Academy membership. Members of the Council are appointed by the president of the Academy and are drawn from academic, industrial, and governmental organizations throughout the United States.
The National Academy of Sciences was established by a congressional act of incorpo-ration signed by President Abraham Lincoln on March 3, 1863, to further science and its use for the general welfare by bringing together the most qualified individuals to deal with scientific and technological problems of broad significance. It is a private, honorary organization of more than 1,000 scientists elected on the basis of outstanding contribu-tions to knowledge and is supported by private and public funds. Under the terms of its congressional charter, the Academy is called upon to act as an official—yet indepen-dent—advisor to the federal government in any matter of science and technology, although it is not a government agency and its activities are not limited to those on behalf of the government.
To share in the tasks of furthering science and engineering and of advising the federal government, the National Academy of Engineering was established on December 5, 1964, under the authority of the act of incorporation of the National Academy of Sciences. Its advisory activities are closely coordinated with those of the National Academy of Sciences, but it is independent and autonomous in its organization and election of members.

VN:y
I
TRANSPORTATION RESEARCH BOARD
National Research Council
2101 Constitution Avenue, N.W. Washington, D.C. 20418
ADDRESS CORRECTION REQUESTED
NON-PROFIT ORG.
U.S. POSTAGE
PAID
WASHINGTON, D.C.
PERMIT NO. 42970
0 N rfl co a
(1) >-
cc (D U. Z Do" LU N
r') oci, or- OJ LU _t a)<
0 4cs: Dw
ow i v Oh- <Q-i o,cE 00 Oz ..-4oco