national coastal mapping program update on productsgis day, vicksburg, ms march 14, 2012 outline:...
TRANSCRIPT

Joint Airborne Lidar Bathymetry
Technical Center of Expertise
US Army Corps of Engineers
BUILDING STRONG®
Molly Reif (EL) and Lauren Dunkin (CHL) Joint Airborne Lidar Bathymetry Technical Center of Expertise
GIS Day, Vicksburg, MS March 14, 2012
Outline:
USACE National Coastal Mapping Program
Product examples and surveying update
Data access
R&D progress (Environmental/Coastal Engineering)
Coastal Zone Mapping and Imaging Lidar (CZMIL)
National Coastal Mapping Program Update on Products

3/20/2012 2 3/20/2012 2
Joint Airborne Lidar Bathymetry
Technical Center of Expertise
OPERATIONS
RESEARCH AND DEVELOPMENT
Annual Technical Workshop June 2012, Chicago
Sensors and
systems
SOPs Collection
Areas
Data Exploitation

BUILDING STRONG®
Marquette Harbor, MI, Lake Superior, 2011
National Coastal Mapping Program
• Started in 2004 to support regional sediment
management initiatives
• Regional, repeat datasets quantify regional-
scale change
• High-resolution, high-accuracy data

BUILDING STRONG®
Products
• ASCII XYZ
• Aerial photos
• Zero contour
• Aerial photo mosiacs
• 1-meter bathy/topo DEM
• LAS format topo
• 1-meter bathy/topo bare earth DEM
• Hyperspectral image mosaics
• Laser reflectance images
• Basic landcover classification
• Volume change
National Coastal Mapping Progress
Number of times
surveyed since 2004
One Time Two Times Three Times
Four Times Five Times

BUILDING STRONG®
2011 NCMP Collection
Coverage Stats
► 600 Total Miles Shoreline
Covered
► 1.5 Billion Total Lidar Shots
► 630,000 Total Aerial
Photos
► 2000 Hyperspectral Images
► 23 Federal Navigation
Projects
► 40 Federal Navigation
Structures
Mission Stats
► Survey Season from
05/31/2011 to 10/01/2011
► 5 Bases of Operation
► Lake Superior completed
Stamp Sands Project
► Lake Ontario completed
► Niagara postponed
► Lake Erie partially
completed
► Gulf Coast and New
England completed

BUILDING STRONG®
Project Status
Project Date/Status
Gulf Coast 06/10/2011 06/28/2011 Delivered January
Lake Superior 07/21/2011 10/05/2011 Delivered January
Lake
Ontario/Erie 09/23/2011 01/20/2012 Delivered March
East Coast 10/01/2011 10/12/2011 Delivered January
Collection Processing Products Delivery*
*Estimated Delivery Dates
± Preliminary Priority areas delivered already

BUILDING STRONG®
Bathymetry and topography
Marquette Harbor, MI

BUILDING STRONG®
Laser reflectance imagery
5-m resolution

BUILDING STRONG®
Aerial photography RGB imagery
20 cm

BUILDING STRONG®
NCMP 2012 planned survey areas


BUILDING STRONG®
1. http://explorer.arcgis.com/
2. Search NCMP
3. Choose 2011 NCMP Field Coverage
4. Maps can be modified
5. Under Layer Details\Service Details,
layers can be exported as layers or a
kmz to be viewed in ArcMap or
GoogleEarth
Don’t need ArcGIS Desktop
Only Web Browser with MS SilverLight Installed
Mobile Device compatible
Track our progress

BUILDING STRONG®
JALBTCX R&D
GOAL: identify/expand environmental and coastal engineering products,
utilizing (1) data resources of JALBTCX and (2) expertise in ERDC to
address district needs
Coastal Engineering Applications:
Coastal Vulnerability
Shore Protection and Navigation
Projects
Sediment Budgets
Input into Numerical Models
Volume Change Assessment
Asset Management
Environmental Applications:
Site Characterization
Environmental Monitoring
Habitat Identification
Ecosystem Restoration Planning
Emergency Response/Recovery
Water Quality

BUILDING STRONG®
Hyperspectral and Lidar Fusion
• Target features spectrally with hyperspectral and structurally
with lidar through image fusion
Northern tip of Hunting Island, SC, 2010
CASI hyperspectral, RGB 1m topo lidar hillshade Fusion of hyperspectral and lidar
Elevation
profile
Forest
Canopy
Forest
Spectra

BUILDING STRONG®
Landscape changes
17th Street Canal New
Orleans, LA
2005
2009 2007
2006 2005
Reif, M., C.L. Macon, and J.M.
Wozencraft. 2011. Post-Katrina
Land-Cover, Elevation, and Volume
Change Assessment along the
South Shore of Lake Pontchartrain,
Louisiana, U.S.A. Journal of Coastal
Research: Special Issue 62 –
Applied Lidar Techniques [Pe’eri &
Long]: pp. 30-39.

BUILDING STRONG®
-0.5m
5.3m
Beach Elevation Distribution
Geomorphic metrics alongshore
Dune
0.04
0.07
0.034
0.04
0.012
0.04
0.05
0.12
Manning n
Value
0.02
Landcover
type
Coastal land cover classification
-1.2m
2.5m
Forest
Canopy Marsh Elevation Distribution
BUILDING STRONG®
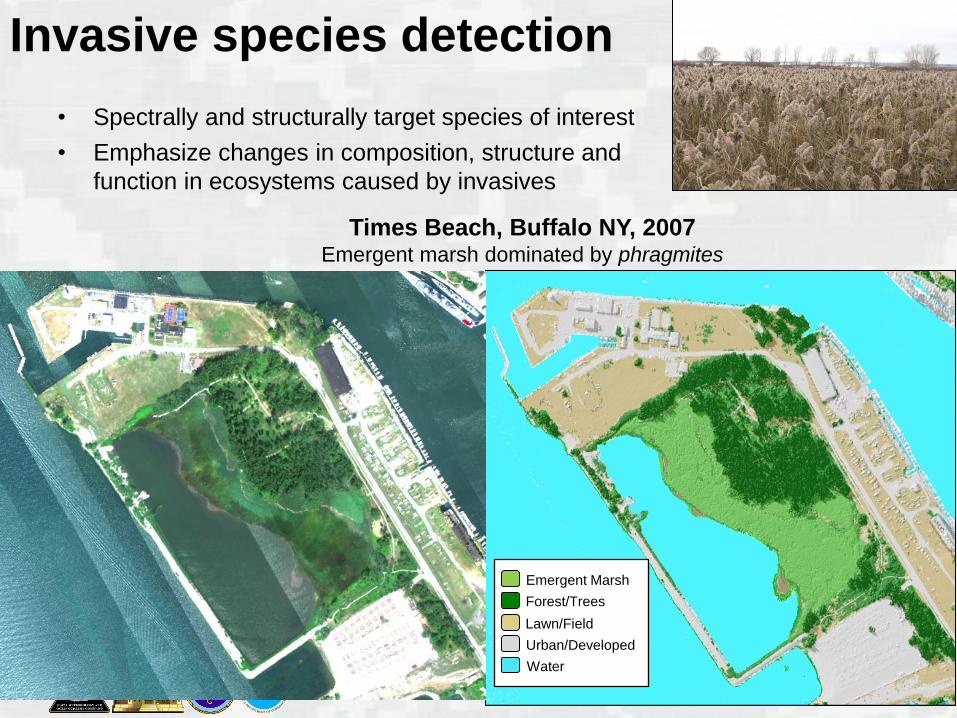
Times Beach, Buffalo NY, 2007 Emergent marsh dominated by phragmites
Emergent Marsh
Forest/Trees
Lawn/Field
Urban/Developed
Water
Invasive species detection
• Spectrally and structurally target species of interest
• Emphasize changes in composition, structure and
function in ecosystems caused by invasives

BUILDING STRONG®
Wetlands Characterization
• Mapping Wetland Habitats
• Spectrally and structurally target
wetland species
• Emphasize species pattern
characterization and zonation
related to elevation gradients
• Wetland condition assessment
Edisto Island, SC, 2010; south of Jeremy Inlet Marsh
Marsh
Spectra
Wetland Habitat Zonation: Fort George Island, FL,
2010

BUILDING STRONG®
Stamp Sands Discrimination
Objective: classify lake bottom using
hyperspectral/lidar reflectance. Map
stamp sands distribution, estimate
movement/loss of stamp sands to
lake, and aid in reef restoration.

BUILDING STRONG®
Purpose: evaluate and demonstrate the use
of fused airborne hyperspectral and
bathymetric lidar data to detect and
discriminate species of estuarine SAV and
macroalgae in two representative small-craft
dredged harbors
Background: Dredging impacts to SAV vary
by species; CWA lists SAV as a Special
Aquatic Site; Mapping species is important
for:
• Planning dredging operations
• Mitigating ecological damage
• Monitoring SAV
PI: Bruce Sabol, EL
Dredging Operations and Environmental Research Work Unit:
Use of Airborne Lidar and Hyperspectral Data to Detect
and Discriminate SAV Species at Corps Dredging Sites
Submersed Eelgrass spectra,
Plymouth Harbor, MA

BUILDING STRONG®
Image Processing Methods: DPS
• Coastal Zone Mapping and Imaging Lidar (CZMIL) Data Processing System (DPS)
Spectral Optimization to characterize seafloor and water column
Water leaving
reflectance
Water column
attenuation
CDOM
absorption
Chl
concentration
Active seafloor
reflectance
Spectral seafloor
reflectance

BUILDING STRONG®
Couple NCMP activities and data products with R&D for
condition assessment tools.
JALBTCX Tasks: 1) Elevation and
imagery clips
2) Initial screening to
support condition
assessments
Length
Average height
3) Enterprise Coastal
Structure Database
(eCID) support
Asset management: Structures

BUILDING STRONG®
Average Height blue seg = 185.73 m
Length blue seg = 16 m
Elevation clip
extent
Imagery clip
extent
Asset management: Structures
USACE Enterprise Coastal
Infrastructure Database
(eCID) USACE Navigation and
Coastal Databank (NCDB)
USACE National Coastal
Mapping Program (NCMP)
Clip elevation and imagery data from NCMP using structure centerlines from NCDB
Populate eCID with basic structure information: length, average height, maximum
height, minimum height

BUILDING STRONG®
Additional parameters to
populate eCID
Side slope
Crown width
Change detection along
cross-sections
As-builts
Historical
Recent
Asset management: Applications

BUILDING STRONG®
Volume Change

BUILDING STRONG®
June, 2004
December, 2004
Volume Change Time Series: Pre- and Post- Ivan
100-m spacing transects FDEP Monuments

BUILDING STRONG®
Volume Change
Surface Difference
- Preserve data gaps for analysis
- Transect bins (gray shaded area)
1
11
A
VNV
12 NVNVdV
A1
V1
V2
12 VVVMHW

BUILDING STRONG®
Volume Change

BUILDING STRONG®
Volume Change

BUILDING STRONG®
Sediment Pathways & Budget - RSM Delineate morphological features of the shoal system using automated feature extraction
Quantify amount of sediment entering/leaving system
Sediment budget
Volumes/ Volume change from bathymetric data to provide input into sediment budgets
refine sediment budgets and identify areas of viable fill material
channel
Bypassing bar
Ebb shoal
Adjacent beaches
margin shoal

BUILDING STRONG®
Coastal Vulnerability
Dune
Berm
Swash
Bar
DoC
Offshore
Geomorphic Metrics
Automated feature extraction
Seaward most dune
Minimum wet/dry contour
Identify areas of vulnerability
Narrow beach width
Low elevations in dune line
Wide beach and dunes
provide protection to upland
infrastructure
valuable habitat
Cells for a typical beach profile
Metrics as indicators of vulnerability

BUILDING STRONG®
Shore Protection
Average Volume Change: 10 m3/m
2006 Post Nourishment – 2005 Post Katrina
Beach Nourishment Projects
Placing sand on the beach provides recreational area, storm protection, environmental habitat
NCMP data available for monitoring project performance
volumetric and contour change
Identifying re-nourishment requirements
Determine storm damages prevented
Hot-spot analysis
Primary dune
Offshore bar
2006 Post Nourishment

BUILDING STRONG®
Navigation Projects
Automate channel condition assessment using bathymetric data and channel framework
Channel availability
Dredged
Channel
2010 NCMP
0+00
5+00
15+00
25+00 35+0
0 45+00 55+00 65+00 75+00 80+00
10+00
20+00
30+00 40+0
0 50+00 60+00 70+00
Navigation Channel Condition Ranking
Condition Ranking Condition Description
Good 95% Channel Navigable
Moderate 75% Channel Navigable
Poor 50% Channel Navigable
Failing 25% Channel Navigable
Failed 0% Channel Navigable
Spur Jetty
Ebb Shoal
East Pass, FL
Identify areas of
concern after storm
events and use
multiple surveys to
show migration of the
channel
2005 Post-Katrina
channel condition
assessment of East
Pass, FL
Centerline
Quarter lines
Toe lines
Waukegan Harbor

BUILDING STRONG®
Models • CMS – Coastal Modeling System
– Simulating waves, currents, water level,
sediment transport, and morphology change at
inlets
• effects of changes to the inlet features (mining
ebb shoal for beach fill material, changes in
dredging, etc.)
• Friction values from land cover and substrate
classification
• Beach-fx
– Corps approved economic model for coastal
storm damage reduction studies
Characteristic beach profile delineation
• GenCade – long-term shoreline change
model
• Lidar extracted wet/dry line
• Structure data as break line
More powerful models
require more accurate and
extensive data sets for
model input and for
validation of model output.
Dune
Offshore bar

BUILDING STRONG®
Coastal Zone Mapping and Imaging Lidar
CZMIL concept of operations
Hardware development
faster area coverage
operation in more turbid and deeper waters
improved performance in breaking waves
improved navigation hazard detection
improved accuracy for depth measurement, water
column properties, and bottom characterization
higher-density topographic and shallow
bathymetric measurements
CZMIL laser sub-system
faster laser
pulse rate
single-laser
solution
larger
field-of-view
more sensitive
receivers
segmented
detector
circular scan
shorter system
response
shorter laser
pulse length

BUILDING STRONG® Seabro
ok,
NH
, fe
dera
l navig
ation p
roje
ct
and b
ackbay m
ars
h Questions?
www.jalbtcx.org