national coastal assessment alabama 2000-2004adem.alabama.gov/programs/coastal/coastalforms/... ·...
TRANSCRIPT

An Assessment of the Health of the Estuaries of Alaba
Alabama Department of Environmental Management
Field Operations Division Mobile Field Office Mobile, Alabama
An Assessment of the Health of the Estuaries of Alabama
National Coastal Assessment Alabama 2000-2004

Although the data described in this article have been funded wholly or in part by the U. S. Environmental Protection Agency through its NCA Program, it has not been subjected to Agency review, and therefore does not necessarily reflect the views of the Agency and no official endorsement should be inferred.
The Alabama Department of Conservation, Marine Resources Division, as well as the Wildlife and Freshwater Fisheries Division provided support for fish tissue collection. Cover photograph: Sand Island Light House, Alabama, taken by Leslie Hartman, ADCNR-MRD, June 1, 2006. Back cover photograph: Sand Island Light House, Alabama, ca. 1859, taken by “M. Fontaine”
The printing costs for this document were provided by the Mobile Bay National Estuary Program (NEP). The information, ideas, and conclusions are those of the authors and do not necessarily reflect those of the Mobile Bay NEP.

The National Coastal Assessment Alabama 2000-2004
Final Report
Prepared by:
Joie Horn
Alabama Department of Environmental Management 2204 Perimeter Road
Mobile, Alabama 36615
CR #82847101
Project Officer
Virginia Engle
United States Environmental Protection Agency Office of Research and Development
Gulf Ecology Division Gulf Breeze, Fl 32561
This study was conducted in cooperation with the U.S. Environmental Protection Agency

National Coastal Assessment – Alabama __________________________________________________________________________________________________________________
Contents 1 INTRODUCTION.…………..…..………………………………………………………........3 1.1 Spatial Configuration……………………………………………………………………...3 1.2 Temporal Considerations……………………………………………………………...…..4 2 FIELD METHODS …..…………………………………………………………………….....4 2.1 Quality Assurance………………………………………………………………………....4 2.2 Water Column……………………………………………………………………………..4 2.3 Sediment and Benthic Community Collection………………………………………….…4 2.4 Fish Tissue Collection ………………………………………………………………….....5 2.5 Field Observations...……………………………………………………………………....6 3 DISCUSSION………………………………………………………………………………....6 4 RESULTS……………………………………………………………………………………..6 4.1 Nutrients…………………………………………………………………………………..6 Nitrogen.........…………………………………………………………………………...6 Phosphorous…………………………………………………………………..................7 4.2 Chlorophyll-a…..………………………………………………………………………....8 4.3 Water Clarity…………..………………………………………………………………….9 4.4 Dissolved Oxygen……………………………………………...………………………..11 4.5 Water Quality Index…………………………………………………………………......12 4.6 Fecal Coliform………………………………………………………………...................15 4.7 Sediment TOC………………………………………………………………………...…16 4.8 Sediment Contaminants……………………………………………………………..…...19 4.9 Sediment Toxicity………………………………………………………………..………22 4.10 Sediment Quality Index.…..……………………………………………………....…....25 4.11 Benthic Index……………………………………………………………………….…..28 4.12 Fish Tissue Contaminants…………………………………………………………........31 5 SUMMARY…………………………………………………………………...………..….....36 References………………………………………………………………………………...…….37
NCA Report 2000 - 2004epo 2
National Coastal Assessment – Alabama __________________________________________________________________________________________________________________
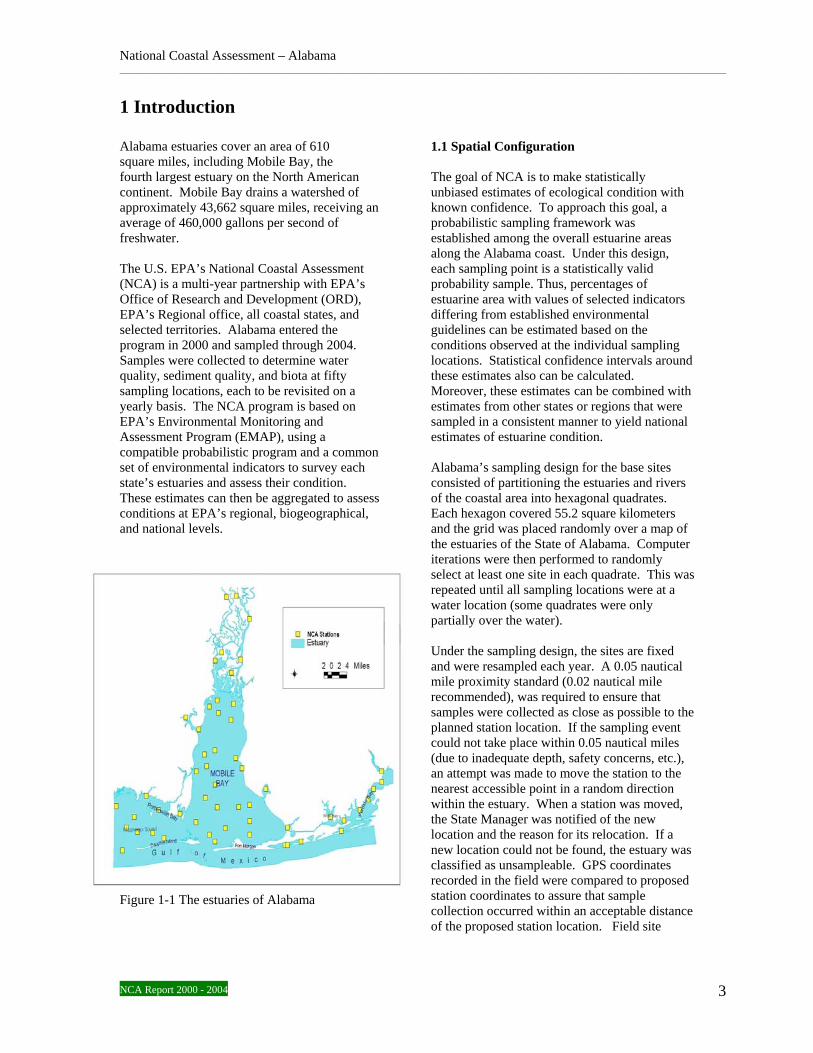
1 Introduction Alabama estuaries cover an area of 610 square miles, including Mobile Bay, the fourth largest estuary on the North American continent. Mobile Bay drains a watershed of approximately 43,662 square miles, receiving an average of 460,000 gallons per second of freshwater. The U.S. EPA’s National Coastal Assessment (NCA) is a multi-year partnership with EPA’s Office of Research and Development (ORD), EPA’s Regional office, all coastal states, and selected territories. Alabama entered the program in 2000 and sampled through 2004. Samples were collected to determine water quality, sediment quality, and biota at fifty sampling locations, each to be revisited on a yearly basis. The NCA program is based on EPA’s Environmental Monitoring and Assessment Program (EMAP), using a compatible probabilistic program and a common set of environmental indicators to survey each state’s estuaries and assess their condition. These estimates can then be aggregated to assess conditions at EPA’s regional, biogeographical, and national levels.
Figure 1-1 The estuaries of Alabama
1.1 Spatial Configuration The goal of NCA is to make statistically unbiased estimates of ecological condition with known confidence. To approach this goal, a probabilistic sampling framework was established among the overall estuarine areas along the Alabama coast. Under this design, each sampling point is a statistically valid probability sample. Thus, percentages of estuarine area with values of selected indicators differing from established environmental guidelines can be estimated based on the conditions observed at the individual sampling locations. Statistical confidence intervals around these estimates also can be calculated. Moreover, these estimates can be combined with estimates from other states or regions that were sampled in a consistent manner to yield national estimates of estuarine condition. Alabama’s sampling design for the base sites consisted of partitioning the estuaries and rivers of the coastal area into hexagonal quadrates. Each hexagon covered 55.2 square kilometers and the grid was placed randomly over a map of the estuaries of the State of Alabama. Computer iterations were then performed to randomly select at least one site in each quadrate. This was repeated until all sampling locations were at a water location (some quadrates were only partially over the water). Under the sampling design, the sites are fixed and were resampled each year. A 0.05 nautical mile proximity standard (0.02 nautical mile recommended), was required to ensure that samples were collected as close as possible to the planned station location. If the sampling event could not take place within 0.05 nautical miles (due to inadequate depth, safety concerns, etc.), an attempt was made to move the station to the nearest accessible point in a random direction within the estuary. When a station was moved, the State Manager was notified of the new location and the reason for its relocation. If a new location could not be found, the estuary was classified as unsampleable. GPS coordinates recorded in the field were compared to proposed station coordinates to assure that sample collection occurred within an acceptable distance of the proposed station location. Field site
NCA Report 2000 - 2004epo 3
National Coastal Assessment – Alabama __________________________________________________________________________________________________________________
audits were conducted during sampling seasons by the QA officer to determine compliance with the Quality Assurance Plan and Field Operations Manual. 1.2 Temporal Considerations The sampling period for NCA was based on the EMAP-Estuary sampling effort. It was determined that if sampling was to take place only once per year, the ideal time to sample would be during the time frame in which the community structure is most stressed. Hypoxia is at its highest and the benthic community the most active during late summer. Therefore the index period was established to be July through mid-September.
2 Field Methods
2.1Quality Assurance The Alabama Department of Environmental Management (ADEM) followed EPA’s National Coastal Assessment Coastal 2000 Quality Assurance Project Plan – 2000 (QAPP) and the National Coastal Assessment Quality Assurance Project Plan 2001-2004, U.S. EPA. 2001, for all sampling and data management activities related to NCA. 2.2 Water Column The Water Quality Vertical Profile data sets are summaries of the physio-chemical properties of the water at a station at the time of sampling. All water quality samples were collected prior to sediment and fish tissue collections to avoid contamination of samples. Dissolved Oxygen (mg/l), Temperature (C), pH, Salinity (ppt), Specific Conductance (uS/cm @ 25C), and Depth (m) were measured with a Sonde and Scout2 water quality data system manufactured by Hydrolab Corporation (2000-2002), and a 650MDS and 600QS manufactured by YSI Corporation (2003-2004). Light penetration was measured using a LI-1400 data logger manufactured by LI-COR. Secchi depth was also recorded. Observations were recorded vertically through the water column at the following intervals:
Shallow sites (< 2 m) – every 0.5-m interval Typical depths (>2 <10m) – every 1-m interval and at 1.5m Deep sites (>10 m) – every 1-m interval to 10m and then at 5-m intervals, thereafter, to near bottom, including 1.5m. Two profiles were recorded at each station, one on the downcast (stopping for observations while lowering), and one on the upcast (stopping for observations while raising the instrument back to the surface). The Water Chemistry results are summaries of the chemical properties of the water at a station at the time of sampling. A Kemmerer bottle was used to collect water samples from 0.5m below surface, mid column, and 0.5m above bottom. At the surface, samples were collected for Total Suspended Solids (TSS), Fecal Coliform, Chlorophyll A (field filtered), {Nitrite, Nitrate-Nitrite, Ammonia, and Ortho-Phosphate} - frozen. At mid-column, samples were collected for TSS, Total Dissolved Solids (TDS), Turbidity, Chlorophyll A (field filtered), Chlorophyll A (Lab filtered), {Nitrite, Nitrate-Nitrite, Ammonia, Ortho-Phosphate, Total Phosphate} –frozen, {nitrate-Nitrite, Ammonia, Total Kjeldahl Nitrogen, Total Phosphate} – H2SO4 preserved. At near bottom, samples were collected for TSS, Chlorophyll A (field filtered), {Nitrite, Nitrate-Nitrite, Ammonia, Ortho-Phosphate} – frozen. 2.3 Sediment and Benthic Community Collection A 229 by 229mm stainless steel modified Ponar Grab was used to collect sediments. This grab sampled an area of 0.052m² and had a maximum depth of penetration in the sediment of 152 mm. A successful grab had relatively level, intact sediment over the entire area of the grab and a sediment depth of at least 7-10 centimeters. Unacceptable grabs included those containing no sediments, which were partially filled or had shelly substrates or grossly slumped surfaces. Grabs completely filled to the top, where the sediment was oozing out of the hinged top, were also unacceptable. Stainless steel utensils were used to remove the top 2-3 cm of sediment from a grab. The sediment was removed to a stainless steel bowl and placed in a cooler of ice to remain cold, but unfrozen. The grab sampler was rinsed with site water and re-deployed. This procedure
NCA Report 2000 - 2004eport 4

National Coastal Assessment – Alabama __________________________________________________________________________________________________________________
was repeated until the volume of sediment required for all contaminant, toxicity, and sediment characteristics analyses had been collected. The sediment was mixed with a stainless steel spoon until thoroughly homogenized, and aliquots were placed immediately into pre-cleaned glass jars (for organics and metals) or plastic containers (sediment toxicity and Total Organic Carbon (TOC)). The samples were immediately stored on ice following collection. Analysis of TOC samples was performed at EPA-Gulf Breeze, FL for 2000, in subsequent years TOC samples were analyzed at Severn Trent Labs (Mobile, AL), all remaining contaminants were tested by ADEM. A total of 15 inorganic metals, 25 polynuclear aromatic hydrocarbons (PAHs), 21 polychlorinated biphenyls (PCBs), 22 pesticides, and TOC concentrations were measured at each of the stations sampled in Alabama for 2000-2004. Sediment characteristics such as grain size and percent solids can have significant effects on the distribution of benthic species and on the concentrations and bioavailability of sediment associated contaminants. Higher percentages of sand, for example, may provide a greater number of microhabitats for interstitial species to exist and could increase sediment permeability allowing greater exchange of oxygen and nutrients at depth in the sediment (Hyland et al. 1991, Weston 1988). Finer substrates though, would have a greater concentration of organic matter allowing for a greater food supply for benthic organisms. Grain size was measured for NCA and reported as percent solids. Analysis was performed by ADEM using method SW 846 (160.3). The standard 10-day sediment bioassay with the marine amphipod Ampelisca abdita (ASTM 1993) has been used to assess sediment toxicity in previous EMAP projects. A. abdita has been chosen by the EPA as the standard test organism for NCA. Stations were represented by one toxicity sample per station and were not replicated at field duplicate stations. Procedures followed the general guidelines provided by EMAP-E Laboratory Methods Manual (U.S. EPA 1995). This is an acute toxicity test, which measures the effect of sediment exposure on amphipod survival under static conditions. Approximately 4 L of surface sediments
(composite of upper 2-3 cm from multiple grabs) were collected for the assay from each station and stored in polyethylene jars at 4°C in the dark until testing. Tests were conducted with subsamples of the same sediment on which analyses of contaminants and other sediment characteristics were performed. Field samples were considered to be significantly toxic if mean survival in comparison to the corresponding negative control was < 80%. A single benthic grab was collected at each station using a 0.052-m² modified Ponar grab sampler. Benthic grab characteristics were noted as quality, substrate type, and odor. Samples were then live-sieved with a 0.5-mm mesh screen. Material retained on the screen was placed in Nalgene containers, fixed in 10% buffered formalin with rose bengal (to facilitate subsequent sorting), and transferred to the laboratory for taxonomic identification and enumeration. Once samples were received in the laboratory, they were transferred from formalin to 70% alcohol. Samples were then processed to characterize the infaunal assemblages based on currently accepted practices in benthic ecology (e.g., Holme and McIntyre 1971) and on specific protocols described in the EMAP-E Lab Methods Manual (U.S. EPA 1995). Animals were sorted from sample debris under a dissection microscope. Sorted specimens were identified to the lowest possible taxon, i.e. the species level wherever possible. 2.4 Fish Tissue Collection Samples of fishes and invertebrates were collected at each station with a 4.9-m otter trawl with 2.5 cm mesh wings and a 0.5cm liner in cod end towed against the current where possible. Tow duration was 10 minutes and speed was approximately 2-3 knots. Specimens to be analyzed for contaminants were immediately wrapped in clean aluminum foil, sealed in plastic storage bags, and placed on ice in the field. Samples were then frozen upon return to the lab. Sites 02 and 49 were not sampled for fish tissue each year due to obstructions in the water likely to cause vessel damage and gear loss. Sites 26 through 32 were sampled by electro shocking due to their being located in the Mobile River Delta. A minimum of five specimens per species was desired for a composite sample. Wherever possible, animals of similar sizes were used to
NCA Report 2000 - 2004eport 5

National Coastal Assessment – Alabama __________________________________________________________________________________________________________________
generate the sample composites. Target animals were identified as shrimp and drum species, with others used as necessary. All specimens were measured to the nearest millimeter total length, and examined for pathological abnormalities. Whole fish were used to make the composite sample (except 2004, where fish tissue carcasses and filets were tested separately). All contaminant analyses were performed by ADEM labs. A total of 13 inorganic metals, 25 polynuclear aromatic hydrocarbons (PAHs), 21 polychlorinated biphenyls (PCBs), and 22 pesticides were measured in each of the composite samples. 2.5 Field Observations Once on station, observations were made characterizing the habitat. Sample date as well as arrival and departure time was recorded. Distance between anchorage and location entered into GPS was recorded to determine precision of navigational technique. Crew as well as weather conditions (skies, seas, wind direction and speed, and air temperature) were also recorded for each site. Habitat/water body type as well as submerged aquatic vegetation (SAV) and presence of marine debris were documented. Observations were also made characterizing the benthic sediment sample. Grab quality, substrate type and odor of sediment were recorded.
3 Discussion
Alabama was assigned fifty fixed stations to sample each year from 2000-2004 for a total of 250 site visits over 5 years. All stations were visited during this time. Stations were located using GPS and 94% were within 0.05 nautical miles of the chosen site. Those sites where sampling was performed outside of 0.05nm were due to proximity to land. Fish tissue trawls were performed at 96% of the stations. Unavoidable snags resulted in two stations not being trawled during the program. Of the 250 stations sampled in the program, target species were caught at 77.6% of the sites. Successful samples of water for nutrients were collected at all stations. Also, one hundred percent of the stations had successful sediment and benthic samples taken.
Results were reported in a file-maker program for in-situ data and excel spreadsheets for water, sediment, fish tissue, and benthic collections. The average depth of stations was 3.4m and ranged from 0.3-14.2m, and the average Secchi depth was 0.9m. The reference conditions used to determine condition in the estuaries of Alabama were obtained from the National Coastal Condition Report II - NCCRII, (U.S. EPA 2004). This system uses a stop light configuration to show visually whether a system is rated good, fair, or poor.
4 Results
4.1 Nutrients Nutrient supply to coastal waters is a problem that affects estuaries as well as local communities. Nutrients affect aquatic ecosystems by causing eutrophication; the over-enrichment of the water column causing the overgrowth of algae. During an algal bloom, algae may produce excess amounts of oxygen during daylight hours and consume oxygen at night. When the excess nutrients that caused the bloom are gone, the algae die. Bacterial decomposition will consume available oxygen, lowering dissolved oxygen levels which, if the levels drop enough, will stress or kill fish and benthic organisms. Nitrogen Nitrogen, a major nutrient comes from many sources, natural and anthropogenic. Natural sources include animal waste and breakdown of vegetation. Human sources are more varied and potentially more damaging. They include point sources such as sewage and industrial plants, as well as non-point sources such as applied artificial fertilizers, urban run-off, atmospheric deposition, and confined animal feeding operations. For NCA, dissolved inorganic nitrogen (DIN) was measured in the water column to determine nitrogen levels. DIN concentrations were rated good for Alabama for all years of NCA, surface to bottom. An analysis of nitrogen concentration is presented in Figure 4-1.
NCA Report 2000 - 2004eport 6

National Coastal Assessment – Alabama __________________________________________________________________________________________________________________
Site criteria: DIN Good = < 0.1 mg/L Fair = 0.1 – 0.5 mg/L Poor = >0.5 mg/L 2000 2001 2002 2003 2004
F PhosphorusAnother souis consumedin coastal wfor fish andcomes fromnitrogen, insource of pha significanfertilizer is receive this
NCA Report 2
Surface
Mid Depth Bottomigure 4-1 Dissolved Inorganic Nitrogen concentration in Alabama’s
estuarine waters
rce of eutrophication, phosphorous by bacteria causing algal blooms aters, decreasing available oxygen benthic organisms. Phosphorous many of the same sources as cluding urban run-off. A major osphorous is fertilizer application;
t amount of the phosphorous in lost due to run-off. Nearby creeks phosphorous delivering it to
coastal estuaries. For NCA, Dissolved inorganic phosphorus (DIP) was measured to determine levels of phosphorus. Concentrations of DIP in Alabama’s waters were higher in 2000 and 2003. Dissolved inorganic phosphorus was rated good for Alabama for all years tested except 2000, where it was rated as fair. A comparison of DIP concentration is presented for Alabama’s coastal waters in Figure 4-2
000 - 2004eport 7

National Coastal Assessment – Alabama __________________________________________________________________________________________________________________
Site criteria: DIP Good = < 0.01 mg/L Fair = 0.01 – 0.05 mg/L Poor = >0.05 mg/L 2000 2001 2002 2003 2004
4.2 Chlor Chlorophdeterminecolumn. phytoplanlikely theNutrient lsampling
NCA Repor
Surface
Mid Depth BottomFigure 4-2 Dissolved Inorganic Phosphorus concentration in Alabama’s estuarine waters
ophyll-a
yll-a concentrations are measured to phytoplankton levels in the water
High concentrations of kton may indicate an algal bloom, result of high nutrient levels. evels measured at the time of
presence of an algal bloom. This high level of phytoplankton may be the result of previously high levels of nutrients that have already dissipated. Chlorophyll-a was rated as fair for all years tested for NCA. A comparison of chlorophyll-a data is presented in Figure 4-3.
may not be strongly correlated to the
t 2000 - 2004eport 8

National Coastal Assessment – Alabama __________________________________________________________________________________________________________________
0%
10%
20%
30%
40%
50%
60%
70%
80%
90%
100%
Surface
Mid-Depth
BottomSurface
Mid-Depth
BottomSurface
Mid-Depth
BottomSurface
Mid-Depth
BottomSurface
Mid-Depth
Bottom
Poor = > 20 ųg/LFair = 5-20 ųg/LGood = < 5 ųg/L
2003 2004 2000 2001 2002
Figure 4-3 Concentration of Chlorophyll-a in Alabama’s estuarine waters 4.3 Water Clarity Water clarity is essential for SAV beds as well as a valuable commodity for the tourism industry. Turbidity is an estimate of particulate matter in the water column and an indirect method for determining water clarity. High turbidity is not an indicator of poor water quality as estuaries are naturally turbid, but some areas can exceed an upper threshold of turbidity levels. Turbidity in the water column can be caused by various forms of suspended matter such as clay, silt, soluble organic matter, plankton, and other microscopic
organisms. Alabama’s estuaries carry a substantial load of this matter. Some turbidity is to be expected naturally and is not considered pollution; although non-point discharge may substantially increase this load. Water clarity can be measured with a light meter, which measures the light that reaches the surface of the water as well as the light that reaches a specific depth (light penetration). It can be measured using a Secchi disk which is an indirect measurement of sediment load and water clarity
NCA Report 2000 - 2004eport 9

National Coastal Assessment – Alabama __________________________________________________________________________________________________________________
through visibility of a disk in the water column. Water clarity can also be measured with turbidity measurements using nephelometric turbidity units (NTU). For NCA, ADEM used all three methods. For this report, light penetration at a standard depth of one meter was used to rate water clarity for each station. The following assessment of Alabama’s water clarity is based on the U.S. EPA’s approach for water clarity for NCA and is used as a reference. Light penetration of greater than ten percent was
considered good. Light penetration of five to ten percent was considered fair. And light penetration of less than five percent was considered poor. During the first three years of NCA and 2004, water clarity was rated good. Despite having more than 50% of the sites rated good, the water clarity in 2003 was rated as fair. This was due to 10% or greater of the sites for 2003 being rated as poor. The following diagram shows water clarity results for Alabama’s estuaries.
0
5
10
15
20
25
30
35
40
45
2000 2001 2002 2003 2004
Light transmittance per year
Num
ber o
f sta
tions
per
cat
egor
y
Good = > 10%Fair = 5 - 10%Poor = < 5%
Figure 4-4 Water Clarity in Alabama’s estuarine waters. A comparison of percent light penetration at 1 meter of depth.
NCA Report 2000 - 2004eport 10

National Coastal Assessment – Alabama __________________________________________________________________________________________________________________
4.4 Dissolved Oxygen Dissolved oxygen is one of the most important elements in an aquatic animal’s life. If oxygen levels get low, fish will leave the impacted area. Animals that aren’t as mobile, such as benthic organisms will be stressed, and if oxygen levels do not return to a higher level, will die. Dissolved oxygen levels are dependant on many factors; both anthropogenic and natural. As mentioned earlier, high nutrient levels enrich a system and may cause an algal bloom. During an algal bloom production is increased to a level that depletes nutrients causing a rapid die-off of phytoplankton. Decaying organic mater will cause oxygen levels to drop. Causes for the eutrophication that starts this cycle include runoff from agriculture, lawns and golf courses, and domestic sewage. Mobile Bay has a natural occurrence of low dissolved oxygen called a “Jubilee” where under certain naturally occurring conditions water with low dissolved oxygen will be concentrated usually along the eastern side of Mobile Bay. Fish and shellfish, especially flounders, shrimp and crab, will swim to the surface at the shoreline seeking oxygenated water. These species can survive such an event if not caught by predators along the beach.
An algal mat in the Mobile River delta, approximately 2m² For National Coastal Assessment, bottom dissolved oxygen is assessed with the following criteria. Bottom D. O. over 5mg/L is considered good, bottom D. O. 2-5mg/L is considered fair, and bottom D. O. less than 2mg/L is considered poor. Dissolved oxygen was rated as fair for the first four years of NCA and poor for 2004. Figure 4-5 shows a comparison of dissolved oxygen levels found during NCA.
0
5
10
15
20
25
30
35
2000 2001 2002 2003 2004
Year Samples Taken
Num
ber o
f Site
s
Good = > 5mg/LFair = 2-5mg/LPoor = < 2mg/L
Figure 4-5 Dissolved Oxygen in the estuaries of Alabama
NCA Report 2000 - 2004eport 11
National Coastal Assessment – Alabama __________________________________________________________________________________________________________________
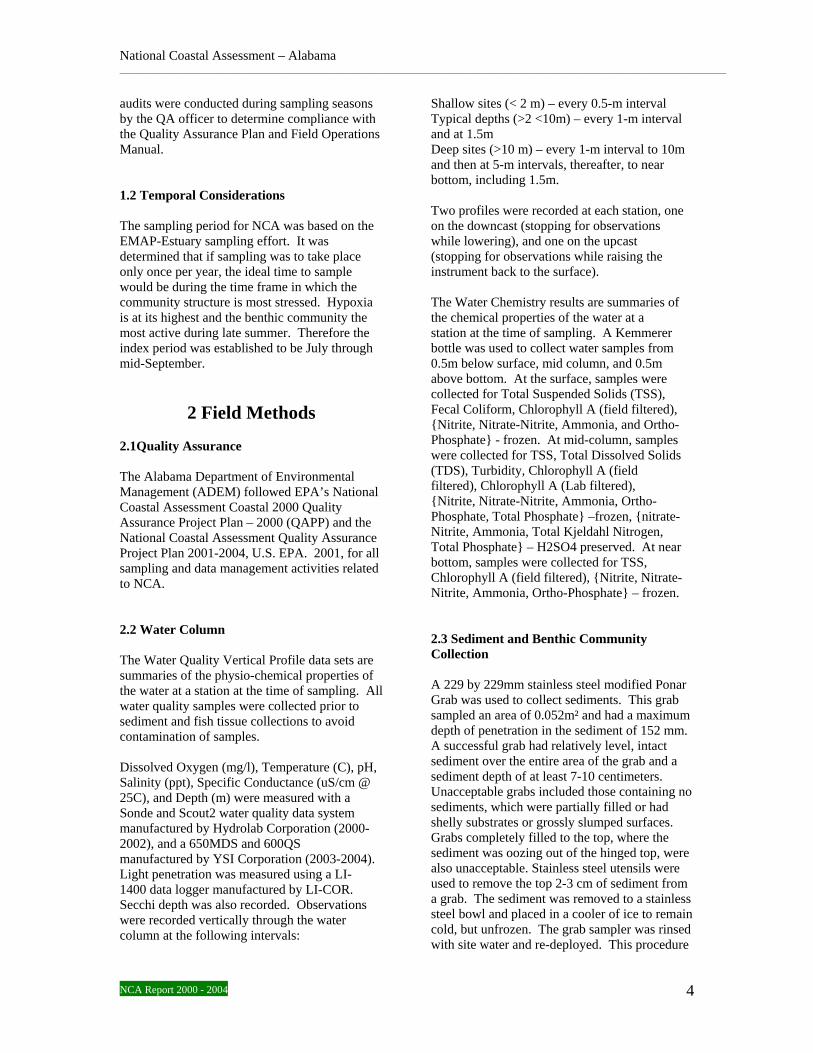
4.5 Water Quality Index A water quality index, developed for the Gulf Coast by the U.S. EPA for the National Coastal Condition Report, was used to determine the condition of Alabama’s coastal waters. Five indicators were used in the index; dissolved inorganic nitrogen (DIN), dissolved inorganic phosphorus (DIP), chlorophyll-a, water clarity, and dissolved oxygen. At each sampling location, these indicators were ranked good, fair, or poor. For the water quality index, each of these rankings was used to determine an index ranking for the specific sampling point. For a site to be ranked as good, it could have no more than one indicator rated as fair. For a site to be ranked as fair, it would have one indicator rated as poor or two or more indicators rated as fair. A site would be ranked as poor if it had two or
more indicators rated as poor. The water quality index was fair to good for each of the first five years of NCA. Dissolved oxygen consistently contributed to the index being fair to poor. As noted above, Mobile Bay is noted for it’s occurrence of Jubilees which coincide with naturally occurring low dissolved oxygen episodes. Perdido Bay has also exhibited low dissolved oxygen levels. This may be attributable to the small bay mouth with limited flushing. Perdido Bay has also historically shown an elevated level of chlorophyll-a, this trend continued with NCA. A water quality index for the estuaries of Alabama was calculated for the first five years of NCA and results are exhibited below.
Good20%
Fair78%
Poor2%
Good
Fair
Poor
Figure 4-6 Water Quality Index 2000
NCA Report 2000 - 2004eport 12

National Coastal Assessment – Alabama __________________________________________________________________________________________________________________
Good44%
Fair54%
Poor2%
Good
Fair
Poor
Figure 4-7 Water Quality Index 2001
Good52%
Fair46%
Poor2%
Good
Fair
Poor
Figure 4-8 Water Quality Index 2002
NCA Report 2000 - 2004eport 13

National Coastal Assessment – Alabama __________________________________________________________________________________________________________________
Good10%
Fair86%
Poor4%
Good
Fair
Poor
Figure 4-9 Water Quality Index 2003
Good34%
Fair62%
Poor4%
Good
Fair
Poor
Figure 4-10 Water Quality Index 2004
NCA Report 2000 - 2004eport 14

National Coastal Assessment – Alabama __________________________________________________________________________________________________________________
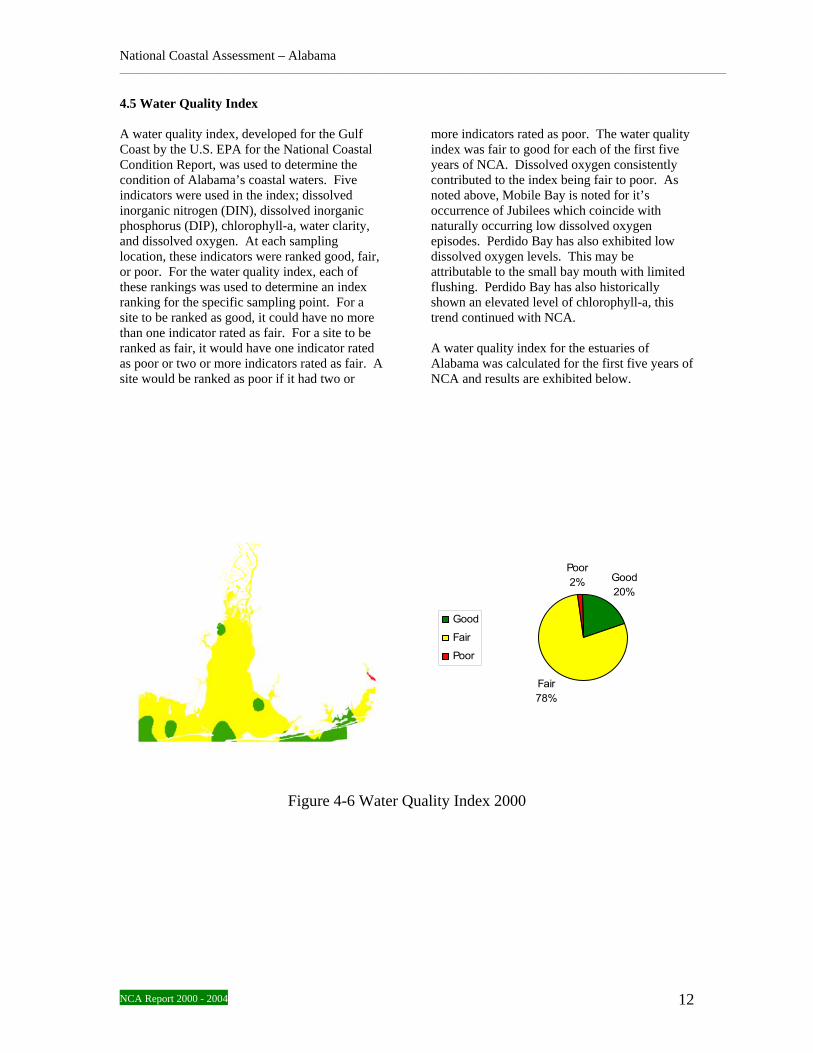
4.6 Fecal Coliform Bacteria
Although fecal coliform measurements were not required for NCA, Alabama measured it as a supplemental indicator at its sites from 2000 – 2003. This was done so that data could be combined with the ALAMAP-Coastal program data. Fecal coliform is a bacterium that lives in
the intestinal tracts of animals and aids in the digestion of foods. It is used as an indicator for the presence of sewage. This sewage could be contaminated by other disease causing bacteria, such as Hepatitis A. Results are exhibited below.
Figure 4-11 Fecal Coliform Results 2000
Figure 4-12 Fecal Coliform Results 2001
NCA Report 2000 - 2004eport 15
National Coastal Assessment – Alabama __________________________________________________________________________________________________________________
Figure 4-13 Fecal Coliform Results 2002
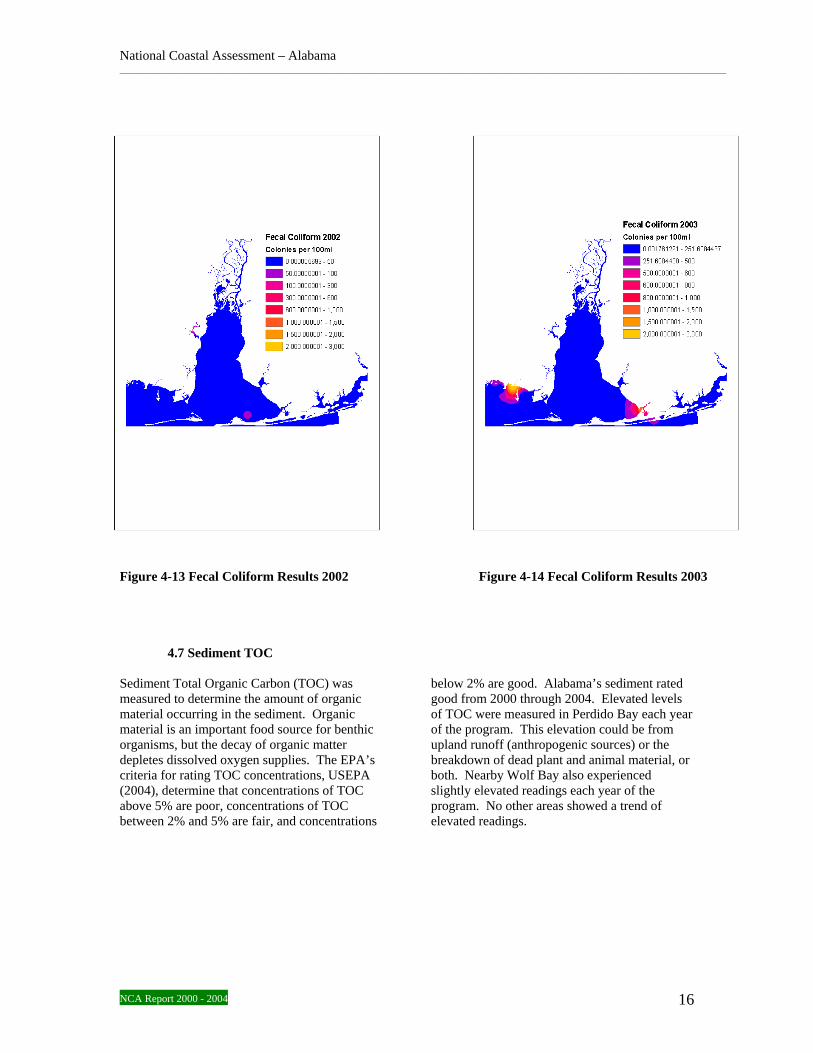
4.7 Sediment TOC Sediment Total Organic Carbon (TOC) was measured to determine the amount of organic material occurring in the sediment. Organic material is an important food source for benthic organisms, but the decay of organic matter depletes dissolved oxygen supplies. The EPA’s criteria for rating TOC concentrations, USEPA (2004), determine that concentrations of TOC above 5% are poor, concentrations of TOC between 2% and 5% are fair, and concentrations
Figure 4-14 Fecal Coliform Results 2003
below 2% are good. Alabama’s sediment rated good from 2000 through 2004. Elevated levels of TOC were measured in Perdido Bay each year of the program. This elevation could be from upland runoff (anthropogenic sources) or the breakdown of dead plant and animal material, or both. Nearby Wolf Bay also experienced slightly elevated readings each year of the program. No other areas showed a trend of elevated readings.
NCA Report 2000 - 2004eport 16

National Coastal Assessment – Alabama __________________________________________________________________________________________________________________
Good 88%
Fair12%
Good
Fair
Figure 4-15 Sediment TOC 2000
Good84%
Fair12%
Poor4%
Good
Fair
Poor
Figure 4-16 Sediment TOC 2001
NCA Report 2000 - 2004eport 17

National Coastal Assessment – Alabama __________________________________________________________________________________________________________________
Good90%
Fair10%
Good
Fair
Figure 4-17 Sediment TOC 2002
Good92%
Fair8%
Good
Fair
Figure 4-18 Sediment TOC 2003
NCA Report 2000 - 2004eport 18

National Coastal Assessment – Alabama __________________________________________________________________________________________________________________
Good86%
Fair14%
Good
Fair
Figure 4-19 Sediment TOC 2004 4.8 Sediment Contaminants Sediments were examined in Alabama’s coastal waters for a total of 15 trace metals, 25 polynuclear aromatic hydrocarbons (PAHs), 21 polychlorinated biphenyls (PCBs), and 22 pesticides. Effects Range Median (ERM) and Effects Range Low (ERL) values were published for many of these contaminants by Long et al (1995), and are used as guidelines for contamination by the EPA as well as Alabama. ERM is the concentration which would result in adverse effects in 50 percent of the studies examined. ERL is the concentration which would result in adverse effects in 10 percent of the studies examined. These ERM and ERL values are used to assess sediment contamination. For a site to be rated good, no ERM concentrations should be exceeded, and less than five ERL concentrations are exceeded. For a site to be rated as fair, five or more ERL concentrations are exceeded. For a site to be rated as poor, an ERM concentration is exceeded for one or more contaminants. Alabama’s sediment was rated good for all five years of NCA.
Sediment sample being collected from Ponar
NCA Report 2000 - 2004eport 19

National Coastal Assessment – Alabama __________________________________________________________________________________________________________________
Good100%
Good
Figure 4-20 Sediment Contamination 2000
Good88%
Fair12%
Good
Fair
Figure 4-21 Sediment Contamination 2001
NCA Report 2000 - 2004eport 20

National Coastal Assessment – Alabama __________________________________________________________________________________________________________________
Good96%
Poor4%
Good
Poor
Figure 4-22 Sediment Contamination 2002
Good98%
Fair2%
Good
Fair
Figure 4-23 Sediment Contamination 2003
NCA Report 2000 - 2004eport 21

National Coastal Assessment – Alabama __________________________________________________________________________________________________________________
Good96%
Fair4%
Good
Fair
Figure 4-24 Sediment Contamination 2004 4.9 Sediment Toxicity The marine amphipod Ampelisca abdita has been chosen by the EPA as the standard test organism for National Coastal Assessment. Stations were represented by one toxicity sample per station and were not replicated at field duplicate stations. Survival of organisms was measured relative to survival of organisms in the control sediment. If a station had greater than or equal to eighty percent survival, it was considered good. If a station had less than an eighty percent survival rate, it was considered poor.
Figures 4-25 through 4-29 show the results of these analyses below. During 2004, thirteen of the fifty sites sampled for sediment toxicity were lost at the analytical lab due to hurricane Ivan. Results for the remaining thirty-seven sites were interpolated for 2004, without the missing data, and shown on the map below in figure 4-29. Blue dots indicate the sites where data were lost.
NCA Report 2000 - 2004eport 22

National Coastal Assessment – Alabama __________________________________________________________________________________________________________________
Good98%
Poor2%
Good
Poor
Figure 4-25 Sediment Toxicity 2000
Figure 4-26 Sediment Toxicity 2001
Good 88%
Poor12%
Good
Poor
NCA Report 2000 - 2004eport 23

National Coastal Assessment – Alabama __________________________________________________________________________________________________________________
Good98%
Poor2%
Good
Poor
Figure 4-27 Sediment Toxicity 2002
Good86%
Poor14%
Good
Poor
Figure 4-28 Sediment Toxicity 2003
NCA Report 2000 - 2004eport 24

National Coastal Assessment – Alabama __________________________________________________________________________________________________________________
Good72%
Poor2%
No Data26%
Good
Poor
No Data
Figure 4-29 Sediment Toxicity 2004
4.10 Sediment Quality Index
A sediment quality index was used to gauge the effects of sediment condition on the estuaries of Alabama. Sediment quality is affected by several factors that work together to influence the benthic communities that live on or in the sediment. Total organic carbon (TOC) influences the amount of contamination sediments can hold. Sediment contaminants accumulate in the sediment and can affect the type of species living in the benthic community. The contamination may eliminate pollution sensitive species, allowing for proliferation of pollution resistant species, reducing diversity. The contaminant may eliminate all species or the contaminant may accumulate in the species present, becoming concentrated through bioaccumulation affecting species higher in the food chain - including humans. Toxicity is a measure of the effects of the sediment on the survival rates of a pre-determined species
(Ampelisca abdita). Even though a particular sediment may show elevated levels of contaminants, these contaminants may not have toxic effects on organisms. These three measures- TOC, contaminants, and toxicity were combined to create a sediment quality index. For a site to be ranked good, none of the individual components could be ranked as poor, and the sediment contaminants indicator had to be ranked good. For a site to be ranked as fair, no measures could be ranked as poor and the sediment contaminants indicator was ranked as fair. For a site to be ranked as poor, one or more of the components was ranked as poor. Overall sediment quality for Alabama was ranked as fair with 8% of samples ranking poor. Due to the lost sediment toxicity samples in 2004, Figure 4-34 shows the results of data interpolated without the thirteen lost samples. Blue dots indicate areas of missing data.
NCA Report 2000 - 2004eport 25

National Coastal Assessment – Alabama __________________________________________________________________________________________________________________
Good98%
Poor2%
Good
Poor
Figure 4-30 Sediment Quality Index 2000
Good74%
Fair10%
Poor16%
Good
Fair
Poor
Figure 4-31 Sediment Quality Index 2001
NCA Report 2000 - 2004eport 26

National Coastal Assessment – Alabama __________________________________________________________________________________________________________________
Good94%
Poor6%
Good
Poor
Figure 4-32 Sediment Quality Index 2002
Good84%
Fair2%
Poor14%
Good
Fair
Poor
Figure 4-33 Sediment Quality Index 2003
NCA Report 2000 - 2004eport 27

National Coastal Assessment – Alabama __________________________________________________________________________________________________________________
Good68%Fair
4%
Poor2%
No Data26%
Good
Fair
Poor
No Data
Figure 4-34 Sediment Quality Index 2004
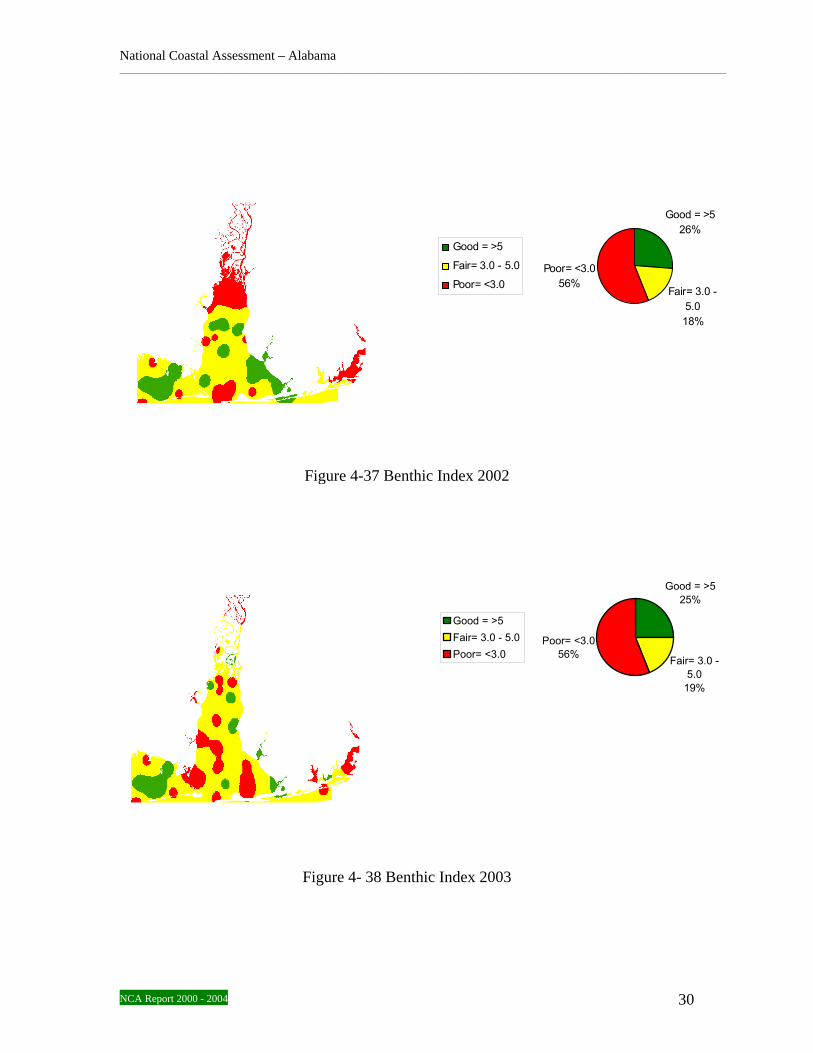
4.11 Benthic Index
Benthic communities can be influenced by chronic as well as acute conditions. Chronic conditions, such as sediment condition, will have long term effects on the composition of the benthic community. Acute conditions, such as low dissolved oxygen concentrations, will have short term effects on the benthic community, only causing temporary changes in benthic diversity. Alabama used a benthic index of condition for northern Gulf Coast Estuaries developed by Engle and Summers (1999). This
index applies discriminant analysis to combine expected species diversity with relevant abundances of pollution tolerant and intolerant species, to develop a benthic index that can be used by resource managers as an estimate of benthic community health. The estuaries of Alabama ranked poor (>20% of sites ranking poor) each year of NCA, as shown below.
NCA Report 2000 - 2004eport 28

National Coastal Assessment – Alabama __________________________________________________________________________________________________________________
Good = > 546%
Fair = 3.0-5.022%
Poor = < 3.032%Good = > 5
Fair = 3.0-5.0
Poor = < 3.0
Figure 4-35 Benthic Index 2000
Good = >536%
Fair= 3.0 - 5.014%
Poor= <3.050%
Good = >5
Fair= 3.0 - 5.0
Poor= <3.0
Figure 4-36 Benthic Index 2001
NCA Report 2000 - 2004eport 29
National Coastal Assessment – Alabama __________________________________________________________________________________________________________________
Good = >526%
Fair= 3.0 - 5.018%
Poor= <3.056%
Good = >5
Fair= 3.0 - 5.0
Poor= <3.0
Figure 4-37 Benthic Index 2002
Good = >525%
Fair= 3.0 - 5.0
19%
Poor= <3.056%
Good = >5Fair= 3.0 - 5.0Poor= <3.0
Figure 4- 38 Benthic Index 2003
NCA Report 2000 - 2004eport 30

National Coastal Assessment – Alabama __________________________________________________________________________________________________________________
Good = >528%
Fair= 3.0 - 5.0
16%
Poor= <3.056%
Good = >5Fair= 3.0 - 5.0Poor= <3.0
Figure 4-39 Benthic Index 2004
4.12 Fish Tissue Contaminants Fish communities were sampled using a 16 foot lined otter trawl at all NCA stations in Alabama except six stations in the Mobile River Delta, where sampling occurred using electro-shocking equipment. All samples were examined for histopathology, identified and enumerated. Targeted species were collected and frozen for later tissue analysis. Preference was given for demersal fishes as well as predatory fishes as target species. Selected target species were then analyzed for contaminants including metals and organic compounds (PAHs, PCBs, and pesticides). These compounds, once consumed can accumulate in the body over time. Predation on contaminated fish will result in contamination of the higher trophic levels resulting in bioaccumulation. This bioaccumulation can be cause for concern among human populations consuming fish. Analyses for contamination were done using the whole body of the
fish. Neither EPA nor FDA guidance criteria exist for whole body contaminants, therefore no comparison to consumption advisories can be made with these results. Contaminants are listed based on their presence or absence. It should be noted that if a contaminant is present it is not necessarily in a concentration that would pose a risk; it is only in a concentration above the minimum detection limit. In 2004, tissue contaminants were measured in fillets and in carcasses. Contaminants of concern, (those listed in the Risk Guidelines for Recreational Fishers – U.S. EPA, 2000), are reported, if present, in the following sections. Metals Fish tissue samples were analyzed for 13 metals; arsenic, cadmium, mercury, and selenium are compared in the graphs below.
NCA Report 2000 - 2004eport 31

National Coastal Assessment – Alabama
In 2000, fish were caught at 36 of the 48 stations, (two stations were not sampled due to snags). Due to multiple target species being collected at some sites, a total of 49 samples were collected.
Metals 2000
26
46
26
43
0
20
40
60
80
100
Arsenic Cadmium Mercury Selenium
Percent sites wherecontaminants present
Figure 4-40 Metals Contaminants in Fish Tissue 2000
In 2001, fish were caught at 37 of 48 stations, (two stations were not sampled due to snags). Due to multiple target species being collected at some sites, a total of 69 samples were collected.
Metals 2001
43 38
163
0
20
40
60
80
100
Arsenic Cadmium Mercury Selenium
Percent sites wherecontaminants present
Figure 4-41 Metals Contaminants in Fish Tissue 2001
In 2002, fish were caught at 35 of the 48 stations, (two stations were not sampled due to snags). Due to multiple target species being collected at some sites, a total of 67 samples were collected.
Metals 2002
3140
46
11
0
20
40
60
80
100
Arsenic Cadmium Mercury Selenium
Percent sites wherecontaminants present
Figure 4-42 Metals Contaminants in Fish
Tissue 2002
In the year 2003, fish were caught at 36 of the 48 stations, (two stations were not sampled due to snags). Due to multiple target species being collected at some sites, a total of 69 samples were collected.
Metals 2003
31
61
22
6
0
20
40
60
80
100
Arsenic Cadmium Mercury Selenium
Percent sites wherecontaminants present
Figure 4-43 Metals Contaminants in Fish Tissue 2003
In 2004, fish were caught at 35 of the 48 stations, (two stations were not sampled due to snags). Due to multiple target species being collected at some sites, a total of 74 samples were collected.
NCA Report 2000 – 2004 32

National Coastal Assessment – Alabama
Metals 2004
26
46
26
43
0
20
40
60
80
100
Arsenic Cadmium Mercury Selenium
Percent sites wherecontaminants present
Figure 4-44 Metals Contaminants in Fish Tissue 2004 Organics Fish tissue samples were analyzed for 25 polynuclear aromatic hydrocarbons (PAHs), 21 polychlorinated biphenyls (PCBs), and 22 pesticides, including DDT and its metabolites. Twelve contaminants of concern, as shown in the graphs below, are reported as percent sites where contaminants present. Contaminant levels, if present, were above minimum detection limits, not necessarily above consumption advisory levels. This comparison was not made due to the whole body analysis performed as opposed to analyses of fillets as in a fish tissue monitoring program. In 2000, fish were caught at 36 of the 48 stations, with a total of 49 samples collected. Two stations were not sampled due to snags. Twenty-nine of the stations had a sufficient quantity of sample to be analyzed for organic compounds.
Organics 2000
3
59
0 0 0 0 0 0 0 0 7
76
0
20
40
60
80
100
Chl
orda
ne
DD
T
Die
ldrin
Endo
sulfa
n
End
rin
Hep
tach
lore
poxi
de
Hex
achl
orob
enze
ne
Lind
ane
Mire
x
Toxa
phen
e
PA
H
PC
B
Percent siteswherecontaminantspresent
Figure 4-45 Organic Contaminants in Fish Tissue 2000
In 2001, fish were caught at 37 of the 48 stations, with a total of 46 samples collected. Two stations were not sampled due to snags. Thirty of the stations had a sufficient quantity of sample to be analyzed for organic compounds.
Organics 2001
0
73
0 0 0 0 3 100 0
10
37
0
20
40
60
80
100
Chl
orda
ne
DD
T
Die
ldrin
End
osul
fan
End
rin
Hep
tach
lore
poxi
de
Hex
achl
orob
enze
ne
Lind
ane
Mire
x
Toxa
phen
e
PA
H
PC
B
Percent siteswherecontaminantspresent
Figure 4-46 Organic Contaminants in Fish
Tissue 2001
In 2002, fish were caught at 35 of the 48 stations, with a total of 67 samples collected. Two stations were not sampled due to snags. Twenty-nine of the stations had a sufficient quantity of sample to be analyzed for organic compounds.
Organics 2002
0
52
0 0 0 0
24
0 0 0
41 38
0
20
40
60
80
100
Chl
orda
ne
DD
T
Die
ldrin
End
osul
fan
End
rin
Hep
tach
lore
poxi
de
Hex
achl
orob
enze
ne
Lind
ane
Mire
x
Toxa
phen
e
PA
H
PC
BPercent siteswherecontaminantspresent
Figure 4-47 Organic Contaminants in Fish Tissue 2002
NCA Report 2000 – 2004 33

National Coastal Assessment – Alabama
In 2003, fish were caught at 36 of the 48 stations, with a total of 69 samples collected. Two stations were not sampled due to snags. Twenty-four of the stations had a sufficient quantity of sample to be analyzed for organic compounds.
Organics 2003
8
88
0 0 0 413
0 0 0 4
58
0
20
40
60
80
100
Chl
orda
ne
DD
T
Die
ldrin
End
osul
fan
Endr
in
Hep
tach
lore
poxi
de
Hex
achl
orob
enze
ne
Lind
ane
Mire
x
Toxa
phen
e
PAH
PC
B
Percent siteswherecontaminantspresent
Figure 4-48 Organic Contaminants in Fish
Tissue 2003
In 2004, fish were caught at 35 of the 48 stations, with a total of 74 samples collected. Two stations were not sampled due to snags. Thirty-six of the stations had a sufficient quantity of sample to be analyzed for organic compounds.
Organics 2004
3
69
0 0 0 0 0 0 0 08
17
0
20
40
60
80
100
Chl
orda
ne
DD
T
Die
ldrin
End
osul
fan
End
rin
Hep
tach
lore
poxi
de
Hex
achl
orob
enze
ne
Lind
ane
Mire
x
Toxa
phen
e
PA
H
PC
B
Percent siteswherecontaminantspresent
Figure 4-49 Organic Contaminants in Fish Tissue 2004
Several contaminants appeared to be present at a significant percentage of stations each year of NCA. Cadmium was present at measurable quantities (> 0.01 ug/g, or ppm) in 46.2% of samples analyzed over the five years of NCA
(Figure 4-50). The concentration of Cadmium appeared to increase going down Mobile Bay and into Mississippi Sound (Figure 4-51), and was most commonly found in Penaeid species of shrimp. Over the five years of NCA, Cadmium was found in 69.8% of Penaeid samples collected. Over the five years of NCA, Cadmium was found in 12% of non-Penaeid samples.
Cadmium
0102030405060708090
100
2000 2001 2002 2003 2004Year
Perc
ent
Percent Sites whereCadmium present
Figure 4-50 Percent stations where Cadmium Present in Fish Tissue
Cadmium Concentrations in Alabama Fishes
MS Sound
PerdidoDelta
Lower Bay
Upper Bay
00.020.040.060.08
0.10.12
Cd
Con
cent
ratio
ns (u
g/g)
Figure 4-51 Concentration of Cadmium Found in Fish Tissue per Area 2000-2004 Mercury was found in quantities greater than 0.05ug/g (Minimum Detection Limit-MDL) in 27.2% of samples analyzed from 2000 – 2004, Figure 4-52. Mercury was most commonly associated with the Mobile Bay Delta with 79% of mercury containing samples coming from the Delta (Figure 4-53); with Micropterus salmoides and Lepomis macrochirus species representing the highest percentages. M. salmoides had mercury concentrations above MDL in 88.9% (16 of 18) of samples. L. macrochirus had mercury concentrations above MDL in 84.2% (16 of 19) of samples. Mercury was detected in 13.2% of all other samples.
NCA Report 2000 – 2004 34

National Coastal Assessment – Alabama
Mercury
0
20
40
60
80
100
2000 2001 2002 2003 2004Year
Perc
ent
Percent siteswhere Mercurypresent
Figure 4-52 Percent stations where Mercury Present in Fish Tissue
Mercury Concentrations in Alabama Fishes
MS Sound
Upper Bay
Perdido
Lower Bay
Delta
0
0.10.2
0.3
0.40.5
0.6
Con
cent
ratio
n H
g (u
g/g)
Figure 4-53 Concentration of Mercury Found in Fish Tissue per Area 2000-2004 Polychlorinated Biphenyls – PCBs were present at quantities greater than 2.00 ng/g (MDL of PCBs) in 37.7% of samples analyzed, Figure 4-54. Of the samples containing PCBs, 56.8% were collected in the Mobile Delta, 20.5% were in the Upper Mobile Bay, and 13.6% were in the Lower Mobile Bay. Figure 4-55 shows a comparison of the concentrations of PCB’s found in each area of Alabama’s estuaries.
PCB
0
20
40
60
80
100
2000 2001 2002 2003 2004Year
Perc
ent
Percent sites wherePCBs present
Figure 4-54 Percent Stations where PCB’s
Present in Fish Tissue
PCB Concentrations in Alabama Fishes
Perdido
DeltaUpper Bay
Lower Bay
MS Sound
0
5
10
15
20
25
30
35
PCB
Con
cent
ratio
n (n
g/g)
Figure 4-55 Concentration of PCBs Found
in Alabama Fishes 2000-2004
Several species of fish showed concentrations of PCBs above MDL (>2.00ng/g). Arius felis, Ictalurus punctatus, Lepomis macrochirus, Micropterus salmoides, and Mugil cephalus, all contained detectable amounts of PCBs in at least 50% of the samples taken. DDT as well as its metabolites DDD and DDE was measured in quantities greater than 2.00 ng/g (MDL) in 68.2% of the samples analyzed, Figure 4-56. The percentage of samples containing DDT were the highest in the Mobile Delta (47.3%), and Upper Mobile Bay (24.7%) and were lower moving down to the Lower Bay
NCA Report 2000 – 2004 35

National Coastal Assessment – Alabama
(21%) and into Mississippi Sound (3.4%). Figure 4-57 shows a comparison of DDT concentration (ng/g) to localized areas of Alabama’s estuaries.
DDT
0
2040
6080
100
2000 2001 2002 2003 2004
Year
Perc
ent
Percent sites whereDDT present
Figure 4-56 Percent Stations Where DDT
Present in Fish Tissue
DDT Concentrations in Alabama Fish
Perdido
DeltaUpper Bay
Lower Bay
MS Sound
0
20
40
60
80
100
120
140
160
DD
T C
once
ntra
tion
(ng/
g)
Figure 4-57 Concentration of DDT Found in Alabama Fishes 2000-2004
DDT levels above MDL (>2.00ng/g) were consistently detected in several species of fish during NCA. Arius felis, Ictalurus punctatus, Lepomis macrochirus, Lepomis microlophus, Micropogonias undulatus, Micropterus salmoides, and Mugil cephalus all contained detectable amounts of DDT in at least 50% of the samples taken.
5 Summary
The purpose of the National Coastal Assessment is to assess the “health” or condition of the coastal waters of Alabama and track changes in that status through time. It also provides the U. S. EPA with a data set that can be combined with and compared to other states data to assess the condition of the nation’s coastal waters. The estuaries of Alabama were assessed using the framework set forth by the U.S. EPA in the National Coastal Condition Report II (U.S. EPA, 2004). This framework can be used to determine the proportion of the state’s waters that are in good, fair, or poor condition in relation to the parameters measured. Dissolved inorganic nitrogen, dissolved inorganic phosphorus, chlorophyll-a, water clarity, and dissolved oxygen were used as indicators for a water quality index. This index was fair to good for all five years of NCA. Fecal coliform was used as a supplemental parameter from 2000-2003 to correlate data with existing sampling programs. In general all sites had good to fair ratings although an elevated trend (three of four years) was noticed in Halls Mill Creek. This area receives substantial runoff from the city of Mobile. TOC, sediment contaminants, and sediment toxicity were combined to create a sediment quality index. Alabama’s estuaries received a fair ranking using this index. Sediment quality index values were good for 2000 and 2004, fair for 2002 and 2003, but poor for 2001. Sediment toxicity was the major contributor to the poor value for 2001. Benthic communities were analyzed using a benthic index of condition. The benthic communities of Alabama’s estuaries were ranked as poor for each year of the program. Alabama’s estuaries are affected by many factors including rainfall (salinity fluctuations and sedimentation) and jubilees (low dissolved oxygen). Benthic communities are highly susceptible to these factors. This index may reflect inter-annual variations more so than historical trends. An effort to further calibrate the benthic index to Alabama’s estuaries may be beneficial in the future. Fish tissue was examined for metals and organic compounds. Analyses for contamination were performed using the whole body. There are no whole body risk guidelines for fish tissue so a statement of consumption risk can not be made, but several trends were noted. Detectable concentrations of PCBs, DDTs, and
NCA Report 2000 – 2004 36

National Coastal Assessment – Alabama
Mercury were most common in the Mobile Delta, while concentrations of Cadmium were most frequently detected in the Lower Mobile Bay and Mississippi Sound. These Cadmium concentrations were commonly associated with Penaeid shrimp.
The index criteria used in this report are an effort to quantify data for a better understanding of the conditions of the estuaries of Alabama, and may be modified to better reflect those conditions as new data is gathered and new information comes to light.
References
ASTM. 1993. Standard guide for conducting 10-day static sediment toxicity tests with marine and
estuarine amphipods. E 1367 – 92. American Society for Testing and Materials Philadelphia, PA. Engle , V.D., and J.K. Summers. 1999. Refinement, validation, and application of a benthic condition index
for northern Gulf of Mexico estuaries. Estuaries 22(3A):624 – 635. Holme, N.A., and A. D. McIntyre. 1971. Methods for the study of marine benthos. IBP handbook no. 16.
Blackwell Scientific Publication, Oxford, 334p. Hyland, J., E. Baptiste, J. Cambell, J. Kennedy, R. Kroop, and S. Williams. 1991. Macroinfaunal
communities of the Santa Monica Basin on the California Outer Continental Shelf and Slope. Marine Ecology Progress Series, 78: 147 – 161.
Long, E.R., D.D. MacDonald, S.L. Smith, and F.D. Calder. 1995. Incidence of adverse biological effects
within ranges of chemical concentrations in marine and estuarine sediments. Environmental Management 19(1): 81-97.
U.S. EPA. 1995. Environmental Monitoring and Assessment Program (EMAP): Laboratory Methods
Manual – Estuaries, Volume 1: Biological and Physical Analyses. United States Environmental Protection Agency, Office of Research and Development, Narragansett, RI. EPA/620/R-95/008.
U.S. EPA. 2000. Guidance for Assessing Chemical Contaminant Data for Use in Fish Advisories,
Volume2: Risk Assessment and Fish Consumption Limits. EPA-823-B-00-008. Office of Water, Washington, DC.
U.S. EPA. 2001. Environmental Monitoring and Assessment Program (EMAP): National Coastal
Assessment Quality Assurance Project Plan 2001 – 2004. United States Environmental Protection Agency, Office of Research and Development, National Health and Environmental Effects Research Laboratory, Gulf Ecology Division, Gulf Breeze, FL. EPA/620/R – 01/002.
U.S. EPA. 2004. National Coastal Condition Report II. EPA/620/R-03/002. Office of Research and
Development and Office of Water, Washington, DC. Weston, D.P. 1988. Macro-benthos-sediment relationships on the Continental Shelf off Cape Hatteras,
North Carolina – Continental Shelf Research 8(3): 267 – 286.
NCA Report 2000 – 2004 37

ADEM Alabama Department of Environmental Management Main Office 1400 Coliseum Blvd. Montgomery, AL 36110 (334)271-7700 Mailing Address: P.O. Box 301463 Montgomery, AL 36130-1463 Field Offices Birmingham Decatur Mobile 110 Vulcan Road 2715 Sandlin Rd, S.W. 2204 Perimeter Rd Birmingham, AL 35209 Decatur, AL 35603 Mobile, AL 36615 (205) 942-6168 (256)353-1713 (251)450-3400