national center for bureau of justice education statistics
TRANSCRIPT

U.S. Department of EducationOffice of Educational Research and ImprovementNational Center for Education Statistics
U.S. Department of JusticeOffice of Justice ProgramsBureau of Justice Statistics
National Center forEducation Statistics
Bureau of JusticeStatistics
October 2000
U.S. Department of Education, Office of Educational Research and Improvement, NCES 2001-017U.S. Department of Justice, Office of Justice Programs, NCJ-184176

U.S. Department of Education U.S. Department of JusticeOffice of Educational Research and Improvement Office of Justice ProgramsNational Center for Education Statistics Bureau of J ustice Statistics
October 2000
Indicators ofSchool Crimeand Safety,2000
Phillip KaufmanXianglei ChenSusan P. ChoyMPR Associates, Inc.
Sally A. RuddyAmanda K. MillerJill K. FleuryEducation Statistics Services Institute
Kathryn A. ChandlerNational Center for Education Statistics
Michael R. RandPatsy KlausMichael G. PlantyBureau of Justice Statistics
U.S. Department of Education, Office of Educational Research and Improvement, NCES 2001-017U.S. Department of Justice, Office of Justice Programs, NCJ-184176

U.S. Department of EducationRichard W. Riley, Secretary
Office of Educational Research and ImprovementC. Kent McGuire, Assistant Secretary
National Center for Education StatisticsGary Phillips, Acting Commissioner
U.S. Department of JusticeJanet Reno, Attorney General
Office of Justice ProgramsMary Lou Leary, Acting Assistant Attorney General
Bureau of Justice StatisticsJan M. Chaiken, Director
The National Center for Education Statistics (NCES) is the primary federal entity for collecting,analyzing, and reporting data related to education in the United States and other nations. It fulfills acongressional mandate to collect, collate, analyze, and report full and complete statistics on the conditionof education in the United States; conduct and publish reports and specialized analyses of the meaningand significance of such statistics; assist state and local education agencies in improving their statisticalsystems; and report on education activities in foreign countries.
The Bureau of Justice Statistics (BJS) is the primary federal entity for collecting, analyzing, publishing,and disseminating statistical information about crime, its perpetrators and victims, and the operation ofthe justice system at all levels of government. These data are critical to federal, state, and local policy-makers in combating crime and ensuring that justice is both efficient and evenhanded.
October 2000
Suggested Citation
Kaufman, P., Chen, X., Choy, S.P., Ruddy, S.A., Miller, A.K., Fleury, J.K., Chandler, K.A., Rand, M.R., Klaus, P., andPlanty, M.G. Indicators of School Crime and Safety, 2000. U.S. Departments of Education and Justice. NCES 2001-017/NCJ-184176. Washington, D.C.: 2000.
This publication can be downloaded from the World Wide Web at http://nces.ed.gov orhttp://www.ojp.usdoj.gov/bjs/. Single hard copies can be ordered through ED Pubs at 1-877-4ED-PUBS (NCES2001-017) (TTY/TDD 1-877-576-7734), and the Bureau of Justice Statistics Clearinghouse at 1-800-732-3277(NCJ-184176).
Contact at NCES:Kathryn Chandler(202) 502-7326(e-mail) [email protected]
Contact at BJS:Michael Planty(202)514-3214(e-mail) [email protected]
FOREWORD
The national focus on school crime and safety continues to be of paramount importance. During the past year, over-
all levels of crime in school decreased, and students seem to feel more safe in school than they did in the last few
years. Yet, violence and theft still mar the school experiences of many students and challenge parents, teachers,
and school officials to respond.
Continued progress in improving the safety of our children entrusted to schools relies on having accurate information
about the nature, extent, and scope of the problem. This report is intended to provide information that will assist in
developing policies and/or programs to prevent and cope with violence and crime in schools.
This is the third edition of Indicators of School Crime and Safety, a joint effort by the Bureau of Justice Statistics and
the National Center for Education Statistics. The report provides detailed statistical information to inform the nation
on the current nature of crime in schools, and is a companion document to the Annual Report on School Safety:
2000. The Annual Report is a joint publication of the Departments of Education and Justice that provides an over-
view of the nature and scope of school crime and describes actions schools and communities can take to address
this critical issue. The two reports respond to a 1998 request by President Clinton for an annual report card on
school violence.
This edition of Indicators contains the most recent available data on school crime and safety drawn from a number of
statistical series supported by the federal government. These data include results from a study of violent deaths in
school, sponsored by the Department of Education and the Centers for Disease Control and Prevention, and the
1999 School Crime Supplement to the National Crime Victimization Survey (NCVS), which is conducted by the Cen-
sus Bureau on behalf of our agencies.
The Bureau of Justice Statistics and National Center for Education Statistics continue to work towards providing
more timely and complete data on the issue of school-related violence and safety. Not only is this report available on
the Internet in its entirety, but individual indicators are updated there throughout the year as new data become avail-
able. The inclusion of detailed data from the full calendar year 1999 NCVS (this edition includes only selected statis-
tics from January-June 1999) and from a new survey of school administrators on crime and victimization in the
schools is planned for next year's edition of Indicators.
Gary Phillips, Ph.D.
Acting Commissioner of Education Statistics
Jan M. Chaiken, Ph.D.
Director of the Bureau of Justice Statistics
Foreword iii

EXECUTIVE SUMMARY
Schools should be safe and secure places for all students, teachers, and staff members. Without a safe learning
environment, teachers cannot teach and students cannot learn. In fact, as the data in this report show, more victimi-
zations happen away from school than at school.1 In 1998, students were about two times as likely to be victims of
serious violent crime away from school as at school (Indicator 2).
In 1998, students ages 12 through 18 were victims of more than 2.7 million total crimes at school (Indicator 2). In
that same year, these students were victims of about 253,000 serious violent crimes at school (that is, rape, sexual
assault, robbery, and aggravated assault). There were also 60 school-associated violent deaths in the United States
between July 1,1997 and June 30,1998—including 47 homicides (Indicator 1).
The total nonfatal victimization rate for young people declined between 1993 and 1998. The percentage of students
being victimized at school also declined over the last few years. Between 1995 and 1999, the percentage of students
who reported being victims of crime at school decreased from 10 percent to 8 percent (Indicator 3). This decline was
due in part to a decline for students in grades 7 through 9. Between 1995 and 1999, the prevalence of reported vic-
timization dropped from 11 percent to 8 percent for 7th graders, from 11 percent to 8 percent for 8th graders, and
from 12 percent to 9 percent for 9th graders.
However, for some types of crimes at school, rates have not changed. For example, between 1993 and 1997, the
percentage of students in grades 9 through 12 who were threatened or injured with a weapon on school property in
the past 12 months remained constant—at about 7 or 8 percent (Indicator 4). The percentage of students in grades
9 through 12 who reported being in a physical fight on school property in the past 12 months also remained un-
changed between 1993 and 1997—at about 15 percent (Indicator 5).
As the rate of victimization in schools has declined or remained constant, students also seem to feel more secure at
school now than just a few years ago. The percentage of students ages 12 through 18 who reported avoiding one or
more places at school for their own safety decreased between 1995 and 1999—from 9 to 5 percent (Indicator 14).
Furthermore, the percentage of students who reported that street gangs were present at their schools decreased
1The reader should be cautious in making comparisons between victimization rates on school property and elsewhere. These data do not takeinto account the number of hours that students spend on school property and the number of hours they spend elsewhere.
Executive Summaryv V

from 1995 to 1999. In 1999,17 percent of students ages 12 through 18 reported that they had street gangs at their
schools compared with 29 percent in 1995 (Indicator 16).
There was an increase in the use of marijuana among students between 1993 and 1995, but no change between
1995 and 1997. In 1997, about 26 percent of these students had used marijuana in the last 30 days (Indicator 19).
Furthermore, almost one-third of all students in grades 9 through 12 (32 percent) reported that someone had offered,
sold, or given them an illegal drug on school property—an increase from 24 percent in 1993 (Indicator 20).
Therefore, the data shown in this report present a mixed picture of school safety. While overall school crime rates
have declined, violence, gangs, and drugs are still evident in some schools, indicating that more work needs to be
done.
ORGANIZATION OF THE CURRENT REPORT
This report, the third in a series of annual reports on school crime and safety from the Bureau of Justice Statistics
and the National Center for Education Statistics, presents the latest available data on school crime and student
safety. The report repeats many indicators from the 1999 report but also provides updated data on fatal and nonfatal
student victimization, nonfatal teacher victimization, students' perceptions of safety and the presence of gangs, and
students' avoidance of places at school. In addition, it provides new data on students' reports of being the target of
derogatory hate-related language and seeing hate-related graffiti at school.
The report is organized as a series of indicators, with each indicator presenting data on a different aspect of school
crime and safety. It starts with the most serious violence. There are five sections to the report: Violent Deaths at
School; Nonfatal Student Victimization—Student Reports; Violence and Crime at School—Public School Princi-
pal/Disciplinarian Reports; Nonfatal Teacher Victimization at School—Teacher Reports; and School Environment.
Each section contains a set of indicators that, taken together, describe a distinct aspect of school crime and safety.
Rather than relying on data from a large omnibus survey of school crime and safety, this report uses a variety of
independent data sources from federal departments and agencies including the Bureau of Justice Statistics, the Na-
tional Center for Education Statistics, and the Centers for Disease Control and Prevention. Each data source has an
independent sample design, data collection method, and questionnaire design, all of which may be influenced by the
unique perspective of the primary funding agency. By combining multiple and independent sources of data, it is
hoped that this report will present a more complete portrait of school crime and safety than would be possible with
any single source of information.
Executive Summaryvi

However, because the report relies on so many different data sets, the age groups, the time periods, and the types
of respondents analyzed can vary from indicator to indicator. Readers should keep this in mind as they compare
data from different indicators. Furthermore, while every effort has been made to keep key definitions consistent
across indicators, different surveys sometimes use different definitions, such as those for specific crimes and "at
school."2 Therefore, caution should be used in making comparisons between results from different data sets. De-
scriptions of these data sets are located in appendix B of this report.
KEY FINDINGS
Some of the key findings from the various sections of this report are as follows:3
VIOLENT DEA THS A T SCHOOL
From July 1,1997 through June 30,1998, there were 60 school-associated violent deaths in the United States.
Forty-seven of these violent deaths were homicides, 12 were suicides, and one was a teenager killed by a law en-
forcement officer in the line of duty (Indicator 1). Thirty-five of the 47 school-associated homicides were of school
age children. By comparison, a total of 2,752 children ages 5 through 19 were victims of homicide in the United
States from July 1,1997 through June 30,1998. Seven of the 12 school-associated suicides occurring from July 1,
1997 through June 30,1998 were of school age children. A total of 2,061 children ages 5 through 19 committed sui-
cide that year.
NONFATAL STUDENT VICTIMIZATION—STUDENT REPORTS
Students ages 12 through 18 were more likely to be victims of nonfatal serious violent crime—including rape, sexual
assault, robbery, and aggravated assault—away from school than when they were at school (Indicator 2). In 1998,
students in this age range were victims of about 550,000 serious violent crimes away from schools, compared with
about 253,000 at school.
• The percentage of students in grades 9 through 12 who have been threatened or injured with a weapon on
school property4 has not changed significantly in recent years. In 1993,1995, and 1997, about 7 to 8 percent of
students reported being threatened or injured with a weapon such as a gun, knife, or club on school property in
the past 12 months (Indicator 4).
2Readers should consult the glossary of terms in appendix C for the specific definitions used in each survey.3All comparisons reported here were statistically significant at the 0.05 level. See appendix B for details on the methods used here.4Definitions for "on school property" and "at school" may differ. See appendix C for specific definitions.
Executive Summaryv

• In 1998,12- through 18-year-old students living in urban, suburban, and rural locales were equally vulnerable to
serious violent crime and theft at school. Away from school, however, urban and suburban students were more
vulnerable to serious violent crime and theft than were rural students. (Indicator 2).
• Younger students (ages 12 through 14) were more likely than older students (ages 15 through 18) to be victims
of crime at school. However, older students were more likely than younger students to be victimized away from
school (Indicator 2).
VIOLENCE AND CRIME AT SCHOOL—PUBLIC SCHOOL PRINCIPAL/DISCIPLINARIAN REPORTS
In 1996-97,10 percent of all public schools reported at least one serious violent crime to the police or a law en-
forcement representative. Principals' reports of serious violent crimes included murder, rape or other type of sexual
battery, suicide, physical attack or fight with a weapon, or robbery. Another 47 percent of public schools reported a
less serious violent or nonviolent crime (but not a serious violent one). Crimes in this category include physical at-
tack or fight without a weapon, theft/larceny, and vandalism. The remaining 43 percent of public schools did not re-
port any of these crimes to the police (Indicator 8).
• Elementary schools were much less likely than either middle or high schools to report any type of crime in
1996-97. They were much more likely to report vandalism (31 percent) than any other crime (19 percent or
less) (Indicator 9).
• At the middle and high school levels, physical attack or fight without a weapon was generally the most com-
monly reported crime in 1996-97 (9 and 8 per 1,000 students, respectively). Theft or larceny was more common
at the high school than at the middle school level (6 versus 4 per 1,000 students) (Indicator 9).
NONFATAL TEACHER VICTIMIZATION AT SCHOOL—TEACHER REPORTS
Over the 5-year period from 1994 through 1998, teachers were victims of 1,755,000 nonfatal crimes at school, in-
cluding 1,087,000 thefts and 668,000 violent crimes (rape or sexual assault, robbery, and aggravated and simple
assault) (Indicator 10). This translates into 83 crimes per 1,000 teachers per year.
• In the period from 1994 through 1998, senior high school and middle/junior high school teachers were more
likely to be victims of violent crimes (most of which were simple assaults) than elementary school teachers (38
and 60, respectively, versus 18 crimes per 1,000 teachers) (Indicator 10).
Executive Summary

• In the 1993-94 school year, 12 percent of all elementary and secondary school teachers were threatened with
injury by a student, and 4 percent were physically attacked by a student. This represented about 341,000
teachers who were victims of threats of injury by students that year, and 119,000 teachers who were victims of
attacks by students (Indicator 11).
SCHOOL ENVIRONMENT
Between 1995 and 1999, the percentages of students who felt unsafe while they were at school and while they were
going to and from school decreased. In 1995,9 percent of students ages 12 through 18 sometimes or most of the
time feared they were going to be attacked or harmed at school. In 1999, this percentage had fallen to 5 percent.
During the same period, the percentage of students fearing they would be attacked while traveling to and from
school fell from 7 percent to 4 percent (Indicator 13).
• Between 1993 and 1997, the percentage of students in grades 9 through 12 who reported carrying a weapon on
school property within the previous 30 days fell from 12 percent to 9 percent (a 25 percent reduction) (Indicator
12).
• Between 1995 and 1999, the percentage of students ages 12 through 18 who avoided one or more places at
school for fear of their own safety decreased, from 9 to 5 percent. In 1999, this percentage represented 1.1 mil-
lion students (Indicator 14).
• Between 1995 and 1999, the percentage of students who reported that street gangs were present at their
schools decreased. In 1995,29 percent of students reported gangs being present in their schools. By 1999, this
percentage had fallen to 17 percent (Indicator 16).
• In 1997, about 51 percent of students in grades 9 through 12 had at least one drink of alcohol in the previous 30
days. A much smaller percentage (about 6 percent) had at least one drink on school property during the same
period (Indicator 18).
• There was an increase in the use of marijuana among students between 1993 and 1995, but no change be-
tween 1995 and 1997. About one quarter (26 percent) of ninth graders reported using marijuana in the last 30
days in 1997. However, marijuana use on school property did not increase significantly between 1993 and 1995,
nor between 1995 and 1997 (Indicator 19).
• In 1995 and 1997, almost one-third of all students in grades 9 through 12 (32 percent) reported that someone
had offered, sold, or given them an illegal drug on school property. This was an increase from 1993 when 24
percent of such students reported that illegal drugs were available to them on school property (Indicator 20).
Executive Summary

• In 1999, about 13 percent of students ages 12 through 18 reported that someone at school had used hate-
related words against them. That is, in the prior 6 months someone at school called them a derogatory word
having to do with race/ethnicity, religion, disability, gender, or sexual orientation. In addition, about 36 percent of
students saw hate-related graffiti at school (Indicator 15).
Executive Summary

ACKNOWLEDGMENTS
The authors wish to thank the heads of their respective agencies, Gary Phillips of the National Center for Education
Statistics (NCES) and Jan Chaiken of the Bureau of Justice Statistics (BJS), for backing this report. We also appre-
ciate their support of our larger data collection and reporting agendas on school crime and safety.
From BJS, we wish to thank Cathy Maston of the Victimization Statistics Branch for her work in preparing and veri-
fying data from the NCVS.
From NCES, we wish to thank Bruce Taylor, Shelley Burns, Arnold Goldstein, Aurora D'Amico, and Ellen Bradburn,
who served as reviewers. They each provided input that substantially improved the publication.
Outside of NCES and BJS, others who reviewed the report were Richard Lawrence of St. Cloud University; Meg
Small, of the OESE/Safe and Drug Free Schools; Mary Schifferli, of the Office for Civil Rights of the
U. S. Department of Education; and Joanne Wiggins of the Planning and Evaluation Service of the U. S. Department
of Education. Their advice was gratefully accepted. We particularly appreciated their willingness to review the report
under very strict time constraints.
Without the assistance of the following staff at MPR Associates this report could not have been produced: Barbara
Kridl (overall production and proofreading), Francesca Tussing (production, proofreading, layout, and editing), An-
drea Livingston (editing), and Leslie Retallick (figure design and text layout). They provided invaluable editorial,
graphic, and production assistance.
Acknowledgments

TABLE OF CONTENTS
Page
Foreword iii
Executive Summary v
Acknowledgments xi
List of Tables xv
List of Figures xxi
Violent Deaths at School 1
1. Violent deaths at school and away from school 2
Nonfatal Student Victimization—Student Reports 3
2. Victimization of students at school and away from school 4
3. Prevalence of students being victimized at school 8
4. Prevalence of students being threatened or injured with a weapon on school property 9
5. Prevalence of students involved in physical fights on school property 11
6. Prevalence of students being bullied at school 13
7. Prevalence of students having property stolen or deliberately damaged on school property 14
Violence and Crime at School—Public School Principal/Disciplinarian Reports 17
8. Crimes reported to the police 18
9. Specific crimes reported to the police 20
Nonfatal Teacher Victimization at School—Teacher Reports 23
10. Nonfatal teacher victimization at school 24
11. Prevalence of teachers being threatened with injury or attacked by students 26
School Environment 27
12. Prevalence of students carrying weapons on school property 28
13. Students' perceptions of personal safety at school and when traveling to and from school 30
14. Students' reports of avoiding places in school 32
15. Students' reports of being called hate-related words and seeing hate-related graffiti 34
16. Students' reports of gangs at school 35
17. Public school principals'reports of discipline problems at school 37
18. Prevalence of students using alcohol 38
19. Prevalence of students using marijuana 40
20. Prevalence of students reporting drugs were made available to them on school property 42
Table of Contents

Page
Supplemental Tables 45
Standard Error Tables 89
Appendix A. School Practices and Policies Related to Safety and Discipline 133
Appendix B. Technical Notes 147
Appendix C. Glossary of Terms 169
Table of Contents

LIST OF TABLES
Table Page
2.1. Number of nonfatal crimes against students ages 12 through 18 occurring at school or on the way toor from school, by type of crime and selected student characteristics: 1992 to 1998 47
2.2. Number of nonfatal crimes against students ages 12 through 18 occurring at school or on the way toor from school per 1,000 students, by type of crime and selected student characteristics: 1992 to1998 50
2.3. Number of nonfatal crimes against students ages 12 through 18 occurring away from school, by typeof crime and selected student characteristics: 1992 to 1998 53
2.4. Number of nonfatal crimes against students ages 12 through 18 occurring away from school per1,000 students, by type of crime and selected student characteristics: 1992 to 1998 56
3.1. Percentage of students ages 12 through 18 who reported criminal victimization at school during theprevious 6 months, by type of victimization and selected student characteristics: 1995 and 1999 59
4.1. Percentage of students in grades 9 through 12 who reported being threatened or injured with aweapon on school property during the last 12 months, by selected student characteristics: 1993,1995, and 1997 60
5.1. Percentage of students in grades 9 through 12 who reported having been in a physical fight in thelast 12 months, by selected student characteristics: 1993,1995, and 1997 61
6.1. Percentage of students ages 12 through 18 who reported being bullied at school during the previous6 months, by gender and selected student characteristics: 1999 62
7.1. Percentage of students in grades 9 through 12 who reported having their property stolen or deliber-ately damaged on school property during the last 12 months, by selected student characteristics:1993,1995, and 1997 63
8.1. Percentage of public schools that reported one or more criminal incidents to police, by seriousnessof the incident, urbanicity, and selected school characteristics: 1996-97 64
8.2. Number of public schools that reported one or more criminal incidents to police, by seriousness ofthe incident, urbanicity, and selected school characteristics: 1996-97 65
8.3. Number of criminal incidents occurring in public schools reported to police, by seriousness of the in-cident, urbanicity, and selected school characteristics: 1996-97 66
8.4. Number of criminal incidents reported to police per 1,000 public school students, by seriousness ofthe incident, urbanicity, and selected school characteristics: 1996-97 67
List of Tables
Table Page
9.1. Percentage of public schools that reported one or more incidents of serious violent crime to police,by type of incident, urbanicity, and selected school characteristics: 1996-97 68
9.2. Percentage of public schools that reported one or more less serious violent or nonviolent criminal in-cidents to police, by type of incident, urbanicity, and selected school characteristics: 1996-97 69
9.3. Number of public schools that reported one or more incidents of serious violent crime to police, bytype of incident, urbanicity, and selected school characteristics: 1996-97 70
9.4. Number of public schools that reported one or more less serious violent or nonviolent criminal inci-dents to police, by type of incident, urbanicity, and selected school characteristics: 1996-97 71
9.5. Number of serious violent criminal incidents occurring in public schools reported to police, by type ofincident, urbanicity, and selected school characteristics: 1996-97 72
9.6. Number of less serious violent or nonviolent criminal incidents occurring in public schools reported topolice, by type of incident, urbanicity, and selected school characteristics: 1996-97 73
9.7. Number of serious violent criminal incidents reported to police per 1,000 public school students, bytype of incident, urbanicity, and selected school characteristics: 1996-97 74
9.8. Number of less serious violent or nonviolent criminal incidents reported to police per 1,000 publicschool students, by type of incident, urbanicity, and selected school characteristics: 1996-97 75
10.1. Number of nonfatal crimes against teachers and average annual number of crimes per 1,000 teach-ers at school, by type of crime and selected teacher characteristics: Aggregated from 1994 to 1998... 76
11.1. Percentage and number of teachers who reported that they were threatened with injury or that theywere physically attacked by a student during the past 12 months, by urbanicity and selected teacherand school characteristics: 1993-94 school year 77
12.1. Percentage of students in grades 9 through 12 who reported carrying a weapon on school propertyat least 1 day in the past 30 days, by selected student characteristics: 1993,1995, and 1997 78
12.2. Percentage of students in grades 9 through 12 who reported carrying a weapon at any time at least 1day in the past 30 days, by selected student characteristics: 1993,1995, and 1997 79
13.1. Percentage of students ages 12 through 18 who reported fearing being attacked or harmed at schoolor on the way to and from school during the previous 6 months, by selected student characteristics:1989,1995, and 1999 80
14.1. Percentage of students ages 12 through 18 who reported that they avoided one or more places inschool during the previous 6 months, by selected student characteristics: 1989,1995, and 1999 81
15.1. Percentage of students ages 12 through 18 who reported being targets of hate-related words or whosaw hate-related graffiti at school during the previous 6 months, by selected student characteristics:1999 82
List of Tables

Table Page
16.1. Percentage of students ages 12 through 18 who reported that street gangs were present at schoolduring the previous 6 months, by selected student characteristics: 1989,1995, and 1999 83
17.1 Percentage and number of public schools that reported that 1 or more of 17 discipline issues was aserious problem in their school, by urbanicity and selected school characteristics: 1996-97 84
18.1. Percentage of students in grades 9 through 12 who reported using alcohol in the last 30 days, byselected student characteristics: 1993,1995, and 1997 85
19.1. Percentage of students in grades 9 through 12 who reported using marijuana in the last 30 days, byselected student characteristics: 1993,1995, and 1997 86
20.1. Percentage of students in grades 9 through 12 who reported that drugs were made available to themon school property during the last 12 months, by selected student characteristics: 1993,1995, and1997 87
Standard Error Tables
52.1. Standard errors for table 2.1: Number of nonfatal crimes against students ages 12 through 18 occur-ring at school or on the way to or from school, by type of crime and selected student characteristics:1992 to 1998 91
52.2. Standard errors for table 2.2: Number of nonfatal crimes against students ages 12 through 18 occur-ring at school or on the way to or from school per 1,000 students, by type of crime and selected stu-dent characteristics: 1992 to 1998 94
52.3. Standard errors for table 2.3: Number of nonfatal crimes against students ages 12 through 18 occur-ring away from school, by type of crime and selected student characteristics: 1992 to 1998 97
52.4. Standard errors for table 2.4: Number of nonfatal crimes against students ages 12 through 18 occur-ring away from school per 1,000 students, by type of crime and selected student characteristics:1992 to 1998 100
S3.1. Standard errors for table 3.1: Percentage of students ages 12 through 18 who reported criminal vic-timization at school during the previous 6 months, by type of victimization and selected student char-acteristics: 1995 and 1999 103
S4.1. Standard errors for table 4.1: Percentage of students in grades 9 through 12 who reported beingthreatened or injured with a weapon on school property during the last 12 months, by selected stu-dent characteristics: 1993,1995, and 1997 104
S5.1. Standard errors for table 5.1: Percentage of students in grades 9 through 12 who reported havingbeen in a physical fight in the last 12 months, by selected student characteristics: 1993,1995, and1997 105
S6.1. Standard errors for table 6.1: Percentage of students ages 12 through 18 who reported being bulliedat school during the previous 6 months, by gender and selected student characteristics: 1999 106
List of Tables

Table Page
S7.1. Standard errors for table 7.1: Percentage of students in grades 9 through 12 who reported havingtheir property stolen or deliberately damaged on school property during the last 12 months, by se-lected student characteristics: 1993,1995, and 1997 107
58.1. Standard errors for table 8.1: Percentage of public schools that reported one or more criminal inci-dents to police, by seriousness of the incident, urbanicity, and selected school characteristics: 1996-97 108
58.2. Standard errors for table 8.2: Number of public schools that reported one or more criminal incidentsto police, by seriousness of the incident, urbanicity, and selected school characteristics: 1996-97 109
58.3. Standard errors for table 8.3: Number of criminal incidents occurring in public schools reported to po-lice, by seriousness of the incident, urbanicity, and selected school characteristics: 1996-97 110
58.4. Standard errors for table 8.4: Number of criminal incidents reported to police per 1,000 public schoolstudents, by seriousness of the incident, urbanicity, and selected school characteristics: 1996-97 111
59.1. Standard errors for table 9.1: Percentage of public schools that reported one or more incidents of se-rious violent crime to police, by type of incident, urbanicity, and selected school characteristics:1996-97 112
59.2. Standard errors for table 9.2: Percentage of public schools that reported one or more less seriousviolent or nonviolent criminal incidents to police, by type of incident, urbanicity, and selected schoolcharacteristics: 1996-97 113
59.3. Standard errors for table 9.3: Number of public schools that reported one or more incidents of seri-ous violent crime to police, by type of incident, urbanicity, and selected school characteristics: 1996-97 114
59.4. Standard errors for table 9.4: Number of public schools that reported one or more less serious violentor nonviolent criminal incidents to police, by type of incident, urbanicity, and selected school char-acteristics: 1996-97 115
59.5. Standard errors for table 9.5: Number of serious violent criminal incidents occurring in public schoolsreported to police, by type of incident, urbanicity, and selected school characteristics: 1996-97 116
59.6. Standard errors for table 9.6: Number of less serious violent or nonviolent criminal incidents occur-ring in public schools reported to police, by type of incident, urbanicity, and selected school charac-teristics: 1996-97 117
59.7. Standard errors for table 9.7: Number of serious violent criminal incidents reported to police per1,000 public school students, by type of incident, urbanicity, and selected school characteristics:1996-97 118
59.8. Standard errors for table 9.8: Number of less serious violent or nonviolent criminal incidents reportedto police per 1,000 public school students, by type of incident, urbanicity, and selected school char-acteristics: 1996-97 119
List of Tables

Table Page
S10.1. Standard errors for table 10.1: Number of nonfatal crimes against teachers and average annualnumber of crimes per 1,000 teachers at school, by type of crime and selected teacher characteris-tics: Aggregated from 1994 to 1998 120
S11.1. Standard errors for table 11.1: Percentage and number of teachers who reported that they werethreatened with injury or that they were physically attacked by a student during the past 12 months,by urbanicity and selected teacher and school characteristics: 1993-94 school year 121
512.1. Standard errors for table 12.1: Percentage of students in grades 9 through 12 who reported carryinga weapon on school property at least 1 day in the past 30 days, by selected student characteristics:1993,1995, and 1997 122
512.2. Standard errors for table 12.2: Percentage of students in grades 9 through 12 who reported carryinga weapon at any time at least 1 day in the past 30 days, by selected student characteristics: 1993,1995, and 1997 123
S13.1. Standard errors for table 13.1: Percentage of students ages 12 through 18 who reported fearing be-ing attacked or harmed at school or on the way to and from school during the previous 6 months, byselected student characteristics: 1989,1995, and 1999 124
S14.1. Standard errors for table 14.1: Percentage of students ages 12 through 18 who reported that theyavoided one or more places in school during the previous 6 months, by selected student characteris-tics: 1989,1995, and 1999 125
S15.1 Standard errors for table 15.1: Percentage of students ages 12 through 18 who reported being tar-gets of hate-related words or who saw hate-related graffiti at school during the previous 6 months, byselected student characteristics: 1999 126
S16.1. Standard errors for table 16.1: Percentage of students ages 12 through 18 who reported that streetgangs were present at school during the previous 6 months, by selected student characteristics:1989,1995, and 1999 127
S17.1. Standard errors for table 17.1: Percentage and number of public schools that reported that 1 or moreof 17 discipline issues was a serious problem in their school, by urbanicity and selected school char-acteristics: 1996-97 128
S18.1. Standard errors for table 18.1: Percentage of students in grades 9 through 12 who reported using al-cohol in the last 30 days, by selected student characteristics: 1993,1995, and 1997 129
S19.1. Standard errors for table 19.1: Percentage of students in grades 9 through 12 who reported usingmarijuana in the last 30 days, by selected student characteristics: 1993,1995, and 1997 130
S20.1. Standard errors for table 20.1: Percentage of students in grades 9 through 12 who reported thatdrugs were made available to them on school property during the last 12 months, by selected stu-dent characteristics: 1993,1995, and 1997 131
List of Tables

Table Page
Appendix Tables
A1. Percentage of public schools that reported that they have a zero tolerance policy for various speci-fied student offenses, by selected school characteristics: 1996-97 135
A2. Percentage of public schools that reported that students were required to wear school uniforms, byselected school characteristics: 1996-97 136
A3. Percentage of public schools that reported that they use various types of security measures at theirschools, by selected school characteristics: 1996-97 137
A4. Percentage of public schools that reported various levels of police or other law enforcement repre-sentatives' presence during a typical week, by selected school characteristics: 1996-97 138
A5. Percentage of public schools that reported formal school violence prevention or reduction programsor efforts, by selected school characteristics: 1996-97 139
A6. Number and percentage of schools in which specified disciplinary actions were taken against stu-dents, total number of actions taken, and percentage of specific disciplinary actions taken againststudents, by type of infraction: 1996-97 140
A7. Standard errors for table A1: Percentage of public schools that reported that they have a zero toler-ance policy for various specified student offenses, by selected school characteristics: 1996-97 141
A8. Standard errors for table A2: Percentage of public schools that reported that students were requiredto wear school uniforms, by selected school characteristics: 1996-97 142
A9. Standard errors for table A3: Percentage of public schools that reported that they use various typesof security measures at their schools, by selected school characteristics: 1996-97 143
A10. Standard errors for table A4: Percentage of public schools that reported various levels of police orother law enforcement representatives' presence during a typical week, by selected school charac-teristics: 1996-97 144
A11. Standard errors for table A5: Percentage of public schools that reported formal school violence pre-vention or reduction programs or efforts, by selected school characteristics: 1996-97 145
A12. Standard errors for table A6: Number and percentage of schools in which specified disciplinary ac-tions were taken against students, total number of actions taken, and percentage of specific discipli-nary actions taken against students, by type of infraction: 1996-97 146
B1. Descriptions of data sources and samples used in the report 158
B2. Wording of survey questions used to construct indicators 159
B3. Methods used to calculate standard errors of statistics for different surveys 166
List of Tables

LIST OF FIGURES
Figure Page
1.1. Number of murders and suicides of students at school and of youth ages 5 through 19 away fromschool: 1997 to 1998 2
2.1. Number of nonfatal crimes against students ages 12 through 18 per 1,000 students, by type of crimeand location: 1992 to 1998 5
2.2 Number of nonfatal crimes against students ages 12 through 18 occurring at school or going to orfrom school per 1,000 students, by type of crime and selected student characteristics: 1998 6
2.3 Number of nonfatal crimes against students ages 12 through 18 occurring away from school per1,000 students, by type of crime and selected student characteristics: 1998 7
3.1. Percentage of students ages 12 through 18 who reported criminal victimization at school during theprevious 6 months, by grade level: 1995 and 1999 8
4.1. Percentage of students in grades 9 through 12 who reported being threatened or injured with aweapon on school property during the last 12 months, by gender: 1993,1995, and 1997 9
4.2. Percentage of students in grades 9 through 12 who reported being threatened or injured with aweapon on school property during the last 12 months, by grade: 1993,1995, and 1997 10
4.3. Percentage of students in grades 9 through 12 who reported being threatened or injured with aweapon on school property during the last 12 months, by race/ethnicity: 1993,1995, and 1997 10
5.1. Percentage of students in grades 9 through 12 who reported having been in a physical fight in thelast 12 months, by gender: 1993,1995, and 1997 11
5.2. Percentage of students in grades 9 through 12 who reported having been in a physical fight in thelast 12 months, by grade: 1993,1995, and 1997 12
6.1. Percentage of students ages 12 through 18 who reported being bullied at school during the previous6 months, by grade level and gender: 1999 13
7.1. Percentage of students in grades 9 through 12 who reported having their property stolen or deliber-ately damaged on school property during the last 12 months, by gender: 1993,1995, and 1997 14
7.2. Percentage of students in grades 9 through 12 who reported having their property stolen or deliber-ately damaged on school property during the last 12 months, by grade: 1993,1995, and 1997 15
8.1. Percentage distribution of public schools according to types of crimes reported to police: 1996-97 18
8.2. Percentage of public schools that reported one or more criminal incidents to police and number of in-cidents reported per 1,000 students, by seriousness of crimes, instructional level, and urbanicity:1996-97 19
Figure Page
9.1. Percentage of public schools that reported one or more criminal incidents to police, by type of crimeand instructional level: 1996-97 20
9.2. Number of crimes per 1,000 public school students, by type of crime, instructional level, and ur-banicity: 1996-97 21
10.1. Average annual number of nonfatal crimes against teachers at school per 1,000 teachers, by type ofcrime and selected characteristics: Aggregated from 1994 to 1998 25
11.1. Percentage of teachers who reported that they were threatened with injury or that they were physi-cally attacked by a student from school during the past 12 months, by urbanicity and control: 1993-94 school year 26
12.1. Percentage of students in grades 9 through 12 who reported carrying a weapon at least 1 day in thepast 30 days, by gender: 1993,1995, and 1997 28
12.2. Percentage of students in grades 9 through 12 who reported carrying a weapon at least 1 day in thepast 30 days, by grade: 1993,1995, and 1997 29
13.1. Percentage of students ages 12 through 18 who reported fearing being attacked or harmed at schoolduring the previous 6 months, by race/ethnicity: 1989,1995, and 1999 31
13.2. Percentage of students ages 12 through 18 who reported fearing being attacked or harmed on theway to and from school during the previous 6 months, by race/ethnicity: 1989,1995, and 1999 31
14.1. Percentage of students ages 12 through 18 who reported that they avoided one or more places inschool during the previous 6 months, by race/ethnicity: 1989,1995, and 1999 33
14.2. Percentage of students ages 12 through 18 who reported that they avoided one or more places inschool during the previous 6 months, by urbanicity: 1989,1995, and 1999 33
15.1. Percentage of students ages 12 through 18 who reported being targets of hate-related words or whosaw hate-related graffiti at school during the previous 6 months, by gender and race/ethnicity: 1999.. 34
16.1. Percentage of students ages 12 through 18 who reported that street gangs were present at schoolduring the previous 6 months, by control of school: 1989,1995, and 1999 35
16.2. Percentage of students ages 12 through 18 who reported that street gangs were present at schoolduring the previous 6 months, by urbanicity: 1989,1995, and 1999 36
16.3. Percentage of students ages 12 through 18 who reported that street gangs were present at schoolduring the previous 6 months, by race/ethnicity: 1989,1995, and 1999 36
17.1. Percentage of public schools that reported that 1 or more of 17 discipline issues was a seriousproblem in their school, by instructional level and urbanicity: 1996-97 37
18.1. Percentage of students in grades 9 through 12 who reported using alcohol in the last 30 days, bygender: 1993,1995, and 1997 38

Figure Page
18.2. Percentage of students in grades 9 through 12 who reported using alcohol in the last 30 days, bygrade: 1993,1995, and 1997 39
19.1. Percentage of students in grades 9 through 12 who reported using marijuana in the last 30 days, bygender: 1993,1995, and 1997 41
19.2. Percentage of students in grades 9 through 12 who reported using marijuana in the last 30 days, bygrade: 1993,1995, and 1997 41
20.1. Percentage of students in grades 9 through 12 who reported that drugs were made available to themon school property during the last 12 months, by gender: 1993,1995, and 1997 42
20.2. Percentage of students in grades 9 through 12 who reported that drugs were made available to themon school property during the last 12 months, by grade: 1993,1995, and 1997 43
20.3. Percentage of students in grades 9 through 12 who reported that drugs were made available to themon school property during the last 12 months, by race/ethnicity: 1993,1995, and 1997 43

Violent Deaths at School

1. Violent deaths atschool and awayfrom school
Violent deaths are tragic events
that affect not only the individuals
and their families directly involved
but also everyone in the schools
where they occur. Violent deaths at
school receive national attention;
accurate data on the magnitude of
this problem are important.
From July 1,1997 through June 30,1998, there were 60 school-
associated violent deaths in the United States.1 Forty-seven of these vio-
lent deaths were homicides, 12 were suicides, and one was a teenager
killed by a law enforcement officer in the line of duty.
Thirty-five of the 47 school-associated homicides were of school age chil-
dren. There were a total of 2,752 homicides of children ages 5 through 19
occurring from July 1,1997 through June 30,1998.
Seven of the 12 school-associated suicides occurring between July 1,
1997 through June 30,1998 were of school age children. There were a
total of 2,061 suicides of children ages 5 through 19 occurring that calen-
dar year.
*The data reported here are new.
Figure 1.1.—Number of murders and suicides of students at school and of youth ages 5 through 19
away from school: 1997-1998
1Student murders and suicides at school, July 1,1997 to June 30,1998.
2Murders of youth ages 5 through 19 away from school, July 1,1997 to June 30,1998.
3Suicides of youth ages 5 through 19 away from school, during calendaryear, 1998.
NOTE: "At school" includes on school property, on the way to or from school, and while attending or traveling to or from a school-sponsored event.
SOURCE: Special tabulation using preliminary data from the School Associated Violent Deaths Study, 1997-1998; Special tabulation using the FBI
Supplementary Homicide Reports, 1997 and 1998; U.S. Department of Health and Human Services, Public Health Service, Centers for Disease
Control and Prevention, National Center for Health Statistics, Vital Statistics of the United States, 1997 and 1998.
1See glossary for definition of school-associated violent deaths.
Violent Deaths at School

Nonfatal Student Victimization-Student Reports

2. Victimization ofstudents at schooland away fromschool*
The amount of crime committed in
the nation's schools continues to be
a concern. While crime has de-
creased in recent years, theft and
violence at school and to and from
school can lead to disruptive and
threatening environments reducing
student performance.
This indicator has been updated to include1998 data.
• Students ages 12 through 18 experienced fewer nonfatal serious violent
crimes (that is, rape, sexual assault, robbery, and aggravated assault)
when they were at school than away from school. In 1998, students in this
age group were victims of about 253,000 such crimes at school, and
about 550,000 away from school (tables 2.1 and 2.3). The victimization
rate for serious violent crime was about the same at school from 1992 to
1998 and declined from 1992 to 1998 away from school (figure 2.1 and
tables 2.2 and 2.4).
• Students ages 12 through 18 were victims of about 1.2 million nonfatal
violent crimes (that is, serious violent crime plus simple assault) at school,
and about 1.3 million away from school in 1998 (tables 2.1 and 2.3). There
was a decline in the victimization rate between 1992 and 1998 at school
as well as away from school (from 48 to 43 and from 71 to 48 per 1,000
students ages 12 through 18, respectively) (figure 2.1 and tables 2.2 and
2.4). During most of this period, the victimization rates for nonfatal violent
crime were generally lower at school than away from school.2
• Students ages 12 through 18 were more likely to be victims of theft at
school than away from school each year between 1992 and 1998, except
for 1997. In that year, about the same number of thefts occurred at and
away from school. In 1998, about 1.6 million thefts occurred at school (58
percent of all crimes at school), and about 1.2 million away from school
(49 percent of all crimes away from school) (tables 2.1 and 2.3). The vic-
timization rate declined for thefts at school between 1992 and 1998 as it
did for thefts away from school during this period (figure 2.1 and tables 2.2
and 2.4).
• Considering total nonfatal crime (theft plus violent crime), 12- through 18-
year-old students were victims of about 2.7 million crimes while they were
at school in 1998, and about 2.5 million away from school (tables 2.1 and
2.3). These represent victimization rates of 101 crimes per 1,000 students
at school, and 95 crimes per 1,000 students away from school (figure 2.1
and tables 2.2 and 2.4).
• In 1998, the rates for serious violent crimes and theft were about the
same for males and females at school, but higher for males than females
away from school (figures 2.2 and 2.3 and tables 2.2 and 2.4).
• In 1998,12- through 18-year-old students living outside urban areas were
just as vulnerable to serious violent crime and theft at school as were ur-
ban students (figure 2.2 and table 2.2). Away from school, urban and sub-
urban students were more vulnerable to serious violent crime and theft
than were rural students (figure 2.3 and table 2.4).
• Younger students (ages 12 through 14) were more likely than older stu-dents (ages 15 through 18) to be victims of crime at school. However,older students were more likely than younger students to be victimizedaway from school (figures 2.2 and 2.3 and tables 2.2 and 2.4).
2The reader should be cautious in making comparisons between victimization rates onschool property and elsewhere. These data do not take into account the number ofhours that students spend on school property and the number of hours they spend else-where.
Nonfatal Student Victimization

Figure 2.1.—Number of nonfatal crimes against students ages 12 through 18 per 1,000 students,by type of crime and location: 1992 to 1998
NOTE: Serious violent crimes include rape, sexual assault, robbery, and aggravated assault. Violent crimes include serious violent crimes and
simple assault. Total crimes include violent crimes and theft. "At school" includes inside the school building, on school property, or on the way to or
from school.
SOURCE: U.S. Department of Justice, Bureau of Justice Statistics, National Crime Victimization Survey, 1992 to 1998.
Nonfatal Student Victimization

Figure 2.2.—Number of nonfatal crimes against students ages 12 through 18 occurring at schoolor going to or from school per 1,000 students, by type of crime and selected studentcharacteristics: 1998
NOTE: Serious violent crimes include rape, sexual assault, robbery, and aggravated assault. Violent crimes include serious violent crimes and
simple assault. Total crimes include violent crimes and theft. "At school" includes inside the school building, on school property, or on the way to or
from school. Detail may not add to totals because of rounding.
SOURCE: U.S. Department of Justice, Bureau of Justice Statistics, National Crime Victimization Survey, 1998.
Nonfatal Student Victimization

Figure 2.3.—Number of nonfatal crimes against students ages 12 through 18 occurring away fromschool per 1,000 students, by type of crime and selected student characteristics: 1998
NOTE: Serious violent crimes include rape, sexual assault, robbery, and aggravated assault. Violent crimes include serious violent crimes and
simple assault. Total crimes include violent crimes and theft. Detail may not add to totals because of rounding.
SOURCE: U.S. Department of Justice, Bureau of Justice Statistics, National Crime Victimization Survey, 1998.
Nonfatal Student Victimization

3. Prevalence ofstudents beingvictimized atschool*
Some of the crimes committed
against students involve violence,
while others involve their property.
Presenting information on the
prevalence of victimization for stu-
dents helps clarify what percentage
of students are affected by different
types of crime.
*The data reported here are new.
• In 1999, a smaller percentage of students ages 12 through 18 reported
being victims of nonfatal crimes (including either theft or violent crimes) at
school during the previous 6 months than in 1995 (10 percent and 8 per-
cent, respectively)(figure 3.1 and table 3.1). About 7 percent in 1995 were
victims of theft compared with 6 percent in 1999. Also, 3 percent of stu-
dents in 1995 reported being victims of violence at school compared with
2 percent in 1999.
• The decline in the prevalence of victimization between 1995 and 1999 was
due in part to a decline for students in grades 7 through 9 (figure 3.1 and
table 3.1). Between 1995 and 1999, the prevalence of reported victimiza-
tion dropped from 11 percent to 8 percent for 7th graders, from 11 percent
to 8 percent for 8th graders, and from 12 percent to 9 percent for 9th
graders. During the same period, the prevalence of victimization remained
relatively constant for 6th, 10th, 11th, and 12th graders.
• In both 1995 and 1999, public school students were more likely to report
having been victims of violent crime during the previous 6 months than
were private school students (table 3.1). Public school students were also
more likely than private school students to report being victims of theft at
school in 1995, but equally likely to experience theft in 1999.
Figure 3.1.—Percentage of students ages 12 through 18 who reported criminal victimization atschool during the previous 6 months, by grade level: 1995 and 1999
NOTE: This figure presents the prevalence of total victimization, which is a combination of violent victimization and theft. "At school" means in the
school building, on school property, or on the way to or from school. (See Technical Notes in appendix B for further information.)
SOURCE: U.S. Department of Justice, Bureau of Justice Statistics, School Crime Supplement to the National Crime Victimization
Survey, January-June 1995 and 1999.
Nonfatal Student Victimization

4. Prevalence ofstudents beingthreatened orinjured with aweapon on schoolproperty*
Every year, some students are
threatened or injured with a weapon
while they are on school property.
The percentages of students vic-
timized in this way provide an im-
portant measure of how safe our
schools are and how this is chang-
ing over time.
This indicator repeats information from the1999 Indicators of School Crime and Safetyreport.
• The percentage of students in grades 9 through 12 who were threatened
or injured with a weapon on school property in the 12 months before the
survey has remained constant in recent years. In 1993,1995, and 1997,
about 7 to 8 percent of students reported being threatened or injured with
a weapon such as a gun, knife, or club on school property in the past 12
months (figure 4.1 and table 4.1).
• In each survey year, males were more likely than females to report being
threatened or injured with a weapon on school property (figure 4.1 and ta-
ble 4.1). For example, in 1997,10 percent of males reported being threat-
ened or injured in the past year, compared with 4 percent of females.
Moreover, the percentage of females who reported being threatened or
injured declined slightly over the period—from about 5 percent in 1993 to
4 percent in 1997.
• Of 9th through 12th graders, those students in lower grades were more
likely to be threatened or injured with a weapon on school property than
were students in higher grades (figure 4.2 and table 4.1). For example, in
1993,9 percent of 9th graders reported being threatened or injured, com-
pared with 6 percent of 12th graders. The comparable percentages in
1997 were 10 percent for 9th graders and 6 percent for 12th graders.
• There were few racial/ethnic differences in the percentages of students
being threatened or injured with a weapon on school property in the 12
months in each year (figure 4.3 and table 4.1). About the same percent-
age of students from each racial/ethnic group reported being threatened
or injured.3
Figure 4.1.—Percentage of students in grades 9 through 12 who reported being threatened or
injured with a weapon on school property during the last 12 months, by gender: 1993,
1995, and 1997
3While there appear to be large differences among racial/ethnic groups, these differ-ences are associated with large standard errors, making these estimates somewhatunreliable, and the differences are not statistically significant.
Nonfatal Student Victimization

Figure 4.2.—Percentage of students in grades 9 through 12 who reported being threatened orinjured with a weapon on school property during the last 12 months, by grade:1993,1995, and 1997
*The response rate for this survey was less than 70 percent and a full nonresponse bias analysis has not been done to date.
NOTE: "On school property" was not defined for survey respondents.
SOURCE: U.S. Department of Health and Human Services, Public Health Service, Centers for Disease Control and Prevention, National Center for
Health Statistics, National Health Interview Survey—Youth Risk Behavior Survey, 1993,1995, and 1997.
Figure 4.3.—Percentage of students in grades 9 through 12 who reported being threatened orinjured with a weapon on school property during the last 12 months, by race/ethnicity: 1993,1995, and 1997
*The response rate for this survey was less than 70 percent and a full nonresponse bias analysis has not been done to date.
NOTE: "On school property" was not defined for survey respondents.
SOURCE: U.S. Department of Health and Human Services, Public Health Service, Centers for Disease Control and Prevention, National Center for
Health Statistics, National Health Interview Survey—Youth Risk Behavior Survey, 1993,1995, and 1997.
Nonfatal Student Victimization

5. Prevalence of stu-dents involved inphysical fights onschool property*
Schools where there are numerous
physical fights may not be able to
maintain a focused learning envi-
ronment. Students who are con-
stantly involved in fights on school
property cannot be ready to learn.
*This indicator repeats information from the1999 Indicators of School Crime and Safetyreport.
• In 1997, about 15 percent of all students in grades 9 through 12 said that
they had been in a physical fight on school property in the last 12 months
(figure 5.1 and table 5.1). In that same year, 37 percent reported that they
had been in a physical fight in any location (including on school property).
• The percentage of students who reported being in a fight anywhere de-
clined slightly from 1993 to 1997-from 42 percent in 1993 to 37 percent
in 1997 (figure 5.1 and table 5.1). However, the percentages of students
who reported fighting on school property across these years were similar.
• Males were more likely than females to have been in a fight anywhere and
on school property (figure 5.1 and table 5.1). In 1997, 46 percent of males
said they had been in a fight in the last 12 months, and 20 percent said
they had been in a fight on school property. In that same year, about 26
percent of females reported they had been in a fight, and 9 percent said
they had been in a fight on school property.
• Of 9th through 12th graders, those students in lower grades reported be-
ing in more fights than students in higher grades anywhere and on school
property (figure 5.2 and table 5.1). For example, in 1997, 21 percent of 9th
graders reported that they were in a fight on school property in the last 12
months; in contrast, 10 percent of 12th graders were in fights on school
property.
Figure 5.1.—Percentage of students in grades 9 through 12 who reported having been in a physicalfight in the last 12 months, by gender: 1993,1995, and 1997
*The response rate for this survey was less than 70 percent and a full nonresponse bias analysis has not been done to date.
NOTE: "On school property" was not defined for survey respondents.
SOURCE: U.S. Department of Health and Human Services, Public Health Service, Centers for Disease Control and Prevention, National Center for
Health Statistics, National Health Interview Survey—Youth Risk Behavior Survey, 1993,1995, and 1997.
Nonfatal Student Victimization

Figure 5.2.—Percentage of students in grades 9 through 12 who reported having been in a physicalfight in the last 12 months, by grade: 1993,1995, and 1997
*The response rate for this survey was less than 70 percent and a full nonresponse bias analysis has not been done to date.
NOTE: "On school property" was not defined for survey respondents.
SOURCE: U.S. Department of Health and Human Services, Public Health Service, Centers for Disease Control and Prevention, National Center for
Health Statistics, National Health Interview Survey—Youth Risk Behavior Survey, 1993,1995, and 1997.
Nonfatal Student Victimization

6. Prevalence ofstudents beingbullied at school
Bullying contributes to a climate of
fear and intimidation in schools.
Students ages 12 through 18 were
asked if they had been bullied (that
is, picked on or made to do things
they did not want to do) at school.
The data reported here are from a differentsource than the data presented for thisindicator in earlier editions.
• In 1999, about 5 percent of students ages 12 through 18 reported that
they had been bullied at school in the last 6 months (table 6.1). In general,
females were as likely as males to report being bullied.
• Males were more likely to be bullied in grades 6 and 7 than were females
(12 percent versus 7 percent respectively), while there was little difference
in the percentage of males and females being bullied in the other two
grade levels (table 6.1 and figure 6.1).
• There were few differences among racial/ethnic groups in the percentage
of students who reported being bullied (table 6.1). The exception was that
white and black students were more likely to report being victimized by
bullies than were students of other, non-Hispanic origin. About 2 percent
in this group, which includes Asians, Pacific Islanders, American Indians,
and Alaskan Natives, reported being bullied, compared with about 5 per-
cent of white and 6 percent of black students.
• Students in lower grades were more likely to be bullied than students in
higher grades (table 6.1 and figure 6.1). About 10 percent of students in
grades 6 and 7 reported being bullied, compared with about 5 percent of
students in grades 8 and 9 and about 2 percent in grades 10 through 12.
Figure 6.1.—Percentage of students ages 12 through 18 who reported being bullied at school
during the previous 6 months, by grade level and gender: 1999
NOTE: "At school" means in the school building, on the school grounds, or on a school bus.
SOURCE: U.S. Department of Justice, Bureau of Justice Statistics, School Crime Supplement to the National Crime Victimization Survey, January-
June, 1999.
Nonfatal Student Victimization

7. Prevalence ofstudents havingproperty stolen ordeliberately damagedon school property
One way that students are victim-
ized at school is by having their
personal property stolen or deliber-
ately damaged. While less harmful
than attacks on students them-
selves, such crimes have financial
consequences and can divert stu-
dents' attention from their studies
as well as contribute to perceptions
of schools as unsafe places.
*This indicator repeats information from the
1999 Indicators of School Crime and Safety
report.
• It is relatively common for students to have something stolen or damaged
on school property. In 1997, about one-third of all students in grades 9
through 12 said that someone stole or deliberately damaged their prop-
erty, such as their car, clothing, or books, on school property during the
last 12 months (figure 7.1 and table 7.1). This proportion was similar in
1993 and 1995.
• Generally, males were more likely than females to report being victims of
theft or deliberate property damage on school property. In 1993,1995,
and 1997, about 28 percent of females reported being victimized, com-
pared with 37 percent of males in 1993, 41 percent in 1995, and 36 per-
cent in 1997 (table 7.1).
• Students in lower grades were more likely than students in higher grades
to report having something stolen or deliberately damaged at school (fig-
ure 7.2 and table 7.1). For example, in 1997, 37 percent of 9th graders
had something of theirs damaged or stolen, compared with 28 percent of
12th graders.
Figure 7.1.—Percentage of students in grades 9 through 12 who reported having their property
stolen or deliberately damaged on school property during the last 12 months, by
gender: 1993,1995, and 1997
*The response rate for this survey was less than 70 percent and a full nonresponse bias analysis has not been done to date.
NOTE: "On school property" was not defined for survey respondents.
SOURCE: U.S. Department of Health and Human Services, Public Health Service, Centers for Disease Control and Prevention, National Center for
Health Statistics, National Health Interview Survey—Youth Risk Behavior Survey, 1993,1995, and 1997.
Nonfatal Student Victimization

Figure 7.2.—Percentage of students in grades 9 through 12 who reported having their propertystolen or deliberately damaged on school property during the last 12 months, bygrade: 1993,1995, and 1997
*The response rate for this survey was less than 70 percent and a full nonresponse bias analysis has not been done to date.
NOTE: "On school property" was not defined for survey respondents.
SOURCE: U.S. Department of Health and Human Services, Public Health Service, Centers for Disease Control and Prevention, National Center for
Health Statistics, National Health Interview Survey—Youth Risk Behavior Survey, 1993,1995, and 1997.
Nonfatal Student Victimization

Violence and Crime at School-Public School Principal/Disciplinarian Reports

8. Crimes reported tothe police
The number of crimes that princi-
pals indicated they reported to po-
lice or other law enforcement
representatives is a useful measure
of the occurrences of serious
crimes in the nation's schools. The
percentage of schools reporting
crimes provides an indication of
how widespread crime is, while the
number of crimes reported provides
information on the magnitude of the
problem.
*This indicator repeats information from the1999 Indicators of School Crime and Safetyreport.
• In 1996-97,10 percent of all public schools reported at least one serious
violent crime to a law enforcement representative (figure 8.1 and table
8.1). Another 47 percent of public schools reported a less serious violent
or nonviolent crime (but not a serious violent one). The remaining 43 per-
cent of public schools did not report any of these crimes to the police.
• The vast majority of crimes reported by public schools were of the less
serious violent or nonviolent type in 1996-97 (402,000 out of the 424,000
total crimes reported to the police) (table 8.3).
• The percentage of schools reporting crimes was similar at the middle and
high school levels (figure 8.2 and table 8.1). At each level, about 20 per-
cent of the schools reported at least one serious violent crime, and about
55 percent reported at least one less serious violent or nonviolent crime,
but no serious violent crime in 1996-97.
• The numbers of reported incidents per 1,000 students were similar for
middle and high schools for both serious violent and less serious violent
and nonviolent crimes (figure 8.2 and table 8.4). For both types of crimes,
there was a lower rate at the elementary level than at the middle or high
school levels.
• The percentage of schools reporting at least one serious violent crime was
much higher in cities (17 percent) than in towns (5 percent) or rural areas
(8 percent) during 1996-97 (figure 8.2 and table 8.1).
Figure 8.1.—Percentage distribution of public schools according to types of crimes reported to
police: 1996-97
NOTE: Serious violent crimes include murder, rape or other type of sexual battery, suicide, physical attack or fight with a weapon, or robbery. Less
serious or nonviolent crimes include physical attack or fight without a weapon, theft/larceny, and vandalism. Schools were asked to report crimes
that took place in school buildings, on school buses, on school grounds, and at places holding school-sponsored events.
SOURCE: U.S. Department of Education, National Center for Education Statistics, Fast Response Survey System, "Principal/School Disciplinarian
Survey on School Violence," FRSS 63,1997.
Violence and Crime at School

Figure 8.2.—Percentage of public schools that reported one or more criminal incidents to policeand number of incidents reported per 1,000 students, by seriousness of crimes,instructional level, and urbanicity: 1996-97
Public schools reporting incidents
NOTE: Serious violent crimes include murder, rape or other type of sexual battery, suicide, physical attack or fight with a weapon, or robbery. Less
serious or nonviolent crimes include physical attack or fight without a weapon, theft/larceny, and vandalism. Schools were asked to report crimes
that took place in school buildings, on school buses, on school grounds, and at places holding school-sponsored events.
SOURCE: U.S. Department of Education, National Center for Education Statistics, Fast Response Survey System, "Principal/School Disciplinarian
Survey on School Violence," FRSS 63,1997.
Violence and Crime at School

9. Specific crimesreported to thepolice
Data on the prevalence of specific
types of crimes add detail to the
more general discussion of serious
violent crimes and less serious
violent and nonviolent crimes. Each
type of crime affects students and
schools differently.
This indicator repeats information from the
1999 Indicators of School Crime and Safety
report.
• About one-half (44 to 55 percent) of all public middle and high schools
reported incidents of vandalism, theft or larceny, and physical attacks or
fights without weapons to the police or other law enforcement representa-
tives in the 1996-97 school year (figure 9.1 and table 9.2). Considerably
smaller percentages of public middle and high schools reported the more
serious violent crimes of rape or other type of sexual battery (5 and 8 per-
cent, respectively); robbery (5 and 8 percent); or physical attack or fight
with a weapon (12 and 13 percent) (table 9.1).
• Elementary schools were much less likely than either middle or high
schools to report any of the types of crime described here in 1996-97 (fig-
ure 9.1 and tables 9.1 and 9.2). They were much more likely to report
vandalism (31 percent) than any other crime (19 percent or less).
• In 1996-97, physical attack or fight without a weapon was generally the
most commonly reported crime at the middle and high school levels (9
and 8 per 1,000 public school students, respectively) (figure 9.2 and table
9.8). Theft or larceny was more common at the high school than the mid-
dle school level (6 versus 4 per 1,000 students).
• Overall, there was relatively little variation by urbanicity in the crime rates
at school discussed here during the 1996-97 school year (as measured
by the number of crimes reported per 1,000 public school students) (figure
9.2 and tables 9.7 and 9.8).
Figure 9.1.—Percentage of public schools that reported one or more criminal incidents to police,
by type of crime and instructional level: 1996-97
Type of crime
NOTE: Examples of weapons are guns, knives, sharp-edged or pointed objects, baseball bats, frying pans, sticks, rocks, and bottles. Schools were
asked to report crimes that took place in school buildings, on school buses, on school grounds, and at places holding school-sponsored events.
SOURCE: U.S. Department of Education, National Center for Education Statistics, Fast Response Survey System, "Principal/School Disciplinarian
Survey on School Violence," FRSS 63,1997.
Violence and Crime at School

Figure 9.2.—Number of crimes per 1,000 public school students, by type of crime, instructional level,and urbanicity: 1996-97
NOTE: Examples of weapons are guns, knives, sharp-edged or pointed objects, baseball bats, frying pans, sticks, rocks, and bottles. Schools were
asked to report crimes that took place in school buildings, on school buses, on school grounds, and at places holding school-sponsored events.
SOURCE: U.S. Department of Education, National Center for Education Statistics, Fast Response Survey System, "Principal/School Disciplinarian
Survey on School Violence," FRSS 63,1997.
Violence and Crime at School

Nonfatal Teacher Victimization at School—Teacher Reports

10. Nonfatal teachervictimization atschool*
Students are not the only ones who
are victims of crime at school.
Teachers in school can also be the
targets of violence and theft. In
addition to the personal toll such
violence takes on teachers, those
who worry about their safety may
have difficulty teaching and may
leave the profession altogether.
Information on the number of
crimes against teachers at school
can help show how severe and
widespread the problem is.
*The data reported here are new.
• Over the 5-year period from 1994 through 1998, teachers were the victims
of approximately 1,755,000 nonfatal crimes at school, including 1,087,000
thefts and 668,000 violent crimes (rape or sexual assault, robbery, aggra-
vated assault, and simple assault) (table 10.1). On average, this translates
into 351,000 nonfatal crimes per year, or 83 crimes per 1,000 teachers per
year. Among the violent crimes against teachers during this 5-year period,
there were about 80,000 serious violent crimes (12 percent of the violent
crimes), including rape or sexual assault, robbery, and aggravated as-
sault. On average, this translates into 16,000 serious violent crimes per
year.
• During the 1994-98 period, the average annual rate of serious violent
crime was similar for teachers (on average, 4 per 1,000 teachers), re-
gardless of their instructional level, gender, race/ethnicity, and the ur-
banicity of the schools where they taught (figure 10.1 and table 10.1).4
• In the period from 1994 through 1998, senior high school and mid-
dle/junior high school teachers were more likely to be victims of violent
crimes (most of which were simple assaults) than elementary school
teachers (38 and 60, respectively, versus 18 crimes per 1,000 teachers)
(figure 10.1 and table 10.1).
• During the 1994-98 period, senior high and middle/junior high school
teachers were more likely to be targets of theft than elementary school
teachers (63 and 67, respectively, versus 39 thefts per 1,000 teachers)
(figure 10.1 and table 10.1).
• The average annual violent crime rate for teachers at school varied by
gender. Over the 5-year period from 1994 through 1998, male teachers
were more likely to be victims of violent crimes than female teachers (53
versus 25 crimes per 1,000 teachers) (figure 10.1 and table 10.1).
• Teachers were differentially victimized by crimes at school according to
where they taught. For example, over the 5-year period from 1994 through
1998, urban teachers were more likely to be victims of violent crimes than
rural and suburban teachers (40 versus 24 and 24, respectively, per 1,000
teachers). Urban teachers were also more likely to experience theft than
suburban and rural teachers (63 versus 46 and 31 per 1,000 teachers, re-
spectively) (figure 10.1 and table 10.1).
4The average annual rate is the sum of all teacher victimizations across five years di-vided by the sum of all teachers over those five years.
Nonfatal Teacher Victimization

Figure 10.1.—Average annual number of nonfatal crimes against teachers at school per 1,000teachers, by type of crime and selected characteristics: Aggregated from 1994 to 1998
NOTE: Serious violent crimes include rape, sexual assault, robbery, and aggravated assault. Violent crimes include serious violent crimes and
simple assault. Total crimes include violent crimes and theft. The data were aggregated from 1994 to 1998 due to the small number of teachers in
each year's sample. Detail may not add to totals because of rounding. "At school" includes inside the school building, on school property, at work
site, or while working. For thefts, "while working" was not considered since thefts of teachers' property kept at school can occur when teachers are
not present.
SOURCE: U.S. Department of Justice, Bureau of Justice Statistics, National Crime Victimization Survey, 1994 to 1998.
Nonfatal Teacher Victimization

11. Prevalence ofteachers beingthreatened withinjury or attackedby students
Some of the offenses against
teachers are committed by stu-
dents. Data on physical attacks and
threats against elementary and
secondary teachers by students
can provide a snapshot of the
prevalence of this problem.
This indicator repeats information from the1999 Indicators of School Crime and Safetyreport.
• In the 1993-94 school year, 12 percent of all elementary and secondary
school teachers (341,000) were threatened with injury by a student from
their school, and 4 percent (119,000) were physically attacked by a stu-
dent (table 11.1).
• Teachers in central city schools were more likely to be victims than were
teachers in urban fringe or rural schools in 1993-94 (table 11.1). About 15
percent of teachers in central city schools had been threatened with injury
by students, compared with 11 and 10 percent of teachers in urban fringe
and rural schools. About 6 percent of teachers in central city schools had
been attacked by students, compared with 4 and 3 percent of teachers in
urban fringe and rural schools.
• Public school teachers were more likely than private school teachers to be
victimized by students in school in 1993-94 (figure 11.1 and table 11.1).
Almost 13 percent of public school teachers had been threatened with in-
jury by students, compared with 4 percent of private school teachers, and
4 percent of public school teachers had been physically attacked by stu-
dents, compared with 2 percent of private school teachers. Teachers in
public central city schools were about five times more likely to be targets
of threats of injury and about three times more likely to be targets of at-
tacks than their colleagues in private central city schools.
• In 1993-94, secondary school teachers were more likely than elementary
school teachers to have been threatened with injury by a student from
their school (15 percent versus 9 percent) (table 11.1). However, ele-
mentary school teachers were more likely than secondary school teachers
to have been physically attacked by a student (5 percent versus 3 per-
cent). The prevalence of teacher victimization by students did not vary ac-
cording to the racial/ethnic backgrounds of teachers.
Figure 11.1.—Percentage of teachers who reported that they were threatened with injury or that
they were physically attacked by a student from school during the past 12 months,
by urbanicity and control: 1993-94 school year
SOURCE: U.S. Department of Education, National Center for Education Statistics, Schools and Staffing Survey, 1993-94 (Teacher and School
Questionnaires).
Nonfatal Teacher Victimization

School Environment
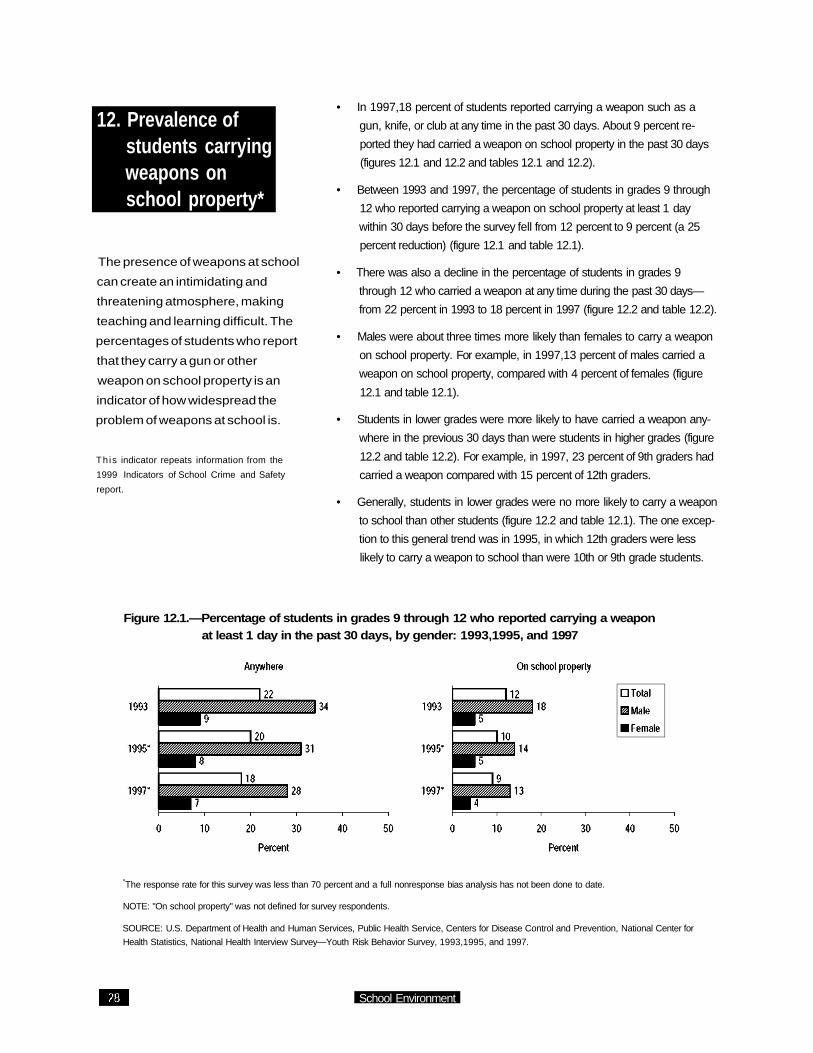
12. Prevalence ofstudents carryingweapons onschool property*
The presence of weapons at school
can create an intimidating and
threatening atmosphere, making
teaching and learning difficult. The
percentages of students who report
that they carry a gun or other
weapon on school property is an
indicator of how widespread the
problem of weapons at school is.
This indicator repeats information from the
1999 Indicators of School Crime and Safety
report.
• In 1997,18 percent of students reported carrying a weapon such as a
gun, knife, or club at any time in the past 30 days. About 9 percent re-
ported they had carried a weapon on school property in the past 30 days
(figures 12.1 and 12.2 and tables 12.1 and 12.2).
• Between 1993 and 1997, the percentage of students in grades 9 through
12 who reported carrying a weapon on school property at least 1 day
within 30 days before the survey fell from 12 percent to 9 percent (a 25
percent reduction) (figure 12.1 and table 12.1).
• There was also a decline in the percentage of students in grades 9
through 12 who carried a weapon at any time during the past 30 days—
from 22 percent in 1993 to 18 percent in 1997 (figure 12.2 and table 12.2).
• Males were about three times more likely than females to carry a weapon
on school property. For example, in 1997,13 percent of males carried a
weapon on school property, compared with 4 percent of females (figure
12.1 and table 12.1).
• Students in lower grades were more likely to have carried a weapon any-
where in the previous 30 days than were students in higher grades (figure
12.2 and table 12.2). For example, in 1997, 23 percent of 9th graders had
carried a weapon compared with 15 percent of 12th graders.
• Generally, students in lower grades were no more likely to carry a weapon
to school than other students (figure 12.2 and table 12.1). The one excep-
tion to this general trend was in 1995, in which 12th graders were less
likely to carry a weapon to school than were 10th or 9th grade students.
Figure 12.1.—Percentage of students in grades 9 through 12 who reported carrying a weaponat least 1 day in the past 30 days, by gender: 1993,1995, and 1997
*The response rate for this survey was less than 70 percent and a full nonresponse bias analysis has not been done to date.
NOTE: "On school property" was not defined for survey respondents.
SOURCE: U.S. Department of Health and Human Services, Public Health Service, Centers for Disease Control and Prevention, National Center for
Health Statistics, National Health Interview Survey—Youth Risk Behavior Survey, 1993,1995, and 1997.
School Environment

Figure 12.2.—Percentage of students in grades 9 through 12 who reported carrying a weaponat least 1 day in the past 30 days, by grade: 1993,1995, and 1997
0 10 20 30 40 50
Percent
*The response rate for this survey was less than 70 percent and a full nonresponse bias analysis has not been done to date.
NOTE: "On school property" was not defined for survey respondents.
SOURCE: U.S. Department of Health and Human Services, Public Health Service, Centers for Disease Control and Prevention, National Center for
Health Statistics, National Health Interview Survey—Youth Risk Behavior Survey, 1993,1995, and 1997.
School Environment

13. Students'perceptions ofpersonal safety atschool and whentraveling to andfrom school
One consequence of school vio-
lence is the fear that it can instill in
students. Students who fear for
their own safety may not be able or
ready to learn. Concerns about
vulnerability to attacks by others at
school and on the way to and from
school may also have a detrimental
effect on the school environment
and learning.
The 1999 data reported here are new.Comparisons between the 1989 data andthe 1995 and 1999 data should be madewith caution due to changes in the ques-tionnaire. See appendix B for details.
• Between 1995 and 1999, there were decreases in the percentages of
students feeling unsafe while they were at school and while they were
going to and from school (figures 13.1 and 13.2 and table 13.1). In 1995,9
percent of students ages 12 through 18 sometimes or most of the time
feared they were going to be attacked or harmed at school, while in 1999
this percentage fell to 5 percent. Between these years, the percentage of
students fearing they would be attacked while traveling to and from school
fell from 7 percent to 4 percent.
• Between 1995 and 1999, there was a decline in fear of attacks at school
and when traveling to and from school among all racial/ethnic groups.
However, in both years, larger percentages of black and Hispanic students
than white students feared such attacks (figures 13.1 and 13.2 and table
13.1).
• In both 1995 and 1999, students in lower grades were more likely to fear
for their safety at school than were students in higher grades (table 13.1).
For example, in 1999,9 percent of students in grade 6 feared for their
safety while at school, compared with 3 percent of students in grade 12.
• Between 1995 and 1999 there was a decline in fear of attacks at school
and to and from school within almost all grades. However, in both 1995
and 1999, students in lower grades were also more likely than students in
higher grades to fear being attacked on the way to and from school (table
13.1).
• Between 1995 and 1999 there was a decline in fear of attacks at school
and to and from school for students in all areas—urban, suburban and ru-
ral. However, in 1999, as in 1995, students in urban schools were more
likely than students in suburban or rural schools to fear being attacked at
school and when travelling to and from school (table 13.1).
School Environment

Figure 13.1.—Percentage of students ages 12 through 18 who reported fearing being attackedor harmed at school during the previous 6 months, by race/ethnicity: 1989,1995,and 1999
NOTE: Comparisons between the 1989 data and the 1995 and 1999 data should be made with caution due to changes in the questionnaire. Also,
the 1989 data include students ages 12 through 19. See appendix B for details. Includes students who reported that they sometimes or most of the
time feared being victimized in this way. "At school" means in the school building, on the school grounds, or on a school bus.
SOURCE: U.S. Department of Justice, Bureau of Justice Statistics, School Crime Supplement to the National Crime Victimization Survey, January-
June, 1989,1995, and 1999.
Figure 13.2.—Percentage of students ages 12 through 18 who reported fearing being attackedor harmed on the way to and from school during the previous 6 months, by race/ethnicity: 1989,1995, and 1999
Percent20
NOTE: Comparisons between the 1989 data and the 1995 and 1999 data should be made with caution due to changes in the questionnaire. Also,
the 1989 data include students ages 12 through 19. See appendix B for details. Includes students who reported that they sometimes or most of the
time feared being victimized in this way. "At school" means in the school building, on the school grounds, or on a school bus.
SOURCE: U.S. Department of Justice, Bureau of Justice Statistics, School Crime Supplement to the National Crime Victimization Survey, January-
June, 1989,1995, and 1999.
School Environment

14. Students' reportsof avoiding placesin school
One consequence of crime in
school is that students begin to
perceive specific areas in school as
unsafe. In trying to ensure their
own safety, they begin to avoid
these areas. Changes in the per-
centage of students avoiding areas
in school may be a good barometer
of how safe schools are—at least
in the minds of those who attend
these schools.
*The 1999 data reported here are new.Comparisons between the 1989 data andthe 1995 and 1999 data should be madewith caution due to changes in the ques-tionnaire. See appendix B for details.
• Between 1995 and 1999, there was a decrease in the percentage of stu-
dents ages 12 through 18 who avoided one or more places in school—
from 9 percent in 1995 to 5 percent in 1999 (figure 14.1 and table 14.1).
Despite this decline, this percentage still represented 1.1 million students
in 1999 who reported avoiding some areas in school out of fear for their
own safety.
• The percentage of students of all racial/ethnic groups avoiding specific
areas in school fell between 1995 and 1999 (figure 14.1 and table 14.1).
In both 1995 and 1999, black and Hispanic students were more likely to
avoid areas in school than were white students.
• Between 1995 and 1999, there was a decrease in the percentage of stu-
dents reporting avoiding areas in school among students of almost all
grade levels (table 14.1). However, in both years, students in lower grades
were more likely than students in higher grades to report avoiding areas in
school.
• While in 1995, students in urban areas were more likely than suburban
students to avoid areas in school (12 percent versus 8 percent, respec-
tively), by 1999 urban and suburban students were equally as likely to
avoid areas in school (figure 14.2 and table 14.1).
School Environment

Figure 14.1.—Percentage of students ages 12 through 18 who reported that they avoided one ormore places in school during the previous 6 months, by race/ethnicity: 1989,1995,and 1999
Percent20 i
NOTE: Comparisons between the 1989 data and the 1995 and 1999 data should be made with caution due to changes in the questionnaire. Also,
the 1989 data include students ages 12 through 19. See appendix B for details. Places include the entrance into the school, any hallways or stairs
in the school, parts of the school cafeteria, any school restrooms, and other places inside the school building.
SOURCE: U.S. Department of Justice, Bureau of Justice Statistics, School Crime Supplement to the National Crime Victimization Survey, January-
June, 1989,1995, and 1999.
Figure 14.2.—Percentage of students ages 12 through 18 who reported that they avoided one ormore places in school during the previous 6 months, by urbanicity: 1989,1995, and
1999
Percent20 i
NOTE: Comparisons between the 1989 data and the 1995 and 1999 data should be made with caution due to changes in the questionnaire. Also,
the 1989 data include students ages 12 through 19. See appendix B for details. Places include the entrance into the school, any hallways or stairs
in the school, parts of the school cafeteria, any school restrooms, and other places inside the school building.
SOURCE: U.S. Department of Justice, Bureau of Justice Statistics, School Crime Supplement to the National Crime Victimization Survey, January-
June, 1989,1995, and 1999.
School Environment

15. Students'reportsof being calledhate-related wordsand seeing hate-related graffiti
A student's exposure to hate-
related words or symbols at school
can increase his or her feeling of
vulnerability. An environment in
which students are confronted with
discriminatory behavior is not con-
ducive to learning and creates a
climate of hostility.
*This is a new indicator.
• In 1999, about 13 percent of students ages 12 through 18 reported that
someone at school had used hate-related words against them (figure 15.1
and table 15.1). That is, in the prior 6 months someone at school called
them a derogatory word having to do with race/ethnicity, religion, disability,
gender, or sexual orientation. In addition, about 36 percent of students
saw hate-related graffiti at school.
• There was very little variation in these percentages based on the location
of the students' households (table 15.1). Students in urban, suburban, and
rural households were equally as likely to report being called hate-related
words and to see hate-related graffiti.
• Females were more likely than males to report being targets of derogatory
words and were also more likely to report seeing hate-related graffiti at
their school (figure 15.1 and table 15.1). About 14 percent of females re-
ported being called hate words in 1999, compared with 12 percent of
males. About 39 percent of females had seen hate-related graffiti, com-
pared with 34 percent of males.
• Black students were more likely than white or Hispanic students to report
being called hate words (table 15.1). About 17 percent of black students
ages 12 through 18 reported being targets of derogatory words, compared
with 13 percent of white students and 12 percent of Hispanic students.5
Students of all racial/ethnic groups were equally likely to report hate-
related graffiti at school.
Figure 15.1.—Percentage of students ages 12 through 18 who reported being targets of hate-related
words or who saw hate-related graffiti at school during the previous 6 months,
by gender and race/ethnicity: 1999
NOTE: "At school" means in the school building, on the school grounds, or on a school bus.
SOURCE: U.S. Department of Justice, Bureau of Justice Statistics, School Crime Supplement to the National Crime Victimization Survey, January-
June, 1999.
5The percentage of other, non-Hispanic students who were victimized by hate-relatedwords was similar to that for white, non-Hispanic, black, non-Hispanic, and Hispanicstudents.
School Environment

16. Students'reportsof gangs at school
Street gangs are organized groups
that are often involved in drugs,
weapons trafficking, and violence.
The presence of street gangs in
school can be very disruptive to the
school environment. Street gangs
may not only create fear among
students but also increase the level
of violence in school. The percent-
age of students who report the
presence of street gangs in their
schools indicates the existence and
severity of the gang problem in
schools.
*The 1999 data reported here are new.Comparisons between the 1989 data andthe 1995 and 1999 data should be madewith caution due to changes in the ques-tionnaire. See appendix B for details.
• Between 1995 and 1999, the percentage of students who reported that
street gangs were present at their schools decreased (figure 16.1 and ta-
ble 16.1). In 1995, 29 percent of students reported street gangs being
present in their schools. By 1999, this percentage had fallen to 17 percent.
• Gangs were more likely to be reported in public schools than in private
schools (figure 16.1 and table 16.1). In 1999,19 percent of students in
public schools reported that street gangs were present in their schools,
compared with 4 percent in private schools. A similar pattern of results
was reported in 1995. However, between these two years, the percentage
of public school students reporting that gangs were present in their
schools decreased by about 40 percent (from 31 percent in 1995 to 19
percent in 1999) as did the percentage of private school students report-
ing gang presence (from 7 percent to 4 percent).
• In 1999, urban students were more likely to report that there were street
gangs at their schools (25 percent) than were suburban and rural students
(16 percent and 11 percent, respectively) (figure 16.2 and table 16.1).
Between 1995 and 1999, reports of gang presence decreased regardless
of students' place of residence.
• In both years, Hispanic and black students were more likely than white
students to report the existence of street gangs in their schools. In 1995,
Hispanic students were more likely than black students to do so (figure
16.3 and table 16.1), while in 1999 they were equally as likely. Between
1995 and 1999, reports of gang presence decreased for whites, blacks,
Hispanics, and students of other race/ethnicities.
Figure 16.1.—Percentage of students ages 12 through 18 who reported that street gangs were present
at school during the previous 6 months, by control of school: 1989,1995, and 1999
NOTE: Comparisons between the 1989 data and the 1995 and 1999 data should be made with caution due to changes in the questionnaire.
Also, the 1989 data include students ages 12 through 19. See appendix B for details. This indicator is based on an item from earlier in the SCS
questionnaire, before "at school" was defined for the respondent.
SOURCE: U.S. Department of Justice, Bureau of Justice Statistics, School Crime Supplement to the National Crime Victimization Survey, January-
June, 1989,1995, and 1999.
School Environment

Figure 16.2.—Percentage of students ages 12 through 18 who reported that street gangs werepresent at school during the previous 6 months, by urbanicity: 1989,1995, and1999
NOTE: Comparisons between the 1989 data and the 1995 and 1999 data should be made with caution due to changes in the questionnaire.
Also, the 1989 data include students ages 12 through 19. See appendix B for details. This indicator is based on an item from earlier in the SCS
questionnaire, before "at school" was defined for the respondent.
SOURCE: U.S. Department of Justice, Bureau of Justice Statistics, School Crime Supplement to the National Crime Victimization Survey, January-
June, 1989,1995, and 1999.
Figure 16.3.—Percentage of students ages 12 through 18 who reported that street gangs werepresent at school during the previous 6 months, by race/ethnicity: 1989,1995, and1999
NOTE: Comparisons between the 1989 data and the 1995 and 1999 data should be made with caution due to changes in the questionnaire.
Also, the 1989 data include students ages 12 through 19. See appendix B for details. This indicator is based on an item from earlier in the SCS
questionnaire, before "at school" was defined for the respondent.
SOURCE: U.S. Department of Justice, Bureau of Justice Statistics, School Crime Supplement to the National Crime Victimization Survey, January-
June, 1989,1995, and 1999.
School Environment

17. Public school prin-cipals' reports ofdiscipline prob-lems at school
Discipline problems in a school
may contribute to an overall climate
in which violence may occur.
Schools that suffer from student
drug or alcohol use, racial tensions,
or verbal and physical abuse of
teachers may be filled with pres-
sures that result in school violence.
*This indicator repeats information from the
1999 Indicators of School Crime and Safety
report.
• During the 1996-97 school year, 16 percent of all public school principals
reported that one or more discipline issues had been a serious problem in
their school6 (figure 17.1 and table 17.1). About the same percentage of
principals in city, urban fringe, town, and rural settings reported one or
more serious discipline problems.
• Public elementary schools were the least likely to report any serious disci-
pline issues, followed by middle schools and then high schools (figure
17.1 and table 17.1). About 8 percent of elementary school principals re-
ported one or more of these issues as a serious problem, while 18 percent
of principals in middle schools and 37 percent of those in high schools did
so.
• While overall there were no significant differences in reported serious
problems by urbanicity, a greater percentage of principals in public city
high schools than in rural high schools reported having serious discipline
problems—47 percent compared with 28 percent (figure 17.1 and table
17.1).
Figure 17.1.—Percentage of public schools that reported that 1 or more of 17 discipline issues* was
a serious problem in their school, by instructional level and urbanicity: 1996-97
*Student tardiness, student absenteeism/class cutting, physical conflicts among students, robbery or theft of items worth over $10, vandalism of
school property, student alcohol use, student drug use, sale of drugs on school grounds, student tobacco use, student possession of weapons,
trespassing, verbal abuse of teachers, physical abuse of teachers, teacher absenteeism, teacher alcohol or drug use, racial tensions, and gangs.
NOTE: "At school" was not defined for the survey respondent.
SOURCE: U.S. Department of Education, National Center for Education Statistics, Fast Response Survey System, "Principal/School Disciplinarian
Survey on School Violence," FRSS 63,1997.
6These issues were student tardiness, student absenteeism/class cutting, physical con-
flicts among students, robbery or theft of items worth over $10, vandalism of school
property, student alcohol use, student drug use, sale of drugs on school grounds, stu-
dent tobacco use, student possession of weapons, trespassing, verbal abuse of teach-
ers, physical abuse of teachers, teacher absenteeism, teacher alcohol or drug use,
racial tensions, and gangs.
School Environment

18. Prevalence ofstudents usingalcohol
The consumption of alcohol by stu-
dents on school property, a crime in
itself, may also lead to other crimes
and misbehavior. It can lead to a
school environment that is harmful
to students, teachers, and staff.
This indicator repeats information from the
1999 Indicators of School Crime and Safety
report.
• In 1997, 51 percent of students in grades 9 through 12 had at least one
drink of alcohol in the 30 days before being surveyed (figure 18.1 and ta-
ble 18.1). A much smaller percentage (6 percent) had at least one drink
on school property during the same period.
• Approximately the same percentage of students had drunk alcohol in 1997
as in 1993 and 1995—both in general and on school property.
• Males were more likely than females to have used alcohol in 1993 and
1997 (figure 18.1 and table 18.1). Furthermore, males were more likely
than females to use alcohol on school property. For example, in 1997, 7
percent of males had used alcohol on school property compared with 4
percent of females.
• Of 9th through 12th graders, in every survey year, students in higher
grades were more likely to report drinking alcohol anywhere than were
students in lower grades (figure 18.2 and table 18.1). However, there were
no differences by grade among students who said they had drunk alcohol
on school property during 1993,1995, or 1997.
Figure 18.1.—Percentage of students in grades 9 through 12 who reported using alcoholin the last 30 days, by gender: 1993,1995, and 1997
*The response rate for this survey was less than 70 percent and a full nonresponse bias analysis has not been done to date.
NOTE: "On school property" was not defined for survey respondents.
SOURCE: U.S. Department of Health and Human Services, Public Health Service, Centers for Disease Control and Prevention, National Center for
Health Statistics, National Health Interview Survey—Youth Risk Behavior Survey, 1993,1995, and 1997.
School Environment

Figure 18.2.—Percentage of students in grades 9 through 12 who reported using alcoholin the last 30 days, by grade: 1993,1995, and 1997
*The response rate for this survey was less than 70 percent and a full nonresponse bias analysis has not been done to date.
NOTE: "On school property" was not defined for survey respondents.
SOURCE: U.S. Department of Health and Human Services, Public Health Service, Centers for Disease Control and Prevention, National Center for
Health Statistics, National Health Interview Survey—Youth Risk Behavior Survey, 1993,1995, and 1997.
School Environment

19. Prevalence ofstudents usingmarijuana
The use of other drugs such as
marijuana on school property may
also cause disruptions in the
learning environment. The con-
sumption of these substances
leads to a school environment that
is harmful to students, teachers,
and school administrators.
*This indicator repeats information from the1999 Indicators of School Crime and Safetyreport.
• Between 1993 and 1997,6 to 9 percent of students in grades 9 through
12 reported using marijuana on school property during the last 30 days.
About 18 to 26 percent reported using marijuana anywhere during the last
30 days (figure 19.1 and table 19.1).
• There was an increase in the use of marijuana among students between
1993 and 1995. In 1995, about 25 percent of all students in grades 9
through 12 had used marijuana in the last 30 days, compared with 18 per-
cent in 1993 (figure 19.1 and table 19.1). Marijuana use in 1997, at 26
percent, was similar to that in 1995. However, marijuana use on school
property did not increase significantly between 1993 and 1995, or be-
tween 1995 and 1997.
• Males were more likely than females to have used marijuana in every
survey year (figure 19.1 and table 19.1), both in general and on school
property.
• Both males and females increased their overall use of marijuana from
1993 to 1997 (figure 19.1 and table 19.1). The percentage of males who
reported using marijuana in the 30 days before the survey increased from
21 percent in 1993 to 30 percent in 1997. The percentage of females in-
creased from 15 percent to 21 percent.
• Students' grade in school was not associated with their use of marijuana
on school property (figure 19.2 and table 19.1). However, in 1993 and
1995, students in lower grades were less likely than students in higher
grades to report using marijuana at any time during the last 30 days. In
1997, this difference by grade was not apparent, with students in lower
grades about as likely to report using marijuana as students in higher
grades. This pattern occurred because the overall use of marijuana in 9th,
10th, and 11th grades increased from 1993 to 1997, while its use by 12th
graders remained relatively constant.
School Environment

Figure 19.1.—Percentage of students in grades 9 through 12 who reported using marijuana in thelast 30 days, by gender: 1993,1995, and 1997
*The response rate for this survey was less than 70 percent and a full nonresponse bias analysis has not been done to date.
NOTE: "On school property" was not defined for survey respondents.
SOURCE: U.S. Department of Health and Human Services, Public Health Service, Centers for Disease Control and Prevention, National Center for
Health Statistics, National Health Interview Survey—Youth Risk Behavior Survey, 1993,1995, and 1997.
Figure 19.2.—Percentage of students in grades 9 through 12 who reported using marijuana in thelast 30 days, by grade: 1993,1995, and 1997
*The response rate for this survey was less than 70 percent and a full nonresponse bias analysis has not been done to date.
NOTE: "On school property" was not defined for survey respondents.
SOURCE: U.S. Department of Health and Human Services, Public Health Service, Centers for Disease Control and Prevention, National Center for
Health Statistics, National Health Interview Survey—Youth Risk Behavior Survey, 1993,1995, and 1997.
School Environment

20. Prevalence ofstudents reportingdrugs were madeavailable to themon school property*
Schools can be places where
young people are offered or can
purchase illegal drugs. The avail-
ability of drugs on school property
is a disruptive and corrupting influ-
ence in the school environment.
This indicator repeats information from the1999 Indicators of School Crime and Safetyreport.
• In 1995 and 1997, almost one-third of all students in grades 9 through 12
(32 percent) reported that someone had offered, sold, or given them an
illegal drug on school property (figure 20.1 and table 20.1). This was an
increase from 1993 when 24 percent of such students reported that illegal
drugs were available to them on school property.
• The percentages of both males and females reporting that illegal drugs
were made available to them on school property increased between 1993
and 1995. However, in each survey year, males were more likely than fe-
males to report that drugs were offered, sold, or given to them on school
property. For example, in 1997, 37 percent of males reported the avail-
ability of drugs, while 25 percent of females did so.
• Students' grade level in school did not appear to be associated with
whether they had been offered, sold, or given drugs on school property
(figure 20.2 and table 20.1). Generally, in each survey year, about the
same percentage of students in each grade level reported the availability
of illegal drugs.
• The racial/ethnic background of students was associated with whether
they reported having illegal drugs offered, sold, or given to them on school
property (figure 20.3 and table 20.1). In general, Hispanics were more
likely than students from other racial/ethnic groups to report having drugs
available to them on school property.
Figure 20.1.—Percentage of students in grades 9 through 12 who reported that drugs were made
available to them on school property during the last 12 months, by gender: 1993,
1995, and 1997
*The response rate for this survey was less than 70 percent and a full nonresponse bias analysis has not been done to date.
NOTE: "On school property" was not defined for survey respondents.
SOURCE: U.S. Department of Health and Human Services, Public Health Service, Centers for Disease Control and Prevention, National Center for
Health Statistics, National Health Interview Survey—Youth Risk Behavior Survey, 1993,1995, and 1997.
School Environment

Figure 20.3.—Percentage of students in grades 9 through 12 who reported that drugs were madeavailable to them on school property during the last 12 months, by race/ethnicity:1993,1995,and 1997
*The response rate for this survey was less than 70 percent and a full nonresponse bias analysis has not been done to date.
NOTE: "On school property" was not defined for survey respondents.
SOURCE: U.S. Department of Health and Human Services, Public Health Service, Centers for Disease Control and Prevention, National Center forHealth Statistics, National Health Interview Survey—Youth Risk Behavior Survey, 1993,1995, and 1997.
School Environment
*The response rate for this survey was less than 70 percent and a full nonresponse bias analysis has not been done to date.
NOTE: "On school property" was not defined for survey respondents.
SOURCE: U.S. Department of Health and Human Services, Public Health Service, Centers for Disease Control and Prevention, National Center for
Health Statistics, National Health Interview Survey—Youth Risk Behavior Survey, 1993,1995, and 1997.
Figure 20.2.—Percentage of students in grades 9 through 12 who reported that drugs were madeavailable to them on school property during the last 12 months, by grade: 1993,1995,and 1997

SUPPLEMENTAL TABLES
Supplemental Tables

Table 2.1.—Number of nonfatal crimes against students ages 12 through 18 occurring at school or on the way to or from school, by type of crimeand selected student characteristics: 1992 to 1998
1992 1993 1994
Student characteristics
Total
GenderMaleFemale
Age12-1415-18
Race/ethnicityWhite, non-HispanicBlack, non-HispanicHispanicOther, non-Hispanic
UrbanicityUrbanSuburbanRural
Household incomeLess than $7,500$7,500-14,999$15,000-24,999$25,000-34,999$35,000-49,999$50,000-74,999$75,000 or more
Total
3,409,200
2,058,4001,350,700
1,858,9001,550,300
2,526,700443,300299,200111,600
883,0001,809,200
717,000
249,300335,800415,200489,800765,000511,100382,300
Theft
2,260,500
1,278,000982,500
1,134,2001,126,400
1,694,300262,300191,300
95,300
572,3001,226,700
461,500
132,800196,700199,700334,700564,000406,500252,000
Violent
1,148,600
780,400368,200
724,700423,900
832,400181,000107,900
16,3002
310,700582,500255,500
116,400139,200215,600155,100201,000104,600130,300
Seriousviolent1
245,400
183,20062,200
172,073,300
148,071,50041,6002
95,600115,0
80,50032
27,4002
38,300353,1001,1002
38fi0&12,000631,00
Total
3,795,200
2,168,0001,627,200
2,123,2001,672,100
2,832,800507,800335,500
90,700
967,2002,023,000
804,900
253,600340,100489,000684,300670,900639,300406,700
Theft
2,357,000
1,275,1001,081,900
1 2 3 , 2 0 01,115,900
1,775,700300,600193,800
64,200
557,1001,319,500
480,500
105,900205,000266,500471,100418,500430,800300,700
Violent
1,438,200
844,00020580,00
172,00672,100
1,057,100207,20141,60026,500
410,200319,500324,500
147,700135,100222,500213,200252,400208,500106,000
Serious
violent1
306,700
183,200126,500
1 ,100073,300
188,40060,0025,1005,1002
100,700135,30070,700
27,90036,40036,00036,60058,20043,200igjoo2
Total
3,795,500
2,109,6001,685,800
2,140,0001,655,500
2,670,800552,800431,700105,600
978,2002,036,300
780,900
185,000322,100199,700572,200741,500668,000438,900
Theft
3,795,500
2,109,6001,685,800
1,246,50000423,900
1,726,600320,100234,00068,300
534,8001,293,400
543,300
90,600202,300312,400313,500473,500421,300314,500
Violent
1,424,000
844,000580,000
893,400530,600
944,300232,700197,70037,200
443,400742,900237,700
94,400119,800266,500258,700268,000246,700124,400
Serious
violent1
322,400
200,600627,200
2 , 1 0 072,100
179,70060,00070,20012,500?
34,800,036,30028,500
40,400
is^oo2
44,10055,10050,50053,300msoo2
NOTE: See footnotes at end of table.
Supplemental Tables

Table 2.1.—Number of nonfatal crimes against students ages 12 through 18 occurring at school or on the way to or from school, by type of crimeand selected student characteristics: 1992 to 1998—Continued
1995 1996 1997
Student characteristics
Total
GenderMaleFemale
Age12-1415-18
Race/ethnicityWhite, non-HispanicBlack, non-HispanicHispanicOther, non-Hispanic
UrbanicityUrbanSuburbanRural
Household incomeLess than $7,500$7,500-14,999$15,000-24,999$25,000-34,999$35,000-49,999$50,000-74,999$75,000 or more
Total
3,467,900
1,995,6001,472,300
2,046,3001,421,600
2,512,200449,300373,500110,800
890,0001,907,600
670,300
141,300284,900443,500538,800678,800620,800495,600
Theft
2,177,900
1,216,200961,700
1,195,900982,000
1,594,400258,800222,20085,800
547,9001,197,800
432,200
52,700164,400275,400328,000429,900415,000341,300
Violent
1,290,000
779,400510,500
850,400439,600
917,800190,500151,30025,100
342,0007 , 8 0 0238,100
88,600120,500168,000210,800248,900205,700154,300
Seriousviolent1
222,500
144,80068,700
195,90076,600
123,00053,30036,3009,3002
42,0093,40038,100
27,80035,60068,0002
328,00035,00034,50013,60c)2
Total
3,163,000
1,802,2001,360,800
1,757,0001,406,000
2,240,700414,100383,300116,500
913,3001,693,900
555,900
027,800254,600427,000440,200602,300597,200435,400
Theft
2,028,700
1,046,100982,500
1,061,300967,400
1,170,200053,300205,40077,600
548,5001,066,800
413,400
87,900164,400241,900264,700383,700410,000326,600
Violent
1,134,400
756,100378,200
,757,00438,700
70,200125,900178,00038,900
364,800603,500142,500
4,40000254,600185,100175,500220,300187,200108,800
Seriousviolent1
134,400
1,802,20068,700
50,400982,000
170,20044,40036,90012,10c)2
102,3000093,400
21,70c)2
86,50042
16,30053,400328,0047,70087,20016,00c)2
Total
2,028,70
1,555,5001,165,700
1,757,001,279,700
1,925,1000125,9007 8 , 0 0106,900
791,1001,470,500
459,600
86,500251,300363,700264,700468,0000032,200453,600
Theft
1,666,000
878,30077,200
,061,300856,400
1,170,200046,100163,200
84,200
48,500364,800627,10010321,000
42,80054,600219,500264,700247,700342,500303,700
Violent
2,721,200
802,200378,20
195,900122,00
754,900125,900036,900
22,7002
313,10070,500138,600
43,700107,900144,200146,30002,300158,800149,900
Seriousviolent1
201,800
133,10068,700
114,20087,600
122,90033,10c)2
36,3005,30c)2
89,000197,800
10,90c)2
4,40c)2
16,30c)2
31,80023,40047,70036,60025,30c)2
NOTE: See footnotes at end of table.
Supplemental Tables
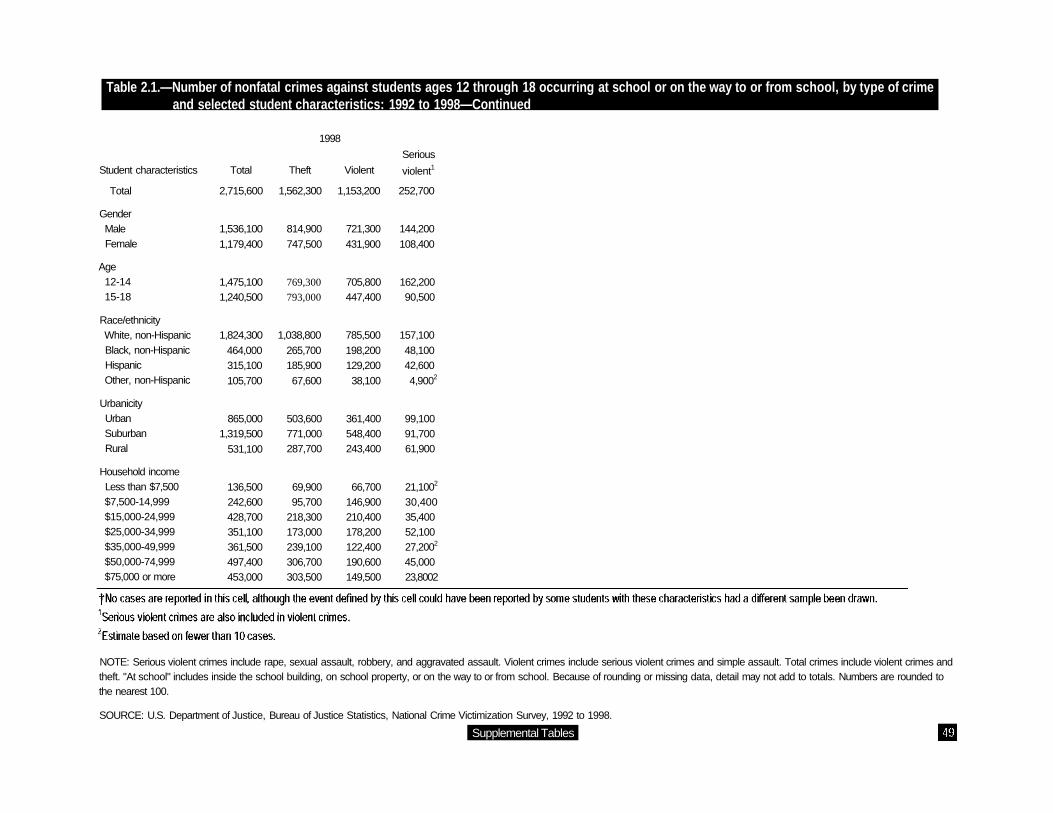
Table 2.1.—Number of nonfatal crimes against students ages 12 through 18 occurring at school or on the way to or from school, by type of crimeand selected student characteristics: 1992 to 1998—Continued
1998
Student characteristics Total Theft Violent
Serious
violent1
Total
GenderMaleFemale
Age12-1415-18
Race/ethnicityWhite, non-HispanicBlack, non-HispanicHispanicOther, non-Hispanic
UrbanicityUrbanSuburbanRural
Household incomeLess than $7,500$7,500-14,999$15,000-24,999$25,000-34,999$35,000-49,999$50,000-74,999$75,000 or more
2,715,600 1,562,300 1,153,200 252,700
1,536,1001,179,400
1,475,1001,240,500
865,0001,319,500
531,100
136,500242,600428,700351,100361,500497,400453,000
814,900747,500
769,300
793,000
721,300 144,200431,900 108,400
705,800447,400
1,824,300 1,038,800464,000 265,700315,100 185,900105,700 67,600
503,600771,000287,700
69,90095,700
218,300173,000239,100306,700303,500
361,400548,400243,400
66,700146,900210,400178,200122,400190,600149,500
162,20090,500
785,500 157,100198,200 48,100129,200 42,60038,100 4,9002
99,10091,70061,900
21,1002
30,40035,40052,10027,2002
45,00023,8002
NOTE: Serious violent crimes include rape, sexual assault, robbery, and aggravated assault. Violent crimes include serious violent crimes and simple assault. Total crimes include violent crimes andtheft. "At school" includes inside the school building, on school property, or on the way to or from school. Because of rounding or missing data, detail may not add to totals. Numbers are rounded tothe nearest 100.
SOURCE: U.S. Department of Justice, Bureau of Justice Statistics, National Crime Victimization Survey, 1992 to 1998.
Supplemental Tables

Table 2.2.—Number of nonfatal crimes against students ages 12 through 18 occurring at school or on the way to or from school per 1,000 students,by type of crime and selected student characteristics: 1992 to 1998
1992 1993 1994
Student characteristics
Total
GenderMaleFemale
Age12-1415-18
Race/ethnicityWhite, non-HispanicBlack, non-HispanicHispanicOther, non-Hispanic
UrbanicityUrbanSuburbanRural
Household incomeLess than $7,500$7,500-14,999$15,000-24,999$25,000-34,999$35,000-49,999$50,000-74,999$75,000 or more
Total
144
168117
172120
156114113129
141155124
123911125137180150206
Theft
95
10585
10587
1056772
110
9210580
65656094
133119136
Violent
48
6432
6733
524641192
505044
57466543473170
Serious
violent1
10
155
166
918102
151062
142
132
1652
92
42
172
Total
155
171137
190125
17012811899
145174129
123123137187157170193
Theft
96
10191
11183
106766870
8411377
517475
12898
115143
Violent
59
7046
7942
63525029
62602
71496258595650
Serious
violent1
12
1411
169
1122962
151211
1313101014222
Total
150
162137
187119
156140137109
143169121
96119134162164166179
Theft
94
9790
10981
101817471
7810784
47758589
105105129
Violent
56
6547
7838
55596339
656237
49445073596151
Serious
violent1
13
1510
189
11152132
21134
222
12161113
22
NOTE: See footnotes at end of table.
Supplemental Tables

Table 2.2.—Number of nonfatal crimes against students ages 12 through 18 occurring at school or on the way to or from school per 1,000 students,by type of crime and selected student characteristics: 1992 to 1998—Continued
1995 1996 1997
Student characteristics
Total
GenderMaleFemale
Age12-1415-18
Race/ethnicityWhite, non-HispanicBlack, non-HispanicHispanicOther, non-Hispanic
UrbanicityUrbanSuburbanRural
Household incomeLess than $7,500$7,500-14,999$15,000-24,999$25,000-34,999$35,000-49,999$50,000-74,999$75,000 or more
Total
135
151118
176101
147111113103
126153108
81101131153142151173
Theft
85
9277
10370
93646780
789670
3059829390
101119
Violent
50
5941
7331
54474623
495739
51435060525054
Serious
violent1
9
116
135
7131192
1475
161372
127852
Total
121
134107
15197
129105109108
12613095
8692
120130131138139
Theft
78
7877
9167
8373582
768271
555468788495
104
Violent
43
5630
6030
45325136
504824
31382
52484335
Serious
violent1
9
116
98
71215112
14842
82
915109722
Total
102
11491
12386
111957691
10511179
6493
107114105110125
Theft
63
6461
6958
6759442
636655
31536571567584
Violent
40
5029
5429
433632192
42462
2402
43493541
Serious
violent1
8
105
106
782
1022
12822
22
62
97
11822
NOTE: See footnotes at end of table.
Supplemental Tables

Table 2.2.—Number of nonfatal crimes against students ages 12 through 18 occurring at school or on the way to or from school per 1,000 students,by type of crime and selected student characteristics: 1992 to 1998—Continued
1998
Student characteristics
Total
GenderMaleFemale
Age12-1415-18
Race/ethnicityWhite, non-HispanicBlack, non-HispanicHispanicOther, non-Hispanic
UrbanicityUrbanSuburbanRural
Household incomeLess than $7,500$7,500-14,999$15,000-24,999$25,000-34,999$35,000-49,999$50,000-74,999$75,000 or more
Total
101
11191
12583
1051118289
1179793
11097
12610286
110112
Theft
58
5958
6553
60644857
685650
56386450576875
Violent
43
5233
6030
45483432
494043
53596252294237
Serious
violent1
9
108
146
9121142
137
11
172
122
101562
1062
NOTE: Serious violent crimes include rape, sexual assault, robbery, and aggravated assault. Violent crimes include serious violent crimes and simple assault. Total crimes include violent crimes andtheft. "At school" includes inside the school building, on school property, or on the way to or from school. Population sizes are 23,740,295 students ages 12 through 18 in 1992; 24,557,779 in 1993;25,326,989 in 1994; 25,715,220 in 1995; 26,151,364 in 1996; 26,548,142 in 1997; and 26,806,268 in 1998. Because of rounding or missing data, detail may not add to totals.
SOURCE: U.S. Department of Justice, Bureau of Justice Statistics, National Crime Victimization Survey, 1992 to 1998.
Supplemental Tables

Table 2.3.—Number of nonfatal crimes against students ages 12 through 18 occurring away from school, by type of crime and selected studentcharacteristics: 1992 to 1998
1992 1993 1994
Student characteristics
Total
GenderMaleFemale
Age12-1415-18
Race/ethnicityWhite, non-HispanicBlack, non-HispanicHispanicOther, non-Hispanic
UrbanicityUrbanSuburbanRural
Household incomeLess than $7,500$7,500-14,999$15,000-24,999$25,000-34,999$35,000-49,999$50,000-74,999$75,000 or more
Total
3,286,800
1,967,6001,319,200
1,253,7002,033,100
2,294,400461,300383,400132,400
1,124,2001,658,000
504,500
379,500491,500592,300501,400479,800373,700243,700
Theft
1,607,600
1,000,400607,200
685,900921,700
1,152,100227,100163,900
59,600
532,400838,400236,800
192,900197,500246,500217,400242,600221,700151,700
Violent
1,679,200
967,300712,000
567,8001,111,400
1,142,300234,200219,500
72,800
591,900819,600267,700
186,600294,000345,800284,000237,200152,00092,000
Seriousviolent1
750,200
433,300316,900
249,700500,500
450,800139,000113,20040019,2
265,800360,100124,300
92,900168,600143,500121,600
37,20060,00034,6002
Total
3,419,700
2,009,0001,410,800
1,236,2002,183,500
2,322,900597,600380,60094,600
1 , 9 0 01,515,400
658,400
423,500494,800563,600503,500549,500380,200222,000
1
1
1
1
Theft
,691,800
,0001,00690,700
67,800,036,000
,128,700300227,100187,800
61,300
589,000771,700331,200
180,300261,600257,100258,600253,6002 , 0 0 0122,800
Violent
1,728,000
2,009,00720,100
55,8001,147,500
1,194,200295,400192,900
33,400
657,000743,700124,300
180,300219,20246,500258,600295,900380,20099,300
Seriousviolent1
849,500
527,800690,700
280,500569,000
,048,100295,400113,200
19,2002
354,200771,7000327,200
180,30116,500152,700122,300144,700
05,90038,100
Total
3,258,100
1,921,2001,410,800
1,132,9002,183,500
4,200502,60499,200423,300
99,400
1,245,9001,592,300
27,200
3 , 3 0 0389,90043,500487,20042,600483,500292,700
Theft
3,419,700
866,200655,400
236,200949,500
1,128,7000597,600191,80047,600
489,500729,70000124,300
157,800168,600110,800226,000295,900248,700156,200
1
1
1
1
Violent
,736,400
,055,000681,400
249,700,147,500
,161,4000193,500231,500
51,700
657,00862,60024,300
186,600261,600257,100487,200144,700234,700136,500
Seriousviolent1
832,700
522,800309,900
231,400601,300
482,300295,400231,500
25,300
0265,800396,000116,500
186,600116,500110,800122,300120,900105,900
60,000
NOTE: See footnotes at end of table.
Supplemental Tables

Table 2.3.—Number of nonfatal crimes against students ages 12 through 18 occurring away from school, by type of crime and selected studentcharacteristics: 1992 to 1998—Continued
1995 1996 1997
Student characteristics
Total
GenderMaleFemale
Age12-1415-18
Race/ethnicityWhite, non-HispanicBlack, non-HispanicHispanicOther, non-Hispanic
UrbanicityUrbanSuburbanRural
Household incomeLess than $7,500$7,500-14,999$15,000-24,999$25,000-34,999$35,000-49,999$50,000-74,999$75,000 or more
Total
3,058,300
1,786,9001,271,400
1,040,2002,018,100
2,048,300512,100349,800114,000
1,057,3001,463,700
537,200
329,100428,100491,400411,700486,000442,100288,900
Theft
1,561,800
883,000678,800
556,1001,005,700
1,075,900254,200144,000
64,800
518,000776,900267,000
162,000191,400289,100203,700238,800225,000140,000
Violent
1,496,500
903,90592,600
484,1001,012,400
972,400257,800205,700
49,200
539,400686,900270,300
167,100236,700202,300208,000247,300217,000148,900
Seriousviolent1
599,000
374,600224,400
178,300420,700
373,10098,20095,50023,400112
229,900277,000
92,100
68,50037,60086,10076,000
104,20096,40038,300
Total
1,561,800
000903,9001,160,200
100484,1001,992,500
1,075,90057,800349,200112,000
993,0001,481,200
576,400
284,800422,400468,600076,00465,800394,500324,900
Theft
1,622,900
4,6001,890618,900
600,8001,992,50
1,078,400265,300186,600
72,000
494,800800,5000270,30
134,500213,3000086,100215,900250,300245,10024,900
Violent
1,427,700
886,400541,300
457,200970,500
9 , 2 0 022,80013,00040,000
498,200680,700248,700
134,5000097,100289,100161,700215,600149,3000079,500
Seriousviolent1
670,600
421,200541,300
90,300461,400
391,700157,40094,20024,8002
274,8002 , 3 0 0101,100
134,500150422,4000086,100
081,50001,80089,60038,300
Total
3,107,30
1,890,3001,301,400
1,030,7002,076,600
2,089,20057,80049,200
67,900
000494,80000294,600
0248,700
031,300443,900388,70000076,00510,10225,00018,400
Theft
1,622,900
914,600637,000
557,6001,4002,0
1,037,500271,300094,200
36,900
531,600772,400247,600
31,300167,2000086,100208,00050,300245,100106,500
Violent
1,555,800
891,400224,400
058,1001,082,600
1,078,4000098,200213,0
31,000
531,600732,30027,700
83,400276,700179,0218,700465,800241,600106,500
Seriousviolent1
635,900
890,3002 , 6 0 0
190,300461,400
414,900249,20094,40012,4002
270,700294,60096,600
31,300167,200
74,30081,50081,60089,60079,500
NOTE: See footnotes at end of table.
Supplemental Tables

Table 2.3.—Number of nonfatal crimes against students ages 12 through 18 occurring away from school, by type of crime and selected studentcharacteristics: 1992 to 1998—Continued
1998
Student characteristics
Total
Gender
Male
Female
Age12-14
15-18
Race/ethnicity
White, non-Hispanic
Black, non-Hispanic
Hispanic
Other, non-Hispanic
Urbanicity
Urban
Suburban
Rural
Household income
Less than $7,500
$7,500-14,999
$15,000-24,999
$25,000-34,999
$35,000-49,999
$50,000-74,999$75,000 or more
Total
2,534,500
1,493,600
1,040,900
761,000
1,773,500
1,698,800
394,000
311,300
104,800
869,600
1,333,400
331,500
137,700
350,200
379,700
360,700
406,900
341,200317,000
Theft
1,236,400
732,700
503,700
430,800
805,600
832,900
200,600
122,300
68,200
389,200
656,900
190,300
51,500
162,100
181,200
165,700
237,600
147,300176,700
Violent
1,298,100
761,000
537,100
330,200
967,900
865,900
193,400
189,100
36,600
480,400
676,500
141,200
86,200
188,100
198,500
195,000
169,300
193,900140,300
Serious
violent1
550,200
364,900
185,300
131,900
418,300
331,000
106,000
95,300
15,8002
229,400
275,900
44,9002
39,200
56,800
103,100
107,200
83,600
70,30053,400
Estimate based on fewer than 10 cases.NOTE: Serious violent crimes include rape, sexual assault, robbery, and aggravated assault. Violent crimes include serious violent crimes and simple assault. Total crimes include violent crimes andtheft. Because of rounding or missing data, detail may not add to totals. Numbers are rounded to the nearest 100.SOURCE: U.S. Department of Justice, Bureau of Justice Statistics, National Crime Victimization Survey, 1992 to 1998.
Supplemental Tables

Table 2.4.—Number of nonfatal crimes against students ages 12 through 18 occurring away from school per 1,000 students, by type of crime andselected student characteristics: 1992 to 1998
1992 1993 1994
Student characteristics
Total
Gender
Male
Female
Age12-14
15-18
Race/ethnicity
White, non-Hispanic
Black, non-Hispanic
Hispanic
Other, non-Hispanic
Urbanicity
Urban
Suburban
Rural
Household income
Less than $7,500
$7,500-14,999
$15,000-24,999
$25,000-34,999
$35,000-49,999
$50,000-74,999$75,000 or more
Total
138
161115
116157
142118145153
18014287
187162178140113110131
Theft
68
8253
6371
71586269
857241
95657461576582
Violent
71
7962
5386
71608384
957046
9297
10480564550
Serious
violent1
32
3528
2339
283643472
433121
375643341918192
Total
139
159119
111163
139151134103
187130105
205180158137129101106
Theft
69
7958
5977
68766667
896653
87957271595858
Violent
70
8061
5286
72746836
996452
118858667694347
Serious
violent1
35
4227
2543
3049462 2
533121
52504334342018
Total
129
147109
99153
129127134103
16013288
185144116138110120120
Theft
60
6653
5068
61586149
726147
82634964526264
Violent
69
8155
4985
68687354
897242
102816774585856
Serious
violent1
33
4025
2043
28434526
473318
57433035272625
NOTE: See footnotes at end of table.
Supplemental Tables

Table 2.4.—Number of nonfatal crimes against students ages 12 through 18 occurring away from school per 1,000 students, by type of crime andselected student characteristics: 1992 to 1998—Continued
1995 1996 1997
Student characteristics
Total
Gender
Male
Female
Age12-14
15-18
Race/ethnicity
White, non-Hispanic
Black, non-Hispanic
Hispanic
Other, non-Hispanic
Urbanicity
Urban
Suburban
Rural
Household income
Less than $7,500
$7,500-14,999
$15,000-24,999
$25,000-34,999
$35,000-49,999
$50,000-74,999$75,000 or more
Total
119
135102
89143
119127106106
15011787
189152146117102107101
Theft
61
6754
4871
63634360
746243
93688658505549
Violent
58
6848
4272
57646246
775544
96846059525352
Serious
violent1
23
2818
1530
222429222
332215
39352622222313
Total
117
14191
91137
11713299
104
13711399
17915313211210291
104
Theft
62
7549
5270
62675367
686156
85776264555770
Violent
55
6643
3967
55654637
695243
94767048473534
Serious
violent1
26
3120
1832
2240272 2
382317
6546312015179
Total
117
132101
88140
12012611058
14311490
13316411412311498
106
Theft
58
6749
4867
6065522
705843
72626259694555
Violent
59
6552
4073
61605827
735547
611025364455351
Serious
violent1
24
2621
1630
242726112
362017
23512224182022
NOTE: See footnotes at end of table.
Supplemental Tables

Table 2.4.—Number of nonfatal crimes against students ages 12 through 18 occurring away from school per 1,000 students, by type of crime andselected student characteristics: 1992 to 1998—Continued
1998
Student characteristics
Total
Gender
Male
Female
Age12-14
15-18
Race/ethnicity
White, non-Hispanic
Black, non-Hispanic
Hispanic
Other, non-Hispanic
Urbanicity
Urban
Suburban
Rural
Household income
Less than $7,500
$7,500-14,999
$15,000-24,999
$25,000-34,999
$35,000-49,999
$50,000-74,999$75,000 or more
Total
95
10880
65118
98958188
1179858
111140112105977578
Theft
46
5339
3754
48483257
524833
41655348573344
Violent
48
5541
2864
50464931
655025
69755957404335
Serious
violent1
21
2614
1128
192525132
312082
31233031201613
1Serious violent crimes are also included in violent crimes.
Estimate based on fewer than 10 cases.
NOTE: Serious violent crimes include rape, sexual assault, robbery, and aggravated assault. Violent crimes include serious violent crimes and simple assault. Total crimes include violent crimes andtheft. Population sizes are 23,740,295 students ages 12 through 18 in 1992; 24,557,779 in 1993; 25,326,989 in 1994; 25,715,220 in 1995; 26,151,364 in 1996; 26,548,142 in 1997; and 26,806,268 in1998. Because of rounding or missing data, detail may not add to totals.SOURCE: U.S. Department of Justice, Bureau of Justice Statistics, National Crime Victimization Survey, 1992 to 1998.Supplemental Tables

Table 3.1.—Percentage of students ages 12 through 18 who reported criminal victimization at school during the previous 6 months, by type ofvictimization and selected student characteristics: 1995 and 1999
1995 1999
Student characteristics
Total
GenderMaleFemale
Race/ethnicityWhite, non-HispanicBlack, non-HispanicHispanicOther, non-Hispanic
Grade6th7th8th9th10th11th12th
UrbanicityUrbanSuburbanRural
ControlPublicPrivate
Total1
9.5
10.09.0
9.810.27.68.8
9.611.210.511.99.17.36.1
9.310.38.3
9.86.6
Theft
7.1
7.17.1
7.47.15.86.5
5.48.17.99.17.75.54.6
6.67.66.8
7.35.2
Violent2
3.0
3.52.4
3.03.42.72.5
5.13.83.13.42.11.91.9
3.33.51.8
3.11.7
Serious violent3
0.7
0.90.4
0.61.00.90.5
1.50.90.80.70.40.40.4
1.30.60.3
0.70.1
Total1
7.6
7.87.3
7.59.95.76.4
8.08.27.68.98.07.24.8
8.47.66.4
7.94.5
Theft
5.7
5.75.7
5.87.43.94.4
5.26.05.96.56.55.54.0
6.95.45.0
5.94.3
Violent2
2.3
2.52.0
2.13.51.92.2
3.82.62.43.21.71.80.8
2.32.41.9
2.50.3
Serious violent3
0.5
0.60.5
0.41.20.6
t
1.30.90.50.60.50.10.3
0.70.50.4
0.6t
•f No cases are reported in this cell, although the event defined by this cell could have been reported by some students with these characteristics had a different sample been drawn.1Total victimization is a combination of violent victimization and theft. If the student reported an incident in either, he or she is counted as having experienced "total" victimization. If the student
reported having experienced both, he or she is counted once under "total" victimization.2Violent crimes include rape, sexual assault, robbery, aggravated assault, and simple assault.3Serious violent crimes include rape, sexual assault, robbery, and aggravated assault. Serious violent crimes are also included in violent crimes.
NOTE: "At school" includes inside the school building, on school property, or on the way to or from school. Because of rounding or missing data, detail may not add to totals.
SOURCE: U.S. Department of Justice, Bureau of Justice Statistics, School Crime Supplement to the National Crime Victimization Survey, January-June 1995 and 1999.
Supplemental Tables

Table 4.1.—Percentage of students in grades 9 through 12 who reported being threatened or injured with a weapon on school property during thelast 12 months, by selected student characteristics: 1993,1995, and 1997
Student characteristics 1993 1995* 1997*
Total 7.3 8.4 7.4
Gender
Male
Female
Race/ethnicity
White, non-Hispanic
Black, non-Hispanic
Hispanic
Asian/Pacific Islander
Other, non-Hispanic
Grade
9th
10th
11th
12th
9.25.4
6.3
11.2
8.6
5.0
10.2
9.47.37.35.5
10.9
5.8
7.0
11.0
12.4
11.4
9.5
9.69.67.76.7
10.2
4.0
6.29.99.05.39.9
10.1
7.9
5.9
5.8
*The response rate for this survey was less than 70 percent and a full nonresponse bias analysis has not been done to date.
NOTE: "On school property" was not defined for survey respondents.
SOURCE: U.S. Department of Health and Human Services, Public Health Service, Centers for Disease Control and Prevention, National Center for Health Statistics, National Health InterviewSurvey—Youth Risk Behavior Survey, 1993,1995, and 1997.
Supplemental Tables

Table 5.1.—Percentage of students in grades 9 through 12 who reported having been in a physical fight in the last 12 months, by selected studentcharacteristics: 1993,1995, and 1997
Student characteristics 1993
Anywhere
1995* 1997* 1993
On school property
1995* 1997*
Total 41.8 38.7 36.6 16.2 15.5 14.8
Gender
Male
Female
Race/ethnicity
White, non-Hispanic
Black, non-Hispanic
Hispanic
Asian/Pacific Islander
Other, non-Hispanic
Grade
9th10th
11th12th
51.2
31.7
40.3
49.5
43.2
30.4
46.9
50.4
42.2
40.534.8
46.1
30.6
36.0
41.6
47.9
38.2
46.4
47.3
40.4
36.931.0
45.5
26.0
33.7
43.0
40.7
24.5
45.1
44.8
40.2
34.228.8
23.5
8.6
15.0
22.0
17.9
11.7
18.8
23.1
17.2
13.811.4
21.0
9.5
12.9
20.3
21.1
18.3
23.0
21.6
16.5
13.610.6
20.0
8.6
13.3
20.7
19.0
8.314.8
21.3
17.0
12.59.5
*The response rate for this survey was less than 70 percent and a full nonresponse bias analysis has not been done to date.
NOTE: "On school property" was not defined for survey respondents.
SOURCE: U.S. Department of Health and Human Services, Public Health Service, Centers for Disease Control and Prevention, National Center for Health Statistics, National Health InterviewSurvey—Youth Risk Behavior Survey, 1993,1995, and 1997.
Supplemental Tables

Table 6.1.—Percentage of students ages 12 through 18 who reported being bullied at school during the previous 6 months, by gender and selectedstudent characteristics: 1999
Student characteristics Total Male Female
Total
Race/ethnicity
White, non-Hispanic
Black, non-Hispanic
Hispanic
Other, non-Hispanic
Grade
6th
7th
8th
9th
10th
11th
12th
Urbanicity
Urban
Suburban
Rural
Control
Public
Private
5.1
5.3
5.5
4.4
2.5
10.5
9.0
5.5
5.0
3.2
2.6
1.2
5.04.95.8
5.32.8
5.4
5.6
6.0
4.6
3.1
12.6
10.9
5.1
5.2
2.7
2.1
0.7
5.95.25.2
5.63.5
4.8
5.1
4.9
4.1
1.9
8.0
7.0
6.0
4.8
3.7
3.2
1.7
4.1
4.5
6.5
5.12.1
NOTE: "At school" means in the school building, on the school grounds, or on a school bus. Population size is 24,614,000 students ages 12 through 18 in 1999.
SOURCE: U.S. Department of Justice, Bureau of Justice Statistics, School Crime Supplement to the National Crime Victimization Survey, January-June 1999.
Supplemental Tables

Table 7.1.—Percentage of students in grades 9 through 12 who reported having their property stolen or deliberately damaged on school propertyduring the last 12 months, by selected student characteristics: 1993,1995, and 1997
Student characteristics 1993 1995* 1997*
Total 32.7 34.9 32.9
GenderMaleFemale
Race/ethnicityWhite, non-HispanicBlack, non-HispanicHispanicAsian/Pacific IslanderOther, non-Hispanic
Grade9th10th11th12th
37.028.1
32.035.532.232.935.9
37.232.832.328.9
41.427.9
34.933.634.035.039.0
39.036.235.229.5
36.129.0
32.634.032.127.235.5
36.935.432.327.9
*The response rate for this survey was less than 70 percent and a full nonresponse bias analysis has not been done to date.
NOTE: "On school property" was not defined for survey respondents.
SOURCE: U.S. Department of Health and Human Services, Public Health Service, Centers for Disease Control and Prevention, National Center for Health Statistics, National Health InterviewSurvey—Youth Risk Behavior Survey, 1993,1995, and 1997.
Supplemental Tables

Table 8.1.—Percentage of public schools that reported one or more criminal incidents to police, by seriousness of the incident, urbanicity, andselected school characteristics: 1996-97
Less serious violent or nonviolent incidents
School characteristics
Total
Instructional levelElementary schoolMiddle schoolHigh school
RegionNortheastSoutheastCentralWest
School enrollmentLess than 300300-9991,000 or more
Minority enrollmentLess than 5 percent5-19 percent20-49 percent50 percent or more
Free/reduced-price lunch eligibilityLess than 20 percent21-34 percent35-49 percent50-74 percent75 percent or more
Total
56.7
45.174.176.9
51.658.850.864.3
37.859.689.1
46.757.758.168.3
54.453.259.458.859.2
City
59.3
46.986.788.8
51.955.152.569.8
—54.293.1
—52.054.764.8
50.656.076.160.858.5
Any incidentsUrbanfringe
58.4
47.078.884.0
49.365.551.769.869
—54.286.7
47.262.958.1562.3
57.365.553.354.7—
Town
63.2
52.67.084.2
53.764.859.972.5
44.967.386.5
53.964.066.781.5
64.257.263.166.6—
Rural
46.9
34.262.064.1
52.551.143.645.8
38.056.8—
40.845.053.374.9
41.239.552.552.0—
Total
10.1
4.2186.720.6
6.89.2
11.111.9
3.99.3
32.9
5.810.911.1142.67
8.611.711.68.9
10.2
Serious violent incidents
City
16.8
6.135.848.0
9.517.316.420.2
—12.544.2
—.4519.117.6
12.218.434.222.98.4
Urbanfr inge
11.2
3.3018.733.0
6.913.212.413.3
—9.0
29.8
5.911.310.117.8
9.913.38.6
10.3—
Town
2.4
2.07.0
12.7
2.64.96.47.2
8.83.2
15.9
3.310.65.04.4
7.17.13.02.0—
Rural
7.8
5.14509.4
11.04.9
10.25.7
2.513.9—
7.36.88.0
11.6
5.611.68.62.3—
Total
46.5
40.855.455.9
44.749.639.751.9
33.850.256.0
40.946.647.053.1
45.841.647.849.549.0
and no serious violent incidents
City
42.4
40.850.939.9
42.237.836.149.5
—41.748.1
—37.435.647.1
38.237.541.537.950.2
Urbanfringe
46.7
43.257.149.4
42.452.339.7354.4
—49.556.9
41.351.148.442.6
47.452.244.742.4—
Town
57.8
50.663.071.5
51.259.953.465.3
36.164.170.6
50.553.561.777.1
57.150.260.164.6—
Rural
39.2
29.147.054.7
41.546.233.540.0
35.542.9—
33.538.145.363.3
35.727.943.949.8—
—Fewer than 30 sample cases.
NOTE: Serious violent crimes include murder, rape or other type of sexual battery, suicide, physical attack or fight with a weapon, or robbery. Less serious violent or nonviolent crimes includephysical attack or fight without a weapon, theft/larceny, and vandalism. Any incidents refer to any of the crimes listed. Not included are any crimes not listed here and any crimes not reported topolice. Schools were asked to report crimes that took place in school buildings, on school buses, on school grounds, and at places holding school-sponsored events. Population size is 78,000 publicschools.
SOURCE: U.S. Department of Education, National Center for Education Statistics, Fast Response Survey System, "Principal/School Disciplinarian Survey on School Violence," FRSS 63,1997.
Supplemental Tables

Table 8.2.—Number of public schools that reported one or more criminal incidents to police, by seriousness of the incident, urbanicity, andselected school characteristics: 1996-97
Less serious violent or nonviolent incidents
School characteristics
Total
Instructional levelElementary schoolMiddle schoolHigh school
RegionNortheastSoutheastCentralWest
School enrollmentLess than 300300-9991,000 or more
Minority enrollmentLess than 5 percent5-19 percent20-49 percent50 percent or more
Free/reduced-price lunchLess than 20 percent21-34 percent35-49 percent50-74 percent75 percent or more
Total
44,000
21,60010,40012,000
7,80010,00011,40014,800
7,70029,8006,600
11,30010,10010,30011,900
eligibility10,0009,2007,7009,4007,400
City
10,600
5,9002,6002,200
1,5002,1002,5004,600
—7,2002,800
—1,8002,7005,600
1,4001,5001,7002,4003,700
Any incidentsUrbanfringe
08,300
5,9001,4002,300
2,7002,2002,5003,600
—7,2002,400
1,8003,9003,1002,300
4,0001,6001,4001,700—
Town
12,400
5,8003,1003,500
2,3003,2003,0003,900
2,1007,2001,100
4,2003,02,5002,300
3,0002,9002,1003,000—
Rural
9,900
4,1001,9004,000
2,7002,5003,5002,700
4,4005,200
—
4,8001,4002,0005,600
1,7002,6002,5003,00
—
Total
7,900
2,0002,6003,200
1,0001,6002,5002,800
8004,6002,400
1,4003,9002,0001,600
1,5001,6002,5002,2001,300
Serious violent incidents
City
3,000
8003,1002,200
300600800
3,600
—1,7001,300
—500900
5,600
3,00500800900500
Urbanfringe
2,100
100800900
400400600700
—1,300
800
200700500700
7005002,003,00—
Town
1,00
600100500
5001003,00400
400600200
300500700400
3,00200100700—
Rural
10,600
600500600
300100800600
3001,300
—
900200300300
600700700700—
Total
08,300
03,5007,8008,700
6,7008,4002,700
02,400
6,90003,9004,100
9,9001,2008,3002,300
8,5007,2006,2002,2006,100
and no serious violent incidents
City
8,300
4,1002,60012,000
2,3002,3002,7003,900
—4,6001,400
—1,2001,7004,100
10,0001,000
7002,9003,200
Urbanfringe
8,900
5,9002,803,400
2,3003,0002,7002,900
—6,9001,500
1,5001,2002,6005,600
1,5001,6001,4002,200
—
Town
08,300
3,5001,4003,400
2,2003,0002,7003,500
1,7003,900
900
4,0002,5001,7001,400
1,5001,6002,502,200—
Rural
8,300
3,5001,4003,400
9002,3002,7002,400
4,1003,900
—
4,0001,2001,7001,400
1,5001,6002,1002,200
—
—Fewer than 30 sample cases.
NOTE: Serious violent crimes include murder, rape or other type of sexual battery, suicide, physical attack or fight with a weapon, or robbery. Less serious violent or nonviolent crimes includephysical attack or fight without a weapon, theft/larceny, and vandalism. Any incidents refer to any of the crimes listed. Not included are any crimes not listed here and any crimes not reported topolice. Schools were asked to report crimes that took place in school buildings, on school buses, on school grounds, and at places holding school-sponsored events. Population size is 78,000public schools. Because of rounding or missing data, detail may not add to totals. Numbers are rounded to the nearest 100.
SOURCE: U.S. Department of Education, National Center for Education Statistics, Fast Response Survey System, "Principal/School Disciplinarian Survey on School Violence," FRSS 63,1997.
Supplemental Tables

Table 8.3.—Number of criminal incidents occurring in public schools reported to police, by seriousness of the incident, urbanicity, and selectedschool characteristics: 1996-97
School characteristics
Total
Instructional levelElementary schoolMiddle schoolHigh school
RegionNortheastSoutheastCentralWest
School enrollmentLess than 300300-9991,000 or more
Minority enrollmentLess than 5 percent5-19 percent20-49 percent50 percent or more
Free/reduced-price lunchLess than 20 percent21-34 percent35-49 percent50-74 percent75 percent or more
Total
424,500
78,700136,400209,400
67,40095,40095,000
166,700
40,000204,100180,400
66,20088,800
103,500159,400
eligibility91,70083,90072,90093,90075,800
City
146,700
19,00061,00066,800
19,00024,40034,80068,500
—61,90082,800
—15,70037,90089,000
18,10022,80023,60045,90035,900
Any incidentsUrbanfringe
110,600
25,90032,60052,000
23,50034,60016,40036,100
—41,50067,700
9,10035,20031,60034,700
34,30026,90015,70017,000—
Town
103,800
22,20029,80051,900
17,50020,70021,80043,800
14,80063,00026,000
27,00028,50020,70021,400
34,30021,40016,60021,400—
Rural
63,400
11,6001,038,700
7,40015,70021,90036,100
21,70037,700
—
26,4005,200
13,40034,700
11,60012,80017,1007,00—
Total
22,600
25,9007,800
11,900
6,9005,7007,8008,500
2,30035,2009,600
1,8004,1005,200
13,200
2,9005,3003,3009,6005,400
Serious violent incidents
City
60,200
1,4005,2008,700
6,9001,6007,8007,900
—0,8006,000
—15,702,80089,000
70026,9023,6045,9002,500
Urbanfringe
46,700
4006,4001,900
4001,6000,2003,800
—7,7003,000
20015,707,9003,200
18,1026,90
600600
—
Town
3,800
000400
7,200
4006005,00
6,700
1,600800500
3008,800
600200
600,00400,00
—
Rural
1,900
9,00800
7,200
500600
7,800800
6005,200—
1,300200500
13,200
300900600,00
—
Less serious violent or nonviolent incidents
Total
0011,900
10,80012,200197,500
23,500015,20020,200
159,200
37,7000035,200170,800
64,50009,10012,800
13,200
26,70078,6006,40088,50070,400
City
002,800
10,80029,40037,200
06,90015,20020,20017,900
—56,10076,800
—09,10031,600014,30
27,30026,900016,60009,60033,500
Urbanfringe
101,00060
10,80032,60037,200
06,90015,20020,20017,900
—35,20064,700
8,90009,10031,6003,200
27,30011,90016,40016,100—
Town
10,60010
10,8002 ,20037,200
06,90015,20020,20042,100
13,20035,20025,500
26,80026,70013,400013,200
11,60011,90016,40021,200—
Rural
60,200
10,80012,20037,200
6,90015,20020,20017,900
21,20035,200
—
25,1009,100
12,80013,200
11,60011,90016,4009,600—
—Fewer than 30 sample cases.
NOTE: Serious violent crimes include murder, rape or other type of sexual battery, suicide, physical attack or fight with a weapon, or robbery. Less serious violent or nonviolent crimes includephysical attack or fight without a weapon, theft/larceny, and vandalism. Any incidents refer to any of the crimes listed. Not included are any crimes not listed here and any crimes not reported topolice. Schools were asked to report crimes that took place in school buildings, on school buses, on school grounds, and at places holding school-sponsored events. Because of rounding or missingdata, detail may not add to totals. Numbers are rounded to the nearest 100.
SOURCE: U.S. Department of Education, National Center for Education Statistics, Fast Response Survey System, "Principal/School Disciplinarian Survey on School Violence," FRSS 63,1997.
Supplemental Tables

Table 8.4.—Number of criminal incidents reported to police per 1,000 public school students, by seriousness of the incident, urbanicity, andselected school characteristics: 1996-97
School characteristics
Total
Instructional levelElementary schoolMiddle schoolHigh school
RegionNortheastSoutheastCentralWest
School enrollmentLess than 300300-9991,000 or more
Minority enrollmentLess than 5 percent5-19 percent20-49 percent50 percent or more
Free/reduced-price lunchLess than 20 percent21-34 percent35-49 percent50-74 percent75 percent or more
Total
10.0
3.516.218.1
8.19.29.5
12.2
10.77.3
16.9
6.98.7
10.213.2
eligibility8.19.2
10.711.711.2
City
11.6
2.724.820.9
8.89.1
13.713.1
—8.0
18.2
—7.4
11.613.1
9.111.313.716.19.2
Any incidentsUrbanfringe
8.8
3.912.615.7
7.713.65.98.7
—5.2
17.0
4.68.19.7
11.8
6.810.510.38.7—
Town
10.2
4.513.017.6
8.27.29.4
15.5
17.18.3
15.3
7.611.19.7
13.3
9.98.29.49.8—
Rural
9.0
0.2012.218.1
7.47.09.6
12.1
11.28.0—
7.30.508.9
20.0
8.06.59.69.1—
Total
0.5
0.10.91.70
0.40.40.80.5
0.60.40.9
0.20.40.51.0
0.30.60.50.70.8
Serious violent incidents
City
0.9
0.22.11.7
0.80.61.80.7
—0.81.3
—0.50.91.2
0.50.8010.21.50.6
Urbanfringe
0.4
0.10.60.9
0.20.60.40.3
—0.20.8
0.10.20.40.8
0.20.80.20.4—
Town
0.3
0.02.20.8
0.20.10.20.6
1.80.10.3
0.10.70.31.1
0.20.20.20.1—
Rural
0.4
0.20.80.7
0.50.30.70.3
0.30.5—
0.30.20.41.6
0.30.50.40.1—
Less serious violent or nonviolent incidents
Total
9.5
3.415.317.0
7.78.88.8
11.6
10.16.9
16.0
6.78.39.7
12.3
7.98.6
10.211.010.4
City
10.7
2.522.619.3
8.08.5
11.912.4
—7.3
16.8
—6.9
10.812.0
8.610.312.514.58.6
Urbanfringe
8.4
3.812.014.9
7.513.05.58.4
—5.0
16.3
4.47.99.3
11.1
6.69.7
10.18.3—
Town
9.9
4.512.916.8
8.07.19.2
14.8
15.38.2
15.0
7.610.49.4
13.2
9.78.19.29.8—
Rural
8.5
2.811.417.4
6.96.78.9
11.8
10.97.5—
7.07.88.5
18.4
7.86.09.29.0—
—Fewer than 30 sample cases.
NOTE: Serious violent crimes include murder, rape or other type of sexual battery, suicide, physical attack or fight with a weapon, or robbery. Less serious violent or nonviolent crimes includephysical attack or fight without a weapon, theft/larceny, and vandalism. Any incidents refer to any of the crimes listed. Not included are any crimes not listed here and any crimes not reported topolice. Schools were asked to report crimes that took place in school buildings, on school buses, on school grounds, and at places holding school-sponsored events. Population size is 42,336,819public school students.
SOURCE: U.S. Department of Education, National Center for Education Statistics, Fast Response Survey System, "Principal/School Disciplinarian Survey on School Violence," FRSS 63,1997.
Supplemental Tables

Table 9.1.—Percentage of public schools that reported one or more incidents of serious violent crime to police, by type of incident, urbanicity, andselected school characteristics: 1996-97
Rape or other type of sexual battery Physical attack or fight with a weapon Robbery
School characteristics
Total
Instructional levelElementary schoolMiddle schoolHigh school
RegionNortheastSoutheastCentralWest
School enrollmentLess than 300300-9991,000 or more
Minority enrollmentLess than 5 percent5-19 percent20-49 percent50 percent or more
Free/reduced-price lunchLess than 20 percent21-34 percent35-49 percent50-74 percent75 percent or more
Total
3.0
0.85.27.6
2.23.52.93.2
1.32.5
11.4
1.83.23.64.0
eligibility2.93.44.41.63.0
City
5.1
1.19.2
20.4
4.24.27.04.7
—2.5
18.3
—5.97.04.0
4.56.4
11.34.23.0
Urbanfringe
3.7
0.97.5
11.6
2.08.71.34.6
—3.48.7
2.63.62.27.2
3.55.45.42.6—
Town
1.3
2.13.9
0.92.4
1.9
1.50.94.5
0.91.51.62.1
1.4
1.9
—
Rural
2.1
1.33.13.4
2.70.63.41.5
1.33.3—
2.11.82.11.4
2.43.72.4
—
Total
6.0
2.311.612.5
4.25.05.88.2
1.95.6
20.4
3.25.67.49.3
5.16.56.16.06.7
City
10.3
4.021.828.0
7.512.26.3
13.2
—7.9
26.5
—4.4
12.112.2
8.011.919.213.35.5
Urbanfringe
6.5
2.010.793.41
3.74.49.48.0
—4.7
18.8
1.66.87.98.7
5.29.11.08.4—
Town
3.0
5.68.0
0.91.82.06.6
4.02.09.1
2.05.73.21.3
5.62.01.01.3—
Rural
4.9
3.011.15.7
7.23.25.84.3
1.29.0—
4.44.34.99.3
2.66.16.22.3—
Total
3.1
0.85.47.9
3.12.32.64.1
0.52.2
15.8
1.02.12.97.3
1.22.72.93.85.6
City
8.1
1.915.331.0
7.85.97.69.9
—4.6
27.0
—6.18.79.5
4.18.7
12.611.55.9
Urbanfringe
2.7
0.46.88.0
2.12.62.53.7
—1.4
12.0
1.60.91.19.1
1.21.92.23.8—
Town
0.9
4.1
0.90.7
1.8
1.50.52.3
0.51.51.01.0
0.71.10.7—
Rural
1.1
0.91.71.3
3.61.11.3
2.6—
1.10.8
t3.5
0.62.4
—
—Fewer than 30 sample cases.•f No cases are reported in this cell, although the event defined by this cell could have been reported by some schools with these characteristics had a different sample been drawn.
NOTE: Examples of weapons are guns, knives, sharp-edged or pointed objects, baseball bats, frying pans, sticks, rocks, and bottles. Schools were asked to report crimes that took place in schoolbuildings, on school buses, on school grounds, and at places holding school-sponsored events. Population size is 78,000 public schools.
SOURCE: U.S. Department of Education, National Center for Education Statistics, Fast Response Survey System, "Principal/School Disciplinarian Survey on School Violence," FRSS 63,1997.
Supplemental Tables
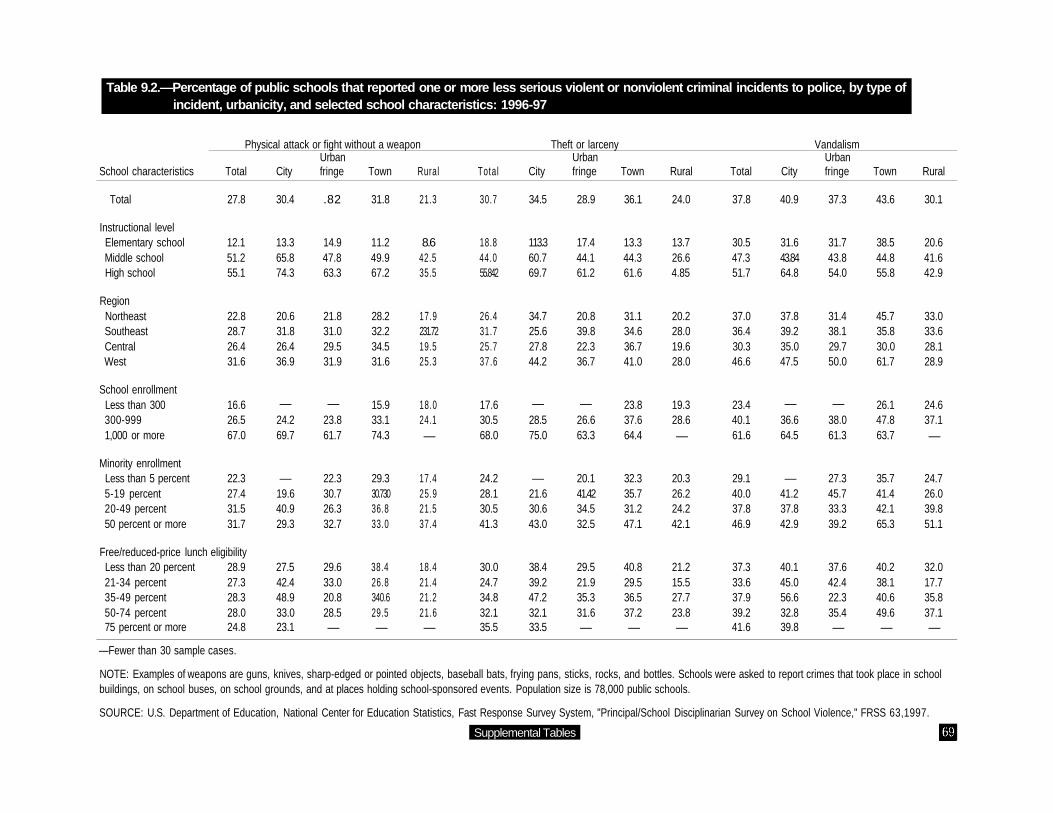
Table 9.2.—Percentage of public schools that reported one or more less serious violent or nonviolent criminal incidents to police, by type ofincident, urbanicity, and selected school characteristics: 1996-97
School characteristics
Total
Instructional levelElementary schoolMiddle schoolHigh school
RegionNortheastSoutheastCentralWest
School enrollmentLess than 300300-9991,000 or more
Minority enrollmentLess than 5 percent5-19 percent20-49 percent50 percent or more
Free/reduced-price lunchLess than 20 percent21-34 percent35-49 percent50-74 percent75 percent or more
Physical attack or fight without a weapon
Total
27.8
12.151.255.1
22.828.726.431.6
16.626.567.0
22.327.431.531.7
eligibility28.927.328.328.024.8
City
30.4
13.365.874.3
20.631.826.436.9
—24.269.7
—19.640.929.3
27.542.448.933.023.1
Urbanfringe
.82
14.947.863.3
21.831.029.531.9
—23.861.7
22.330.726.332.7
29.633.020.828.5—
Town
31.8
11.249.967.2
28.232.234.531.6
15.933.174.3
29.330.73036.833.0
38.426.8340.629.5—
Rural
21.3
8.642.535.5
17.9231.7219.525.3
18.024.1—
17.425.921.537.4
18.421.421.221.6—
Total
30.7
18.844.055.842
26.431.725.737.6
17.630.568.0
24.228.130.541.3
30.024.734.832.135.5
City
34.5
113.360.769.7
34.725.627.844.2
—28.575.0
—21.630.643.0
38.439.247.232.133.5
Theft or larcenyUrbanfringe
28.9
17.444.161.2
20.839.822.336.7
—26.663.3
20.141.4234.532.5
29.521.935.331.6—
Town
36.1
13.344.361.6
31.134.636.741.0
23.837.664.4
32.335.731.247.1
40.829.536.537.2—
Rural
24.0
13.726.64.85
20.228.019.628.0
19.328.6—
20.326.224.242.1
21.215.527.723.8—
Total
37.8
30.547.351.7
37.036.430.346.6
23.440.161.6
29.140.037.846.9
37.333.637.939.241.6
City
40.9
31.643.8464.8
37.839.235.047.5
—36.664.5
—41.237.842.9
40.145.056.632.839.8
VandalismUrbanfringe
37.3
31.743.854.0
31.438.129.750.0
—38.061.3
27.345.733.339.2
37.642.422.335.4—
Town
43.6
38.544.855.8
45.735.830.061.7
26.147.863.7
35.741.442.165.3
40.238.140.649.6—
Rural
30.1
20.641.642.9
33.033.628.128.9
24.637.1—
24.726.039.851.1
32.017.735.837.1—
—Fewer than 30 sample cases.
NOTE: Examples of weapons are guns, knives, sharp-edged or pointed objects, baseball bats, frying pans, sticks, rocks, and bottles. Schools were asked to report crimes that took place in schoolbuildings, on school buses, on school grounds, and at places holding school-sponsored events. Population size is 78,000 public schools.
SOURCE: U.S. Department of Education, National Center for Education Statistics, Fast Response Survey System, "Principal/School Disciplinarian Survey on School Violence," FRSS 63,1997.
Supplemental Tables

Table 9.3.—Number of public schools that reported one or more incidents of serious violent crime to police, by type of incident, urbanicity, andselected school characteristics: 1996-97
Rape or other type of sexual battery Physical attack or fight with a weapon Robbery
School characteristics
Total
Instructional levelElementary schoolMiddle schoolHigh school
RegionNortheastSoutheastCentralWest
School enrollmentLess than 300300-9991,000 or more
Minority enrollmentLess than 5 percent5-19 percent20-49 percent50 percent or more
Free/reduced-price lunchLess than 20 percent21-34 percent35-49 percent50-74 percent75 percent or more
Total
2,326
404731
1,192
333595661738
2551,232
840
430557636704
eligibility531589566250373
City
912
141281491
124155327307
—334545
—210341342
123167250166191
Urbanfringe
707
115265328
11229061
245
—473235
97223116111
24421713885—
Town
256
91164
36120
t100
6812860
66686260
66
62
—
Rural
451
14993
209
6131
27386
154297—
24756
11731
98205117
—
Total
4,695
1,1081,6261,960
627850
1,3131,904
3832,8041,508
773974
1,3201,628
9461,120
785959844
City
1,845
499665681
224456298868
—1,051
794
—156589
1,060
218308426528349
Urbanfringe
1,230
254379597
203146454427
—658512
61418424328
35936826
271—
Town
580
247334
369098
356
187273120
15826512136
2611003260—
Rural
1,039
355335349
165158463253
135821—
515136185203
108344301100—
Total
2,389
395760
1,235
468394582946
1011,1231,166
231366520
1,273
222473373607698
City
1,461
239467755
233220356652
—619810
—215424822
110226279456373
Urbanfringe
520
53242226
11685
123196
—194326
615759
344
867757
121—
Town
171
171
3636
98
687330
36683630
363630—
Rural
237
1035183
8252
103
237—
13326
78
26133
—
NOTE: Examples of weapons are guns, knives, sharp-edged or pointed objects, baseball bats, frying pans, sticks, rocks, and bottles. Schools were asked to report crimes that took place in schoolbuildings, on school buses, on school grounds, and at places holding school-sponsored events. Population size is 78,000 public schools. Because of rounding or missing data, detail may not addto totals.
SOURCE: U.S. Department of Education, National Center for Education Statistics, Fast Response Survey System, "Principal/School Disciplinarian Survey on School Violence," FRSS 63,1997.
Supplemental Tables

Table 9.4.—Number of public schools that reported one or more less serious violent or nonviolent criminal incidents to police, by type of incident,urbanicity, and selected school characteristics: 1996-97
School characteristics
Total
Instructional levelElementary schoolMiddle schoolHigh school
RegionNortheastSoutheastCentralWest
School enrollmentLess than 300300-9991,000 or more
Minority enrollmentLess than 5 percent5-19 percent20-49 percent50 percent or more
Free/reduced-price lunchLess than 20 percent21-34 percent35-49 percent50-74 percent75 percent or more
Physical attack or fight without a weapon
Total
21,600
5,8007,2008,600
3,4004,9005,9007,300
3,40013,300
4,900
5,4004,8005,6005,500
eligibility5,3004,7003,7004,5003,100
City
5,500
1,7002,0001,800
6001,2001,2002,400
—3,2002,100
—700
2,0002,500
700800
1,1001,3001,500
Urbanfringe
6,400
1,9001,7001,800
1,2001,01,4001,700
—3,3001,700
8001,9001,4001,200
1,8001,300
500900—
Town
6,200
1,2002,2002,800
1,2001,6001,7001,700
7004,5001,000
2,3001,4001,4001,0
1,8001,4001,100501,300—
Rural
4,500
1,901,3002,200
4001,02,2001,500
2,1002,200—
2,0800800800
8001,2001,100501,30090—
Total
06,400
9,0006,2008,600
4,0005,4005,8008,700
3,60002,200
5,000
5,9001,9001,4007,200
5,5001,300005005,0004,400
City
6,200
2,7001,9001,700
1,201,01,3002,900
—3,8002,200
—800
1,5003,700
7001,0001,100501,3002,100
Theft or larcenyUrbanfringe
6,400
2,7001,3001,700
1,2001,7001,4002,900
—6,5001,700
70000700008001,200
1,800900700
1,30090—
Town
7,100
2,6001,9002,600
2,0001,7005,8002,900
1,1005,200
900
2,500007001,6001,90
1,8001,0001,3002,200—
Rural
6,400
4,200800
2,600
5005,4002,2001,700
2,2003,400—
2,400800600900
900900
1,7001,300—
Total
29,300
0 4 , 0 01,6001,800
5,6001,8006,800
1 , 7 0 0
4,700004,50
4,500
7,0007,0001,6007,200
6,9005,8001,7006,2005,200
City
8,500
3,9001,3002,600
1,2001,7002,2001,700
—6,5001,900
—1,900008003,700
1,8001,2001,7001,3002,500
VandalismUrbanfringe
7,000
4,0001,3001,500
2,0001,7001,4002,600
—2,2001,700
1,0002,800008001,90
1,8001,0
6001,300—
Town
6,400
4,2002,0002,300
2,0001,8002,2001,700
1,2003,400
800
2,8001,9001,5001,900
1,8001,0001,7002,200—
Rural
6,400
2,4001,3002,600
8001,7002,2001,700
2,8003,400—
2,900800
1,5001,100
1,3001,0001,7001,600—
—Fewer than 30 sample cases.
NOTE: Examples of weapons are guns, knives, sharp-edged or pointed objects, baseball bats, frying pans, sticks, rocks, and bottles. Schools were asked to report crimes that took place in schoolbuildings, on school buses, on school grounds, and at places holding school-sponsored events. Population size is 78,000 public schools. Because of rounding or missing data, detail may not addto totals. Numbers are rounded to the nearest 100.
SOURCE: U.S. Department of Education, National Center for Education Statistics, Fast Response Survey System, "Principal/School Disciplinarian Survey on School Violence," FRSS 63,1997.
Supplemental Tables

Table 9.5.—Number of serious violent criminal incidents occurring in public schools reported to police, by type of incident, urbanicity, and selectedschool characteristics: 1996-97
Rape or other type of sexual battery Physical attack or fight with a weapon Robbery
School characteristics
Total
Instructional levelElementary schoolMiddle schoolHigh school
RegionNortheastSoutheastCentralWest
School enrollmentLess than 300300-9991,000 or more
Minority enrollmentLess than 5 percent5-19 percent20-49 percent50 percent or more
Free/reduced-price lunchLess than 20 percent21-34 percent35-49 percent50-74 percent75 percent or more
Total
4,200
7001,4002,100
5001,2001,2001,300
3002,0001,800
700800
1,5001,200
eligibility800
1,1001,000
600600
City
1,900
300600
1,100
200400600700
—600
1,300
—400800700
300400500400400
Urbanfringe
1,100
100600500
200500100400
—700500
100300300400
3004001,00200—
Town
300
400100
200
300
100100100
100100500100
100
1,00
—
Rural
800
300200400
100200500300
200600—
500100200
200400200
—
Total
11,000
1,6004,1005,300
1,1001,6004,3003,900
1,4005,7003,900
9002,4002,2005,400
1,4002,400005002,9002,700
City
5,400
9002,7001,800
600900
2,4001,600
—3,3002,100
—400
001003,900
300900
1,0002,300
900
Urbanfringe
1,100
300600
1,200
300500500700
—700
1,300
100600600700
4001,000
500—
Town
1,700
30000400
200400
1,300
1,000300400
200100
200
5001,00
100—
Rural
00800
500500800
200200
1,100400
3001,400
—
600100300800
200400400100—
Total
7,200
400003004,400
1,6001,3002,1002,200
2003,300703,900
300600
1,5004,800
7001,500
9002,302,000
City
00500
2001,9002,400
900300
1,6001,600
—1,9002,600
—300900
3,400
300700500
1,7001,200
Urbanfringe
00500
100300
1,200
200700400300
—300
1,300
100100300
1,100
300600100200—
Town
600
600
300
300
200300100
200300100
300100—
Rural
500
100100300
200300100
500—
200100
300
100200
—
NOTE: Examples of weapons are guns, knives, sharp-edged or pointed objects, baseball bats, frying pans, sticks, rocks, and bottles. Schools were asked to report crimes that took place in schoolbuildings, on school buses, on school grounds, and at places holding school-sponsored events. Because of rounding or missing data, detail may not add to totals. Numbers are rounded to thenearest 100.
SOURCE: U.S. Department of Education, National Center for Education Statistics, Fast Response Survey System, "Principal/School Disciplinarian Survey on School Violence," FRSS 63,1997.
Supplemental Tables

Table 9.6.—Number of less serious violent or nonviolent criminal incidents occurring in public schools reported to police, by type of incident,urbanicity, and selected school characteristics: 1996-97
School characteristics
Total
Instructional levelElementary schoolMiddle schoolHigh school
RegionNortheastSoutheastCentralWest
School enrollmentLess than 300300-9991,000 or more
Minority enrollmentLess than 5 percent5-19 percent20-49 percent50 percent or more
Free/reduced-price lunchLess than 20 percent21-34 percent35-49 percent50-74 percent75 percent or more
Physical attack or fight without a weapon
Total
187,900
21,50073,30093,100
29,10050,70045,60062,500
15,60087,90084,400
24,30035,60054,00072,600
eligibility40,00034,90033,30045,90028,800
City
62,100
2,90034,10025,200
8,8009,800
18,30025,200
—27,50034,200
—5,500
16,80038,100
6,4008,800
10,70022,90013,200
Urbanfringe
54,800
8,30019,10027,400
12,20022,700
8,20011,700
—18,40035,300
3,10035,60017,50018,500
16,10013,800
8,7009,200—
Town
46,300
7,40014,70024,300
5,00011,40010,90005,000
5,80027,60012,900
11,200005,50013,4009,800
12,9007,3007,200
10,100—
Rural
24,700
3,05,400
16,300
3,0006,8008,2001,700
8,20014,500
—
8,3003,9006,2006,200
4,5005,0006,8003,700—
Total
115,500
19,50005,40064,600
12,20023,30023,0005 , 0 0 0
9,900018,40054,200
21,40029,40025,90034,800
04,50026,10021,60003,30015,800
Theft or larceny
City
39,900
7,40012,30024,30
4,0001,4007,500
019,00
—13,50025,900
—1,600
13,4006,600
7,2007,4006,500
10,6008,200
Urbanfringe
46,300
6,4008,100
13,800
6,0007,4008,200
11,700
—7,900
18,300
3,400005,500
8,8008,500
1005,5006,2005,1003,300—
Town
25,700
6,4004,700
16,700
5,5004,2006,000
05,000
3,20014,500
8,400
8,1005,5003,0004,900
8,3003,8005,1003,300—
Rural
46,300
2,9003,400
16,300
1,2004,2008,3005,200
6,10010,000
—
8,70035,6001 ,009,800
3,9002,5004,0003,300—
Total
25,700
05,00003,40008,000
17,10004,20006,70045,500
12,30014,5032,200
18,7001,60017,500006,600
05,50002,50004,80010,1025,800
City
024,700
9,0004,700
14,300
1,2004,2006,700
10,900
—10,00016,700
—1,6003,400
06,600
3,6002,5004,8008,000
12,000
VandalismUrbanfringe
25,700
008,3004,0008,90
1,2003,9003,000
05,000
—10,00011,000
2,4008,0004,0008,500
7,1004,9004,8003,300—
Town
25,700
005,0003,4008,700
1,2004,2006,700
10,900
4,20010,000
4,200
7,5001,6003,4006,600
5,5002,5004,8003,300—
Rural
17,200
5,0003,4008,900
1,2004,2006,7005,000
6,90010,000
—
8,1001,6003,4004,000
3,2002,5004,8003,300—
—Fewer than 30 sample cases.
NOTE: Examples of weapons are guns, knives, sharp-edged or pointed objects, baseball bats, frying pans, sticks, rocks, and bottles. Schools were asked to report crimes that took place in schoolbuildings, on school buses, on school grounds, and at places holding school-sponsored events. Because of rounding or missing data, detail may not add to totals. Numbers are rounded to thenearest 100.
SOURCE: U.S. Department of Education, National Center for Education Statistics, Fast Response Survey System, "Principal/School Disciplinarian Survey on School Violence," FRSS 63,1997.
Supplemental Tables

Table 9.7.—Number of serious violent criminal incidents reported to police per 1,000 public school students, by type of incident, urbanicity, andselected school characteristics: 1996-97
Rape or other type of sexual battery Physical attack or fight with a weapon Robbery
School characteristics
Total
Instructional levelElementary schoolMiddle schoolHigh school
RegionNortheastSoutheastCentralWest
School enrollmentLess than 300300-9991,000 or more
Minority enrollmentLess than 5 percent5-19 percent20-49 percent50 percent or more
Free/reduced-price lunchLess than 20 percent21-34 percent35-49 percent50-74 percent75 percent or more
Total
0.1
0.00.20.2
0.10.10.10.1
0.10.10.2
0.10.10.10.1
eligibility0.10.10.10.10.1
City
0.2
0.00.20.3
0.10.20.20.1
—0.10.3
—0.20.20.1
0.10.20.30.10.1
Urbanfringe
0.1
0.00.20.1
0.10.20.00.1
—0.10.1
0.00.10.10.1
0.10.20.10.1—
Town
0.10
0.200.1
0.100.1
t0.10
0.10.00.1
0.00.00.100.0
0.20
0.1
—
Rural
0.1
0.10.20.2
0.10.10.20.1
0.10.1—
0.10.00.20.0
0.10.20.1
—
Total
0.3
0.10.50.5
0.10.20.40.3
0.40.20.4
0.10.20.20.5
0.10.30.20.40.4
City
0.4
0.11.10.6
0.30.31.00.3
—0.40.5
—0.20.30.6
0.20.40.60.80.2
Urbanfringe
0.2
0.00.20.4
0.10.20.20.2
—0.10.3
0.00.10.20.2
0.10.40.100.2—
Town
0.2
0.10.5
0.100.00.10.5
1.20.00.2
0.00.50.10.0
0.20.10.100.0—
Rural
0.3
0.10.50.4
0.20.10.50.2
0.20.3—
0.20.10.21.1
0.10.20.20.1—
Total
0.2
0.00.30.4
0.20.10.20.2
0.10.10.4
0.00.10.10.4
0.10.20.10.20.3
City
0.4
0.00.80.7
0.40.10.60.3
—0.30.6
—0.10.30.5
0.20.30.30.60.3
Urbanfringe
0.1
0.00.10.3
0.10.30.10.1
—0.00.3
0.00.00.10.4
0.10.20.10.1—
Town
0.1
0.2
0.10.0
0.1
0.20.00.0
0.00.10.10.0
*0.00.20.0—
Rural
0.1
0.00.10.2
0.20.10.0
0.1—
0.00.0
0.4
0.00.1
—
NOTE: Examples of weapons are guns, knives, sharp-edged or pointed objects, baseball bats, frying pans, sticks, rocks, and bottles. Schools were asked to report crimes that took place in schoolbuildings, on school buses, on school grounds, and at places holding school-sponsored events. Population size is 42,336,819 public school students. Values of 0.0 are less than 0.05.
SOURCE: U.S. Department of Education, National Center for Education Statistics, Fast Response Survey System, "Principal/School Disciplinarian Survey on School Violence," FRSS 63,1997.
Supplemental Tables

Table 9.8.—Number of less serious violent or nonviolent criminal incidents reported to police per 1,000 public school students, by type of incident,urbanicity, and selected school characteristics: 1996-97
School characteristics
Total
Instructional levelElementary schoolMiddle schoolHigh school
RegionNortheastSoutheastCentralWest
School enrollmentLess than 300300-9991,000 or more
Minority enrollmentLess than 5 percent5-19 percent20-49 percent50 percent or more
Free/reduced-price lunchLess than 20 percent21-34 percent35-49 percent50-74 percent75 percent or more
Physical attack or fight without a weapon
Total
4.4
1.08.78.0
3.54.94.64.6
4.23.17.9
2.53.55.36.0
eligibility3.53.84.95.74.3
City
4.9
0.413.87.9
4.13.67.24.8
—3.67.5
—2.65.25.6
3.622.36.28.03.4
Urbanfringe
4.4
1.27.48.3
4.08.92.92.8
—2.38.9
1.63.65.46.3
3.625.35.74.7—
Town
4.6
1.56.48.2
2.34.04.76.7
6.73.67.6
3.24.16.36.1
4.72.84.14.6—
Rural
3.5
0.85.17.6
3.03.03.64.4
4.23.1—
2.33.3428.7
3.02.53.83.5—
Total
2.7
0.93.75.6
2.622.32.33.7
2.61.85.1
2.22.92.52.9
2.62.83.22.82.3
City
3.52
0.85.06.9
1.92.72.94.0
—1.85.7
—2.73.43.2
3.63.63.83.72.1
Theft or larcenyUrbanfringe
2.3
1.03.14.2
1.92.51.52.8
—1.924.6
1.72.42.71.9
2.02.43.42.3—
Town
2.9
0.93.45.7
2.61.92.63.33
3.72.34.9
2.33.71.43.0
3.03.12.92.2—
Rural
2.6
0.73.25.6
2.61.92.34.1
3.12.3—
2.43.12.14.1
2.62.22.72.4—
Total
2.3
1.62.83.4
2.01.71.93.3
3.31.93.0
2.01.91.83.4
1.71.92.22.53.8
City
2.6
1.33.84.5
2.12.11.73.5
—2.03.7
—1.62.33.2
1.82.32.52.83.1
VandalismUrbanfringe
1.8
1.61.52.4
1.51.51.12.7
—1.52.8
1.21.81.22.9
1.41.91.01.3—
Town
2.5
2.03.12.9
3.11.31.93.8
4.92.32.5
2.12.61.74.1
2.02.12.32.9—
Rural
2.4
1.33.14.2
1.21.93.03.3
3.62.1—
2.31.42.35.6
2.11.32.73.1—
—Fewer than 30 sample cases.
NOTE: Examples of weapons are guns, knives, sharp-edged or pointed objects, baseball bats, frying pans, sticks, rocks, and bottles. Schools were asked to report crimes that took place in schoolbuildings, on school buses, on school grounds, and at places holding school-sponsored events. Population size is 42,336,819 public school students.
SOURCE: U.S. Department of Education, National Center for Education Statistics, Fast Response Survey System, "Principal/School Disciplinarian Survey on School Violence," FRSS 63,1997.
Supplemental Tables

Table 10.1.—Number of nonfatal crimes against teachers and average annual number of crimes per 1,000 teachers at school, by type of crime andselected teacher characteristics: Aggregated from 1994 to 1998
Total crimes from 1994 to 1998 Average annual number of crimes per 1,000 teachers
Teacher characteristics
Total
Instructional levelElementaryMiddle/junior highSenior high
GenderMaleFemale
Race/ethnicityWhite, non-HispanicBlack, non-HispanicHispanicOther, non-Hispanic
Urbanicity2
UrbanSuburbanRural
Total
1,755,300
630,800531,700592,900
514,4001,241,000
1,488,900130,100104,800
16,2001
999,300469,600213,700
Theft
1,086,900
434,000281,400371,500
238,100848,900
913,50082,10066,40011.8001
612,200308,700120,700
Violent
668,400
196,800250,300221,300
276,300392,100
575,40048,00038,400
4.4001
387,100160,90093,000
Seriousviolent
79,800
51,80015,40012,600
29,70050,100
67,00010,500
2.3001
48,30021,8009,800
Total
83
56127101
9878
856591501
1037155
Theft
51
396763
4553
524158371
634631
Violent
31
186038
5325
3324331 1
402424
Seriousviolent
4
542
63
45
11
533
NOTE: Serious violent crimes include rape, sexual assault, robbery, and aggravated assault. Violent crimes include serious violent crimes and simple assault. Total crimes include violent crimes andtheft. "At school" includes inside the school building, on school property, at work site, or while working. For thefts, "while working" was not considered since thefts of teachers' property kept at schoolcan occur when teachers are not present. The data were aggregated from 1994 to 1998 due to the small number of teachers in each year's sample. On average, there were about 4.2 million teachersper year over the 5-year period for a total population size of 21,230,185 teachers. The average annual number of full-time-equivalent teachers is approximately 2.9 million. The population reportedhere includes part-time teachers as well as other instructional and support staff. Because of rounding or missing data, detail may not add to totals. Total crime numbers are rounded to the nearest100.
SOURCE: U.S. Department of Justice, Bureau of Justice Statistics, National Crime Victimization Survey, 1994 to 1998.
Supplemental Tables

Table 11.1.—Percentage and number of teachers who reported that they were threatened with injury or that they were physically attacked bya student during the past 12 months, by urbanicity and selected teacher and school characteristics: 1993-94 school year
Teachers threatened with injury by a student Teachers physically attacked by a studentPercent Number Percent Number
Urban SmallCentral fringe/ town/
Selected characteristics Total city large town rural
Urban SmallCentral fringe/ town/
Total city large town rural
Urban SmallCentral fringe/ town/
Total city large town rural
Urban SmallCentral fringe/ town/
Total city large town rural
Total 11.7 15.1 10.7 9.8 341,000 132,100 99,600 109,300 48,1 5.6 41,0 3.1 119,200 48,100 37,000 34,100
GenderMaleFemale
Race/ethnicityWhite, non-HispanicBlack, non-HispanicHispanicOther, non-Hispanic
Teacher levelElementarySecondary
ControlPublicPrivate
14.710.5
11.511.913.113.4
8.715.0
12.84.2
19.513.5
15.413.015.316.9
11.719.3
17.83.3
14.09.5
10.512.610.613.0
75,414.2
11.65.0
11.89.1
9.98.5
10.19.4
7.312.5
10.24.6
115,900 45,100 33,800 37,000225,100 87,000 65,800 72,400
294,300 103,900 88,400 102,00023,600 14,600 5,300 3,70015,800 10,200 3,400 2,200
7,300 3,300 2,500 1,400
133,600 56,300 35,900 41,400207,400 75,800 63,700 67,900
325,400 126,800 92,600 106,00015,600 5,300 7,000 3,300
3.94.2
4.13.95.25.2
4.93.2
4.42.3
5.85.4
5.74.26.46.6
6.54.3
6.41.9
3.64.1
3,94.34.35.0
4.63.2
4.22.9
2.73.3
3.12.42.73.6
3.82.2
3.22.1
008,80072,400
102,707,7001,3002,800
31,10043,800
110,7008,500
08,80034,600
37,9004,8002,2001,200
31,10017,000
45,1001,500
8,50025,700
32,8001,9001,3001,000
22,40012,200
32,6001,500
8,50025,700
32,0001,000
500500
22,00012,200
32,6001,500
NOTE: Population size is 2,940,000 teachers. Because of rounding or missing data, detail may not add to totals. Numbers are rounded to the nearest 100.
SOURCE: U.S. Department of Education, National Center for Education Statistics, Schools and Staffing Survey, 1993-94 (Teacher and School Questionnaires).
Supplemental Tables

Table 12.1.—Percentage of students in grades 9 through 12 who reported carrying a weapon on school property at least 1 day in the past 30 days,by selected student characteristics: 1993,1995, and 1997
Student characteristics 1993 1995* 1997*
Total 11.8 9.8 8.5
Gender
Male
Female
17.9
5.1
14.3
4.9
12.5
3.7
Race/ethnicity
White, non-Hispanic
Black, non-Hispanic
Hispanic
Asian/Pacific Islander
Other, non-Hispanic
Grade
9th
10th
11th
12th
Ungraded or other
10.9
15.0
13.3
6.5
17.3
12.6
11.5
11.9
10.8
24.7
9.0
10.3
14.1
5.7
13.0
10.7
10.4
10.2
7.6
88.9
7.89.2
10.4
4.0
10.9
10.2
7.7
9.4
7.016.2
*The response rate for this survey was less than 70 percent and a full nonresponse bias analysis has not been done to date.
NOTE: "On school property" was not defined for survey respondents.
SOURCE: U.S. Department of Health and Human Services, Public Health Service, Centers for Disease Control and Prevention, National Center for Health Statistics, National Health InterviewSurvey—Youth Risk Behavior Survey, 1993,1995, and 1997.
Supplemental Tables

Table 12.2.—Percentage of students in grades 9 through 12 who reported carrying a weapon at any time at least 1 day in the past 30 days, byselected student characteristics: 1993,1995, and 1997
Student characteristics 1993 1995* 1997*
Total 22.1 20.0 18.3
GenderMaleFemale
34.39.2
31.18.3
27.77.0
Race/ethnicityWhite, non-HispanicBlack, non-HispanicHispanicAsian/Pacific IslanderOther, non-Hispanic
Grade9th10th11th12thUngraded or other
20.628.524.411.029.8
25.521.421.519.940.3
18.921.824.714.624.8
22.621.120.316.195.2
17.021.723.39.2
19.2
22.617.418.215.416.7
*The response rate for this survey was less than 70 percent and a full nonresponse bias analysis has not been done to date.
NOTE: "On school property" was not defined for survey respondents.
SOURCE: U.S. Department of Health and Human Services, Public Health Service, Centers for Disease Control and Prevention, National Center for Health Statistics, National Health InterviewSurvey—Youth Risk Behavior Survey, 1993,1995, and 1997.
Supplemental Tables

Table 13.1.—Percentage of students ages 12 through 18 who reported fearing being attacked or harmed at school or on the way to and from schoolduring the previous 6 months, by selected student characteristics: 1989,1995, and 1999
Student characteristics 19892
Feared attack or harm at school1
1995 1999
Feared attack or harm on the way to and from school1
19892 1995 11999
Total
GenderMaleFemale
Race/ethnicityWhite, non-HispanicBlack, non-HispanicHispanicOther, non-Hispanic
Grade6th7th8th9th10th11th12th
UrbanicityUrbanSuburbanRural
ControlPublicPrivate
5.5 8.6 5.3 4.4 6.5 3.9
5.75.4
4.46.8
11.48.0
8.89.45.45.05.03.42.5
7.54.84.8
5.91.7
8.38.9
6.313.415.59.4
11.811.09.29.17.55.85.9
12.37.47.0
9.13.3
4.95.7
3.99.08.14.2
9.37.56.05.24.53.32.5
7.34.93.8
5.71.7
3.85.1
2.87.9
10.16.0
7.36.43.94.53.63.82.7
8.23.52.2
4.54.3
5.37.9
3.813.113.48.2
7.28.96.96.26.35.54.2
11.75.14.0
6.75.0
3.44.5
2.18.27.63.8
4.74.73.83.64.43.03.2
7.52.91.8
4.02.8
Includes students who reported that they sometimes or most of the time feared being victimized in this way.2Students ages 12 through 19.
NOTE: Comparisons between the 1989 data and the 1995 and 1999 data should be made with caution due to changes in the questionnaire. See appendix B for details. "At school" means in theschool building, on the school grounds, or on a school bus. Population sizes are 21,554,000 students ages 12 through 19 in 1989, 23,601,000 students ages 12 through 18 in 1995, and 24,614,000students ages 12 through 18 in 1999.
SOURCE: U.S. Department of Justice, Bureau of Justice Statistics, School Crime Supplement to the National Crime Victimization Survey, January-June 1989,1995, and 1999.
Supplemental Tables

Table 14.1.—Percentage of students ages 12 through 18 who reported that they avoided one or more places in school during the previous 6months, by selected student characteristics: 1989,1995, and 1999
Student characteristics 1989* 1995 1999
Total 5.1 8.7 4.6
Gender
Male
Female
Race/ethnicity
White, non-Hispanic
Black, non-Hispanic
Hispanic
Other, non-Hispanic
Grade
6th
7th
8th
9th
10th
11th
12th
Urbanicity
Urban
Suburban
Rural
ControlPublicPrivate
5.15.1
4.56.86.56.3
6.97.74.76.04.33.43.3
6.94.15.1
5.41.5
8.88.5
7.112.1
12.9
11.1
11.6
11.8
8.89.57.86.94.1
11.7
7.97.0
9.32.2
4.64.6
3.86.76.25.4
5.96.15.55.34.72.52.4
5.84.73.0
5.01.6
*Students ages 12 through 19.
NOTE: Comparisons between the 1989 data and the 1995 and 1999 data should be made with caution due to changes in the questionnaire. See appendix B for details. Places include the entranceinto the school, any hallways or stairs in the school, parts of the school cafeteria, any school restrooms, and other places inside the school building. Population sizes are 21,554,000 students ages 12through 19 in 1989, 23,601,000 students ages 12 through 18 in 1995, and 24,614,000 students ages 12 through 18 in 1999.
SOURCE: U.S. Department of Justice, Bureau of Justice Statistics, School Crime Supplement to the National Crime Victimization Survey, January-June 1989,1995, and 1999.
Supplemental Tables

Table 15.1.—Percentage of students ages 12 through 18 who reported being targets of hate-related words or who saw hate-related graffiti atschool during the previous 6 months, by selected student characteristics: 1999
Student characteristics Hate-related words Hate-related graffiti
Total
Gender
Male
Female
Race/ethnicity
White, non-Hispanic
Black, non-Hispanic
Hispanic
Other, non-Hispanic
Grade
6th
7th
8th
9th
10th
11th
12th
Urbanicity
Urban
Suburban
Rural
Control
Public
Private
13.2
12.3
14.3
12.6
16.5
12.1
15.5
13.0
15.7
16.0
13.2
11.8
10.5
11.7
14.0
13.3
12.2
13.8
8.1
36.3
33.838.9
36.4
37.6
35.6
32.2
30.334.935.639.238.937.035.6
37.0
37.3
32.7
38.0
20.7
NOTE: "At school" means in the school building, on the school grounds, or on a school bus. Population size is 24,614,000 students ages 12 through 18 in 1999.
SOURCE: U.S. Department of Justice, Bureau of Justice Statistics, School Crime Supplement to the National Crime Victimization Survey, January-June 1999.
Supplemental Tables

Table 16.1.—Percentage of students ages 12 through 18 who reported that street gangs were present at school during the previous 6 months,by selected student characteristics: 1989,1995, and 1999
Student characteristics 1989* 1995 1999
Total 15.3 28.5 17.3
GenderMaleFemale
Race/ethnicityWhite, non-HispanicBlack, non-HispanicHispanicOther, non-Hispanic
Grade6th7th8th9th10th11th12th
UrbanicityUrbanSuburbanRural
ControlPublicPrivate
15.814.8
11.719.831.625.4
10.316.613.619.616.015.314.2
24.814.07.8
16.44.4
29.127.9
23.135.250.231.6
15.726.528.832.433.630.327.3
40.726.420.1
30.76.9
17.517.1
13.124.728.317.9
9.212.012.922.722.119.620.0
25.115.811.1
18.64.4
*Students ages 12 through 19.
NOTE: Comparisons between the 1989 data and the 1995 and 1999 data should be made with caution due to changes in the questionnaire. See appendix B for details. This indicator is based on anitem from earlier in the SCS questionnaire, before "at school" was defined for the respondent. Population sizes are 21,554,000 students ages 12 through 19 in 1989, 23,601,000 students ages 12through 18 in 1995, and 24,614,000 students ages 12 through 18 in 1999.
SOURCE: U.S. Department of Justice, Bureau of Justice Statistics, School Crime Supplement to the National Crime Victimization Survey, January-June 1989,1995, and 1999.
Supplemental Tables

Table 17.1.—Percentage and number of public schools that reported that 1 or more of 17 discipline issues* was a serious problem in their school,by urbanicity and selected school characteristics: 1996-97
Percent NumberSchool characteristics
Total
Instructional levelElementary schoolMiddle schoolHigh school
RegionNortheastSoutheastCentralWest
School sizeLess than 300300-9991,000 or more
Minority enrollmentLess than 5 percent5-19 percent20-49 percent50 percent or more
Free/reduced-price lunch eligibilityLess than 20 percent21-34 percent35-49 percent50-74 percent75 percent or more
Total
16.0
8.418.436.9
13.218.413.618.3
9.515.437.6
10.317.317.021.7
13.115.619.016.017.5
City
18.6
11.723.847.3
22.518.712.221.2
10.015.437.4
5.515.217.521.8
15.722.928.514.017.6
Urban fringe
14.1
6.615.246.1
9.515.316.216.3
11.838.3
7.116.512.818.9
11.817.01.9
25.413.8
Town
15.7
6.218.537.9
13.820.115.013.7
8.016.337.2
13.821.213.016.4
17.415.423.19.3
14.4
Rural
15.7
9.116.628.0
8.818.511.921.1
12.019.634.7
9.415.326.233.1
9.011.421.017.823.8
Total
12,400
4,1002,6005,800
2003,1003,1004,300
1,9007,7002,800
2,5003,0003,0003,800
2,4002,7002,5002,6002,200
City
3,300
1,500700
1,200
700,00600
1,400
2002,1001,100
500900
1,900
400600600600
1,100
Urban fringe
2,700
800500
1,300
500,00800900
1,6001,000
3001,000
700700
800700
800300
Town
3,100
700800
1,600
6001,000
800700
4002,200
500
1,1001,000
500500
800800800400300
Rural
3,300
1,100500
1,700
200900900
1,200
1,4001,800
100
1,100500
1,000700
400600
1,000800500
NOTE: "At school" was not defined for the questionnaire respondent. Population size is 78,000 public schools. Because of rounding or missing data, detail may not add to totals. Numbers arerounded to the nearest 100.
SOURCE: U.S. Department of Education, National Center for Education Statistics, Fast Response Survey System, "Principal/School Disciplinarian Survey on School Violence," FRSS 63,1997.
Supplemental Tables

Table 18.1.—Percentage of students in grades 9 through 12 who reported using alcohol in the last 30 days, by selected student characteristics:1993,1995, and 1997
Student characteristics 1993
Anywhere
1995* 1997* 1993
On school property
1995* 1997*
Total 48.0 51.6 50.8 5.2 6.3 5.6
Gender
Male
Female
Race/ethnicity
White, non-Hispanic
Black, non-Hispanic
HispanicAsian/Pacific IslanderOther, non-Hispanic
Grade9th10th11th12th
50.145.9
49.942.550.826.443.6
40.544.049.756.4
53.249.9
54.142.054.729.654.7
45.649.553.756.45
53.347.8
54.036.953.923.053.2
44.247.253.257.3
6.24.2
4.66.96.83.09.1
5.24.75.25.5
7.25.3
5.67.69.73.77.2
7.55.95.76.2
7.23.6
4.85.68.22.38.2
5.94.66.05.9
*The response rate for this survey was less than 70 percent and a full nonresponse bias analysis has not been done to date.
NOTE: "On school property" was not defined for survey respondents.
SOURCE: U.S. Department of Health and Human Services, Public Health Service, Centers for Disease Control and Prevention, National Center for Health Statistics, National Health InterviewSurvey—Youth Risk Behavior Survey, 1993,1995, and 1997.
Supplemental Tables

Table 19.1.—Percentage of students in grades 9 through 12 who reported using marijuana in the last 30 days, by selected student characteristics:1993,1995, and 1997
Student characteristics 1993
Anywhere
1995* 1997* 1993
On school property
1995* 1997*
Total 17.7 25.3 26.2 5.6 8.8 7.0
Gender
Male
Female
Race/ethnicity
White, non-Hispanic
Black, non-Hispanic
Hispanic
Asian/Pacific Islander
Other, non-Hispanic
Grade
9th10th
11th12th
20.6
14.6
17.3
18.6
19.4
8.825.3
13.2
16.5
18.422.0
28.4
22.0
24.5
28.6
27.8
12.8
28.5
20.9
25.5
27.626.2
30.2
21.4
25.0
28.2
28.6
11.0
32.4
23.6
25.0
29.326.6
7.83.3
5.07.37.53.78.9
4.46.56.55.1
11.9
5.5
7.112.3
12.9
7.713.1
8.79.88.68.0
9.04.6
5.89.1
10.4
2.59.5
8.16.47.95.7
*The response rate for this survey was less than 70 percent and a full nonresponse bias analysis has not been done to date.
NOTE: "On school property" was not defined for survey respondents.
SOURCE: U.S. Department of Health and Human Services, Public Health Service, Centers for Disease Control and Prevention, National Center for Health Statistics, National Health InterviewSurvey—Youth Risk Behavior Survey, 1993,1995, and 1997.
Supplemental Tables

Table 20.1.—Percentage of students in grades 9 through 12 who reported that drugs were made available to them on school property during thelast 12 months, by selected student characteristics: 1993,1995, and 1997
Student characteristics 1993 1995* 1997*
Total 24.0 32.1 31.7
GenderMaleFemale
Race/ethnicityWhite, non-HispanicBlack, non-HispanicHispanic
Asian/Pacific Islander
Other, non-Hispanic
Grade
9th
10th
11th
12th
28.5
19.1
24.1
17.5
34.1
14.7
29.2
21.8
23.7
27.5
23.0
38.8
24.8
31.7
28.5
40.7
26.5
33.4
31.1
35.0
32.8
29.1
37.4
24.7
31.0
25.4
41.1
25.2
35.2
31.4
33.4
33.2
29.0
*The response rate for this survey was less than 70 percent and a full nonresponse bias analysis has not been done to date.
NOTE: "On school property" was not defined for survey respondents.
SOURCE: U.S. Department of Health and Human Services, Public Health Service, Centers for Disease Control and Prevention, National Center for Health Statistics, National Health InterviewSurvey—Youth Risk Behavior Survey, 1993,1995, and 1997.
Supplemental Tables

STANDARD ERROR TABLES
Standard Error Tables

Table S2.1.—Standard errors for table 2.1: Number of nonfatal crimes against students ages 12 through 18 occurring at school or on the way to orfrom school, by type of crime and selected student characteristics: 1992 to 1998
1992 1993 1994
Student characteristics
Total
GenderMaleFemale
Age12-1415-18
Race/ethnicityWhite, non-HispanicBlack, non-HispanicHispanicOther, non-Hispanic
UrbanicityUrbanSuburbanRural
Household incomeLess than $7,500$7,500-14,999$15,000-24,999$25,000-34,999$35,000-49,999$50,000-74,999$75,000 or more
Total
198,370
144,430111,330
135,560121,170
164,19057,21045,58026,190
86,020133,300
75,950
41,07048,70055,07060,64078,94062,17052,490
Theft
153,120
107,63091,740
100,08099,660
127,99042,28035,36024,010
66,450104,970
58,570
28,83035,91036,22048,61065,88054,39041,320
Violent
100,850
79,88051,360
76,43055,740
83,03034,27025,710
9,3502
46,58067,15041,650
26,81029,60037,82031,44036,36025,27028,530
Seriousviolent1
40,700
34,51018,780
33,31020,810
30,63020,53011,9202
24,05026,63013,92062
12,2802
14,6702
17,4805,4802
14,7402
7,9702
13,1102
Total
145,100
114,44018,780
112,96097,400
135,35047,52037,35017,940
69,720109,610
62,430
31,82037,65017,48056,67056,01054,43041,750
Theft
120,580
82,46074,610
81,11076,030
101,09035,07027,33014,860
50,18084,20046,010
19,53028,21032,73045,48042,45043,17035,070
Violent
78,580
66,44049,550
65,96050,130
73,57027,00022,930
9,260
41,96057,61036,640
23,47022,34029,55028,84031,74028,48019,540
Seriousviolent1
40 ,70
26,23021,540
33,310018,690
88,49027,0009,0003,9302
18,99022,36015,660
9,52010,96055,07010,99014,09012,010
7,9202
Total
145,100
100,21087,190
10112,9608,690
116,16027,00038,50017,370
020,32053,01054,610
23,72032,50041,70045,41052,95049,76038,870
Theft
145,10
73,11067,350
024,91018,690
88,490027,00027,08013,690
43,64053,01044,040
15,97024,94031,93032,00040,63037,96032,060
Violent
78,580
57,22018,780
59,20043,440
61,21027,00024,6209,880
39,10053,01027,320
16,33018,62023,54028,67029,25027,91019,010
Seriousviolent1
32,520
24,82018,780
24,91018,690
23,33012,76013,900
5,5702
20,32021,3708,580
10,32023102
10,8202,190
21,6302,970
2,0802
NOTE: See footnotes at end of table.
Standard Error Tables

Table S2.1.—Standard errors for table 2.1: Number of nonfatal crimes against students ages 12 through 18 occurring at school or on the way to orfrom school, by type of crime and selected student characteristics: 1992 to 1998—Continued
1995 1996 1997
Student characteristics
Total
GenderMaleFemale
Age12-1415-18
Race/ethnicityWhite, non-HispanicBlack, non-HispanicHispanicOther, non-Hispanic
UrbanicityUrbanSuburbanRural
Household incomeLess than $7,500$7,500-14,999$15,000-24,999$25,000-34,999$35,000-49,999$50,000-74,999$75,000 or more
Total
137,010
96,80080,210
98,33078,500
111,78039,41035,40017,830
59,07094,13049,870
20,40030,29039,11043,83050,24047,65041,730
Theft
102,220
71,36061,890
70,63062,680
84,24028,68026,30015,500
44,26070,70038,530
11,90022,20029,71032,84038,41037,63033,600
Violent
73,970
54,55042,460
57,48038,910
60,17024,11021,1908,020
33,64051,59027,350
15,77018,68022,47025,53028,05025,18021,430
Seriousviolent1
26,320
20,68014,670
20,77014,570
18,89011,9709,8404,7702
16,41016,2409,390
8,4609,6500,0402
10,5409,5609,4905,8202
Total
135,320
95,13080,010
93,65081,630
108,9403,43037,61019,190
62,80051,59046,730
15,77029,74040,04040,76048,99048,75040,500
Theft
2073,970
68,17065,630
20,77065,020
83,2403,43026,33015,360
46,36019,08046,730
1 2 , 022,03028,880008,73037,63039,11034,290
Violent
71,460
068,17037,320
53,37040,680
57,53039,34010,98010,590
36,5505068,98021,450
08,46018,14024,83024,1002 , 7 2 024,99018,480
Seriousviolent1
27,750
21,93015,420
17,97017,580
19,01011,59010,980
5,7302
17,86019,080
7,7702
2,14032
8,50012,540
9,73011,070
9,5706,6202
Total
102,390
89,92039,470
85,9408,910
102,1304 3 033,33019,580
17,73086,96044,120
17,53031,70039,1904008,73038,41025,18044,580
Theft
93,670
64,16015,420
61,18063,220
75,95030,88024,68017,210
45,12063,68035,980
12,01023,14029,36031,200012,72037,86035,320
Violent
71,460
55,15039,470
020,30042,090
58,74010,46020,560
8,5802
35,48051,59022,560
12,14019,78023,21023,4002,72024,49023,710
Seriousviolent1
27,750
22,07015,420
20,30017,580
21,13010,4602
10,9804,0502
17,73019,080
5,8602
2,6802
7,2302
10,2608,730
12,72011,050
21002
NOTE: See footnotes at end of table.
Standard Error Tables

Table S2.1.—Standard errors for table 2.1: Number of nonfatal crimes against students ages 12 through 18 occurring at school or on the way to orfrom school, by type of crime and selected student characteristics: 1992 to 1998—Continued
1998
Student characteristics Total Theft ViolentSerious
violent1
Total
GenderMaleFemale
Age12-1415-18
Race/ethnicityWhite, non-HispanicBlack, non-HispanicHispanicOther, non-Hispanic
UrbanicityUrbanSuburbanRural
Household incomeLess than $7,500$7,500-14,999$15,000-24,999$25,000-34,999$35,000-49,999$50,000-74,999$75,000 or more
149,930 103,930
102,78086,560
100,10089,430
115,07048,03037,92019,930
70,950
93,090
52,210
23,10032,41045,74040,49041,21050,13047,320
68,31064,680
65,87067,140
79,76034,22027,68015,470
50,520
65,960
35,890
15,76018,83030,43026,53032,13037,30037,070
85,310
63,240
45,950
62,380
46,960
66,74028,74022,38011,240
41,21053,27032,470
15,35024,11029,78026,99021,69028,09024,360
33,210
23,85020,230
25,55018,240
25,07012,79011,9603,7702
19,21018,38014,720
8,1502
9,9402
10,80013,3709,350
12,3308,7002
f No cases are reported in this cell, although the event defined by this cell could have been reported by some students with these characteristics had a different sample been drawn.1Serious violent crimes are also included in violent crimes.
Estimate based on fewer than 10 cases.
NOTE: Serious violent crimes include rape, sexual assault, robbery, and aggravated assault. Violent crimes include serious violent crimes and simple assault. Total crimes include violent crimes andtheft. "At school" includes inside the school building, on school property, or on the way to or from school. Standard errors are rounded to the nearest 10.
SOURCE: U.S. Department of Justice, Bureau of Justice Statistics, National Crime Victimization Survey, 1992 to 1998.
Standard Error Tables
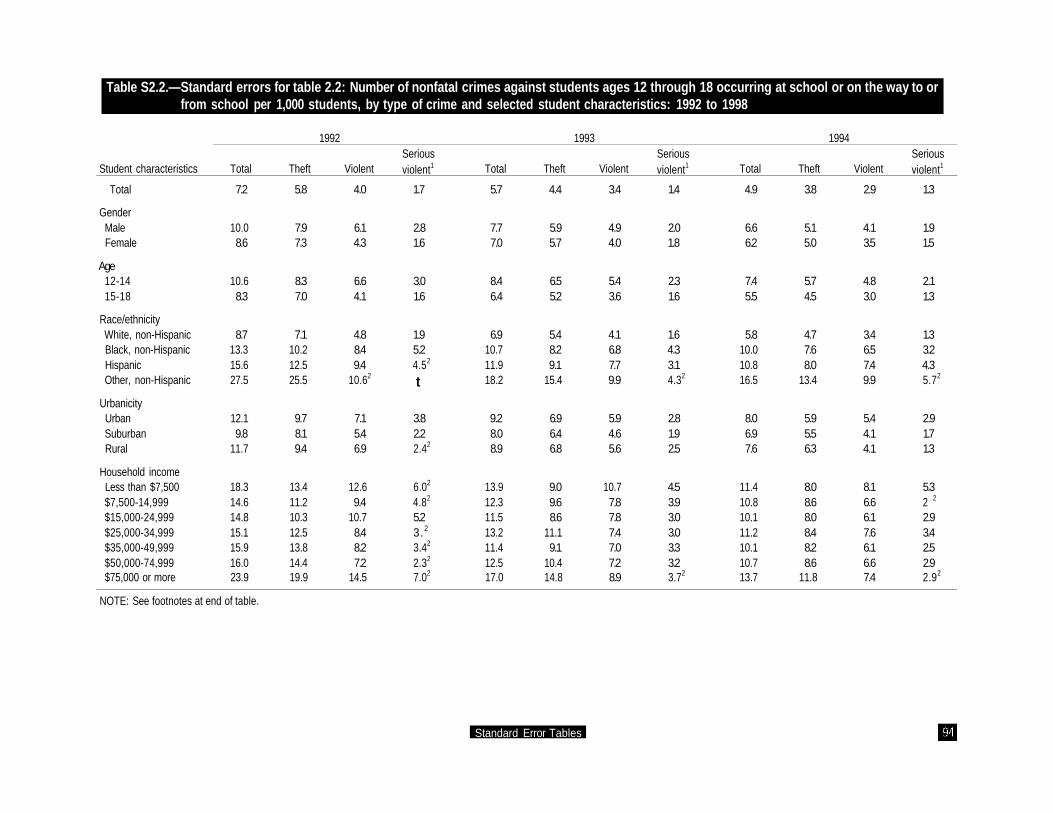
Table S2.2.—Standard errors for table 2.2: Number of nonfatal crimes against students ages 12 through 18 occurring at school or on the way to orfrom school per 1,000 students, by type of crime and selected student characteristics: 1992 to 1998
1992 1993 1994
Student characteristics
Total
GenderMaleFemale
Age12-1415-18
Race/ethnicityWhite, non-HispanicBlack, non-HispanicHispanicOther, non-Hispanic
UrbanicityUrbanSuburbanRural
Household incomeLess than $7,500$7,500-14,999$15,000-24,999$25,000-34,999$35,000-49,999$50,000-74,999$75,000 or more
Total
7.2
10.08.6
10.68.3
8.713.315.627.5
12.19.8
11.7
18.314.614.815.115.916.023.9
Theft
5.8
7.97.3
8.37.0
7.110.212.525.5
9.78.19.4
13.411.210.312.513.814.419.9
Violent
4.0
6.14.3
6.64.1
4.88.49.4
10.62
7.15.46.9
12.69.4
10.78.48.27.2
14.5
Seriousviolent1
1.7
2.81.6
3.01.6
1.95.24.52
t
3.82.22.42
6.02
4.82
5.23.2
3.42
2.32
7.02
Total
5.7
7.77.0
8.46.4
6.910.711.918.2
9.28.08.9
13.912.311.513.211.412.517.0
Theft
4.4
5.95.7
6.55.2
5.48.29.1
15.4
6.96.46.8
9.09.68.6
11.19.1
10.414.8
Violent
3.4
4.94.0
5.43.6
4.16.87.79.9
5.94.65.6
10.77.87.87.47.07.28.9
Seriousviolent1
1.4
2.01.8
2.31.6
1.64.33.14.32
2.81.92.5
4.53.93.03.03.33.23.72
Total
4.9
6.66.2
7.45.5
5.810.010.816.5
8.06.97.6
11.410.810.111.210.110.713.7
Theft
3.8
5.15.0
5.74.5
4.77.68.0
13.4
5.95.56.3
8.08.68.08.48.28.6
11.8
Violent
2.9
4.13.5
4.83.0
3.46.57.49.9
5.44.14.1
8.16.66.17.66.16.67.4
Seriousviolent1
1.3
1.91.5
2.11.3
1.33.24.35.72
2.91.71.3
5.32 2
2.93.42.52.92.92
NOTE: See footnotes at end of table.
Standard Error Tables

Table S2.2.—Standard errors for table 2.2: Number of nonfatal crimes against students ages 12 through 18 occurring at school or on the way to orfrom school per 1,000 students, by type of crime and selected student characteristics: 1992 to 1998—Continued
1995 1996 1997
Student characteristics
Total
GenderMaleFemale
Age12-1415-18
Race/ethnicityWhite, non-HispanicBlack, non-HispanicHispanicOther, non-Hispanic
UrbanicityUrbanSuburbanRural
Household incomeLess than $7,500$7,500-14,999$15,000-24,999$25,000-34,999$35,000-49,999$50,000-74,999$75,000 or more
Total
4.6
6.35.7
7.15.0
5.68.89.7
15.4
7.46.57.3
10.99.9
10.310.99.3
10.112.6
Theft
3.6
4.94.6
5.54.1
4.46.77.5
13.6
5.85.15.8
6.67.58.28.67.48.3
10.6
Violent
2.7
3.93.2
4.62.7
3.35.76.17.3
4.53.94.2
8.76.46.46.95.65.87.1
Seriousviolent1
1.0
1.51.2
1.81.0
1.12.92.94.42
2.31.31.5
4.83.40.2
3.02.02.32.02
Total
4.6
6.25.6
7.05.1
5.59.19.7
16.4
7.76.17.3
12.39.9
10.210.89.5
10.011.5
Theft
3.6
4.74.7
5.44.2
4.47.67.1
13.5
5.94.86.3
9.97.67.68.47.68.3
10.0
Violent
2.6
3.92.8
4.32.7
3.14.96.69.5
4.83.63.6
7.36.36.76.85.75.55.7
Seriousviolent1
1.0
1.61.2
1.51.3
1.12.93.55.32
2.41.31.32
3.82
3.03.52.92.42.22 2
Total
4.3
6.05.4
6.65.0
5.39.08.5
15.7
7.36.07.1
12.210.710.410.79.29.3
10.9
Theft
3.3
4.44.4
4.94.0
4.17.16.5
13.9
5.64.55.9
8.68.18.18.56.67.79.0
Violent
2.6
3.83.0
4.32.8
3.25.55.47.22
4.53.73.8
2.77.06.56.56.35.26.3
Seriousviolent1
1.0
1.61.2
1.71.2
1.22.52
3.03.52
2.31.41.02
2.72
2.72
3.02.52.82.42.52
NOTE: See footnotes at end of table.
Standard Error Tables

Table S2.2.—Standard errors for table 2.2: Number of nonfatal crimes against students ages 12 through 18 occurring at school or on the way to orfrom school per 1,000 students, by type of crime and selected student characteristics: 1992 to 1998—Continued
1998
Student characteristics
Total
GenderMaleFemale
Age12-1415-18
Race/ethnicityWhite, non-HispanicBlack, non-HispanicHispanicOther, non-Hispanic
UrbanicityUrbanSuburbanRural
Household incomeLess than $7,500$7,500-14,999$15,000-24,999$25,000-34,999$35,000-49,999$50,000-74,999$75,000 or more
Total
4.8
6.45.7
6.15.9
5.69.79.0
15.4
8.36.07.0
16.813.311.410.79.38.79.2
Theft
3.3
4.44.0
4.24.1
3.96.95.8
12.3
5.74.25.1
10.69.07.87.27.25.96.9
Violent
3.1
4.33.6
3.84.0
3.76.46.59.0
5.83.94.4
13.010.08.07.75.75.95.6
Seriousviolent1
1.7
2.51.9
1.92.4
1.94.34.45.52
3.62.12.2
8.52
5.22
5.15.23.72
3.33.12
f No cases are reported in this cell, although the event defined by this cell could have been reported by some students with these characteristics had a different sample been drawn.1Serious violent crimes are also included in violent crimes.
Estimate based on fewer than 10 cases.
NOTE: Serious violent crimes include rape, sexual assault, robbery, and aggravated assault. Violent crimes include serious violent crimes and simple assault. Total crimes include violent crimes andtheft. "At school" includes inside the school building, on school property, or on the way to or from school. Population sizes are 23,740,295 students ages 12 through 18 in 1992; 24,557,779 in 1993;25,326,989 in 1994; 25,715,220 in 1995; 26,151,364 in 1996; 26,548,142 in 1997; and 26,806,268 in 1998.
SOURCE: U.S. Department of Justice, Bureau of Justice Statistics, National Crime Victimization Survey, 1992 to 1998.
Standard Error Tables

Table S2.3.—Standard errors for table 2.3: Number of nonfatal crimes against students ages 12 through 18 occurring away from school, by type ofcrime and selected student characteristics: 1992 to 1998
1992 1993 1994
Student characteristics
Total
GenderMaleFemale
Age12-1415-18
Race/ethnicityWhite, non-HispanicBlack, non-HispanicHispanicOther, non-Hispanic
UrbanicityUrbanSuburbanRural
Household incomeLess than $7,500$7,500-14,999$15,000-24,999$25,000-34,999$35,000-49,999$50,000-74,999$75,000 or more
Total
193,820
140,430109,740
106,380143,320
154,56058,55052,58028,790
99,540126,290
61,700
52,27060,76067,81061,48059,91051,80040,540
Theft
123,910
92,75068,810
73,97088,270
101,04038,95032,42018,600
63,68083,39039,890
35,52036,00040,81038,00040,44038,42031,050
Violent
127,290
90,88075,630
66,14098,850
100,51039,64038,21020,730
67,78082,26042,770
34,87045,12049,53044,24039,93031,08023,550
Seriousviolent1
78,020
56,45047,110
41,11061,410
57,77029,57026,40015,2002
42,60050,71027,800
21,10032,94030,10027,46021,85018,67013,9002
Total
152,470
109,14087,720
66,140114,950
119,49052,30040,17018,350
81,30091,66055,390
4,59046,81050,53047,29049,78040,15029,510
Theft
98,100
71,19056,990
55,26072,680
76,56035,17020,45014,490
51,86060,88037,0
26,24032,39032,07018,86031,82029,13021,190
Violent
89,860
71,48058,420
51,41077,330
7,2401034,72020,45010,470
55,32059,55036,820
21,73032,94035,460018,86034,75024,82018,850
Seriousviolent1
64,490
58,52031,880
66,14050,810
, 7 2 035,17020,450
7,8202
32,490091,66021,930
19,65022,50028,0028,90023,21017,41011,230
Total
134,190
43,2607,110
6,9705072,680
6079,2304 1 038,21016,820
67,51085,11045,560
24,59045,12038,36028,900018,74042031,030,850
Theft
89,860
58,52050,640
45,64061,870
65,72026,87020,45011,280
41,61052,770018,360
24,59022,72023,33028,90027,11017,41021,610
Violent
89,860
65,98050,640
26,9707,000
69,99022,69026,98011,790
47,20036,75018,360
24,59026,15028,00018,86018,74017,41020,040
Seriousviolent1
56,760
43,26031,880
26,97047,000
41,25022,69020,4508,050
32,49036,75018,360
17,66018,36017,85018,86018,74017,41012,770
NOTE: See footnotes at end of table.
Standard Error Tables

Table S2.3.—Standard errors for table 2.3: Number of nonfatal crimes against students ages 12 through 18 occurring away from school, by type ofcrime and selected student characteristics: 1992 to 1998—Continued
1995 1996 1997
Student characteristics
Total
GenderMaleFemale
Age12-1415-18
Race/ethnicityWhite, non-HispanicBlack, non-HispanicHispanicOther, non-Hispanic
UrbanicityUrbanSuburbanRural
Household incomeLess than $7,500$7,500-14,999$15,000-24,999$25,000-34,999$35,000-49,999$50,000-74,999$75,000 or more
Total
126,520
90,39073,320
64,90097,480
98,39042,54034,08018,120
65,54079,92043,750
32,90038,31041,52037,45041,26039,04030,540
Theft
83,180
58,79050,240
44,65063,580
66,24028,39020,62013,310
42,83054,45029,190
22,02024,18030,55025,04027,39026,49020,300
Violent
81,020
59,62046,360
41,16063,840
62,30028,61025,18011,470
43,86050,60029,400
22,40027,260941,52025,34027,94025,95021,010
Seriousviolent1
46,650
35,46026,450
23,23037,930
35,38016,69016,430
7,7302
26,81029,81016,110
13,71016,59015,53014,51027,94016,52010,030
Total
132,260
97,99072,590
68,640101,250
102,43045,07016,43018,770
66,05084,28047,740
017,18039,79042,27037,29042,13038,24034,190
Theft
89,160
66,50049,790
48,92067,210
69,44031,54024,94014,740
43,64058,03018,610
17,18039,79027,29027,08029,45029,10026,620
Violent
94,300
03,69046,000
41,67001,250
35,38029,93024,94010,740
26,81061,16034,360
22,10026,9002 ,27023,02027,06016,52018,260
Seriousviolent1
52,210
35,46055,860
26,60044,090
38,09022,68017,070
8,3402
3 , 6 4 032,32033,370
17,93022,61018,57014,30016,98014,780
9,110
Total
147,650
103,69084,290
72,930113,410
113,86028,610018,38015,370
75,05032,91048,430
26,35043,99016,140028,01027,94025,95040,430
Theft
94,300
67,78054,470
6023,23071,320
73,23031,54027,17011,100
48,91061,160018,610
18,74022,61028,59028,01035,61028,11018,260
Violent
94,300
66,72055,860
45,67075,180
73,840019,97028,85026,270
49,82059,22033,370
10,17033,47026,17029,29016,98030,99026,620
Seriousviolent1
54,410
39,02033,330
27,08044,090
42,29019,97018,380
6,2702
33,06032,91018,610
10,17022,61016,14016,97016,98017,86016,740
NOTE: See footnotes at end of table.
Standard Error Tables

Table S2.3.—Standard errors for table 2.3: Number of nonfatal crimes against students ages 12 through 18 occurring away from school, by type ofcrime and selected student characteristics: 1992 to 1998—Continued
1998
Student characteristics Total Theft ViolentSerious
violent1
Total 143,160 89,240 92,110 53,370
GenderMale 100,920 63,870 65,420 41,450Female 79,870 50,530 52,580 27,620
Age12-14 65,420 45,880 39,010 22,65015-18 112,950 67,820 76,230 45,060
Race/ethnicityWhite, non-Hispanic 109,800 69,270 71,000 39,070Black, non-Hispanic 43,440 28,950 28,330 19,970Hispanic 37,640 21,680 27,950 18,790Other, non-Hispanic 19,840 15,540 11,000 6,9802
UrbanicityUrban 71,190 43,110 49,070 31,340Suburban 93,720 59,630 60,740 35,000Rural 39,100 28,060 23,560 12,3102
Household incomeLess than $7,500 23,220 13,280 17,740 11,420$7,500-14,999 40,430 25,540 27,870 14,030$15,000-24,999 42,470 27,260 28,770 19,650$25,000-34,999 41,160 25,870 28,470 20,100$35,000-49,999 44,300 32,010 26,200 17,440$50,000-74,999 39,790 24,150 28,370 15,810$75,000 or more 38,060 26,860 23,470 13,550
Serious violent crimes are also included in violent crimes.
Estimate based on fewer than 10 cases.
NOTE: Serious violent crimes include rape, sexual assault, robbery, and aggravated assault. Violent crimes include serious violent crimes and simple assault. Total crimes include violent crimes andtheft. Standard errors are rounded to the nearest 10.
SOURCE: U.S. Department of Justice, Bureau of Justice Statistics, National Crime Victimization Survey, 1992 to 1998.
Standard Error Tables

Table S2.4.—Standard errors for table 2.4: Number of nonfatal crimes against students ages 12 through 18 occurring away from school per 1,000students, by type of crime and selected student characteristics: 1992 to 1998
1992 1993 1994
Student characteristics
Total
Gender
Male
Female
Age12-14
15-18
Race/ethnicity
White, non-Hispanic
Black, non-Hispanic
Hispanic
Other, non-Hispanic
Urbanicity
Urban
Suburban
Rural
Household income
Less than $7,500
$7,500-14,999
$15,000-24,999
$25,000-34,999
$35,000-49,999
$50,000-74,999$75,000 or more
Total
7.1
9.88.5
8.89.5
8.313.5
17.6
29.7
13.5
9.49.8
22.1
17.5
17.5
15.2
12.7
13.819.6
Theft
4.8
7.05.6
6.46.3
5.89.5
11.6
20.4
9.46.66.6
16.2
11.2
11.4
10.1
9.010.615.6
Violent
4.9
6.86.1
5.87.0
5.79.6
13.4
22.5
9.96.57.0
15.9
13.7
13.6
11.5
8.98.8
12.2
Serious
violent1
3.2
4.44.0
3.74.5
3.47.39.6
16.92
6.54.24.7
10.1
10.3
8.77.45.05.47.42
Total
5.4
7.46.5
6.57.3
6.211.5
12.6
18.5
10.3
6.98.0
17.5
14.6
12.3
11.4
10.4
9.812.8
Theft
3.7
5.24.5
4.65.0
4.38.38.9
15.0
7.24.95.6
11.8
10.8
8.48.27.07.39.6
Violent
3.7
5.24.6
4.35.3
4.48.29.0
11.1
7.64.85.6
13.6
10.2
9.28.07.66.38.6
Serious
violent1
2.5
3.73.0
2.93.6
2.76.67.48.42
5.53.23.4
9.17.86.45.65.34.35.3
Total
4.5
6.35.5
5.46.2
5.39.5
10.7
16.1
8.56.16.4
15.4
11.9
9.410.4
8.49.2
11.4
Theft
3.0
4.13.8
3.74.1
3.66.47.3
11.2
5.64.14.6
10.5
7.96.07.15.76.68.3
Violent
3.2
4.63.8
3.74.6
3.87.08.0
11.7
6.34.54.3
11.7
9.07.17.66.06.47.8
Serious
violent1
2.1
3.22.5
2.33.2
2.35.56.28.2
4.52.92.8
8.76.54.75.24.04.25.1
NOTE: See footnotes at end of table.
Standard Error Tables

Table S2.4.—Standard errors for table 2.4: Number of nonfatal crimes against students ages 12 through 18 occurring away from school per 1,000students, by type of crime and selected student characteristics: 1992 to 1998—Continued
1995 1996 1997
Student characteristics
Total
GenderMaleFemale
Age12-1415-18
Race/ethnicityWhite, non-HispanicBlack, non-HispanicHispanicOther, non-Hispanic
UrbanicityUrbanSuburbanRural
Household incomeLess than $7,500$7,500-14,999$15,000-24,999$25,000-34,999$35,000-49,999$50,000-74,999$75,000 or more
Total
4.3
6.05.3
5.16.0
5.19.49.4
15.6
8.15.76.5
16.212.010.89.67.98.69.8
Theft
3.0
4.13.8
3.64.2
3.66.66.0
11.8
5.64.14.5
11.78.18.46.75.56.16.8
Violent
2.9
4.23.5
3.44.2
3.46.77.2
10.3
5.83.84.5
11.99.07.06.85.66.07.0
Seriousviolent1
1.8
2.62.1
2.02.6
2.04.04.87.1 2
3.72.32.6
7.65.74.54.03.53.93.5
Total
4.5
6.35.2
5.46.1
5.210.29.3
16.1
8.05.77.4
17.312.710.610.08.48.19.9
Theft
3.2
4.63.7
4.04.3
3.77.26.7
13.0
5.64.15.6
12.29.17.37.66.16.48.2
Violent
2.9
4.33.4
3.44.2
3.57.16.39.7
5.73.84.8
12.99.07.86.55.674,95.6
Seriousviolent1
1.9
2.82.3
2.22.8
2.15.54.77.62
4.12.43.0
10.77.05.14.23.13.42.9
Total
4.7
6.45.8
5.66.4
5.09.19.91.1
8.56.07.6
17.414.010.711.19.68.8
10.1
Theft
3.2
4.53.9
4.04.4
3.97.57.09.2
6.04.35.2
13.08.87.97.77.45.97.3
Violent
3.2
4.54.0
3.74.6
3.97.27.42.5
6.14.15.5
12.011.37.38.06.06.47.0
Seriousviolent1
2.0
2.72.5
2.32.8
2.34.74.95.32
4.22.43.1
7.38.04.64.83.73.84.5
NOTE: See footnotes at end of table.
Standard Error Tables

Table S2.4.—Standard errors for table 2.4: Number of nonfatal crimes against students ages 12 through 18 occurring away from school per 1,000students, by type of crime and selected student characteristics: 1992 to 1998—Continued
1998
Student characteristics
Total
Gender
Male
Female
Age12-14
15-18
Race/ethnicity
White, non-Hispanic
Black, non-Hispanic
Hispanic
Other, non-Hispanic
Urbanicity
Urban
Suburban
Rural
Household income
Less than $7,500
$7,500-14,999
$15,000-24,999
$25,000-34,999
$35,000-49,999
$50,000-74,999$75,000 or more
Total
4.8
6.45.7
6.15.9
5.69.79.0
15.4
8.36.07.0
16.8
13.3
11.4
10.7
9.38.79.2
Theft
3.3
4.44.0
4.24.1
3.96.95.8
12.3
5.74.25.1
10.6
9.07.87.27.25.96.9
Violent
3.1
4.33.6
3.84.0
3.76.46.59.0
5.83.94.4
13.0
10.0
8.07.75.75.95.6
Serious
violent1
1.7
2.51.9
1.92.4
1.94.34.45.52
3.62.12.22
8.55.25.15.23.73.33.1
1Serious violent crimes are also included in violent crimes.
Estimate based on fewer than 10 cases.
NOTE: Serious violent crimes include rape, sexual assault, robbery, and aggravated assault. Violent crimes include serious violent crimes and simple assault. Total crimes include violent crimes andtheft. Population sizes are 23,740,295 students ages 12 through 18 in 1992; 24,557,779 in 1993; 25,326,989 in 1994; 25,715,220 in 1995; 26,151,364 in 1996; 26,548,142 in 1997; and 26,806,268 in1998.SOURCE: U.S. Department of Justice, Bureau of Justice Statistics, National Crime Victimization Survey, 1992 to 1998.Standard Error Tables

Table S3.1.—Standard errors for table 3.1: Percentage of students ages 12 through 18 who reported criminal victimization at school during theprevious 6 months, by type of victimization and selected student characteristics: 1995 and 1999
1995 1999
Student characteristics
Total
GenderMaleFemale
Race/ethnicityWhite, non-HispanicBlack, non-HispanicHispanicOther, non-Hispanic
Grade6th7th8th9th10th11th12th
UrbanicityUrbanSuburbanRural
ControlPublicPrivate
Total1
0.35
0.460.47
0.371.040.901.54
0.970.810.780.880.760.740.74
0.640.490.79
0.380.90
Theft
0.29
0.380.41
0.320.850.781.40
0.660.710.720.770.720.660.67
0.510.4900.66
0.320.74
Violent2
0.21
0.270.25
0.230.610.430.87
0.730.540.440.2100.360.7400.41
0.6400.4300.31
0.220.45
Serious violent3
0.09
0.140.410
0.090.310.3800.34
0.420.240.230.210.170.160.21
0.240.120.310
0.100.11
Total1
0.35
0.460.46
0.440.850.771.28
1.240.810.840.790.820.880.81
0.690.430.96
0.370.80
Theft
0.32
0.410.43
0.430.770.610.98
0.970.730.810.710.730.670.71
0.590.360.95
0.340.78
Violent2
0.18
0.260.22
0.220.550.380.81
0.760.430.440.470.390.580.31
0.380.260.50
0.200.16
Serious violent3
0.09
0.120.12
0.090.330.22
0.400.270.220.180.230.140.15
0.190.110.18
0.10
NOTE: "At school" includes inside the school building, on school property, or on the way to or from school.
SOURCE: U.S. Department of Justice, Bureau of Justice Statistics, School Crime Supplement to the National Crime Victimization Survey, January-June 1995 and 1999.
Standard Error Tables

Table S4.1.—Standard errors for table 4.1: Percentage of students in grades 9 through 12 who reported being threatened or injured with a weaponon school property during the last 12 months, by selected student characteristics: 1993,1995, and 1997
Student characteristics 1993 1995* 1997*
Total 0.44 0.52 0.45
Gender
Male
Female
Race/ethnicity
White, non-Hispanic
Black, non-Hispanic
Hispanic
Asian/Pacific Islander
Other, non-Hispanic
Grade
9th
10th
11th
12th
0.64
0.40
0.58
0.95
0.83
0.86
1.66
0.920.590.640.62
0.57
0.68
2.24
1.98
2.45
4.55
2.81
0.96
1.03
0.64
0.57
0.71
0.32
1.36
1.69
2.04
2.73
1.55
1.02
1.14
0.70
0.80
*The response rate for this survey was less than 70 percent and a full nonresponse bias analysis has not been done to date.
NOTE: "On school property" was not defined for survey respondents.
SOURCE: U.S. Department of Health and Human Services, Public Health Service, Centers for Disease Control and Prevention, National Center for Health Statistics, National Health InterviewSurvey—Youth Risk Behavior Survey, 1993,1995, and 1997.
Standard Error Tables

Table S5.1.—Standard errors for table 5.1: Percentage of students in grades 9 through 12 who reported having been in a physical fight in the last12 months, by selected student characteristics: 1993,1995, and 1997
Student characteristics 1993
Anywhere
1995* 1997* 1993
On school property
1995* 1997*
Total 0.99 1.14 1.01 0.59 0.79 0.64
Gender
Male
Female
Race/ethnicity
White, non-Hispanic
Black, non-Hispanic
Hispanic
Asian/Pacific Islander
Other, non-Hispanic
Grade
9th10th
11th12th
1.05
1.19
1.13
1.82
1.58
3.15
2.94
1.54
1.45
1.521.56
1.09
1.49
1.06
1.99
2.69
4.25
5.19
2.22
1.49
1.481.71
1.07
1.26
1.29
1.92
1.68
2.01
3.39
1.98
1.491
1.721.36
0.71
0.73
0.68
1.39
1.75
2.10
2.77
1.55
1.07
1.270.66
0.90
1.03
0.62
1.25
1.68
4.37
5.14
1.79
1.57
1.000.73
1.04
0.78
0.84
1.20
1.50
1.78
2.05
1.29
1.67
0.870.73
*The response rate for this survey was less than 70 percent and a full nonresponse bias analysis has not been done to date.
NOTE: "On school property" was not defined for survey respondents.
SOURCE: U.S. Department of Health and Human Services, Public Health Service, Centers for Disease Control and Prevention, National Center for Health Statistics, National Health InterviewSurvey—Youth Risk Behavior Survey, 1993,1995, and 1997.
Standard Error Tables

Table S6.1.—Standard errors for table 6.1: Percentage of students ages 12 through 18 who reported being bullied at school during the previous 6months, by gender and selected student characteristics: 1999
Student characteristics Total Male Female
Total
Race/ethnicity
White, non-Hispanic
Black, non-Hispanic
Hispanic
Other, non-Hispanic
Grade
6th
7th
8th
9th
10th
11th
12th
Urbanicity
Urban
Suburban
Rural
Control
Public
Private
0.27
0.320.740.690.77
1.27
0.76
0.60
0.61
0.45
0.45
0.38
0.520.350.69
0.280.57
0.38
0.45
1.08
0.96
1.21
1.73
1.21
0.83
0.88
0.47
0.65
0.43
0.79
0.48
1.00
0.400.92
0.38
0.500.840.820.98
1.51
1.05
0.96
0.94
0.78
0.68
0.61
0.70
0.51
1.11
0.420.69
NOTE: "At school" means in the school building, on the school grounds, or on a school bus. Population size is 24,614,000 students ages 12 through 18 in 1999.
SOURCE: U.S. Department of Justice, Bureau of Justice Statistics, School Crime Supplement to the National Crime Victimization Survey, January-June 1999.
Standard Error Tables

Table S7.1.—Standard errors for table 7.1: Percentage of students in grades 9 through 12 who reported having their property stolen or deliberatelydamaged on school property during the last 12 months, by selected student characteristics: 1993,1995, and 1997
Student characteristics 1993 1995* 1997*
Total 0.90 1.00 1.32
GenderMaleFemale
Race/ethnicityWhite, non-HispanicBlack, non-HispanicHispanicAsian/Pacific IslanderOther, non-Hispanic
Grade9th10th11th12th
0.990.93
1.121.022.162.822.65
1.291.431.201.29
1.461.01
1.132.041.785.284.30
2.111.681.250.87
1.301.91
1.911.561.661.842.35
1.341.792.501.85
*The response rate for this survey was less than 70 percent and a full nonresponse bias analysis has not been done to date.
NOTE: "On school property" was not defined for survey respondents.
SOURCE: U.S. Department of Health and Human Services, Public Health Service, Centers for Disease Control and Prevention, National Center for Health Statistics, National Health InterviewSurvey—Youth Risk Behavior Survey, 1993,1995, and 1997.
Standard Error Tables
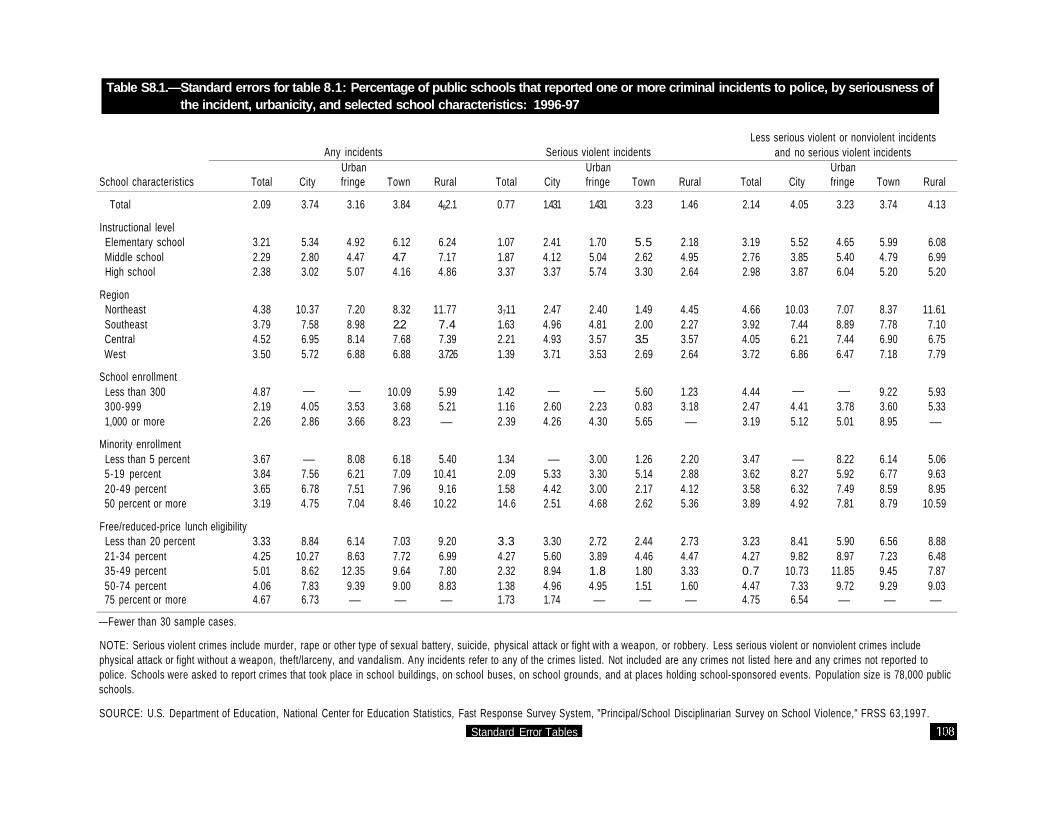
Table S8.1.—Standard errors for table 8.1: Percentage of public schools that reported one or more criminal incidents to police, by seriousness ofthe incident, urbanicity, and selected school characteristics: 1996-97
Any incidents Serious violent incidentsLess serious violent or nonviolent incidents
and no serious violent incidents
School characteristics
Total
Instructional levelElementary schoolMiddle schoolHigh school
RegionNortheastSoutheastCentralWest
School enrollmentLess than 300300-9991,000 or more
Minority enrollmentLess than 5 percent5-19 percent20-49 percent50 percent or more
Free/reduced-price lunchLess than 20 percent21-34 percent35-49 percent50-74 percent75 percent or more
Total
2.09
3.212.292.38
4.383.794.523.50
4.872.192.26
3.673.843.653.19
eligibility3.334.255.014.064.67
City
3.74
5.342.803.02
10.377.586.955.72
—4.052.86
—7.566.784.75
8.8410.27
8.627.836.73
Urbanfringe
3.16
4.924.475.07
7.208.988.146.88
—3.533.66
8.086.217.517.04
6.148.63
12.359.39—
Town
3.84
6.124.74.16
8.322.27.686.88
10.093.688.23
6.187.097.968.46
7.037.729.649.00—
Rural
462.1
6.247.174.86
11.777.47.393.726
5.995.21—
5.4010.41
9.1610.22
9.206.997.808.83—
Total
0.77
1.071.873.37
37111.632.211.39
1.421.162.39
1.342.091.5814.6
3.34.272.321.381.73
City
1.431
2.414.123.37
2.474.964.933.71
—2.604.26
—5.334.422.51
3.305.608.944.961.74
Urbanfringe
1.431
1.705.045.74
2.404.813.573.53
—2.234.30
3.003.303.004.68
2.723.891.84.95—
Town
3.23
5.52.623.30
1.492.003.52.69
5.600.835.65
1.265.142.172.62
2.444.461.801.51—
Rural
1.46
2.184.952.64
4.452.273.572.64
1.233.18—
2.202.884.125.36
2.734.473.331.60—
Total
2.14
3.192.762.98
4.663.924.053.72
4.442.473.19
3.473.623.583.89
3.234.270.74.474.75
City
4.05
5.523.853.87
10.037.446.216.86
—4.415.12
—8.276.324.92
8.419.82
10.737.336.54
Urbanfringe
3.23
4.655.406.04
7.078.897.446.47
—3.785.01
8.225.927.497.81
5.908.97
11.859.72—
Town
3.74
5.994.795.20
8.377.786.907.18
9.223.608.95
6.146.778.598.79
6.567.239.459.29—
Rural
4.13
6.086.995.20
11.617.106.757.79
5.935.33—
5.069.638.95
10.59
8.886.487.879.03—
—Fewer than 30 sample cases.
NOTE: Serious violent crimes include murder, rape or other type of sexual battery, suicide, physical attack or fight with a weapon, or robbery. Less serious violent or nonviolent crimes includephysical attack or fight without a weapon, theft/larceny, and vandalism. Any incidents refer to any of the crimes listed. Not included are any crimes not listed here and any crimes not reported topolice. Schools were asked to report crimes that took place in school buildings, on school buses, on school grounds, and at places holding school-sponsored events. Population size is 78,000 publicschools.
SOURCE: U.S. Department of Education, National Center for Education Statistics, Fast Response Survey System, "Principal/School Disciplinarian Survey on School Violence," FRSS 63,1997.
Standard Error Tables

Table S8.2.—Standard errors for table 8.2: Number of public schools that reported one or more criminal incidents to police, by seriousness of theincident, urbanicity, and selected school characteristics: 1996-97
Less serious violent or nonviolent incidents
School characteristics
Total
Instructional levelElementary schoolMiddle schoolHigh school
RegionNortheastSoutheastCentralWest
School enrollmentLess than 300300-9991,000 or more
Minority enrollmentLess than 5 percent5-19 percent20-49 percent50 percent or more
Free/reduced-price lunchLess than 20 percent21-34 percent35-49 percent50-74 percent75 percent or more
Total
1,680
1,530340420
850770
1,2001,010
1,0801,170
270
940830820880
eligibility730910730990780
City
720
70010090
310410420530
—570200
—380390470
240280340430480
Any incidentsUrbanfringe
720
610190150
480390500510
—550140
360500470340
520510320430—
Town
790
700220240
450480500460
550630140
530400360390
390460350570—
Rural
910
740250330
330420630490
730490—
670370820340
400400t730510—
Total
590
520260310
150260500310
290570160
310370280270
260360340240220
Serious violent incidents
City
360
30013080
70170210240
—35090
—190210190
8013025018090
Urbanfringe
340
21010100
120160420180
—320120
110210160190
180140130150—
Town
280
40120140
60100230150
26012070
1002409070
102306070
—
Rural
310
260120100
90110290150
140290—
26070
160110
11025026070
—
Total
1,710
1,510410510
870800
1,07010460
9801,290
300
920770790930
240840710970740
and no serious violent incidents
City
780
730120100
310380390550
—600220
—350350500
240270260380490
Urbanfringe
650
590190170
480370440480
—550150
360440470330
500500310390—
Town
760
680230270
450450410450
490600150
530340360390
390380350570—
Rural
880
700230350
330410570490
720500—
620350390350
400370460500—
—Fewer than 30 sample cases.
NOTE: Serious violent crimes include murder, rape or other type of sexual battery, suicide, physical attack or fight with a weapon, or robbery. Less serious violent or nonviolent crimes includephysical attack or fight without a weapon, theft/larceny, and vandalism. Any incidents refer to any of the crimes listed. Not included are any crimes not listed here and any crimes not reported topolice. Schools were asked to report crimes that took place in school buildings, on school buses, on school grounds, and at places holding school-sponsored events. Population size is 78,000public schools. Standard errors are rounded to the nearest 10.
SOURCE: U.S. Department of Education, National Center for Education Statistics, Fast Response Survey System, "Principal/School Disciplinarian Survey on School Violence," FRSS 63,1997.
Standard Error Tables

Table S8.3.—Standard errors for table 8.3: Number of criminal incidents occurring in public schools reported to police, by seriousness of theincident, urbanicity, and selected school characteristics: 1996-97
Any incidents Serious violent incidents Less serious violent or nonviolent incidents
School characteristics
Total
Instructional levelElementary schoolMiddle schoolHigh school
RegionNortheastSoutheastCentralWest
School enrollmentLess than 300300-9991,000 or more
Minority enrollmentLess than 5 percent5-19 percent20-49 percent50 percent or more
Free/reduced-price lunchLess than 20 percent21-34 percent35-49 percent50-74 percent75 percent or more
Total
27,560
10,89015,62014,920
12,49012,04015,18012,200
7,85016,70017,840
8,58010,23014,08021,850
eligibility9,860
11,63011,43016,07010,620
City
17,190
2,86014,8105,560
3,8303,850
12,6007,490
—13,5206,700
—3,2006,120
16,420
3,3603,305,130
14,0405,010
Urbanfringe
16,040
8,9908,3509,420
9,63011,7204,3107,050
—6,580
14,760
3,3306,570
10,17010,920
6,0409,2408,6406,320—
Town
9,220
5,8404,4206,710
3,8704,104,4808,870
5,3106,9005,660
4,3006,2105,9704,830
4,9304,6503,2704,710—
Rural
8,850
3,4602,9806,710
2,9403,9904,4804,320
4,8406,90—
6,3402,7003,3404,270
4,8903,4204,2803,190—
Total
3,290
7804,4201,820
6304,0302,5208,420
1,3202,7601,230
4401,400
12021,850
5804,650
7502,4601,340
City
2,630
5902,450
750
550030
2,520,320
—2,460
780
—570600
4,830
350590270
4,710500
Urbanfringe
680
210420750
220840420390
—40910
110300340850
360830130350—
Town
8,940
230140
6,710
2,900110480
7,490
1,300410230
1006,570
340920
2402403080
—
Rural
730
460,420560
10330670220
320860—
400100300960
18030270760
—
Total
09,220
902,86013,79006,710
02,90003,84013,35012,060
7,15006,29017,280
8,4809,660
105,88010,360
9,780404,65011,180103,19010,110
City
08,940
2,680104,3906,320
3,6103,560
205,1108,420
—11,3106,360
—5,5905,870
14,130
3,2003,304,900
103,1904,740
Urbanfringe
15,680
8,9908,2108,800
9,61011,0904,1906,960
—6 , 0
14,350
3,3306,400
803,14010,360
5,9708,5108,6404,710—
Town
8,940
5,8304,3906,320
3,8604,0304,4208,420
4,3506 , 05,640
4,2805,5905,8804,820
4,8904,5603,1804,710—
Rural
8,530
3,4402,8906,400
2,9003,8405,1104,270
4,7006,050—
6,2402,6803,1403,920
3,8903,4004,1803,190—
—Fewer than 30 sample cases.
NOTE: Serious violent crimes include murder, rape or other type of sexual battery, suicide, physical attack or fight with a weapon, or robbery. Less serious violent or nonviolent crimes includephysical attack or fight without a weapon, theft/larceny, and vandalism. Any incidents refer to any of the crimes listed. Not included are any crimes not listed here and any crimes not reported topolice. Schools were asked to report crimes that took place in school buildings, on school buses, on school grounds, and at places holding school-sponsored events. Standard errors are rounded tothe nearest 10.
SOURCE: U.S. Department of Education, National Center for Education Statistics, Fast Response Survey System, "Principal/School Disciplinarian Survey on School Violence," FRSS 63,1997.
Standard Error Tables

Table S8.4.—Standard errors for table 8.4: Number of criminal incidents reported to police per 1,000 public school students, by seriousness of theincident, urbanicity, and selected school characteristics: 1996-97
School characteristics
Total
Instructional levelElementary schoolMiddle schoolHigh school
RegionNortheastSoutheastCentralWest
School enrollmentLess than 300300-9991,000 or more
Minority enrollmentLess than 5 percent5-19 percent20-49 percent50 percent or more
Free/reduced-price lunchLess than 20 percent21-34 percent35-49 percent50-74 percent75 percent or more
Total
0.67
0.491.841.33
1.411.221.460.94
1.890.611.68
0.880.901.291.83
eligibility0.801.341.761.951.48
City
1.42
0.435.941.75
1.691.395.321.28
—
1.771.61
—
1.551.612.64
1.681.692.724.781.38
Any incidentsUrbanfringe
1.27
1.313.252.94
2.954.751401.603
—
0.833.56
1.491.373.123.85
1.073.505.753.20—
Town
0.96
1.222.002.34
1.691.291.693.29
6.190.96
—
1.192.502.632.40
1.681.852.241.64—
Rural
1.25
0.902.762.99
2.711.591.6923.14
2.361.353.82
1.711.943.15.68
2.641.762.382.67—
Total
0.08
0.040.290.16
0.080.100.250.160
0.350.8100.12
0.050.130.090.25
0.051.2710.110.310.21
Serious violent incidents
City
1.421
0.090.990.22
0.260.190.2910.12
—
0.320.17
—
0.170.190.39
0.170.290.380.860.12
Urbanfringe
0.08
0.030.160.26
0.070.330.140.160
—
0.050.23
0.060.060.170.29
0.070.320.100.18—
Town
0.13
0.050.060.43
0.140.041.20.16
1.520.040.13
0.030.490.151.6
0.090.090.170.04—
Rural
0.10
01.3210.310.27
0.180.140.290.16
0.160.14
—
0.110.080.190.77
0.130.180.160.07—
Less
Total
0.63
0.491.621.27
1.381.161.270.93
1.730.551.62
0.860.871.251.65
0.801.271.7621.711.38
serious viole
City
1.24
0.405.011.69
1.591.314.371.26
—
1.481.54
—
1.521.542.29
1.611.572.644.001.31
olent or nonvi
Urbanfringe
1.24
1.323.192.75
2.954.501.371.60
—
0.813.46
1.491.353.073.66
1.63.225.763.10—
violent inc
Town
0.93
1.21
1.98
2.18
1.69
1.27
1.68
3.12
5.05
0.96
3.21
1.19
2.25
2.61
2.40
1.66
1.83
2.18
1.65
—
dents
Rural
1.20
0.90
2.70
2.88
2.67
1.55
2.26
3.09
2.29
1.30
—
1.69
1.94
2.00
5.22
2.63
1.76
2.33
2.67
—
—Fewer than 30 sample cases.
NOTE: Serious violent crimes include murder, rape or other type of sexual battery, suicide, physical attack or fight with a weapon, or robbery. Less serious violent or nonviolent crimes include
physical attack or fight without a weapon, theft/larceny, and vandalism. Any incidents refer to any of the crimes listed. Not included are any crimes not listed here and any crimes not reported to
police. Schools were asked to report crimes that took place in school buildings, on school buses, on school grounds, and at places holding school-sponsored events. Population size is 42,336,819
public school students.
SOURCE: U.S. Department of Education, National Center for Education Statistics, Fast Response Survey System, "Principal/School Disciplinarian Survey on School Violence," FRSS 63,1997.
Standard Error Tables

Table S9.1.—Standard errors for table 9.1: Percentage of public schools that reported one or more incidents of serious violent crime to police,by type of incident, urbanicity, and selected school characteristics: 1996-97
Rape or other type of sexual battery Physical attack or fight with a weapon Robbery
School characteristics
Total
Instructional levelElementary schoolMiddle schoolHigh school
RegionNortheastSoutheastCentralWest
School enrollmentLess than 300300-9991,000 or more
Minority enrollmentLess than 5 percent5-19 percent20-49 percent50 percent or more
Free/reduced-price lunchLess than 20 percent21-34 percent35-49 percent50-74 percent75 percent or more
Total
0.48
0.481.231.27
0.610.951.040.80
0.640.641.72
0.791.180.721.00
eligibility0.801.031.660.400.92
City
0.97
1.132.152.97
1.501.433.671.12
—1.242.75
—4.041.690.85
1.472.277.421.351.01
Urbanfringe
0.99
0.912.943.73
1.264.231.271.89
—1.2412.70
1.941.691.093.42
1.612.344.651.54—
Town
0.55
1.530.97
0.864.231
1.39
1.470.563.23
0.601.482.7402.09
0.51
1.37
—
Rural
0.89
1.262.371.67
1.990.622.081.48
0.941.74—
1.400.812.441.43
1.822.771.89
—
Total
0.47
0.803.4014.31
0.971.281.361.18
0.8601.551.99
0.901.241.551.28
1.161.301.681.261.39
City
1.66
1.993.402.771
2.274.682.003.17
—1.4803.24
—1.592.812.76
2.595.057.433.811.26
Urbanfringe
1.22
1.423.404.31
1.792.023.643.15
—1.553.93
1.672.822.811.47
1.802.901.6514.75—
Town
0.87
2.322.11
0.860.61.132.70
3.030.644.38
1.042.241.01.28
2.281.100.981.36—
Rural
1.220
1.714.043.6
3.631.632.712.21
0.822.45—
1.672.603.102.67
1.883.272.931.60—
Total
0.480
0.410.930.99
0.580.630.830.79
0.370.531.77
0.520.810.781.13
0.510.721.050.971.22
City
1.31
1.343.173.60
2.011.693.042.33
—1.483.36
—3.512.741.47
1.532.5951.3713.571.39
Urbanfringe
0.69
0.422.572.66
1.081.501.941.61
—0.623.31
1.670.660.802.67
1.251.111.652.05—
Town
0.45
2.11
0.860.74
1.37
1.470.372.29
0.471.480.971.06
0.721.110.69—
Rural
0.58
0.871.210.97
2.111.061.30
1.34—
0.910.82
2.76
0.631.92
—
NOTE: Examples of weapons are guns, knives, sharp-edged or pointed objects, baseball bats, frying pans, sticks, rocks, and bottles. Schools were asked to report crimes that took place in schoolbuildings, on school buses, on school grounds, and at places holding school-sponsored events. Population size is 78,000 public schools.
SOURCE: U.S. Department of Education, National Center for Education Statistics, Fast Response Survey System, "Principal/School Disciplinarian Survey on School Violence," FRSS 63,1997.
Standard Error Tables

Table S9.2.—Standard errors for table 9.2: Percentage of public schools that reported one or more less serious violent or nonviolent criminalincidents to police, by type of incident, urbanicity, and selected school characteristics: 1996-97
School characteristics
Total
Instructional levelElementary schoolMiddle schoolHigh school
RegionNortheastSoutheastCentralWest
School enrollmentLess than 300300-9991,000 or more
Minority enrollmentLess than 5 percent5-19 percent20-49 percent50 percent or more
Free/reduced-price lunchLess than 20 percent21-34 percent35-49 percent50-74 percent75 percent or more
Physical attack or fight without a weapon
Total
1.14
1.692.342.94
2.262.672.552.99
2.851.442.97
2.403.032.883.13
eligibility2.472.903.453.432.99
City
2.41
3.123.414.00
4.596.526.014.87
—3.054.75
—4.906.663.46
5.797.639.387.34.51
Urbanfringe
2.60
3.507.076.10
4.627.446.516.20
—3.016.01
7.005.735.667.54
4.077.507.776.74—
Town
2.32
3.464.695.34
5.395.906.075.92
4.593.048.88
4.065.656.718.41
5.285.257.846.43—
Rural
2.662
3.426.574.49
7.054.294.395.66
4.103.053—
3.727.795.45
10.07
6.025.865.026.57—
Total
1.54
3.42.463.11
3.313.636.0163.02
3.111.833.24
2.8334.93.283.467
2 42.954.770.63.90
City
2.66
3.514.084.44
8.485.165.305.08
—3.233.78
—4.845.424.37
5.28.449.716.445.53
Theft or larcenyUrbanfringe
2.41
3.375.326.23
4.728.526.26.76
—3.085.59
5.504.996.807 3
4.325.8
10.227.40—
Town
3.45
5.245.325.55
7.147.236.236.58
7.563.919.17
5.623.06.979.33
6.226.077.498.62—
Rural
3.533
4.205.625.07
69.16.7453.57.23
4.594.05—
4.197.736.93
11.43
5.993.866.817.31—
Total
1.65
2.272.612.69
3.563.153.583.49
3.921.693.28
3.292.973.463.34
3.589.5887.83.573.88
City
3.17
4.255.03.60
9.355.746.634.92
—3.755.08
—7.005.794.36
8.409.589.505.735.83
VandalismUrbanfringe
2.89
4.275.006.12
5.768.255.806.89
—3.635.49
6.705.556.067.25
5.848.137.86
10.60—
Town
3.53
5.524.835.87
9.156.475.277.00
8.193.498.84
5.596.938.289.31
7.227.078.359.11—
Rural
3.72
5.027.075.40
11.566.906.346.84
5.244.82—
4.4710.26
8.0810.57
8.964.887.288.26—
—Fewer than 30 sample cases.
NOTE: Examples of weapons are guns, knives, sharp-edged or pointed objects, baseball bats, frying pans, sticks, rocks, and bottles. Schools were asked to report crimes that took place in schoolbuildings, on school buses, on school grounds, and at places holding school-sponsored events. Population size is 78,000 public schools.
SOURCE: U.S. Department of Education, National Center for Education Statistics, Fast Response Survey System, "Principal/School Disciplinarian Survey on School Violence," FRSS 63,1997.
Standard Error Tables

Table S9.3.—Standard errors for table 9.3: Number of public schools that reported one or more incidents of serious violent crime to police, by typeof incident, urbanicity, and selected school characteristics: 1996-97
Rape or other type of sexual battery Physical attack or fight with a weapon Robbery
School characteristics
Total
Instructional levelElementary schoolMiddle schoolHigh school
RegionNortheastSoutheastCentralWest
School enrollmentLess than 300300-9991,000 or more
Minority enrollmentLess than 5 percent5-19 percent20-49 percent50 percent or more
Free/reduced-price lunchLess than 20 percent21-34 percent35-49 percent50-74 percent75 percent or more
Total
371.5
229.4169.1197.5
88.2155.3231.3176.7
129.2317.8119.7
188.2215.8125.8169.5
eligibility147.7176.4214.7
64.7104.3
City
175.0
21.566.071.2
40.447.5
166.561.6
—165.5
70.6
—143.3
73.166.6
37.450.7
163.848.954.3
Urbanfringe
186.3
17.3104.5106.9
66.9137.3
11.0102.4
—170.0
72.9
70.5107.1
56.6133.7
109.389.6
11648.2—
Town
186.3
67.085.7
5.2.16
74.6
10.275.642.0
46.610.244.08.9
46.6
t44.0
—
Rural
187.1
24.871.9
102.4
42.94.3
165.71.8
108.6158.8
—
164.639.690.94.3
764.8153.290.9
—
Total
365.1
383.0170.4235.3
136.2210.1304.2281.8
174.1377.7137.9
211.5207.3265.6208.0
198.7232.4219.6213.3174.3
City
285.3
245.198.466.5
36.25371.6
78.1210.3
—268.9
85.6
—47.0
198.1179.0
64.8124.5184.9139.5
67.3
Urbanfringe
229.4
178.4123.6119.6
36.2563.9
181.5158.2
—219.3105.7
11.0176.9147.399.7
122.9108.1
4.1151.3
—
Town
170.7
100.4116.4
5.267.055.7
174
139.790.057.7
80.699.373.05.2
97.656.64.68.9
—
Rural
252.0
204.4121.7102.9
73.878.2
215.4129.0
94.8223.6
—
198.479.1
117.293.9
75.8184.0135.3
70.6—
Total
306.5
197.7128.7151.7
80.7105.1185.6174.4
74.9261.8122.3
125.8122.7135.5180.8
95.8123.7135.9151.2150.5
City
234.4
167.596.584.1
54.262.0
130.2157.5
—196.893.6
—122.7135.5112.2
42.161.2
125.3142.2
77.6
Urbanfringe
127.8
8.090.773.5
56.749.293.380.7
—86.689.2
11.040.942.396.0
14.343.340.959.8—
Town
87.9
87.9
5.25.2
73.9
10.250.94.8
5.210.25.24.8
5.25.24.8—
Rural
122.6
16.635.959.8
46.57.6
16.6*
122.6—
107.03.7
57.5
3.7107.0
—
NOTE: Examples of weapons are guns, knives, sharp-edged or pointed objects, baseball bats, frying pans, sticks, rocks, and bottles. Schools were asked to report crimes that took place in schoolbuildings, on school buses, on school grounds, and at places holding school-sponsored events. Population size is 78,000 public schools.
SOURCE: U.S. Department of Education, National Center for Education Statistics, Fast Response Survey System, "Principal/School Disciplinarian Survey on School Violence," FRSS 63,1997.
Standard Error Tables

Table S9.4.—Standard errors for table 9.4: Number of public schools that reported one or more less serious violent or nonviolent criminal incidentsto police, by type of incident, urbanicity, and selected school characteristics: 1996-97
School characteristics
Total
Instructional levelElementary schoolMiddle schoolHigh school
RegionNortheastSoutheastCentralWest
School enrollmentLess than 300300-9991,000 or more
Minority enrollmentLess than 5 percent5-19 percent20-49 percent50 percent or more
Physical attack or fight without a weapon
Total
930
820340460
380440710680
620740230
600590570580
Free/reduced-price lunch eligibilityLess than 20 percent21-34 percent35-49 percent50-74 percent75 percent or more
460530460610380
City
420
390100120
90260270330
—410130
—170330280
130150270270280
Urbanfringe
520
450170180
270240350340
—430180
270360310260
300320180270—
Town
450
370210250
210300360330
230440140
350240270270
460230250290—
Rural
560
400210280
160210350310
490280—
440260210190
25030250300—
Total
1,200
980350520
490660620680
650950290
630580660710
58050620700590
City
460
430130100
240210260400
—430190
—160270410
100200290220350
Theft or larcenyUrbanfringe
470
430120180
260300260360
—430180
210320400260
330200260260—
Town
680
590220260
320400350360
360600140
430290290320
320300250440—
Rural
700
490170320
170360400430
54030—
490260280280
250210380360—
Total
1,330
1,100400450
650540900830
850870280
860710680860
710700620t610660
City
560
53012090
280300370450
—530160
—340330410
230280330260410
VandalismUrbanfringe
560
530200170
340310310440
—540170
300410340300
450410190370—
Town
700
620210260
450300300450
400520140
450340320370
330390260500—
Rural
800
600220340
280360540400
640450—
530360340260
400250400420—
—Fewer than 30 sample cases.
NOTE: Examples of weapons are guns, knives, sharp-edged or pointed objects, baseball bats, frying pans, sticks, rocks, and bottles. Schools were asked to report crimes that took place in schoolbuildings, on school buses, on school grounds, and at places holding school-sponsored events. Standard errors are rounded to the nearest 10.
SOURCE: U.S. Department of Education, National Center for Education Statistics, Fast Response Survey System, "Principal/School Disciplinarian Survey on School Violence," FRSS 63,1997.
Standard Error Tables

Table S9.5.—Standard errors for table 9.5: Number of serious violent criminal incidents occurring in public schools reported to police, by type ofincident, urbanicity, and selected school characteristics: 1996-97
Rape or other type of sexual battery Physical attack or fight with a weapon Robbery
School characteristics
Total
Instructional levelElementary schoolMiddle schoolHigh school
RegionNortheastSoutheastCentralWest
School enrollmentLess than 300300-9991,000 or more
Minority enrollmentLess than 5 percent5-19 percent20-49 percent50 percent or more
Free/reduced-price lunchLess than 20 percent21-34 percent35-49 percent50-74 percent75 percent or more
Total
680
420360340
140330480340
170570310
340330320260
eligibility240360410220150
City
440
280170240
80210360170
—360250
—280210170
140110360150110
Urbanfringe
290
110240150
9022060
180
—250150
70140190190
140160120170—
Town
120
*70
100
I90
t70
708070
50707060
50-*-70
—
Rural
360
300140190
7015033090
160340—
33040
170
140300170
—
Total
1,880
5601,4401,080
260420
1,5801,000
9801,570
520
230970480
1,510
320480460
1,460980
City
1,520
4501,450
300
190340
1,460370
—1,490
380
—200390
1,480
110340420
1,460170
Urbanfringe
370
180020310
160240210260
—230330
60250230270
130310
210—
Town
960
110910
I70
190950
950100220
80900140
24080
60—
Rural
540
270290410
9080
560220
280480—
22080
210480
12019022070—
Total
1,540
200120
890
400660
1,010470
2101,250
770
140250500
1,430
340610360
100520
City
1,190
1701,030
470
300120970440
—980470
—130240
1,110
140300200
100370
Urbanfringe
620
50120600
90550320120
—120600
6070
260550
32054070
100—
Town
360
360
290
210
20029060
20029060
29060—
Rural
290
10070
270
90260100
290—
12050
260
50120
—
NOTE: Examples of weapons are guns, knives, sharp-edged or pointed objects, baseball bats, frying pans, sticks, rocks, and bottles. Schools were asked to report crimes that took place in schoolbuildings, on school buses, on school grounds, and at places holding school-sponsored events. Standard errors are rounded to the nearest 10.
SOURCE: U.S. Department of Education, National Center for Education Statistics, Fast Response Survey System, "Principal/School Disciplinarian Survey on School Violence," FRSS 63,1997.
Standard Error Tables

Table S9.6.—Standard errors for table 9.6: Number of less serious violent or nonviolent criminal incidents occurring in public schools reported topolice, by type of incident, urbanicity, and selected school characteristics: 1996-97
School characteristics
Total
Instructional levelElementary schoolMiddle schoolHigh school
RegionNortheastSoutheastCentralWest
School enrollmentLess than 300300-9991,000 or more
Minority enrollmentLess than 5 percent5-19 percent20-49 percent50 percent or more
Free/reduced-price lunchLess than 20 percent21-34 percent35-49 percent50-74 percent75 percent or more
Physical attack or fight without a weapon
Total
17,030
7,00010,4309,360
6,8208,800
10,0307,300
3,70010,73011,520
3,2505,1209,330
13,700
eligibility5,5507,7306,9809,8705,940
City
9,220
8308,8602,430
2,0901,8508,1603,430
—8,2102,950
—1,5903,2608,840
1,5701,5602,8908,3602,390
Urbanfringe
11,540
5,2506,4507,340
6,09,2102,8803,070
—4,900
10,340
1,2103,7806,9708,310
3,5907,0205,6004,680—
Town
5,770
4,7102,3603,420
1,1202,8802,3905,610
2,4404,9203,220
2,0502,3305,1308,840
2,8901,5302,1502,690—
Rural
4,300
1,6401,5003,610
1,4502,4002,9301,960
2,2303,560—
2,5301,5601,9502,820
1,7401,7902,3001,510—
Total
8,400
3,3903,3705,660
4,8303,1502,3904,970
2,2703,5605,290
3,6204,5204,0504,590
1,7401,5603,7803,4002,700
City
4,190
2,1602,5102,790
9701,6301,9402,880
—4,4502,990
—1,560209703 , 0
1,6801,6901,9202,8301,510
Theft or larcenyUrbanfringe
4,130
2,8101,7007,340
3,0101,6901,7902,710
—1,6603,830
1,6604,5202,9402,980
2,0601,7903,7801,470—
Town
3,550
1,1101,5603,120
1,5701,6302,3901,960
1,0902,3302,530
1,5502,330
1301,380
2,8902,5501,1301,350—
Rural
3,510
2,1601,1602,660
1,5101 ,01,1201,700
1,7202,330—
2,7801,7801,0603,010
1,7001,6901,4101,470—
Total
5,580
4,2102,2802,870
2 , 02,402,6902,100
2,4504,1403,610
2,7701,7802,2205,170
2,3304,3601,9702,5604,310
City
3,510
1,790506501,400
1,4501,090
9102,710
—2,3302,060
—640
1,3803,010
650940
1,1301,5102,110
VandalismUrbanfringe
3,510
3,000650
1,400
1,1709,210
7302,100
—1,8803,070
8201,780
9202,980
1,3701,690
630790—
Town
2,780
2,1601,4701,470
2,060870
1,1202,100
1,5902,3301,130
1,6501,780
9701,830
1,1101,690
8701,620—
Rural
2,650
1,3101,0801,680
4801,0101,7901,470
1,7901,660—
1,800770770
1,340
990930
1,2501,310—
—Fewer than 30 sample cases.
NOTE: Examples of weapons are guns, knives, sharp-edged or pointed objects, baseball bats, frying pans, sticks, rocks, and bottles. Schools were asked to report crimes that took place in schoolbuildings, on school buses, on school grounds, and at places holding school-sponsored events. Population size is 78,000 public schools. Standard errors are rounded to the nearest 10.
SOURCE: U.S. Department of Education, National Center for Education Statistics, Fast Response Survey System, "Principal/School Disciplinarian Survey on School Violence," FRSS 63,1997.
Standard Error Tables

Table S9.7.—Standard errors for table 9.7: Number of serious violent criminal incidents reported to police per 1,000 public school students, bytype of incident, urbanicity, and selected school characteristics: 1996-97
Rape or other type of sexual battery Physical attack or fight with a weapon Robbery
School characteristics
Total
Instructional levelElementary schoolMiddle schoolHigh school
RegionNortheastSoutheastCentralWest
School enrollmentLess than 300300-9991,000 or more
Minority enrollmentLess than 5 percent5-19 percent20-49 percent50 percent or more
Free/reduced-price lunchLess than 20 percent21-34 percent35-49 percent50-74 percent75 percent or more
Total
0.02
0.020.040.03
0.020.030.050.03
0.050.020.03
0.040.030.030.02
eligibility0.020.040.060.030.03
City
0.04
0.020.070.07
0.040.080.150.03
—0.050.06
—0.130.070.03
0.070.060.220.050.03
Urbanfringe
0.02
0.020.090.04
0.030.090.020.05
—0.030.04
0.020.030.060.06
0.030.060.080.09—
Town
0.02
t0.020.03
0.020.03
t0.02
0.080.020.04
0.020.020.020.02
0.02
t0.04
t—
Rural
0.05
0.080.130.09
0.070.070.140.06
0.080.07—
0.090.020.120.02
0.090.160.110
t—
Total
0.04
0.030.170.09
0.030.040.160.07
0.260.060.05
0.030.090.050.13
0.030.050.070.190.15
City
0.12
0.070.590.09
0.090.120.1600.07
—0.190.09
—0.1300.120.23
0.060.170.240.510.05
Urbanfringe
0.03
0.020.080.09
0.050.2200.070.07
—0.030.08
0.020.050.070.09
0.030.120.020.11—
Town
0.0
t0.050.1
0.020.020.080.34
1.110.020.12
0.020.350.060.02
0.090.030.020.02—
Rural
0.08
0.070.260.19
0.1400.040.240.15
0.140.0—
0.060.070.140.66
0.080.090.130.07—
Total
0.04
0.020.120.07
0.050.060.1400.03
0.060.050.07
0.020.020.050.12
0.030.070.050.130.07
City
0.09
0.020.410.12
0.140.040.400.06
—0.130.08
—0.060.070.17
0.070.140.110.350.06
Urbanfringe
0.05
0.020.050.18
0.030.220.120.03
—0.020.15
0.020.020.080.19
0.060.210.050.05—
Town
0.04
tt
0.12
0.140.02
t0.08
0.240.020.02
0.020.080.140.02
t0.020.170.02—
Rural
0.04
0.020.070.12
0.090.120.02
t
t0.06—
0.020.02
t0.38
0.020.06
tt—
—Fewer than 30 sample cases.f No cases are reported in this cell, although the event defined by this cell could have been reported by some schools with these characteristics had a different sample been drawn.NOTE: Examples of weapons are guns, knives, sharp-edged or pointed objects, baseball bats, frying pans, sticks, rocks, and bottles. Schools were asked to report crimes that took place in schoolbuildings, on school buses, on school grounds, and at places holding school-sponsored events. Population size is 42,336,819 public school students. Values of 0.0 are less than 0.05.SOURCE: U.S. Department of Education, National Center for Education Statistics, Fast Response Survey System, "Principal/School Disciplinarian Survey on School Violence," FRSS 63,1997.Standard Error Tables

Table S9.8.—Standard errors for table 9.8: Number of less serious violent or nonviolent criminal incidents reported to police per 1,000 public schoolstudents, by type of incident, urbanicity, and selected school characteristics: 1996-97
School characteristics
Total
Instructional levelElementary schoolMiddle schoolHigh school
RegionNortheastSoutheastCentralWest
School enrollmentLess than 300300-9991,000 or more
Minority enrollmentLess than 5 percent5-19 percent20-49 percent50 percent or more
Free/reduced-price lunchLess than 20 percent21-34 percent35-49 percent50-74 percent75 percent or more
Physical attack or fight without a weapon
Total
0.41
0.311.230.84
0.780.900.990.55
0.920.391.12
0.320.490.891.16
eligibility0.480.891.061.200.89
City
0.76
0.23.560.840
0.930.713.410.62
—1.070.77
—0.760.931.40
0.6710.841.802.900.67
Urbanfringe
0.36
0.792.512.29
1.903.770.980.73
—0.632.58
0.570.832.162.95
0.672.733.742.48—
Town
0.59
0.971.081.18
0.9500.910.922.03
2.810.681.82
0.560.982.341.69
1.030.630.81.06—
Rural
0.61
0.431.381.66
1.311.031.301.40
1.110.16—
0.691.351.323.81
0.30.931.261.30—
Total
0.270
0.150.390.50
0.560.3300.270.39
0.590.160.46
0.380.440.370.38
0.320.470.580.410.37
City
0.34
0.180.6501.660
0.420.640.820.56
—0.2300.66
—0.980.650.57
0.6710.651.010.290.39
Theft or larcenyUrbanfringe
0.3
0.220.660.77
0.930.660.360.68
—0.190.91
0.790.570.870.48
0.360.8901.780.39—
Town
0.35
0.220.6501.04
0.680.440.531.19
1.260.321.49
0.420.980.340.77
0.670.970.730.52—
Rural
0.51
0.280.6501.23
1.520.520.861.03
0.870.56—
0.760.4900.671.54
1.190.890.850.97—
Total
0.13
0.190.270.23
0.270.170.250.31
0.600.150.32
0.290.240.2800.40
0.190.270.4300.290.57
City
0.27
0.270.650.50
0.490.330.360.48
—0.290.44
—0.280.340.47
0.360.460.480.640.55
VandalismUrbanfringe
0.26
0.430.250.42
0.360.450.230.71
—0.230.72
0.350.320.281.02
0.250.380.430.39—
Town
0.29
0.450.630.53
0.950.320.450.72
1.880.310.65
0.490.700.411.02
0.400.690.540.63—
Rural
0.36
0.341.010.74
0.420.420.751.03
0.870.36—
0.480.580.451.93
0.660.450.671.16—
—Fewer than 30 sample cases.
NOTE: Examples of weapons are guns, knives, sharp-edged or pointed objects, baseball bats, frying pans, sticks, rocks, and bottles. Schools were asked to report crimes that took place in schoolbuildings, on school buses, on school grounds, and at places holding school-sponsored events. Population size is 42,336,819 public school students.
SOURCE: U.S. Department of Education, National Center for Education Statistics, Fast Response Survey System, "Principal/School Disciplinarian Survey on School Violence," FRSS 63,1997.
Standard Error Tables

Table S10.1.—Standard errors for table 10.1: Number of nonfatal crimes against teachers and average annual number of crimes per 1,000 teachersat school, by type of crime and selected teacher characteristics: Aggregated from 1994 to 1998
Teacher characteristics
Total crimes from 1994 to 1998
Total Theft ViolentSeriousviolent
Average annual number of crimes per 1,000 teachersSerious
Total Theft Violent violent
Total
Instructional levelElementaryMiddle/junior highSenior high
GenderMaleFemale
Race/ethnicityWhite, non-HispanicBlack, non-HispanicHispanicOther, non-Hispanic
Urbanicity2
UrbanSuburbanRural
105,660 80,080 60,810 19,280
58,87053,53056,870
52,55086,400
95,99024,96022,2508.4501
76,33049,97032,540
47,84037,75043,930
34,49069,570
72,52019,57017,510
7.2001
57,90039,70023,980
31,12035,43033,160
37,38045,250
55,93014,79013,170
4.3301
44,93027,95020,910
15,3908,2307,440
11,54015,120
17,5906,760
3,170
14,8309,8306,520
4.6
5.011.68.9
9.35.0
5.011.818.125.31
5.86.06.3
3.6
4.18.67.1
6.34.1
3.99.4
14.621.81
4.54.84.7
2.8
2.78.15.5
6.82.8
3.17.2
11.213.31
3.63.54.1
0.9
1.42.01.3
2.20.9
1.03.3
9.81
1.21.21.3
NOTE: Serious violent crimes include rape, sexual assault, robbery, and aggravated assault. Violent crimes include serious violent crimes and simple assault. Total crimes include violent crimes andtheft. "At school" includes inside the school building, on school property, at work site, or while working. For thefts, "while working" was not considered since thefts of teachers' property kept at schoolcan occur when teachers are not present. The data were aggregated from 1994 to 1998 due to the small number of teachers in each year's sample. On average, there were about 4.2 million teachersper year over the 5-year period for a total population size of 21,230,185 teachers. The average annual number of full-time-equivalent teachers is approximately 2.9 million. The population reportedhere includes part-time teachers as well as other instructional and support staff. Total crime standard errors are rounded to the nearest 10.
SOURCE: U.S. Department of Justice, Bureau of Justice Statistics, National Crime Victimization Survey, 1994 to 1998.
Standard Error Tables

Table S11.1.—Standard errors for table 11.1: Percentage and number of teachers who reported that they were threatened with injury or that they
were physically attacked by a student during the past 12 months, by urbanicity and selected teacher and school characteristics:
1993-94 school year
Teachers threatened with injury by a student Teachers physically attacked by a student
Selected characteristics
Total
GenderMaleFemale
Race/ethnicityWhite, non-HispanicBlack, non-HispanicHispanicOther, non-Hispanic
Teacher levelElementarySecondary
ControlPublicPrivate
Total
0.23
0.400.20
0.240.611.321.08
0.300.28
0.260.29
Percent
Centralcity
0.40
0.870.59
0.540.902.102.02
0.670.49
0.560.38
Urbanfringe/
large town
0.40
0.2610.47
0.431.301.402.08
0.520.51
0.20.67
Smalltown/rural
0.29
0.2610.30
0.4301.161.941.26
0.380.2
0 20.61
Total
7,040
3,8705,530
6,2801,4001,840
680
4,4805,380
6,9601,100
Number
Centralcity
4,360
2,4703,830
3,8701,1901,650
510
3,402,780
4,420,10
Urbanfringe/
large town
3,840
2,4703,830
3,72083040420
1,7002,790
3,450990
Smalltown/rural
3,550
1,7601,640
3,4005006502.0
2,2902,450
3,500480
Total
0.13
0.210.18
0.161,400.990.76
0.5200.14
0.140.23
Percent
Centralcity
0.23
0.580.34
02,10.691.571.26680
0.430.25
0.190.31
Urbanfringe/
large town
0.230
0.290.31
0.2401.181.141.52
0.20.26
0.270.46
Smalltown/rural
0.18
0.2602,22
0.190.710.660.79
0.270.280
0.190.56
Total
3,890
1,7603,840
3,970860
1,26040
3,2501,030
3,690850
Number
Centralcity
2,300
1,350
2,170
2,100
8301,170
340
2,170
1,030
2,130500
Urban
fringe/
large town
2,300
7402,170
2,100
530380300
1,700
1,190
2,130660
Small
town/
rural
1,920
9001,640
1,940
310130120
1,560
1,120
1,890420
NOTE: Population size is 2,940,000 teachers. Standard error numbers are rounded to the nearest 10.
SOURCE: U.S. Department of Education, National Center for Education Statistics, Schools and Staffing Survey, 1993-94 (Teacher and School Questionnaires).
Standard Error Tables

Table S 12.1.—Standard errors for table 12.1: Percentage of students in grades 9 through 12 who reported carrying a weapon on school property
at least 1 day in the past 30 days, by selected student characteristics: 1993,1995, and 1997
Student characteristics 1993 1995* 1997*
Total 0.73 0.45 0.64
GenderMaleFemale
0.960.65
0.760.53
1.500.37
Race/ethnicityWhite, non-HispanicBlack, non-HispanicHispanic
Asian/Pacific Islander
Other, non-Hispanic
Grade
9th
10th
11th
12th
Ungraded or other
0.86
0.85
1.09
0.92
3.48
0.73
0.97
1.41
0.83
14.63
0.93
2.03
1.87
4.44
2.21
0.76
0.78
0.94
0.68
9.81
1.16
0.98
0.99
1.00
1.88
0.90
0.99
1.33
0.91
9.71
*The response rate for this survey was less than 70 percent and a full nonresponse bias analysis has not been done to date.
NOTE: "On school property" was not defined for survey respondents.
SOURCE: U.S. Department of Health and Human Services, Public Health Service, Centers for Disease Control and Prevention, National Center for Health Statistics, National Health InterviewSurvey—Youth Risk Behavior Survey, 1993,1995, and 1997.
Standard Error Tables
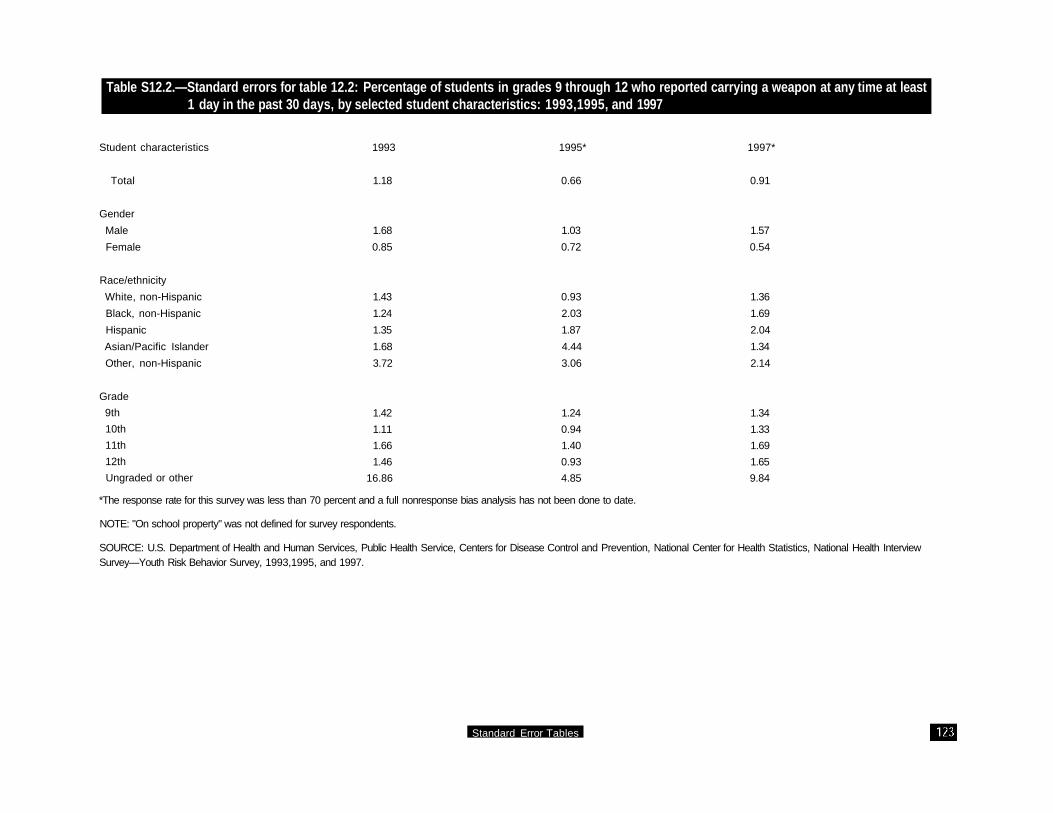
Table S12.2.—Standard errors for table 12.2: Percentage of students in grades 9 through 12 who reported carrying a weapon at any time at least1 day in the past 30 days, by selected student characteristics: 1993,1995, and 1997
Student characteristics 1993 1995* 1997*
Total 1.18 0.66 0.91
Gender
Male
Female
1.68
0.85
1.03
0.72
1.57
0.54
Race/ethnicity
White, non-Hispanic
Black, non-Hispanic
Hispanic
Asian/Pacific Islander
Other, non-Hispanic
Grade
9th
10th
11th
12th
Ungraded or other
1.43
1.24
1.35
1.68
3.72
1.42
1.11
1.66
1.46
16.86
0.93
2.03
1.87
4.44
3.06
1.24
0.94
1.40
0.93
4.85
1.36
1.69
2.04
1.34
2.14
1.34
1.33
1.69
1.65
9.84
*The response rate for this survey was less than 70 percent and a full nonresponse bias analysis has not been done to date.
NOTE: "On school property" was not defined for survey respondents.
SOURCE: U.S. Department of Health and Human Services, Public Health Service, Centers for Disease Control and Prevention, National Center for Health Statistics, National Health InterviewSurvey—Youth Risk Behavior Survey, 1993,1995, and 1997.
Standard Error Tables

Table S 13.1.—Standard errors for table 13.1: Percentage of students ages 12 through 18 who reported fearing being attacked or harmed at schoolor on the way to and from school during the previous 6 months, by selected student characteristics: 1989,1995, and 1999
Student characteristics 19892
Feared attack or harm at school1
1995 1999
Feared attack or harm on the way to and from school1
19892 1995 11999
Total
GenderMaleFemale
Race/ethnicityWhite, non-HispanicBlack, non-HispanicHispanicOther, non-Hispanic
Grade6th7th8th9th10th11th12th
UrbanicityUrbanSuburbanRural
ControlPublicPrivate
0.27 0.34 0.29 0.25 0.30 0.25
0.390.39
0.290.761.241.70
1.170.910.700.660.690.560.49
0.610.380.50
0.300.53
0.470.46
0.331.071.081.44
1.060.920.740.730.710.650.87
0.720.430.69
0.380.67
0.390.44
0.280.970.940.99
1.250.710.650.600.570.520.54
0.580.370.55
0.310.55
0.320.38
0.230.821.181.49
1.080.770.600.630.590.590.51
0.630.320.34
0.260.83
0.340.48
0.241.121.111.34
0.820.780.610.760.700.640.66
0.690.380.44
0.320.78
0.310.40
0.191.030.921.04
0.770.530.570.600.630.520.72
0.660.270.44
0.250.74
Includes students who reported that they sometimes or most of the time feared being victimized in this way.2Students ages 12 through 19.NOTE: Comparisons between the 1989 data and the 1995 and 1999 data should be made with caution due to changes in the questionnaire. See appendix B for details. "At school" means in theschool building, on the school grounds, or on a school bus. Population sizes are 21,554,000 students ages 12 through 19 in 1989, 23,601,000 students ages 12 through 18 in 1995, and 24,614,000students ages 12 through 18 in 1999.SOURCE: U.S. Department of Justice, Bureau of Justice Statistics, School Crime Supplement to the National Crime Victimization Survey, January-June 1989,1995, and 1999.Standard Error Tables

Table S14.1.—Standard errors for table 14.1: Percentage of students ages 12 through 18 who reported that they avoided one or more places inschool during the previous 6 months, by selected student characteristics: 1989,1995, and 1999
Student characteristics 1989* 1995 1999
Total 0.26 0.29 0.29
Gender
Male
Female
Race/ethnicity
White, non-Hispanic
Black, non-Hispanic
Hispanic
Other, non-Hispanic
Grade
6th
7th
8th
9th
10th
11th
12th
Urbanicity
Urban
Suburban
Rural
ControlPublicPrivate
0.370.38
0.29
0.76
0.97
1.53
1.05
0.83
0.65
0.72
0.64
0.56
0.56
0.59
0.35
0.52
0.290.50
0.430.46
0.32
1.01
0.97
1.61
0.99
0.89
0.77
0.71
0.75
0.64
0.74
0.73
0.40
0.65
0.330.47
0.350.39
0.27
0.90
0.73
0.99
0.92
0.72
0.70
0.63
0.61
0.46
0.51
0.48
0.38
0.56
0.310.45
*Students ages 12 through 19.
NOTE: Comparisons between the 1989 data and the 1995 and 1999 data should be made with caution due to changes in the questionnaire. See appendix B for details. Places include the entranceinto the school, any hallways or stairs in the school, parts of the school cafeteria, any school restrooms, and other places inside the school building. Population sizes are 21,554,000 students ages 12through 19 in 1989, 23,601,000 students ages 12 through 18 in 1995, and 24,614,000 students ages 12 through 18 in 1999.
SOURCE: U.S. Department of Justice, Bureau of Justice Statistics, School Crime Supplement to the National Crime Victimization Survey, January-June 1989,1995, and 1999.
Standard Error Tables

Table S 15.1.—Standard errors for table 15.1: Percentage of students ages 12 through 18 who reported being targets of hate-related words or whosaw hate-related graffiti at school during the previous 6 months, by selected student characteristics: 1999
Student characteristics Hate-related words Hate-related graffiti
Total
Gender
Male
Female
Race/ethnicity
White, non-Hispanic
Black, non-Hispanic
Hispanic
Other, non-Hispanic
Grade
6th
7th
8th
9th
10th
11th
12th
Urbanicity
Urban
Suburban
Rural
Control
Public
Private
0.53
0.66
0.70
0.67
1.17
1.07
1.95
1.34
1.14
0.99
0.91
1.09
1.03
1.25
0.78
0.53
1.75
0.56
1.04
0.94
1.06
1.14
1.20
1.71
1.46
2.53
1.82
1.43
1.51
1.55
1.77
1.74
2.04
1.18
1.12
2.60
0.97
1.85
NOTE: "At school" means in the school building, on the school grounds, or on a school bus. Population size is 24,614,000 students ages 12 through 18 in 1999.
SOURCE: U.S. Department of Justice, Bureau of Justice Statistics, School Crime Supplement to the National Crime Victimization Survey, January-June 1999.
Standard Error Tables

Table S16.1.—Standard errors for table 16.1: Percentage of students ages 12 through 18 who reported that street gangs were present at schoolduring the previous 6 months, by selected student characteristics: 1989,1995, and 1999
Student characteristics 1989* 1995 1999
Total 0.43 0.65 0.64
GenderMaleFemale
Race/ethnicityWhite, non-HispanicBlack, non-HispanicHispanicOther, non-Hispanic
Grade6th7th8th9th10th11th12th
UrbanicityUrbanSuburbanRural
ControlPublicPrivate
0.610.61
0.461.211.822.74
1.261.171.061.201.161.121.09
1.000.610.63
0.470.84
0.810.79
0.691.731.792.71
1.061.151.231.301.531.441.50
1.340.771.73
0.710.81
0.720.78
0.671.801.681.98
1.230.951.091.351.421.251.52
1.020.682.06
0.700.83
*Students ages 12 through 19.
NOTE: Comparisons between the 1989 data and the 1995 and 1999 data should be made with caution due to changes in the questionnaire. See appendix B for details. This indicator is based on anitem from earlier in the SCS questionnaire, before "at school" was defined for the respondent. Population sizes are 21,554,000 students ages 12 through 19 in 1989, 23,601,000 students ages 12through 18 in 1995, and 24,614,000 students ages 12 through 18 in 1999.
SOURCE: U.S. Department of Justice, Bureau of Justice Statistics, School Crime Supplement to the National Crime Victimization Survey, January-June 1989,1995, and 1999.
Standard Error Tables

Table S17.1.—Standard errors for table 17.1: Percentage and number of public schools that reported that 1 or more of 17 discipline issues* wasa serious problem in their school, by urbanicity and selected school characteristics: 1996-97
Percent Number
School characteristics
Total
Instructional levelElementary schoolMiddle schoolHigh school
RegionNortheastSoutheastCentralWest
School sizeLess than 300300-9991,000 or more
Minority enrollmentLess than 5 percent5-19 percent20-49 percent50 percent or more
Free/reduced-price lunch eligibilityLess than 20 percent21-34 percent35-49 percent50-74 percent75 percent or more
Total
1.25
1.621.772.49
2.372.321.972.61
2.121.472.93
1.532.123.032.70
1.442.523.092.522.94
City
2.34
3.353.614.14
7.335.244.123.93
5.173.074.62
4.655.044.573.54
5.017.329.724.054.09
Urbanfringe
1.96
2.463.465.84
2.705.064.934.50
2.384.72
3.043.954.124.65
2.695.341.438.086.08
Town
1.93
2.454.134.87
4.765.214.564.20
3.662.608.59
2.895.313.895.87
3.424.786.693.635.94
Rural
2.74
3.544.624.61
3.754.823.985.90
3.313.64
15.85
2.286.838.559.41
3.713.846.076.777.36
Total
970
780250390
3504104705.90
440750240
360410490500
29042040430370
City
410
410110120
2.70220180260
70410130
40180210320
130180240160260
Urbanfringe
360
300120160
140170260240
t340130
110250220190
17019040
270140
Town
380
270180210
200270240220
170360100
230240140180
170250230170120
Rural
590
420140280
80250320360
40033060
270230340190
140200310310160
NOTE: "At school" was not defined for the questionnaire respondent. Population size is 78,000 public schools. Standard error numbers are rounded to the nearest 10.
SOURCE: U.S. Department of Education, National Center for Education Statistics, Fast Response Survey System, "Principal/School Disciplinarian Survey on School Violence," FRSS 63,1997.
Standard Error Tables

Table S18.1.—Standard errors for table 18.1: Percentage of students in grades 9 through 12 who reported using alcohol in the last 30 days,by selected student characteristics: 1993,1995, and 1997
Student characteristics 1993Anywhere
1995* 1997*On school property
1993 1995* 1997*
Total 1.06 1.19 1.43 0.39 0.45 0.34
Gender
Male
Female
Race/ethnicity
White, non-Hispanic
Black, non-Hispanic
Hispanic
Asian/Pacific Islander
Other, non-Hispanic
Grade
9th10th
11th12th
1.23
1.32
1.26
1.82
2.82
2.88
2.57
1.79
2.00
1.731.35
1.33
1.79
1.77
2.24
2.56
4.78
2.89
1.87
2.38
1.511.64
1.22
1.99
1.51
1.46
1.96
3.37
3.16
3.12
2.19
1.492.50
0.39
0.54
0.44
0.98
0.84
1.11
1.99
0.38
0.43
0.800.64
0.50
0.70
0.62
0.87
1.73
1.62
2.27
0.90
0.88
0.860.58
0.66
0.37
0.42
0.72
0.96
0.99
1.55
0.83
0.71
0.860.66
*The response rate for this survey was less than 70 percent and a full nonresponse bias analysis has not been done to date.
NOTE: "On school property" was not defined for survey respondents.
SOURCE: U.S. Department of Health and Human Services, Public Health Service, Centers for Disease Control and Prevention, National Center for Health Statistics, National Health InterviewSurvey—Youth Risk Behavior Survey, 1993,1995, and 1997.
Standard Error Tables

Table S19.1.—Standard errors for table 19.1: Percentage of students in grades 9 through 12 who reported using marijuana in the last 30 days,by selected student characteristics: 1993,1995, and 1997
Student characteristics 1993
Anywhere
1995* 1997* 1993
On school property
1995* 1997*
Total 1.22 1.03 1.11 0.65 0.59 0.52
Gender
Male
Female
Race/ethnicity
White, non-Hispanic
Black, non-Hispanic
Hispanic
Asian/Pacific Islander
Other, non-Hispanic
Grade
9th10th
11th12th
1.23
1.02
1.41
1.84
1.33
1.88
2.56
1.10
1.79
1.771.40
1.08
1.44
1.49
2.62
2.92
4.43
5.15
1.83
1.89
1.352.35
1.46
1.04
1.51
1.46
1.96
3.37
3.57
1.95
1.29
1.812.09
0.83
0.48
0.72
1.23
1.10
1.06
1.50
0.40
0.94
1.070.78
0.85
0.72
0.62
1.88
2.20
3.18
3.15
1.38
0.87
0.621.15
0.68
0.56
0.42
0.72
0.96
0.99
1.64
0.90
0.73
1.170.61
*The response rate for this survey was less than 70 percent and a full nonresponse bias analysis has not been done to date.
NOTE: "On school property" was not defined for survey respondents.
SOURCE: U.S. Department of Health and Human Services, Public Health Service, Centers for Disease Control and Prevention, National Center for Health Statistics, National Health InterviewSurvey—Youth Risk Behavior Survey, 1993,1995, and 1997.
Standard Error Tables

Table S20.1.—Standard errors for table 20.1: Percentage of students in grades 9 through 12 who reported that drugs were made available to themon school property during the last 12 months, by selected student characteristics: 1993,1995, and 1997
Student characteristics 1993 1995* 1997*
Total
Gender
Male
Female
Race/ethnicity
White, non-Hispanic
Black, non-Hispanic
Hispanic
Asian/Pacific Islander
Other, non-Hispanic
Grade
9th
10th
11th
12th
1.18
1.50
1.31
1.69
1.49
1.58
1.65
3.28
1.24
1.86
0.16
1.82
1.55
1.73
1.43
2.24
1.98
2.45
4.55
6.72
1.69
1.54
1.88
2.63
1.43
1.19
1.22
1.36
1.69
2.04
2.73
3.10
2.33
1.71
1.42
1.80
*The response rate for this survey was less than 70 percent and a full nonresponse bias analysis has not been done to date.
NOTE: "On school property" was not defined for survey respondents.
SOURCE: U.S. Department of Health and Human Services, Public Health Service, Centers for Disease Control and Prevention, National Center for Health Statistics, National Health InterviewSurvey-Youth Risk Behavior Survey, 1993,1995, and 1997.
Standard Error Tables

APPENDIX A. SCHOOL PRACTICES AND POLICIES
RELATED TO SAFETY AND DISCIPLINE*
Concern over school crime and violence has prompted many public schools totake various measures to reduce and prevent violence and ensure safety inschools. Such measures include adopting zero tolerance policies; requiring stu-dents to wear uniforms; employing various security measures such as requiringvisitor sign-in and using metal detectors; having police or other law enforcementrepresentatives stationed at the school; and offering students various types ofviolence prevention programs. Presented in this appendix are data on the im-plementation of such safety measures in public schools. This report does notevaluate the effectiveness of any of these efforts or strategies, and the inclusionof a strategy does not suggest that it is endorsed by the National Center forEducation Statistics (NCES) or the Bureau of Justice Statistics (BJS) as an ef-fective means of reducing or preventing violence. Likewise, the omission of apossible strategy does not suggest it is rejected by NCES or BJS as a policy toreduce or prevent violence. This information, along with supporting tables, wasdrawn from a recent NCES report titled Violence and Discipline Problems in U.S.Public Schools: 1996-97 (NCES 98-030). The report was based on data fromthe 1996-97 Fast Response Survey System (FRSS) Principal/School Discipli-narian Survey on School Violence. Readers should consult that report for moredetailed findings on variation by school characteristics.
Zero TolerancePolicies
• Most public schools reported having zero tolerance policies toward seriousstudent offenses (table A1). A "zero tolerance policy" was defined as aschool or district policy that mandates predetermined consequences orpunishments for specific offenses. At least 9 out of 10 schools reported zerotolerance policies for firearms (94 percent) and weapons other than firearms(91 percent). Eighty-seven percent of schools had policies of zero tolerancefor alcohol and 88 percent had zero tolerance policies for drugs. Mostschools also had zero tolerance policies for violence and tobacco (79 per-cent each).
School Uniforms • Requiring students to wear school uniforms was not common. Three per-cent of all public schools required students to wear uniforms during the1996-97 school year (table A2).
This appendix repeats information from the 1999 Indicators of School Crime and Safety report.
Appendix A. School Practices and Policies

Security Measures • Schools took a number of measures to secure their schools. For example,96 percent of public schools reported that visitors were required to sign inbefore entering the school building (table A3); 80 percent of public schoolsreported having a closed campus policy that prohibited most students fromleaving the campus for lunch; 53 percent of public schools controlled accessto their school building; and 24 percent of public schools controlled accessto their school grounds. In addition, 19 percent of public schools reportedconducting drug sweeps, with middle schools and high schools being morelikely to use drug sweeps than elementary schools (36 and 45 percent, re-spectively, versus 5 percent). While 4 percent of public schools reportedthat they performed random metal detector checks on students, daily use ofmetal detectors as a security measure was not common: only 1 percent ofpublic schools reported taking this measure.
Presence of Police orOther LawEnforcementRepresentatives inSchools
• In addition to the security measures described above, 6 percent of publicschools reported having police or other law enforcement representativesstationed 30 hours or more at the school in a typical week during the 1996-97 school year; 1 percent of schools had them stationed from 10 to 29hours; and 3 percent had them stationed from 1 to 9 hours. Twelve percentof schools did not have police or other law enforcement representatives sta-tioned during a typical week but made them available as needed, and 78percent of schools did not have any such persons stationed at their schools(table A4).
Violence Prevention orReduction Programs
• A majority of public schools (78 percent) reported having some type of for-mal school violence prevention or reduction program (table A5). The per-centage of schools with both 1 -day and ongoing programs (43 percent) washigher than schools with only ongoing programs (24 percent) and schoolswith only 1-day programs (11 percent).
Policies to PreventFirearms in School
• In the 1996-97 school year, there were over 5,000 student expulsions forpossession or use of a firearm (table A6). An additional 3,300 students weretransferred to alternative schools for possession or use of a firearm, while8,144 were placed in out-of-school suspensions lasting 5 or more days.About 5 percent of all public schools (or 4,170) took one or more of theseactions.
Appendix A. School Practices and Policies

Table A1—Percentage of public schools that reported that they have a zero tolerance policy for variousspecified student offenses, by selected school characteristics: 1996-97
Types of offenses
School characteristics
All public schools
Instructional level
Elementary school
Middle school
High school
School enrollment
Less than 300
300-999
1,000 or more
Locale
City
Urban fringe
Town
Rural
Region
Northeast
Southeast
Central
West
Percent minority enrollment
Less than 5 percent
5-19 percent
20-49 percent
50 percent or more
Percent of students eligible for free or
reduced-price school lunch
Less than 20 percent
20-34 percent
35-49 percent
70-74 percent75 percent or more
Violence
79
797580
767986
87827176
78837283
71798385
7677798084
Firearms
94
939596
939498
97959094
89959397
92949597
9294979595
Weapons other
than firearms
91
919092
899193
95908692
90898895
88929094
8890959093
Alcohol
87
878686
848885
89888288
83908291
82898790
8687898587
Drugs
88
889089
848992
91908389
84928393
83908992
8788928889
Tobacco
79
827772
768272
83807778
79807583
75807983
7782817981
SOURCE: U.S. Department of Education, National Center for Education Statistics, Fast Response Survey System, "Principal/SchoolDisciplinarian Survey on School Violence," FRSS 63,1997.
Appendix A. School Practices and Policies

Table A2—Percentage of public schools that reported that students were required to wear schooluniforms, by selected school characteristics: 1996-97
School characteristics Uniforms required
All public schools
Instructional levelElementary schoolMiddle schoolHigh school
School enrollmentLess than 300300-9991,000 or more
LocaleCityUrban fringeTownRural
RegionNortheastSoutheastCentralWest
Percent minority enrollmentLess than 5 percent5-19 percent20-49 percent50 percent or more
Percent of students eligible for free orreduced-price school lunchLess than 20 percent20-34 percent35-49 percent70-74 percent75 percent or more
*Less than 0.5 percent.•f No cases are reported in this cell, although the event defined by this cell could have been reported by some students with these
characteristics had a different sample been drawn.
SOURCE: U.S. Department of Education, National Center for Education Statistics, Fast Response Survey System, "Principal/SchoolDisciplinarian Survey on School Violence," FRSS 63,1997.
Appendix A. School Practices and Policies

Table A3—Percentage of public schools that reported that they use various types of security measures attheir schools, by selected school characteristics: 1996-97
School characteristics
All public schools
Instructional levelElementary schoolMiddle schoolHigh school
School enrollmentLess than 300300-9991,000 or more
LocaleCityUrban fringeTownRural
RegionNortheastSoutheastCentralWest
Percent minority enrollmentLess than 5 percent5-19 percent20-49 percent50 percent or more
Percent of students eligible for free orreduced-price school lunchLess than 20 percent20-34 percent35-49 percent70-74 percent75 percent or more
Visitorsmust
sign in
96
969697
919899
100989692
98999594
94979897
9499969597
Closedcampusfor moststudentsduringlunch
80
769378
678482
81857775
83867676
77817784
7477808583
Controlledaccess to
schoolbuildings
53
575140
405755
62684933
70524846
42555563
5051495758
Controlledaccess to
schoolgrounds
24
252225
162449
35312013
30281231
14222738
1819252737
One ormore drugsweeps
19
53645
221534
12132327
6241725
17231818
1720222213
Randommetal
detectorscheck onstudents
4
179
415
8322
1914
169
13548
Studentsmust passthroughmetal
detectorseach day
1
12
113
1
111
4
15
SOURCE: U.S. Department of Education, National Center for Education Statistics, Fast Response Survey System, "Principal/SchoolDisciplinarian Survey on School Violence," FRSS 63,1997.
Appendix A. School Practices and Policies

Table A4—Percentage of public schools that reported various levels of police or other law
enforcement representatives' presence during a typical week, by selected school
characteristics: 1996-97
Police or other law enforcement representatives
School characteristics
All public schools
Instructional levelElementary schoolMiddle schoolHigh school
School enrollmentLess than 300300-9991,000 or more
LocaleCityUrban fringeTownRural
RegionNortheastSoutheastCentralWest
Percent minority enrollmentLess than 5 percent5-19 percent20-49 percent50 percent or more
Percent of students eligible for free orreduced-price school lunchLess than 20 percent20-34 percent35-49 percent70-74 percent75 percent or more
Stationed at school30 hoursor more
6
11019
14
39
13751
6947
167
13
57568
10-29hours
1
132
15
411
221
1113
11
22
1-9hours
3
o>
oi
-»
137
3242
2234
3323
42314
Not stationed duringa typical week, but
available as needed
12
81718
91215
11111114
11111114
10101314
1010121314
None stationedat school
during 1996-97
78
896554
898034
69807883
81778174
85807767
7980807872
*Less than 0.5 percent.
SOURCE: U.S. Department of Education, National Center for Education Statistics, Fast Response Survey System, "Principal/SchoolDisciplinarian Survey on School Violence," FRSS 63,1997.
Appendix A. School Practices and Policies

Table A5—Percentage of public schools that reported formal school violence prevention or reductionprograms or efforts, by selected school characteristics: 1996-97
Percent of schools with:
School characteristics
All public schools
Instructional level
Elementary school
Middle school
High school
School enrollment
Less than 300
300-999
1,000 or more
Locale
City
Urban fringe
Town
Rural
Region
Northeast
Southeast
Central
West
Percent minority enrollment
Less than 5 percent
5-19 percent
20-49 percent
50 percent or more
Percent of students eligible for free or
reduced-price school lunch
Less than 20 percent
20-34 percent
35-49 percent
70-74 percent75 percent or more
Anyprograms
78
788274
688184
87827273
75847677
67788684
7375818085
Only 1-day
programs
11
97
20
14108
55
1121
8139
14
11101210
86
151612
Only ongoing
programs
24
281915
202617
25302218
27282120
20243022
2224272026
Both 1-day and
ongoing programs
43
425638
344559
57473835
40444643
36444452
4344404447
SOURCE: U.S. Department of Education, National Center for Education Statistics, Fast Response Survey System, "Principal/SchoolDisciplinarian Survey on School Violence," FRSS 63,1997.
Appendix A. School Practices and Policies

Table A6—Number and percentage of schools in which specified disciplinary actions were taken againststudents, total number of actions taken, and percentage of specific disciplinary actions takenagainst students, by type of infraction: 1996-97
Infraction
Total number Percent
of schools of schools
taking one or taking one or Total number
more of these more of these of these
specified specified specified
actions actions actions taken
Number of actions taken
Transfers to Out-of-school
alternative suspensions
schools or lasting 5 or
Expulsions programs more days
Possession or use of a firearm
Possession or use of a weapon
other than a firearm
Possession, distribution, or use of
alcohol or drugs, including tobacco
Physical attacks or fights
4,170
16,740
20,960
30,160
5
22
27
39
16,587
58,554
170,464
330,696
5,143
13,698
30,522
50,961
3,301
12,943
34,255
62,108
8,144
31,970
105,723
217,627
SOURCE: U.S. Department of Education, National Center for Education Statistics, Fast Response Survey System, "Principal/SchoolDisciplinarian Survey on School Violence," FRSS 63,1997.
Appendix A. School Practices and Policies

Table A7—Standard errors for table A1: Percentage of public schools that reported that they have a zerotolerance policy for various specified student offenses, by selected school characteristics:1996-97
Types of offenses
School characteristics
All public schools
Instructional level
Elementary school
Middle school
High school
School enrollment
Less than 300
300-999
1,000 or more
Locale
City
Urban fringe
Town
Rural
Region
Northeast
Southeast
Central
West
Percent minority enrollment
Less than 5 percent
5-19 percent
20-49 percent
50 percent or more
Percent of students eligible for free or
reduced-price school lunch
Less than 20 percent
20-34 percent
35-49 percent
70-74 percent75 percent or more
Violence
1.6
2.42.32.0
3.81.82.4
2.52.73.23.5
3.62.63.42.3
3.43.92.42.2
3.43.74.23.23.6
Firearms
1.0
1.61.41.1
2.71.00.7
1.41.52.42.0
2.51.32.11.3
2.71.81.81.2
2.22.71.81.82.2
Weapons other
than firearms
1.2
1.81.71.5
3.11.21.8
1.62.22.52.3
2.42.12.81.5
2.92.22.21.4
2.62.91.92.32.4
Alcohol
1.2
1.82.02.2
3.61.22.3
2.22.42.72.4
2.91.53.01.9
2.92.62.21.9
2.63.12.83.13.2
Drugs
1.1
1.81.81.9
3.61.21.7
2.12.22.72.3
2.91.43.01.8
2.92.62.21.9
2.73.02.82.83.2
Tobacco
1.5
2.12.32.4
3.81.52.8
2.32.63.12.9
3.62.73.32.0
3.22.92.52.1
3.03.23.23.23.4
SOURCE: U.S. Department of Education, National Center for Education Statistics, Fast Response Survey System, "Principal/SchoolDisciplinarian Survey on School Violence," FRSS 63,1997.
Appendix A. School Practices and Policies

Table A8—Standard errors for table A2: Percentage of public schools that reported that students wererequired to wear school uniforms, by selected school characteristics: 1996-97
School characteristics Uniforms required
All public schools
Instructional levelElementary schoolMiddle schoolHigh school
School enrollmentLess than 300300-9991,000 or more
0.6
0.90.8
t0.92.2
LocaleCityUrban fringeTownRural
1.91.8
RegionNortheastSoutheastCentralWest
0.91.41.01.4
Percent minority enrollmentLess than 5 percent5-19 percent20-49 percent50 percent or more
Percent of students eligible for free orreduced-price school lunchLess than 20 percent20-34 percent35-49 percent70-74 percent75 percent or more
1.02.3
0.71.21.62.6
SOURCE: U.S. Department of Education, National Center for Education Statistics, Fast Response Survey System, "Principal/SchoolDisciplinarian Survey on School Violence," FRSS 63,1997.
Appendix A. School Practices and Policies

Table A9—Standard errors for table A3: Percentage of public schools that reported that they use varioustypes of security measures at their schools, by selected school characteristics: 1996-97
School characteristics
All public schools
Instructional level
Elementary school
Middle school
High school
School enrollment
Less than 300
300-999
1,000 or more
Locale
City
Urban fringe
Town
Rural
Region
Northeast
Southeast
Central
West
Percent minority enrollment
Less than 5 percent
5-19 percent
20-49 percent
50 percent or more
Percent of students eligible for free or
reduced-price school lunch
Less than 20 percent
20-34 percent
35-49 percent
70-74 percent75 percent or more
Visitors
must
sign in
0.9
1.41.21.0
3.00.60.5
—
1.21.52.4
1.20.91.51.8
2.31.10.91.6
2.40.52.11.91.7
Closed
campus
for most
students
during
lunch
1.7
2.51.72.2
3.91.82.5
2.92.83.63.4
4.02.83.33.9
3.33.23.93.2
3.53.63.24.04.5
Controlled
access to
school
buildings
1.9
2.82.72.3
3.72.43.3
3.23.63.73.8
3.93.93.23.8
3.63.94.04.1
3.64.65.04.45.1
Controlled
access to
school
grounds
1.5
2.31.92.0
3.22.13.3
3.73.62.72.8
3.92.82.62.9
2.63.03.23.8
2.73.53.03.95.0
One or
more drug
sweeps
1.1
1.32.43.2
3.21.12.8
1.01.52.83.0
1.22.42.42.4
2.42.62.52.1
2.23.03.02.92.2
Random
metal
detectors
check on
students
0.4
0.51.01.1
—
0.61.9
1.00.80.81.0
0.51.40.30.9
—0.71.21.3
0.50.81.30.81.6
Students
must pass
through
metal
detectors
each day
0.3
—0.40.7
0.40.40.9
0.5—
0.8—
—0.70.30.7
——1.2
——
0.41.5
SOURCE: U.S. Department of Education, National Center for Education Statistics, Fast Response Survey System, "Principal/SchoolDisciplinarian Survey on School Violence," FRSS 63,1997.
Appendix A. School Practices and Policies

Table A10—Standard errors for table A4: Percentage of public schools that reported various levels of
police or other law enforcement representatives' presence during a typical week, by selected
school characteristics: 1996-97
Police or other law enforcement representatives
School characteristics
All public schools
Instructional levelElementary schoolMiddle schoolHigh school
School enrollmentLess than 300300-9991,000 or more
LocaleCityUrban fringeTownRural
RegionNortheastSoutheastCentralWest
Percent minority enrollmentLess than 5 percent5-19 percent20-49 percent50 percent or more
Percent of students eligible for free orreduced-price school lunchLess than 20 percent20-34 percent35-49 percent70-74 percent75 percent or more
Stationed at school30 hoursor more
0.4
0.51.31.6
0.40.62.6
1.41.00.90.5
1.61.10.80.9
0.30.90.91.7
0.81.01.21.22.0
10-29hours
0.3
0.40.80.7
—
0.41.4
1.20.20.5—
—0.80.80.5
0.30.30.41.3
0.50.5—0.91.3
1-9hours
0.4
0.61.11.0
0.50.61.2
0.80.61.10.8
0.90.80.80.8
0.80.80.80.9
1.00.71.10.41.4
Not stationed duringa typical week, but
available as needed
1.0
1.41.92.1
2.41.22.0
2.91.91.62.3
2.02.11.92.1
1.71.82.72.6
1.81.92.92.63.7
None stationedat school
during 1996-97
1.1
1.52.42.9
2.81.33.2
3.12.21.92.5
2.52.52.12.6
1.82.33.23.1
2.22.33.33.24.4
—Estimate of standard error is not derived because it is based on a statistic estimated at less than 0.5 percent or at 100 percent.
SOURCE: U.S. Department of Education, National Center for Education Statistics, Fast Response Survey System, "Principal/SchoolDisciplinarian Survey on School Violence," FRSS 63,1997.
Appendix A. School Practices and Policies

Table A11— Standard errors for table A5: Percentage of public schools that reported formal school
violence prevention or reduction programs or efforts, by selected school characteristics:
1996-97
Percent of schools with:
School characteristics
All public schools
Instructional level
Elementary school
Middle school
High school
School enrollment
Less than 300
300-999
1,000 or more
Locale
City
Urban fringe
Town
Rural
Region
Northeast
Southeast
Central
West
Percent minority enrollment
Less than 5 percent
5-19 percent
20-49 percent
50 percent or more
Percent of students eligible for free or
reduced-price school lunch
Less than 20 percent
20-34 percent
35-49 percent
70-74 percent75 percent or more
Anyprograms
1.5
2.32.02.2
4.21.62.8
2.63.03.53.2
4.42.53.32.8
3.73.52.72.7
3.03.04.23.63.4
Only 1-day
programs
1.2
1.61.52.4
3.01.21.5
1.41.32.33.2
2.32.81.72.3
2.01.92.62.5
1.52.03.53.23.8
Only ongoing
programs
1.6
2.51.91.8
4.01.92.5
3.33.13.12.9
4.03.42.72.5
2.82.53.73.0
2.93.74.63.84.3
Both 1-day and
ongoing programs
1.4
2.52.82.1
4.01.83.7
3.63.33.13.3
4.13.73.62.8
3.63.13.73.4
3.43.93.83.94.6
SOURCE: U.S. Department of Education, National Center for Education Statistics, Fast Response Survey System, "Principal/SchoolDisciplinarian Survey on School Violence," FRSS 63,1997.
Appendix A. School Practices and Policies

Table A12—Standard errors for table A6: Number and percentage of schools in which specifieddisciplinary actions were taken against students, total number of actions taken, andpercentage of specific disciplinary actions taken against students, by type of infraction:1996-97
Infraction
Total number Percent
of schools of schools
taking one or taking one or Total number
more of these more of these of these
specified specified specified
actions actions actions taken
Number of actions taken
Transfers to Out-of-school
alternative suspensions
schools or lasting 5 or
Expulsions programs more days
Possession or use of a firearm
Possession or use of a weapon
other than a firearm
Possession, distribution, or use of
alcohol or drugs, including tobacco
Physical attacks or fights
480.6
969.1
782.7
1,081.4
0.6
1.3
1.0
1.4
3,778.2
3,781.8
8,734.6
15,964.2
1,094
1,091
2,767
5,537
1,139
1,304
4,129
8,125
2,495
2,714
6,234
12,087
SOURCE: U.S. Department of Education, National Center for Education Statistics, Fast Response Survey System, "Principal/SchoolDisciplinarian Survey on School Violence," FRSS 63,1997.
Appendix A. School Practices and Policies

APPENDIX B. TECHNICAL NOTES
GeneralInformation
The information presented in this report was obtained from many data sources,
including databases from the National Center for Education Statistics (NCES),
the Centers for Disease Control and Prevention (CDC), and the Bureau of Jus-
tice Statistics (BJS). While some of the data were collected from universe sur-
veys, most were gathered by sample surveys. Some questions from different
surveys may appear the same, but they were actually asked of different popula-
tions of students (e.g., high school seniors or students in grades 9 through 12);
in different years; about experiences that occurred within different periods of
time (e.g., in the past 4 weeks or during the past 12 months); and at different
locations (e.g., in school or at home). Readers of this report should take par-
ticular care when comparing data from the different data sources. Because of
the variation in collection procedures, timing, phrasing of questions, and so forth,
the results from the different sources may not be strictly comparable. After intro-
ducing the data sources used for this report, the next section discusses the ac-
curacy of estimates and describes the statistical procedures used.
Sources of Data Table B1 presents some key information for each of the data sets used in the
report, including the survey year, target population, response rates, and sample
sizes. The remainder of the section briefly describes each data set and provides
directions for obtaining more information. The exact wording of the interview
questions used to construct the indicators are presented in table B2.
Schools and StaffingSurvey (SASS)
This report draws upon data on teacher victimization from the 1993-94 Schools
and Staffing Survey (SASS:93-94), which provides national- and state-level data
on public and private schools, principals, school districts, and teachers. The
1993-94 survey was the third in a series of cross-sectional, school-focused sur-
veys, following ones conducted in 1990-91 and 1987-88. It consisted of four
sets of linked questionnaires, including surveys of schools, the principals of each
selected school, a subsample of teachers within each school, and public school
districts. Data were collected by multistage sampling. Stratified by state, control,
type, association membership, and grade level (for private schools), schools
were sampled first. Approximately 9,900 public schools and 3,300 private
schools were selected to participate in the 1993-94 SASS. Within each school,
teachers were further stratified into one of five teacher types in the following hi-
erarchy: 1) Asian or Pacific Islander; 2) American Indian, Aleut, or Eskimo;
3) bilingual/ESL; 4) new teachers (those with 1 to 3 years of experience); and
Appendix B. Technical Notes

5) experienced teachers (those with more than 3 years of experience). Withineach teacher stratum, teachers were selected systematically with equal prob-ability. Approximately 56,700 public school teachers and 11,500 private schoolteachers were sampled.
This report focuses on teachers' responses. The overall weighted responserates were 84 percent for public school teachers and 73 percent for privateschool teachers. In the Public School Teacher Questionnaire, 91 percent of theitems had a response rate of 90 percent or more, and in the Private SchoolTeacher Questionnaire, 89 percent of the items had this level of response. Val-ues were imputed for questionnaire items that should have been answered butwere not. For additional information about SASS, refer to R. Abramson, C. Cole,S. Fondelier, B. Jackson, R. Parmer, and S. Kaufman, 1996, 1993-94 Schoolsand Staffing Survey: Sample Design and Estimation (NCES 96-089), or contact:
Kerry GruberNational Center for Education Statistics1990 K Street NWWashington, DC 20006Telephone: (202) 502-7349E-mail: [email protected]
National School-BasedYouth Risk BehaviorSurvey (YRBS)
The National School-Based Youth Risk Behavior Survey (YRBS) is one compo-nent of the Youth Risk Behavior Surveillance System (YRBSS), an epidemiol-ogical surveillance system that was developed by the Centers for DiseaseControl and Prevention (CDC) to monitor the prevalence of youth behaviors thatmost influence health. The YRBS focuses on priority health-risk behaviors es-tablished during youth that result in the most significant mortality, morbidity, dis-ability, and social problems during both youth and adulthood. This report uses1993,1995, and 1997 YRBS data.
The YRBS used a three-stage cluster sampling design to produce a nationallyrepresentative sample of students in grades 9 through 12 in the United States.The target population consisted of all public and private school students ingrades 9 through 12 in the 50 states and the District of Columbia. The first-stagesampling frame included selecting primary sampling units (PSUs) from strataformed on the basis of urbanization and the relative percentage of black andHispanic students in the PSU. These PSUs are either large counties or groups ofsmaller, adjacent counties. At the second stage, schools were selected withprobability proportional to school enrollment size. Schools with substantial num-bers of black and Hispanic students were sampled at relatively higher rates thanall other schools. The final stage of sampling consisted of randomly selecting
Appendix B. Technical Notes

within each chosen school at each grade 9 through 12 one or two intact classesof a required subject, such as English or social studies. All students in selectedclasses were eligible to participate. Approximately 16,300,10,900, and 16,300students were selected to participate in the 1993 survey, the1995 survey, andthe 1997 survey, respectively.
The overall response rate was 70 percent for the 1993 survey, 60 percent for the1995 survey, and 69 percent for the 1997 survey. NCES standards call for re-sponse rates of 70 percent or better and bias analyses are called for by NCESwhen that percentage is not achieved. For the YRBS data, a full nonresponsebias analysis has not been done to date. The weights were developed to adjustfor nonresponse and the oversampling of black and Hispanic students in thesample. The final weights were normalized so that only weighted proportions ofstudents (not weighted counts of students) in each grade matched nationalpopulation projections. For additional information about the YRBS, contact:
Laura KannDivision of Adolescent and School HealthNational Center for Chronic Disease Prevention and Health PromotionCenters for Disease Control and Prevention, Mailstop K-334770 Buford Highway NEAtlanta, Georgia 30341Telephone: (404) 488-5330E-mail: [email protected]
Fast Response SurveySystem:Principal/SchoolDisciplinarian Surveyon School Violence
The Principal/School Disciplinarian Survey was conducted through the NCESFast Response Survey System (FRSS) during the spring and summer of 1997.The FRSS is a survey system designed to collect small amounts of issue-oriented data with minimal burden on respondents and within a relatively shorttime frame. The FRSS Principal/School Disciplinarian Survey focused on inci-dents of specific crimes/offenses and a variety of specific discipline issues inpublic schools. The survey was conducted with a nationally representative sam-ple of regular public elementary, middle, and high schools in the 50 states andthe District of Columbia. Special education, alternative and vocational schools,schools in the territories, and schools that taught only prekindergarten, kinder-garten, or adult education were not included in the sample.
The sample of public schools was selected from the 1993-94 NCES CommonCore of Data (CCD) Public School Universe File. The sample was stratified byinstructional level, locale, and school size. Within the primary strata, schoolswere also sorted by geographic region and by percent minority enrollment. Thesample sizes were then allocated to the primary strata in rough proportion to the
Appendix B. Technical Notes

aggregate square root of the size of enrollment of schools in the stratum. A total
of 1,415 schools were selected. Among them, 11 schools were found no longer
to be in existence, and 1,234 schools completed the survey. In April 1997, ques-
tionnaires were mailed to school principals, who were asked to complete the
survey or to have it completed by the person most knowledgeable about disci-
pline issues at the school. The raw response rate was 88 percent (1,234 schools
divided by the 1,404 eligible schools in the sample). The weighted overall re-
sponse rate was 89 percent, and item nonresponse rates ranged from 0 percent
to 0.9 percent. The weights were developed to adjust for the variable probabili-
ties of selection and differential nonresponse and can be used to produce na-
tional estimates for regular public schools in the 1996-97 school year. For more
information about the FRSS: Principal/School Disciplinarian Survey on School
Violence, contact:
Shelley BurnsNational Center for Education Statistics1990 K Street NWWashington, DC 20006Telephone: (202) 502-7319E-mail: [email protected]
National CrimeVictimization Survey(NCVS)
The National Crime Victimization Survey (NCVS), administered for the U.S. Bu-
reau of Justice Statistics by the Bureau of the Census, is the nation's primary
source of information on crime victimization and the victims of crime. Initiated in
1972 and redesigned in 1992, the NCVS collects detailed information on the
frequency and nature of the crimes of rape, sexual assault, robbery, aggravated
and simple assault, theft, household burglary, and motor vehicle theft experi-
enced by Americans and their households each year. The survey measures
crimes reported as well as those not reported to police.
The NCVS sample consists of about 55,000 households selected using a strati-
fied, multi-stage cluster design. In the first stage, the primary sampling units
(PSUs), consisting of counties or groups of counties, are selected. In the second
stage, smaller areas, called Enumeration Districts (EDs), were selected from
each sampled PSU. Finally, from selected EDs, clusters of four households,
called segments, were selected for interview. At each stage, the selection was
done proportionate to population size in order to create a self-weighting sample.
The final sample was augmented to account for housing units constructed after
the decennial Census. Within each sampled household, Census Bureau person-
nel interviewed all household members ages 12 and older to determine whether
they had been victimized by the measured crimes during the 6 months preced
Appendix B. Technical Notes
ing the interview. About 90,000 persons ages 12 and older are interviewed each6 months. Households remain in sample for 3 years and are interviewed 7 timesat 6-month intervals. The initial interview at each sample unit is used only tobound future interviews to establish a time frame to avoid duplication of crimesuncovered in these subsequent interviews. After their seventh interview, house-holds are replaced by new sample households. The NCVS has consistently ob-tained a response rate of about 95 percent at the household level. During thestudy period, the completion rates for persons within households were about 91percent. Thus, final response rates were about 86 percent. Weights were devel-oped to permit estimates for the total U.S. population 12 years and older. Formore information about the NCVS, contact:
Michael PlantyVictimization StatisticsU.S. Bureau of Justice Statistics810 7th Street NWWashington, DC 20531Telephone: (202) 514-3214E-mail: [email protected]: www.ojp.usdoj.gov/bjs/
School CrimeSupplement (SCS)
Created as a supplement to the NCVS and co-designed by the National Centerfor Education Statistics and Bureau of Justice Statistics, the School Crime Sup-plement (SCS) survey was conducted in 1989,1995, and 1999 to collect addi-tional information about school-related victimizations on a national level. Thesurvey was designed to assist policymakers as well as academic researchersand practitioners at the federal, state, and local levels so that they can makeinformed decisions concerning crime in schools. The SCS asks students a num-ber of key questions about their experiences with and perceptions of crime andviolence that occurred inside their school, on school grounds, or on the way to orfrom school. Additional questions not included in the NCVS were also added tothe SCS, such as those concerning preventive measures used by the school,students' participation in afterschool activities, students' perceptions of schoolrules, the presence of weapons and street gangs in school, the presence ofhate-related words and graffiti in school, student reports of bullying at school,and the availability of drugs and alcohol in school, as well as attitudinal ques-tions relating to fear of victimization and avoidance behavior in school.
In 1989,1995, and 1999, the SCS was conducted for a 6-month period fromJanuary through June in all households selected for the NCVS (see discussionabove for information about the sampling design). It should be noted that theinitial interview is included in the SCS data analysis. Within these households,
Appendix B. Technical Notes

the eligible respondents for the SCS were those household members who had
attended school at any time during the 6 months preceding the interview, and
were enrolled in grades 6 through 12 in a school that would help them advance
toward eventually receiving a high school diploma. Eligible respondents were
asked the supplemental questions in the SCS only after completing their entire
NCVS interview. For the 1989 and the 1995 SCS, 19-year-old household mem-
bers also were considered eligible for the SCS interview. This upper age range
was lowered to 18 for eligibility in the 1999 SCS because it was determined that
most 19-year-olds did not meet the other eligibility requirement of being currently
enrolled in a secondary school. In this report, 19-year-olds were excluded from
the analysis of the 1995 data in order to meet the eligibility requirements and to
allow for comparisons to the 1999 SCS. However, the 19-year-olds were not
dropped from the analysis of the 1989 data.
Comparisons between the 1989 data and the 1995 and 1999 data should be
made with caution due to the redesign of the NCVS in 1992. A new victimization
screening procedure, put in place in 1992, was meant to elicit a more complete
tally of victimization incidents than did the one used in prior NCVS collections.
Therefore, NCVS item-based cross-year changes in reported victimization rates,
or lack thereof, may only be the result of changes in how the questions were
asked and not of actual changes in the incidence of victimization. Because
NCVS questionnaires were completed before students were given the SCS, it is
likely that these changes to the NCVS victimization screening procedures differ-
entially affected responses to the 1989 and 1995 SCS victimization items. Other
items in this report, such as fear at school, avoidance of places at school, and
reports of gangs at school, followed the victimization items on the SCS survey.
Unlike prior Indicators reports, the prevalence of victimization for 1995 and 1999
was calculated by using NCVS incident variables appended to the 1995 and
1999 SCS data files. The NCVS type of crime variable was used to classify vic-
timizations of students in the SCS as serious violent, violent, or theft. The NCVS
variables asking where the incident happened and what the victim was doing
when it happened were used to ascertain whether the incident happened at
school. For prevalence of victimization, the NCVS definition of at school includes
in the school building, on school property, or on the way to or from school.
Total victimization is a combination of violent victimization and theft. If the stu-
dent reported an incident of either, he or she is counted as having experienced
"total" victimization. If the student reported having experienced both, he or she is
counted once under "total victimization." Serious violent crimes include rape,
sexual assault, robbery, and aggravated assault. Violent crimes include serious
violent crimes and simple assault.
Appendix B. Technical Notes

A total of 10,449 students participated in the 1989 SCS, 9,728 in the 1995 SCSand 8,398 in 1999. In the 1999 SCS, the household completion rate was 94 per-cent. In the 1989 and 1995 SCS, the household completion rates were 97 per-cent and 95 percent, respectively, and the student completion rates were 86percent and 78 percent, respectively. For the 1999 SCS, the student completionrate was 78 percent. Thus, the overall SCS response rate (calculated by multi-plying the household completion rate by the student completion rate) was 84percent in 1989,74 percent in 1995 and 73 percent in 1999. Response rates formost survey items were high—mostly over 95 percent of all eligible respondents.The weights were developed to compensate for differential probabilities of se-lection and nonresponse. The weighted data permit inferences about the eligiblestudent population who were enrolled in schools in 1989,1995 and 1999. Formore information about SCS, contact:
Kathryn A. ChandlerNational Center for Education Statistics1990 K Street NWWashington, DC 20006Telephone: (202) 502-7326E-mail: [email protected]
School AssociatedViolent Death Study(SAVD)
The School Associated Violent Death Study (SAVD) is an epidemiological studydeveloped by the Centers for Disease Control and Prevention in conjunction withthe U.S. Department of Education and the U.S. Department of Justice. SAVDseeks to describe the epidemiology of school-associated violent deaths, identifycommon features of these deaths, estimate the rate of school-associated violentdeath in the United States, and identify potential risk factors for these deaths.The study includes descriptive data on all school-associated violent deaths inthe United States including all homicides, suicides and firearm-related deathswhere the fatal injury occurred on the campus of a functioning elementary orsecondary school, while the victim was on the way to or from regular sessions atsuch a school, or while attending or on the way to or from an official school-sponsored event. Victims of such events include nonstudents as well as stu-dents and staff members. SAVD includes descriptive information about theschool, event, victim(s) and offender(s). The first SAVD study collected data forJuly 1,1992-June 30,1994 and the follow-up study includes July 1,1994-June30,1999. The follow-up study is nearing completion, and data presented in thisreport include preliminary findings for the 1997-1998 school year.
SAVD uses a four step process to identify and collect data on school-associatedviolent deaths. Cases were initially identified through a search of the Lexis/Nexisand Dialog newspaper and media databases. Then police officials are contactedto confirm the details of the case to determine if the event meets the case
Appendix B. Technical Notes

definition. Once a case is confirmed, a police official and a school official areinterviewed in regards to details about the school, event, victim(s), and of-fender(s). If police officials are unwilling or unable to complete the interview, acopy of the full police report is obtained. The information obtained about schoolsincludes school demographics, attendance/absentee rates, suspen-sion/expulsions and mobility, school history of weapon carrying, security meas-ures, violence prevention activities, school response to the event and schoolpolicies about weapon carrying. Event information includes the location of injury,the context of injury (while classes held, during break etc.), motives for injury,method of injury, and school and community events happening around the time-period. Information obtained on victim(s) and offender(s) includes demographics,circumstances of the event (date/time, alcohol or drug use, number of personsinvolved), types and origins of weapons, criminal history, psychological risk fac-tors, school related problems, extracurricular activities, and family history in-cluding structure and stressors.
One-hundred and five school-associated violent deaths were identified from July1,1992-June 30,1994 (See Kachur et al. June 12,1996. JAMA. 275:22:1729-1733). While the current study is still ongoing, over 250 school-associated vio-lent deaths have been identified for July 1,1994-June 30,1999. The first studyachieved a response rate of 85% for police officials and 81% for school officials.To date, the current study has achieved 96% for police officials and 79% forschool officials. For additional information about SAVD, contact:
Mark AndersonDivision of Violence PreventionNational Center for Injury Prevention and ControlCenters for Disease Control and Prevention, Mailstop K604770 Buford Highway NEAtlanta, GA 30341Telephone: (404) 488-4762E-mail: [email protected]
Accuracy ofEstimates
The accuracy of any statistic is determined by the joint effects of "nonsampling"and "sampling" errors. Both types of error affect the estimates presented in thisreport. Several sources can contribute to nonsampling errors. For example,members of the population of interest are inadvertently excluded from the sam-pling frame; sampled members refuse to answer some of the survey questions(item nonresponse) or all of the survey questions (questionnaire nonresponse);mistakes are made during data editing, coding, or entry; the responses that re-spondents provide differ from the "true" responses; or measurement instrumentssuch as tests or questionnaires fail to measure the characteristics they are in-tended to measure. Although nonsampling errors due to questionnaire and item
Appendix B. Technical Notes

nonresponse can be reduced somewhat by the adjustment of sample weights
and imputation procedures, correcting nonsampling errors or gauging the effects
of these errors is usually difficult.
Sampling errors occur because observations are made on samples rather than
on entire populations. Surveys of population universes are not subject to sam-
pling errors. Estimates based on a sample will differ somewhat from those that
would have been obtained by a complete census of the relevant population us-
ing the same survey instruments, instructions, and procedures. The standard
error of a statistic is a measure of the variation due to sampling; it indicates the
precision of the statistic obtained in a particular sample. In addition, the standard
errors for two sample statistics can be used to estimate the precision of the dif-
ference between the two statistics and to help determine whether the difference
based on the sample is large enough so that it represents the population differ-
ence.
Most of the data used in this report were obtained from complex sampling de-
signs rather than a simple random design. In these sampling designs, data were
collected through stratification, clustering, unequal selection probabilities, or
multistage sampling. These features of the sampling usually result in estimated
statistics that are more variable (that is, have larger standard errors) than they
would have been if they had been based on data from a simple random sample
of the same size. Therefore, calculation of standard errors requires procedures
that are markedly different from the ones used when the data are from a simple
random sample. The Taylor series approximation technique or the balanced
repeated replication (BRR) method was used to estimate most of the statistics
and their standard errors in this report. Table B3 lists the various methods used
to compute standard errors for different data sets.
Standard error calculation for data from the National Crime Victimization Survey
and the School Crime Supplement relied on a combination of procedures. For
statistics based on the 1995 and 1999 SCS data, the Taylor series approxima-
tion method using PSU and strata variables available from the data set was em-
ployed. For statistics based on all years of NCVS data and the 1989 SCS data,
standard errors were derived from a formula developed by the Census Bureau,
which consists of three generalized variance function (gvf) constant parameters
that represent the curve fitted to the individual standard errors calculated using
the Jackknife Repeated Replication technique. The formulas used to compute
the adjusted standard errors associated with percentages or population counts
can be found in table B3.
Appendix B. Technical Notes

StatisticalProcedures
The comparisons in the text have been tested for statistical significance to en-sure that the differences are larger than might be expected due to samplingvariations. Unless otherwise noted, all statements cited in the report are statisti-cally significant at the .05 level. Several test procedures were used, dependingupon the type of data being analyzed and the nature of the statement beingtested. The primary test procedure used in this report was the Student's t statis-tic, which tests the difference between two sample estimates, for example, be-tween males and females. The formula used to compute the tstatistic is asfollows:
where E1 and E2 are the estimates to be compared and se1 and se2 are their cor-responding standard errors. Note that this formula is valid only for independentestimates. When the estimates are not independent (for example, when com-paring a total percentage with that for a subgroup included in the total), a covari-ance term (i.e., 2*se1*se2) must be added to the denominator of the formula:
(2)
Once the tvalue was computed, it was compared with the published tables ofvalues at certain critical levels, called alpha levels. For this report, an alphavalue of 0.05 was used, which has a t value of 1.96. If the t value was largerthan 1.96, then the difference between the two estimates was statistically signifi-cant at the 95 percent level.
When multiple comparisons among more than two groups were made, for ex-ample, among racial/ethnic groups, a Bonferroni adjustment to the significancelevel was used to ensure that the significance level for the tests as a group wasat the .05 level. Generally, when multiple statistical comparisons are made, itbecomes increasingly likely that an indication of a population difference is erro-neous. Even when there is no difference in the population, at an alpha of .05,there is still a 5 percent chance of concluding that an observed t value repre-senting one comparison in the sample is large enough to be statistically signifi-cant. As the number of comparisons increase, the risk of making such anerroneous inference also increases. The Bonferroni procedure corrects the sig-nificance (or alpha) level for the total number of comparisons made within a par-ticular classification variable. For each classification variable, there are (K*(K-1)/2) possible comparisons (or nonredundant pairwise combinations), where K isthe number of categories. The Bonferroni procedure divides the alpha level for asingle ttest by the number of possible pairwise comparisons in order to produce
Appendix B. Technical Notes

a new alpha level that is corrected for the fact that multiple contrasts are being
made. As a result, the tvalue for a certain alpha level (e.g., .05) increases,
which makes it more difficult to claim that the difference observed is statistically
significant.
Finally, a linear trend test was used when a statement describing a linear trend,
rather than the differences between two discrete categories, was made. This test
allows one to examine whether, for example, the percentage of students using
drugs increased (or decreased) over time or whether the percentage of students
who reported being physically attacked in school increased (or decreased) with
their age. Based on a regression with, for example, student's age as the inde-
pendent variable and whether a student was physically attacked as the depend-
ent variable, the test involves computing the regression coefficient (b) and its
corresponding standard error (se). The ratio of these two (b/se) is the test statis-
tic t. If t is greater than 1.96, the critical value for one comparison at the .05 al-
pha level, the hypothesis that there is a linear relationship between student's
age and being physically attacked is not rejected.
Appendix B. Technical Notes

Table B1.—Descriptions of data sources and samples used in the report
Data source
Schools and Staffing Survey(Teacher Survey) (NCES)
Youth Risk BehaviorSurvey (CDC)
FRSS Principal/SchoolDisciplinarian Survey (NCES)
National CrimeVictimization Survey (BJS)
School Crime Supplement(BJS/NCES)
School Associated Violent DeathStudy (SAVD)
Target population
A nationally representative sample of publicand private school teachers from gradesK through 12.
A nationally representative sample of studentsenrolled in grades 9 through 12 in public andprivate schools at the time of the survey.
A nationally representative sample of regularpublic elementary, middle, and secondaryschools.
A nationally representative sample of individuals12 years of age and older living in householdsand group quarters.
A nationally representative sample of studentsages 12 through 19 (for 1989) and 12 through 18(for 1995 and 1999) enrolled in public and privateschools during the 6 months prior to the interview.
Population of school-associated violent deaths inthe U.S. between July 1,1997-June 30,1998. Datacollected from two sources: a school official and apolice official.
Year ofsurvey
1993-1994
199319951997
1996-1997
1992-1998(Annual)
198919951999
1997-1998
Responserate (%)
84 (public)1
73 (private)1
702
6 0 2
6 9 2
891
About 862
832
742
732
79 (schools)96 (police)
Samplesize
47,1058,372
16,29610,90416,262
1,234
About90,000
10,4499,7288,398
N/A
Appendix B. Technical Notes

Table B2.—Wording of survey questions used to construct indicators
Survey Questions Response Categories
Nonfatal Student Victimization
National Crime Victimization Survey1
(Screen Questionnaire)• I'm going to read some examples that will give you an idea of the kinds of crimes this study
covers. As I go through them, tell me if any of these happened to you in the last 6 months.That is since________, 19__. Was something belonging to you stolen, such asThings that you carry, like luggage, a wallet, purse, briefcase, bookClothing, jewelry, or calculatorBicycle or sports equipmentOr did anyone attempt to steal anything belonging to you?
• (Other than any incidents already mentioned,) Since______, 19__ were you attacked orthreatened or did you have something stolen from youAt work or schoolOr did anyone attempt to attack or attempt to steal anything belonging to you from any ofthese places?
• (Other than any incidents already mentioned,) has anyone attacked or threatened you inany of these ways (exclude telephone threats):With any weapon, for instance, a gun or knifeWith anything like a baseball bat, frying pan, scissors, or stickBy something thrown, such as a rock or bottleInclude any grabbing, punching, or chokingAny rape, attempted rape or other type of sexual attackAny face to face threatsOr any attack or threat or use of force by anyone at all?Please mention it even if you are not certain it was a crime.
• People often don't think of incidents committed by someone they know. (Other than anyincidents already mentioned,) did you have something stolen from you or were youattacked or threatened by (exclude telephone threats):Someone at work or school?
• Incidents involving forced or unwanted sexual acts are often difficult to talk about. (Otherthan any incidents already mentioned,) Have you been forced or coerced to engage inunwanted sexual activity by:Someone you didn't know beforeA casual acquaintance
Or someone you know well?
Yes/No; if yes, Whathappened? If yes, howmany times?
Yes/No; if yes, whathappened? If yes, howmany times?
Yes/No; if yes, whathappened? If yes, howmany times?
Yes/No; if yes, whathappened? If yes, howmany times?
Yes/No; if yes, whathappened? If yes, howmany times?
Appendix B. Technical Notes

Table B2.—Wording of survey questions used to construct indicators—Continued
Survey Questions Response Categories
National Crime Victimization Survey1
(Incident Report) Where did this incident happen?
What were you doing when this incident (happened/started)?
Youth Risk Behavior Survey During the past 12 months, how many times has someone threatened or injured you witha weapon such as a gun, knife, or club on school property?
During the last 12 months, how many times were you in a physical fight?
During the last 12 months, how many times were you in a physical fighton school property?
• During the past 12 months, how many times has someone stolen or deliberately damagedyour property such as your car, clothing, or books on school property?
In own home or lodging/Nearown home/At, in or near afriend's/relative's/neighbor'shome/Commercial places/Parking lots/garages/School/Open areas, on street of publictransportation/Other
Working or on duty/On the way to or from work/Onthe way to or from school/Onthe way to of from otherplace/Shopping, errands/Attending school/Leisureactivity away from home/Sleeping/Other activities athome/Other
0 times/1 time/2-3 times/4-5times/6-7 times/8-9 times/10-11 times/12 or more times
0 times/1 time/2-3 times/4-5times/6-7 times/8-9 times/10-11 times/12 or more times
0 times/1 time/2-3 times/4-5times/6-7 times/8-9 times/10-11 times/12 or more times
0 times/1 time/2-3 times/4-5times/6-7 times/8-9 times/10-11 times/12 or more times
Appendix B. Technical Notes

Table B2.—Wording of survey questions used to construct indicators—Continued
Survey Questions Response Categories
School Crime Supplement1
Violence and Crime at SchoolFRSS Principal/SchoolDisciplinarian Survey
Nonfatal Teacher Victimization
National Crime Victimization Survey1
(Screen Questionnaire)
During the last 6 months, have you been bullied at school? That is, has anyone picked onyou a lot or tried to make you do things you didn't want to do like give them money? Youmay include incidents you reported before.
• During the 1996-97 school year, how many incidents involving each type of the followingcrimes or offenses have occurred at your school? Only include incidents in which police orother law enforcement representatives were contacted.MurderRape or other type of sexual batterySuicidePhysical attack or fight with a weaponPhysical attack or fight without a weaponRobberyTheft/larcenyVandalism
• I'm going to read some examples that will give you an idea of the kinds of crimes this
study covers. As I go through them, tell me if any of these happened to you in the last 6months. That is since 19Was something belonging to you stolen, such asThings that you carry, like luggage, a wallet, purse, briefcase, bookClothing, jewelry, or calculatorBicycle or sports equipmentOr did anyone attempt to steal anything belonging to you?
19__ were you attacked or(Other than any incidents already mentioned,) Sincethreatened or did you have something stolen from youAt work or schoolOr did anyone attempt to attack or attempt to steal anything belonging to youfrom any of these places?
Yes/No
Actual number ofincidents in whichpolice or other law en-forcement representativeswere contacted
Yes/No; if yes, Whathappened? If yes, howmany times?
Yes/No; if yes, Whathappened? If yes, howmany times?
Appendix B. Technical Notes

Table B2.—Wording of survey questions used to construct indicators—Continued
Survey Questions Response Categories
National Crime Victimization Survey1 (continued)
National Crime Victimization Survey1
(Incident Report)
• (Other than any incidents already mentioned,) has anyone attacked or threatened you inany of these ways (exclude telephone threats):With any weapon, for instance, a gun or knifeWith anything like a baseball bat, frying pan, scissors, or stickBy something thrown, such as a rock or bottleInclude any grabbing, punching, or chokingAny rape, attempted rape or other type of sexual attackAny face to face threatsOr any attack or threat or use of force by anyone at all?Please mention it even if you are not certain it was a crime.
• People often don't think of incidents committed by someone they know. (Other than anyincidents already mentioned,) did you have something stolen from you or were youattacked or threatened by (exclude telephone threats):Someone at work or school?
• Incidents involving forced or unwanted sexual acts are often difficult to talk about. (Otherthan any incidents already mentioned,) Have you been forced or coerced to engage inunwanted sexual activity by:Someone you didn't know beforeA casual acquaintanceOr someone you know well?
• Which of the following best describes your job?
• Where did this incident happen?
• What were you doing when this incident (happened/started)?2
• Did this incident happen at your worksite?
Yes/No; if yes, Whathappened? If yes, howmany times?
Yes/No; if yes, Whathappened? If yes, howmany times?
Yes/No; if yes, Whathappened? If yes, howmany times?
If Teaching Profession,were you employed in a(n)Elementary/Junior high orMiddle school/High school
Inside a school building/On school property
Working or on duty
Yes/No
Appendix B. Technical Notes

Table B2.—Wording of survey questions used to construct indicators—Continued
Survey Questions Response Categories
Schools and Staffing Survey
School EnvironmentYouth Risk Behavior Survey
Yes/No
Yes/No
0 days/1 day/2-3 days/3-5days/6-9 days/10 or more
0 days/1 day/2-3 days/3-5days/6-9 days/10 or more
0 days/1 day/2 days/days/6-9 days/10-19 days/20 to 29 days/all 30 days
0 days/1 day/2 days/days/6-9 days/10-19 days/20 to 29 days/all 30 days
0 days/1 day/2 days/days/6-9 days/10-19 days/20 to 29 days/all 30 days
0 days/1 day/2 days/days/6-9 days/10-19 days/20 to 29 days/all 30 days
Yes/No
Appendix B. Technical Notes
• Has a student (from this school) threatened to injure you in the past 12 months?
• Has a student (from this school) physically attacked you in the past 12 months?
• During the past 30 days, on how many days did you carry a weapon such as a gun, knife?
• During the past 30 days, on how many days did you carry a weapon such as a gun, knife,or club on school property?
• During the past 30 days, on how many days did you have at least one drink of alcohol?
• During the past 30 days, on how many days did you have at least one drink of alcohol onschool property?
• During the past 30 days, on how many days did you use marijuana?
• During the past 30 days, on how many days did you use marijuana on school property?
• During the past 12 months, has anyone offered, sold or given you an illegal drug onschool property?
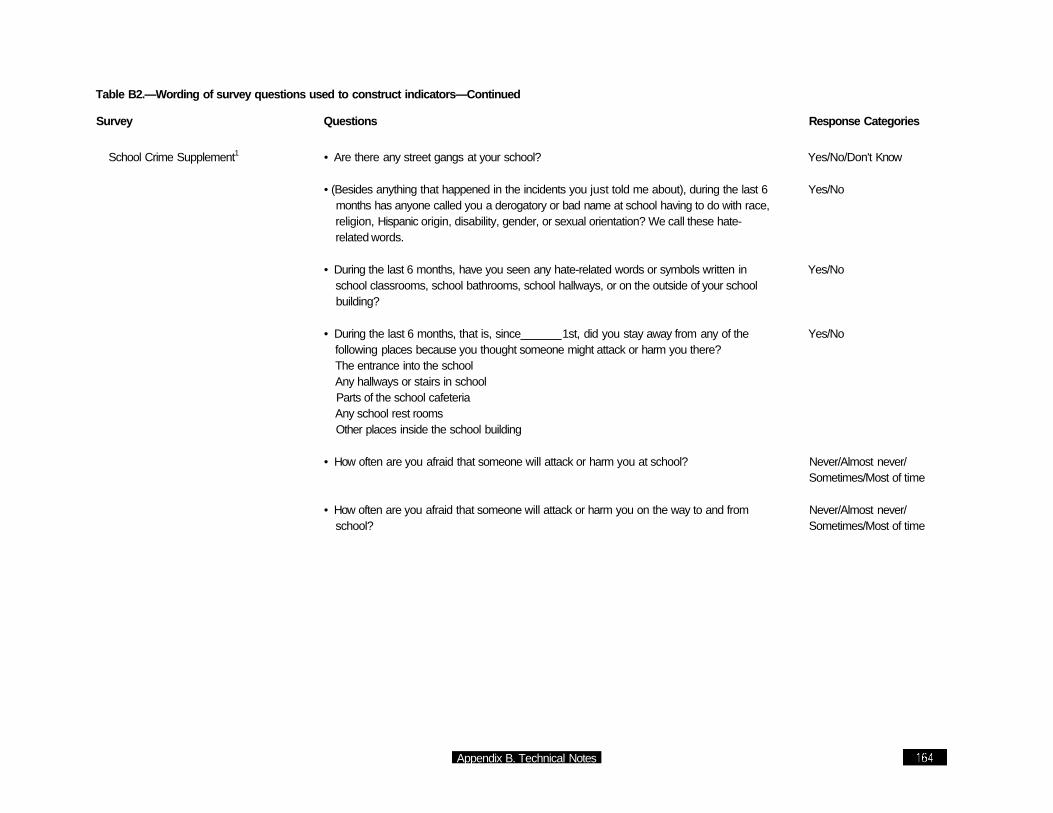
Table B2.—Wording of survey questions used to construct indicators—Continued
Survey Questions Response Categories
School Crime Supplement1 Yes/No/Don't Know
Yes/No
Yes/No
Yes/No
Never/Almost never/Sometimes/Most of time
Never/Almost never/Sometimes/Most of time
Appendix B. Technical Notes
• Are there any street gangs at your school?
• (Besides anything that happened in the incidents you just told me about), during the last 6months has anyone called you a derogatory or bad name at school having to do with race,religion, Hispanic origin, disability, gender, or sexual orientation? We call these hate-related words.
• During the last 6 months, have you seen any hate-related words or symbols written inschool classrooms, school bathrooms, school hallways, or on the outside of your schoolbuilding?
• During the last 6 months, that is, since 1st, did you stay away from any of thefollowing places because you thought someone might attack or harm you there?The entrance into the schoolAny hallways or stairs in schoolParts of the school cafeteriaAny school rest roomsOther places inside the school building
• How often are you afraid that someone will attack or harm you at school?
• How often are you afraid that someone will attack or harm you on the way to and fromschool?

Table B2.—Wording of survey questions used to construct indicators—Continued
Survey Questions Response Categories
FRSS Principal/SchoolDisciplinarian Survey
• Circle the number indicating to what extent, if any, each of the following has been aproblem in your school during the 1996-97 school year:Student tardinessStudent absenteeism/class cuttingPhysical conflicts among studentsRobbery or theft of items over $10Vandalism of school propertyStudent alcohol useStudent drug useSale of drugs on school groundsStudent tobacco useStudent possession of weaponsTrespassingVerbal abuse of teachersPhysical abuse of teachersTeacher absenteeismTeacher alcohol or drug useRacial tensionsGangs
1) Serious/2) Moderate/3) Minor/4) Not a problem
1 Readers should note that this table reflects the most recent version of the NCVS (1998) and SCS (1999) instruments. Survey items shown here may have changed from past NCVS and SCS collec-tions.
Estimates of teacher victimizations include crimes occurring to teachers at school (location), or at the worksite (location), or while working (activity). For thefts, activity was not considered, sincethefts of teachers' property kept at school can occur when teachers are not present.
Appendix B. Technical Notes

Table B3.—Methods used to calculate standard errors of statistics for different surveys
Survey Year Method of calculation
National Crime Victimization Survey 1992 to 1998 Standard errors of crime level data and aggregatedcrime rates per 1,000 persons were calculated usingthree generalized variance function (gvf) constantparameters (denoted as a, b, and c) and formulas(published in Appendix II, pp. 144-148) of CriminalVictimization in the United States 1998 Statistical Tables(NCJ181585) on the Bureau of Justice Statistics website:http://www.ojp.usdoj.gov/bjs/abstract/cvusst.htm.
The formula used to calculate standard errors (q) ofcrime level data (x) is:
where x is the estimated number of crimes of interest,and a, b, and c are gvf constant parameters.
The formula used to calculate standard errors ofaggregated crime rates per 1,000 persons (r) is:
where r is the aggregate crime rate (i.e., 1000* totalcrimes / total population), y is the aggregated basepopulation, and b and c are gvf constant parameters.
The three gvf constant parameters associated with thespecific years are:Year1992199319941995199619971998Aggregated datafrom 1994 to 98
a-0.00013407-0.00007899-0.00006269-0.00006269-0.000068630.000169720.00001297-0.00000075
b4,8722,8702,2782,2782,4942,9452,6564,200
c3.8582.2731.8041.8041.9752.0103.3901.631
School Crime Supplement
Readers should note that the annual parameters pub-lished in this year's report differ slightly from those pro-vided in previous reports.
1989,1995, Standard errors of percentage and population counts wereand 1999 calculated using the Taylor series approximation method
using PSU and strata variables from the 1995 and 1999data sets. Another way in which the standard errors can becalculated for these years is by using the generalized vari-ance function (gvf) constant parameters (denoted as a, b &c). The gvf parameters were used to calculate the standarderrors for the 1989 data in this report.
Appendix B. Technical Notes

Table B3.—Methods used to calculate standard errors of statistics for different surveys—Continued
Survey Year Method of calculation
Schools and Staffing Survey
FRSS Principal/SchoolDisciplinarian Survey
Youth Risk Behavior Survey
The formula used to calculate standard errors forpercentages (p) is:
where p is the percentage or interest expressed as aproportion, y is the size of the population to which thepercent applies, and b and c are gvf constantparameters. After the standard error is estimated, it ismultiplied by 100 to make it applicable to the percentage.
The formula used to calculate standard errors ofpopulation counts (x) is:
where x is the estimated number of students whoexperienced a given event, and a, b, and c are gvfconstant parameters.
The three gvf constant parameters associated with thespecific years are:Year198919951999
a-0.00001559-0.00006269-0.00026646
b c3,108 0.0002,278 1.8042,579 2.826
1993-1994 Balanced repeated replication method using replicateweights available from the data set.
1997 Balanced repeated replication method using replicateweights available from the data set.
1993,1995, Taylor series approximation method using PSU andand 1997 strata variables available from the data set.
Appendix B. Technical Notes

APPENDIX C. GLOSSARY OF TERMS
General Terms
Cluster sampling
Crime
Incident
Multi-stage sampling
Prevalence
School
School crime
School year
Stratification
Cluster sampling is a technique in which the sampling of respondents or sub-
jects occurs within clusters or groups. For example, selecting students by sam-
pling schools and the students that attend that school.
Any violation of a statute or regulation or any act that the government has de-
termined is injurious to the public, including felonies and misdemeanors. Such
violation may or may not involve violence, and it may affect individuals or prop-
erty.
A specific criminal act or offense involving one or more victims and one or more
offenders.
A survey sampling technique in which there is more than one wave of sampling.
That is, one sample of units is drawn, and then another sample is drawn within
that sample. For example, at the first stage, a number of Census blocks may be
sampled out of all the Census blocks in the United States. At the second stage,
households are sampled within the previously sampled Census blocks.
The percentage of the population directly affected by crime in a given period.
This rate is based upon specific information elicited directly from the respondent
regarding crimes committed against his or her person, against his or her prop-
erty, or against an individual bearing a unique relationship to him or her. It is not
based upon perceptions and beliefs about, or reactions to, criminal acts.
An education institution consisting of one or more of grades K through 12.
Any criminal activity that is committed on school property.
The 12-month period of time denoting the beginning and ending dates for school
accounting purposes, usually from July 1 through June 30.
Stratification is a survey sampling technique in which the target population is
divided into mutually exclusive groups or strata based on some variable or vari-
ables (e.g. metropolitan area) and sampling of units occurs separately within
each stratum.
Appendix C. Glossary of Terms

Unequal probabilities A survey sampling technique in which sampled units do not have the same
probability of selection into the sample. For example, the investigator may over-
sample minority students in order to increase the sample sizes of minority stu-
dents. Minority students would then be more likely than non-minority students to
be sampled.
Specific Terms Used in Various Surveys
National Crime Victimization Survey
At school (students)
At school (teachers)
Aggravated assault
Rape
Robbery
Rural
Serious violent crime
Sexual assault
Inside the school building, on school property (school parking area, play area,
school bus, etc.), or on the way to or from school.
Inside the school building, on school property (school parking area, play area,
school bus, etc.), at work site, or while working. For thefts, "while working" was
not considered, since thefts of teachers' property kept at school can occur when
teachers are not present.
Attack or attempted attack with a weapon, regardless of whether or not an injury
occurs, and attack without a weapon when serious injury results.
Forced sexual intercourse including both psychological coercion as well as
physical force. Forced sexual intercourse means vaginal, anal, or oral penetra-
tion by the offender(s). This category also includes incidents where the penetra-
tion is from a foreign object such as a bottle.
Completed or attempted theft, directly from a person, of property or cash by
force or threat of force, with or without a weapon, and with or without injury.
A place not located inside the Metropolitan Statistical Area (MSA). This category
includes a variety of localities, ranging from sparsely populated rural areas to
cities with populations of less than 50,000.
Rape, sexual assault, robbery, or aggravated assault.
A wide range of victimizations, separate from rape or attempted rape. These
crimes include attacks or attempted attacks generally involving unwanted sexual
contact between the victim and offender. Sexual assault may or may not involve
force and includes such things as grabbing or fondling. Sexual assault also in-
cludes verbal threats.
Appendix C. Glossary of Terms

Simple assault
Suburban
Theft
Victimization
Victimization rate
Violent crime
Urban
School Crime Supplement
At school
Any victimization
Property victimization
Violent victimization
Youth Risk Behavior Survey
Attack without a weapon resulting either in no injury, minor injury, or in undeter-
mined injury requiring less than 2 days of hospitalization. Also includes at-
tempted assault without a weapon.
A county or counties containing a central city, plus any contiguous counties that
are linked socially and economically to the central city. On the data tables, sub-
urban areas are categorized as those portions of metropolitan areas situated
"outside central cities."
Completed or attempted theft of property or cash without personal contact.
A crime as it affects one individual person or household. For personal crimes,
the number of victimizations is equal to the number of victims involved. The
number of victimizations may be greater than the number of incidents because
more than one person may be victimized during an incident.
A measure of the occurrence of victimizations among a specific population
group.
Rape, sexual assault, robbery, or assault.
The largest city (or grouping of cities) in an MSA.
In the school building, on the school grounds, or on a school bus.
Combination of violent and property victimization. If a student reported an inci-
dent of either, he or she is counted as having experienced any victimization. If
the student reported having experienced both, he or she is counted once under
"any victimization."
Theft of property from a student's desk, locker, or other locations at school.
Physical attacks or taking property from the student directly by force, weapons,
or threats.
On school property On school property is included in the question wording but was not defined for
respondents.
Appendix C. Glossary of Terms

Weapon
Illegal drugs
Any instrument or object used with the intent to threaten, injure, or kill. Examples
of weapons appearing in the questionnaire include guns, knives, and clubs.
Examples of illegal drugs were marijuana, cocaine, inhalants, steroids, or pre-
scription drugs without a doctor's permission, LSD, PCP, ecstasy, mushrooms,
speed, ice, and heroin.
FRSS Principal/School Disciplinarian Survey
At school
Central region
City
Elementary school
Free/reduced-price
lunch
High school/combined
Less serious or
nonviolent crime
Minority enrollment
Middle school
Northeast region
In school buildings, on school buses, on school grounds, or at places that hold
school-sponsored events or activities, but are not officially on school grounds.
Illinois, Indiana, Iowa, Kansas, Michigan, Minnesota, Missouri, Nebraska, North
Dakota, Ohio, South Dakota, and Wisconsin.
A central city of a Metropolitan Statistical Area (MSA).
A school that has a low grade of 3 or less and a high grade of 1 through 8.
The percent of students enrolled in the school who are eligible for the federally
funded free or reduced-price lunch program.
A school that has a low grade of 9 through 12 and a high grade of 10 through 12.
Schools that do not precisely meet these qualifications, and are not elementary
and middle schools, are classified as "combined" and are included in the analy-
ses with high schools.
Physical attack or fight without a weapon, theft or larceny, or vandalism.
The percent of students enrolled in the school whose race or ethnicity is classi-
fied as one of the following: American Indian or Alaskan Native, Asian or Pacific
Islander, black, or Hispanic, based on data in the 1993-94 Common Core of
Data (CCD) file.
A school that has a low grade of 4 through 9 and a high grade of 4 through 9.
Connecticut, Delaware, District of Columbia, Maine, Maryland, Massachusetts,
New Hampshire, New Jersey, New York, Pennsylvania, Rhode Island, and Ver-
mont.
Appendix C. Glossary of Terms

Robbery
Physical attack or fight
Rural
School enrollment
Serious violent crime
Sexual battery
Southeast region
Theft or larceny
Town
Urban fringe
Vandalism
West region
Schools and Staffing Survey
Central city
The taking or attempting to take anything of value that is owned by another per-
son or organization, under confrontational circumstances by force or threat of
force or violence and/or by putting the victim in fear.
An actual and intentional touching or striking of another person against his or her
will, or the intentional causing of bodily harm to an individual. This category
should be used only when the attack is serious enough to warrant calling the po-
lice or other law enforcement representative.
A place with a population less than 2,500 and defined as rural by the U.S. Bu-
reau of the Census.
Total number of students enrolled as defined by the 1993-94 CCD.
Murder, suicide, rape or sexual battery, physical attack or fight with a weapon, or
robbery.
An incident that includes rape, fondling, indecent liberties, child molestation, or
sodomy.
Alabama, Arkansas, Florida, Georgia, Kentucky, Louisiana, Mississippi, North
Carolina, South Carolina, Tennessee, Virginia, and West Virginia.
The unlawful taking of another person's property without personal confrontation,
threat, violence, or bodily harm.
A place not within an MSA, but with a population greater than or equal to 2,500
and defined as urban by the U.S. Bureau of the Census.
A place within an MSA of a central city, but not primarily its central city.
The damage or destruction of school property.
Alaska, Arizona, California, Colorado, Hawaii, Idaho, Montana, Nevada, New
Mexico, Oklahoma, Oregon, Texas, Utah, Washington, and Wyoming.
A large central city (a central city of a Metropolitan Statistical Area [MSA] with
population greater than or equal to 400,000, or a population density greater than
or equal to 6,000 per square mile) or a mid-size central city (a central city of an
MSA, but not designated as a large central city).
Appendix C. Glossary of Terms

Elementary school
teachers
Rural or small town
Secondary school
teachers
Urban fringe or
large town
An elementary school teacher is one who, when asked for the grades taught,
checked: 1) only "ungraded" and was designated as an elementary teacher on
the list of teachers provided by the school; 2) 6th grade or lower, or "ungraded,"
and no grade higher than 6th; 3) 6th grade or lower and 7th grade or higher, and
reported a primary assignment of prekindergarten, kindergarten, or general ele-
mentary; 4) 7th and 8th grades only, and reported a primary assignment of pre-
kindergarten, kindergarten, or general elementary; 5) 6th grade or lower and 7th
grade or higher, and reported a primary assignment of special education and
was designated as an elementary teacher on the list of teachers provided by the
school; or 6) 7th and 8th grades only, and reported a primary assignment of
special education and was designated as an elementary teacher on the list of
teachers provided by the school. A teacher at school that has grade 6 or lower,
or one that is "ungraded" with no grade higher than the 8th.
Rural area (a place with a population of less than 2,500 and defined as rural by
the U.S. Bureau of the Census) or a small town (a place not within an MSA, with
a population of less than 25,000, but greater than or equal to 2,500, and defined
as nonurban by the U.S. Bureau of the Census).
A secondary school teacher is one who, when asked for the grades taught,
checked: 1) "ungraded" and was designated as a secondary teacher on the list
of teachers provided by the school; 2) 6th grade or lower and 7th grade or
higher, and reported a primary assignment other than prekindergarten, kinder-
garten, or general elementary; 3) 9th grade or higher, or 9th grade or higher and
"ungraded"; 4) 7th and 8th grades only, and reported a primary assignment other
than prekindergarten, kindergarten, general elementary, or special education;
5) 7th and 8th grades only, and reported a primary assignment of special educa-
tion and was designated as a secondary teacher on the list of teachers provided
by the school; or 6) 6th grade or lower and 7th grade or higher, or 7th and 8th
grades only, and was not categorized above as either elementary or secondary.
Urban fringe of a large or mid-size city (a place within an MSA of a mid-size
central city and defined as urban by the U.S. Bureau of the Census) or a large
town (a place not within an MSA, but with a population greater or equal to
25,000 and defined as urban by the U.S. Bureau of the Census).
S. Patrick Kachur et al., "School-Associated Violent Deaths in the United States, 1992 to 1994"
Homicide An act involving a killing of one person by another resulting from interpersonal
violence.
Appendix C. Glossary of Terms

School-associated
violent death
Suicide
A homicide or suicide in which the fatal injury occurred on the campus of a
functioning elementary or secondary school in the United States, while the victim
was on the way to or from regular sessions at such a school, or while the victim
was attending or traveling to or from an official school-sponsored event. Victims
included nonstudents as well as students and staff members.
An act of taking one's own life voluntarily and intentionally.
Appendix C. Glossary of Terms