national capital region freight plan executive … · national capital region freight plan....
TRANSCRIPT

DRAFT
National Capital Region Freight Plan Executive Summary
June 2016

ABOUT THE TPB
The National Capital Region Transportation Planning Board (TPB) is the federally designated
metropolitan planning organization (MPO) for metropolitan Washington. It is responsible for
developing and carrying out a continuing, cooperative, and comprehensive transportation planning
process in the metropolitan area. Members of the TPB include representatives of the transportation
agencies of the states of Maryland and Virginia and the District of Columbia, 22 local governments,
the Washington Metropolitan Area Transit Authority, the Maryland and Virginia General Assemblies,
and nonvoting members from the Metropolitan Washington Airports Authority and federal agencies.
The TPB is staffed by the Department of Transportation Planning at the Metropolitan Washington
Council of Governments (COG).
CREDITS
Editor: Jon Schermann
Contributing Editor: Andrew Meese
ACCOMMODATIONS
Alternative formats of this document are available upon request;
visit www.mwcog.org/accommodations or call (202) 962-3300 or (202) 962-3213 (TDD).
Copyright © 2015 by the Metropolitan Washington Council of Governments


This plan is dedicated to Karin C. Foster (1977-2013),
friend, colleague, freight planning expert, and consummate professional.

Note on the Executive Summary Version:
This Executive Summary provides excerpts of key information from the National Capital Region
Freight Plan. For more information and further detail on these topics, please refer to the full report.

TABLE OF CONTENTS
TABLE OF CONTENTS
LIST OF FIGURES
INTRODUCTION 1
Freight Planning in the National Capital Region 1
THE MULTIMODAL FREIGHT SYSTEM 4
Freight Transportation System Overview 4
Trucking and the Region’s Roads 4 Railroads 7 Air Cargo 9
FREIGHT DEMAND 11
National Capital Region Commodities 11
FREIGHT TRENDS AND ISSUES 14
Trends Impacting Freight in the Region 14
REGIONAL FREIGHT POLICIES 22
Freight Policy Background 22 TPB Freight Policies 22
RECOMMENDATIONS AND NEXT STEPS 24
Actions Related to Maintaining and Strengthening the Regional Freight Planning Process 24 Strategic Regional Freight Planning Activities 24
LIST OF FIGURES
FIGURE ES 1: REGIONAL FREIGHT-SIGNIFICANT NETWORK 5
FIGURE ES 2: AVERAGE TRUCK AADT 6
FIGURE ES 3: AVERAGE TRUCK PERCENTAGE 7
FIGURE ES 4: REGIONAL FREIGHT RAIL NETWORK 8
FIGURE ES 5: RAILROAD FREIGHT DENSITY 8
FIGURE ES 6: MAJOR CARGO AIRPORTS SERVING THE NATIONAL CAPITAL REGION 9
FIGURE ES 7: TOTAL FREIGHT (WEIGHT AND VALUE) BY DIRECTION 12
FIGURE ES 8: TOTAL FREIGHT (WEIGHT AND VALUE) BY MODE 13
FIGURE ES 9: TRANSPORTATION MODES USED (BY WEIGHT) – NATIONAL CAPITAL REGION
AND UNITED STATES 13
DRAFT National Capital Region Freight Plan – Executive Summary I 1
INTRODUCTION
The National Capital Region’s (hereafter referred to as “the Region”) multimodal transportation
system is vital to the economy of the Region and to the quality of life of its residents. It connects
people and businesses to important regional activity centers and to major domestic and
international markets. Each year hundreds of millions tons of freight valued in the billions of dollars
move over the Region’s roadways and railways and pass through its airports. The Region’s service-
based economy, with its growing employment, population, and wealth will continue to drive demand
for freight in the foreseeable future. Economic growth along the eastern seaboard, throughout the
nation, and across the world will also result in greater quantities of goods moving into, out of, and
through the Region–especially along the I-95 corridor. Evolving logistics practices, changes in where
goods are produced and how they are distributed, expansion of the Panama Canal, and increasing
urbanization are but a few of the factors that will impact how freight will move across the Region in
the future. The Transportation Planning Board (TPB) as the Metropolitan Planning Organization
(MPO) for the National Capital Region has an important role to play in ensuring that the regional
transportation system continues to be responsive to and supportive of the freight demands placed
upon it by its residents, businesses, and visitors.
Freight Planning in the National Capital Region TRANSPORTATION PLANNING BOARD VISION The TPB Transportation Vision, adopted in 1998, provides a framework to guide the Region’s
transportation planning and investment decisions into the 21st century. It lays out eight broad goals
with associated objectives and strategies. Two of the goals are closely tied to freight transportation
(see below) and are supported by this Plan:
Goal 2: The Washington metropolitan region will develop, implement, and maintain an
interconnected transportation system that enhances quality of life and promotes a strong and
growing economy throughout the region, including a healthy regional core and dynamic regional
activity centers with a mix of jobs, housing, and services in a walkable environment.
Goal 2, Objective 3. A web of multi-modal transportation connections which provide convenient
access (including improved mobility with reduced reliance on the automobile) between the
regional core and regional activity centers, reinforcing existing transportation connections and
creating new connections where appropriate.
Goal 8, Strategy 5: Develop a regional plan for freight movement.
The Region’s service-based economy, growing employment and population, and increasing wealth will continue to drive demand for freight. .
DRAFT National Capital Region Freight Plan – Executive Summary I 2
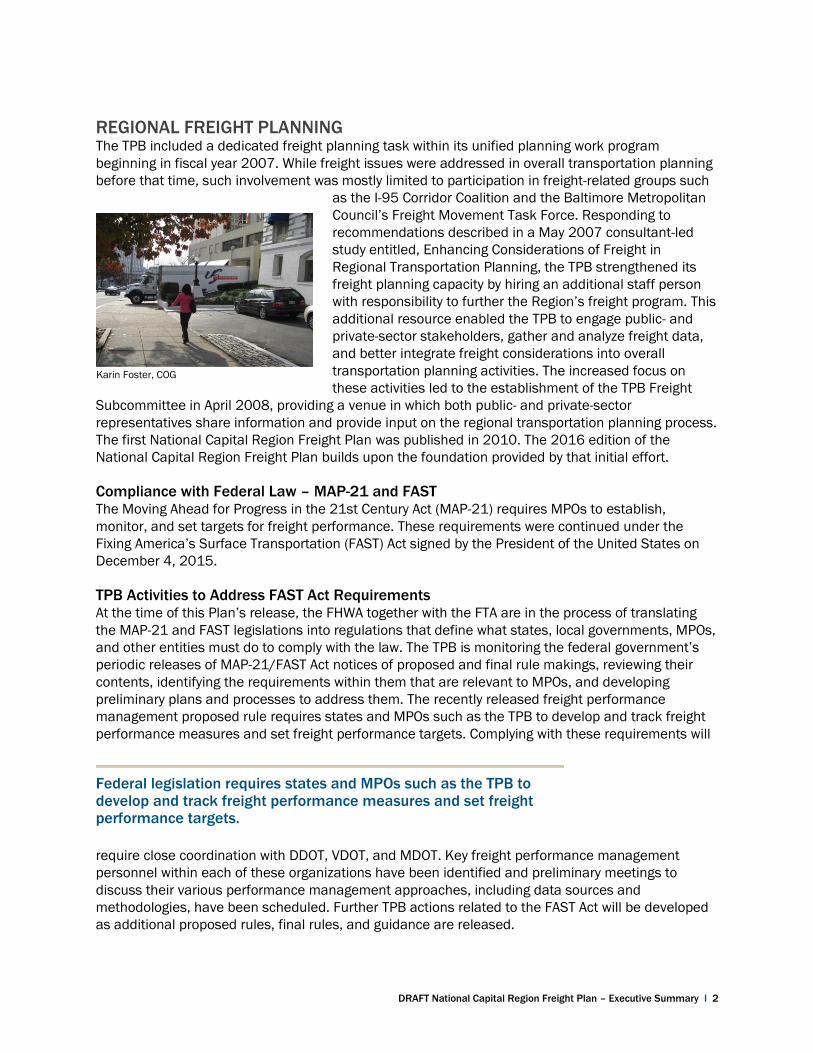
REGIONAL FREIGHT PLANNING The TPB included a dedicated freight planning task within its unified planning work program
beginning in fiscal year 2007. While freight issues were addressed in overall transportation planning
before that time, such involvement was mostly limited to participation in freight-related groups such
as the I-95 Corridor Coalition and the Baltimore Metropolitan
Council’s Freight Movement Task Force. Responding to
recommendations described in a May 2007 consultant-led
study entitled, Enhancing Considerations of Freight in
Regional Transportation Planning, the TPB strengthened its
freight planning capacity by hiring an additional staff person
with responsibility to further the Region’s freight program. This
additional resource enabled the TPB to engage public- and
private-sector stakeholders, gather and analyze freight data,
and better integrate freight considerations into overall
transportation planning activities. The increased focus on
these activities led to the establishment of the TPB Freight
Subcommittee in April 2008, providing a venue in which both public- and private-sector
representatives share information and provide input on the regional transportation planning process.
The first National Capital Region Freight Plan was published in 2010. The 2016 edition of the
National Capital Region Freight Plan builds upon the foundation provided by that initial effort.
Compliance with Federal Law – MAP-21 and FAST The Moving Ahead for Progress in the 21st Century Act (MAP-21) requires MPOs to establish,
monitor, and set targets for freight performance. These requirements were continued under the
Fixing America’s Surface Transportation (FAST) Act signed by the President of the United States on
December 4, 2015.
TPB Activities to Address FAST Act Requirements At the time of this Plan’s release, the FHWA together with the FTA are in the process of translating
the MAP-21 and FAST legislations into regulations that define what states, local governments, MPOs,
and other entities must do to comply with the law. The TPB is monitoring the federal government’s
periodic releases of MAP-21/FAST Act notices of proposed and final rule makings, reviewing their
contents, identifying the requirements within them that are relevant to MPOs, and developing
preliminary plans and processes to address them. The recently released freight performance
management proposed rule requires states and MPOs such as the TPB to develop and track freight
performance measures and set freight performance targets. Complying with these requirements will
require close coordination with DDOT, VDOT, and MDOT. Key freight performance management
personnel within each of these organizations have been identified and preliminary meetings to
discuss their various performance management approaches, including data sources and
methodologies, have been scheduled. Further TPB actions related to the FAST Act will be developed
as additional proposed rules, final rules, and guidance are released.
Federal legislation requires states and MPOs such as the TPB to develop and track freight performance measures and set freight performance targets. .
Karin Foster, COG
DRAFT National Capital Region Freight Plan – Executive Summary I 3
FREIGHT PLANNING IN MEMBER JURISDICTIONS Among TPB member jurisdictions, the state-level agencies are the most engaged in freight planning
activities. The District of Columbia, the State of Maryland, and the Commomwealth of Virginia have
each developed studies and plans that include regionally significant freight-related provisions.
While many of the TPB’s non-state member jurisdictions have not developed freight-specific plans,
some of them address freight issues within their respective planning documents. One member
jurisdiction, Frederick County Maryland, developed a freight-specific document. The Frederick County
Freight and Land Use Plan (2011) provides transportation infrastructure recommendations and a set
of land-use tools the county can use to improve the coordination between freight related land uses
and the multimodal transportation system. TPB staff works closely with the states and local
jurisdictions to ensure coordination among state, regional, and local freight plans.
DRAFT National Capital Region Freight Plan – Executive Summary I 4
THE MULTIMODAL FREIGHT SYSTEM
Freight Transportation System Overview The region’s multimodal freight transportation system consists of:
More than 16,000 miles of roadways carrying more than 300 million tons of goods annually.
Two Class I railroads – CSX Transportation and the Norfolk Southern Corporation – operating over
250 miles of mainline track and carrying more than 47 million tons of local freight annually.
Two major cargo airports – Washington Dulles International Airport and Baltimore Washington
International Thurgood Marshall Airport.
An extensive pipeline network that carries more than nine million tons of freight per year.
A number of key intermodal connectors – short roadway segments that tie rail terminal facilities,
airports, and pipeline terminal facilities to the National Highway System (NHS).
Trucking and the Region’s Roads The region’s highway system is organized into the following categories:
Interstate – More than 230 miles of 4- to 10-lane highways that connect the region to the rest of
the nation.
Primary – More than 2,400 miles of 2- to 8-lane roads that connect communities within the Region
to each other and to the interstates.
Secondary – More than 2,100 miles of connector roads.
Local – More than 12,000 miles of local streets.
THE REGIONAL FREIGHT-SIGNIFICANT NETWORK Certain components of the region’s highway system are particularly important for goods movement.
Each of the Region’s member states, Maryland, Virginia, and the District of Columbia have identified
a designated truck network linking major freight shipping and receiving areas and accommodating
through state freight movement. Within the Region, most of these state designated truck routes are
represented by interstate highways and major arterials. At the regional level, the importance of
roadways other than state designated truck routes is also recognized. These regionally freight-
significant roadways function as important connectors between retail establishments, warehouse
and distribution centers, and state-designated truck routes.
TPB staff, in consultation with the TPB Freight Subcommittee, identified a network of these freight-
important roadways using a combination of data analysis and collective expertise. The resulting
regional freight significant network is organized into three tiers.
The regional freight significant network is a system of truck-allowed routes that are particularly important for goods movement. .
DRAFT National Capital Region Freight Plan – Executive Summary I 5
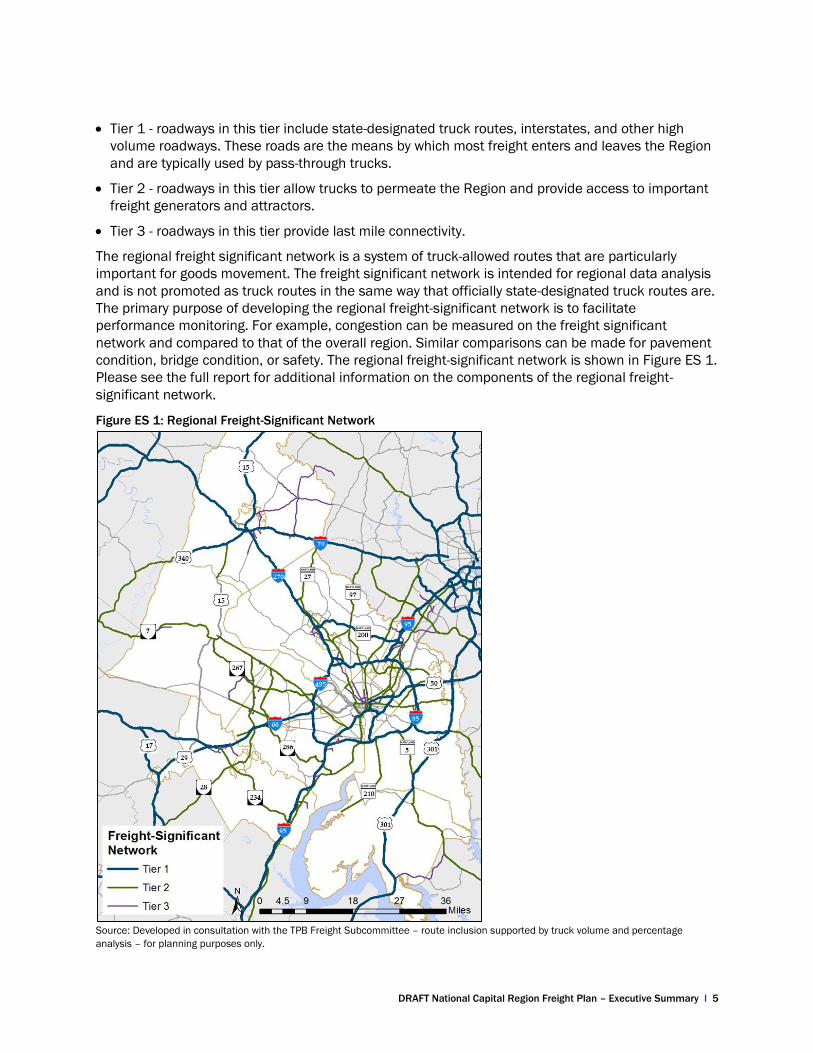
Tier 1 - roadways in this tier include state-designated truck routes, interstates, and other high
volume roadways. These roads are the means by which most freight enters and leaves the Region
and are typically used by pass-through trucks.
Tier 2 - roadways in this tier allow trucks to permeate the Region and provide access to important
freight generators and attractors.
Tier 3 - roadways in this tier provide last mile connectivity.
The regional freight significant network is a system of truck-allowed routes that are particularly
important for goods movement. The freight significant network is intended for regional data analysis
and is not promoted as truck routes in the same way that officially state-designated truck routes are.
The primary purpose of developing the regional freight-significant network is to facilitate
performance monitoring. For example, congestion can be measured on the freight significant
network and compared to that of the overall region. Similar comparisons can be made for pavement
condition, bridge condition, or safety. The regional freight-significant network is shown in Figure ES 1.
Please see the full report for additional information on the components of the regional freight-
significant network.
Source: Developed in consultation with the TPB Freight Subcommittee – route inclusion supported by truck volume and percentage
analysis – for planning purposes only.
Figure ES 1: Regional Freight-Significant Network
DRAFT National Capital Region Freight Plan – Executive Summary I 6
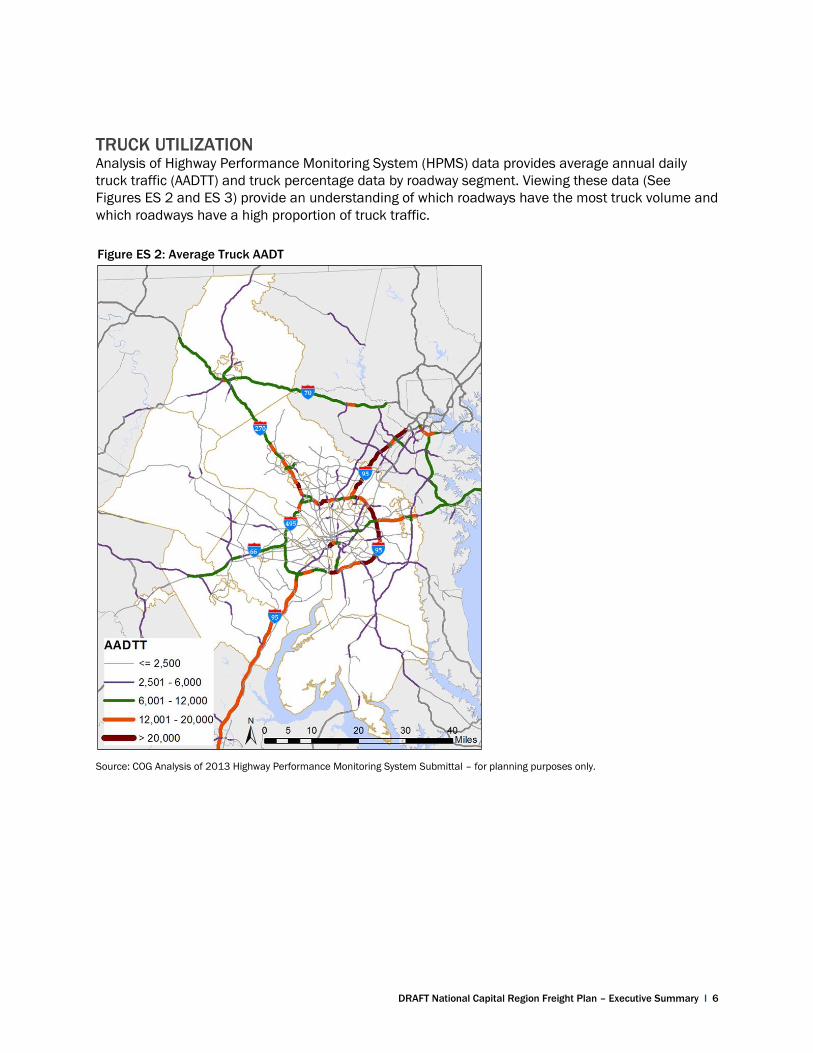
TRUCK UTILIZATION Analysis of Highway Performance Monitoring System (HPMS) data provides average annual daily
truck traffic (AADTT) and truck percentage data by roadway segment. Viewing these data (See
Figures ES 2 and ES 3) provide an understanding of which roadways have the most truck volume and
which roadways have a high proportion of truck traffic.
Source: COG Analysis of 2013 Highway Performance Monitoring System Submittal – for planning purposes only.
Figure ES 2: Average Truck AADT
DRAFT National Capital Region Freight Plan – Executive Summary I 7
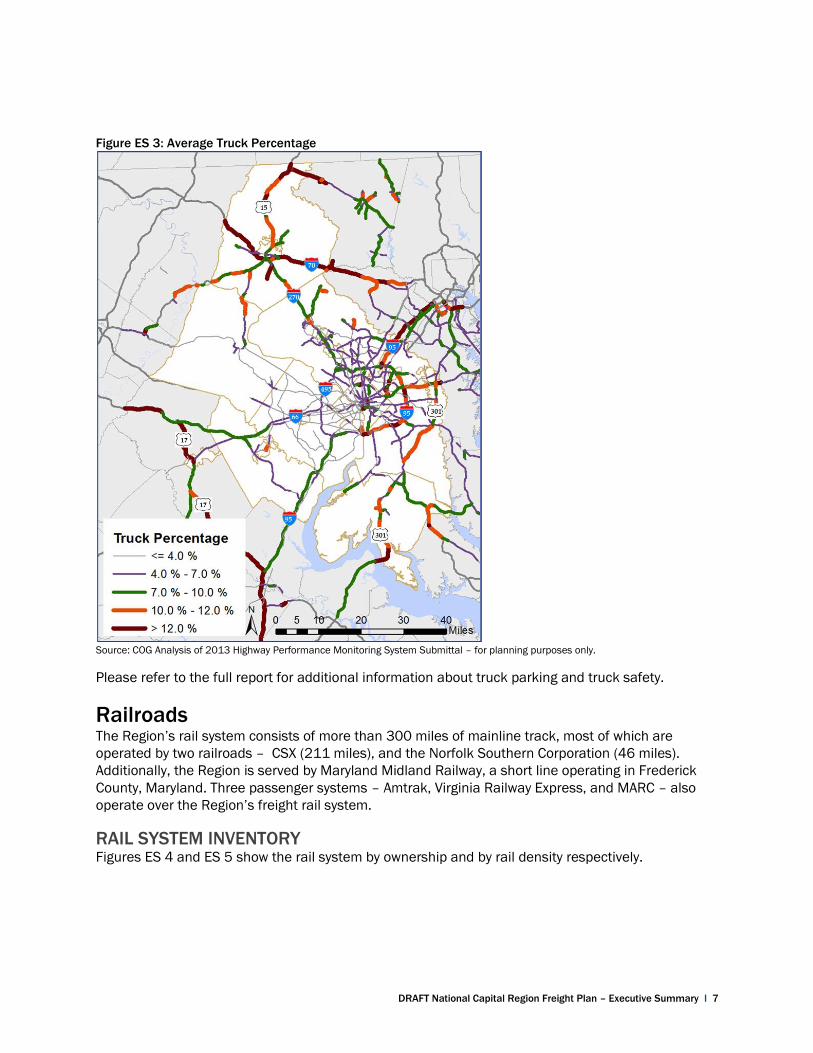
Figure ES 3: Average Truck Percentage
Source: COG Analysis of 2013 Highway Performance Monitoring System Submittal – for planning purposes only.
Please refer to the full report for additional information about truck parking and truck safety.
Railroads The Region’s rail system consists of more than 300 miles of mainline track, most of which are
operated by two railroads – CSX (211 miles), and the Norfolk Southern Corporation (46 miles).
Additionally, the Region is served by Maryland Midland Railway, a short line operating in Frederick
County, Maryland. Three passenger systems – Amtrak, Virginia Railway Express, and MARC – also
operate over the Region’s freight rail system.
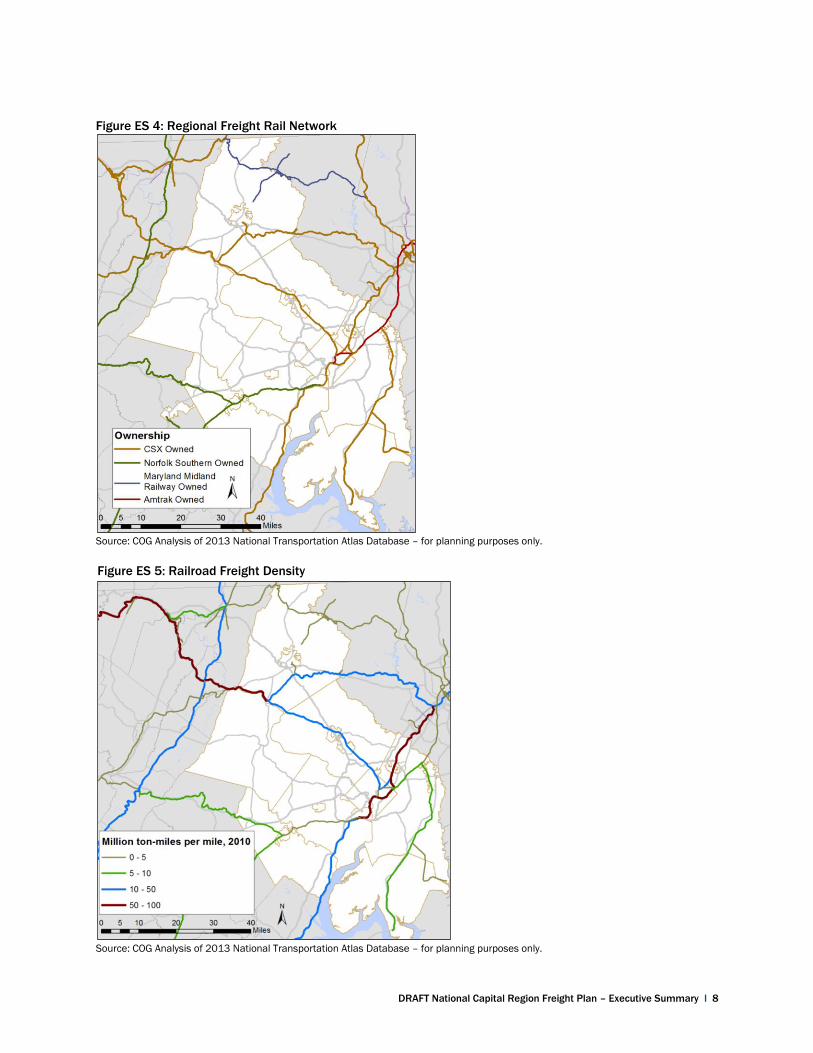
RAIL SYSTEM INVENTORY Figures ES 4 and ES 5 show the rail system by ownership and by rail density respectively.
DRAFT National Capital Region Freight Plan – Executive Summary I 8
Figure ES 4: Regional Freight Rail Network
Source: COG Analysis of 2013 National Transportation Atlas Database – for planning purposes only.
Source: COG Analysis of 2013 National Transportation Atlas Database – for planning purposes only.
Figure ES 5: Railroad Freight Density
DRAFT National Capital Region Freight Plan – Executive Summary I 9
Please refer to the full document for additional information on types of freight rail service and the
locations of major intermodal facilities served by rail.
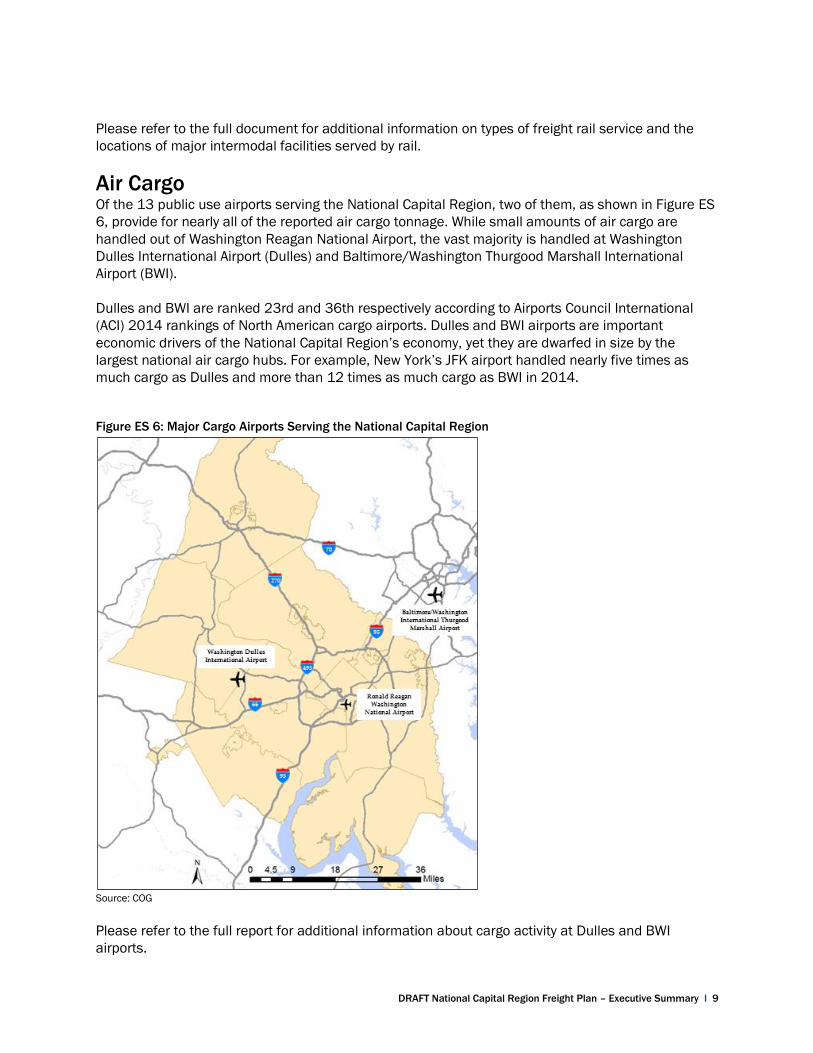
Air Cargo Of the 13 public use airports serving the National Capital Region, two of them, as shown in Figure ES
6, provide for nearly all of the reported air cargo tonnage. While small amounts of air cargo are
handled out of Washington Reagan National Airport, the vast majority is handled at Washington
Dulles International Airport (Dulles) and Baltimore/Washington Thurgood Marshall International
Airport (BWI).
Dulles and BWI are ranked 23rd and 36th respectively according to Airports Council International
(ACI) 2014 rankings of North American cargo airports. Dulles and BWI airports are important
economic drivers of the National Capital Region’s economy, yet they are dwarfed in size by the
largest national air cargo hubs. For example, New York’s JFK airport handled nearly five times as
much cargo as Dulles and more than 12 times as much cargo as BWI in 2014.
Source: COG
Please refer to the full report for additional information about cargo activity at Dulles and BWI
airports.
Figure ES 6: Major Cargo Airports Serving the National Capital Region
DRAFT National Capital Region Freight Plan – Executive Summary I 10
INTERMODAL CONNECTORS NHS intermodal connectors are short roadway segments that tie airport, seaport, and rail terminal
facilities to the National Highway System (NHS). They tend to carry lower volumes of traffic at slower
speeds than a typical NHS route and are therefore typically designed to lower standards. However,
large and heavy trucks use these critical roadways segments to carry the full range of commodities
essential to the nation’s economy. The FHWA identifies one freight-related intermodal connector
within the National Capital Region and two more that are located just outside of it:
Alexandria Intermodal (Ethanol Transfer Station) – Norfolk Southern - Van Dorn Street (I-95 to
Metro Road) and Metro Road (Van Dorn Street to facility entrance)
Virginia Inland Port – Port of Virginia / Norfolk Southern – U.S. Route 340 (I-66 to facility entrance)
Jessup TDSI Auto Terminal – CSX – MD 175 (I-95 to Dorsey Run Road), Dorsey Run Road (MD 175
to MD 32)
While not included on the FHWA list of official intermodal connectors, the following road serves as an
important “intermodal connector” in the Region:
Plantation Pipeline Terminal – Terminal Road (I-95 to facility entrance)
Intermodal connectors tie airport seaport, and rail terminal facilities to the National Highway System.
DRAFT National Capital Region Freight Plan – Executive Summary I 11
FREIGHT DEMAND
National Capital Region Commodities By analyzing the commodities that are most critical to the Region’s economy – those that are moving
into, out of, and within (but not through) the Region, important links between economic activity and
freight movement become apparent.1
WEIGHT AND VALUE The two primary measures of freight activity are weight and value. Value is an indicator of the
economic activity associated with freight, while weight is an indicator of the demand that freight
places on transportation infrastructure. In this report weight is measured in tons and value in 2007
dollars.
Inbound, outbound, and intraregional commodities totaling nearly 212 million tons and with an
equivalent value of more than $240 billion moved over the Region’s multimodal transportation
system in 2007. These figures include both domestic trade (within the Region or between the Region
and other areas of the United States) as well as international trade (between the Region and other
countries).
Weight Four major commodity groups are responsible for more than 50 percent of the Region’s tonnage –
gravel and crushed stone, waste and scrap, nonmetallic mineral products, and petroleum products.
Other important commodity groups by weight include natural sands, prepared foodstuffs, wood
products, nonmetallic minerals, mixed freight, and coal among others. These data show that
construction activities, electric power generation, and retail consumption generate much of the
freight (by weight) moving across the Region’s transportation network.
Value Four major commodity groups – electronic and electrical equipment, machinery, mixed freight, and
pharmaceutical products – account for more than 40 percent of the total value of commodities
moved in the Region. Other important commodity groups include textiles, leather and articles of
textiles and leather; motorized vehicles and parts; miscellaneous manufactured products; prepared
foodstuffs; articles of base metal; and precision instruments and apparatus among others. These
data reflect the importance of the technology and life sciences sectors to the Region’s economy as
well as the demands for goods by the Region’s businesses and consumers.
DIRECTION OF TRADE The Region’s freight moves in different directions, depending on the commodity:
1 The Federal Highway Administration’s Freight Analysis Framework dataset is the primary source of the information presented in this section.
By weight, gravel and crushed stone is the top commodity type hauled in the Region. By value, electronic and electrical equipment is the top commodity type hauled in the Region .
DRAFT National Capital Region Freight Plan – Executive Summary I 12
Inbound freight is moved from other states, or other countries, to the Region.
Outbound freight is moved from the Region to other areas of the United States, or to other
countries.
Intraregional freight is moved from one point in the Region to another point in the Region.
Through freight is moved from a location outside of the Region to another location outside of the
Region, via transportation infrastructure within the Region. Through freight does not contribute
significantly to the region’s economy and is not included in the tabulation of commodities.
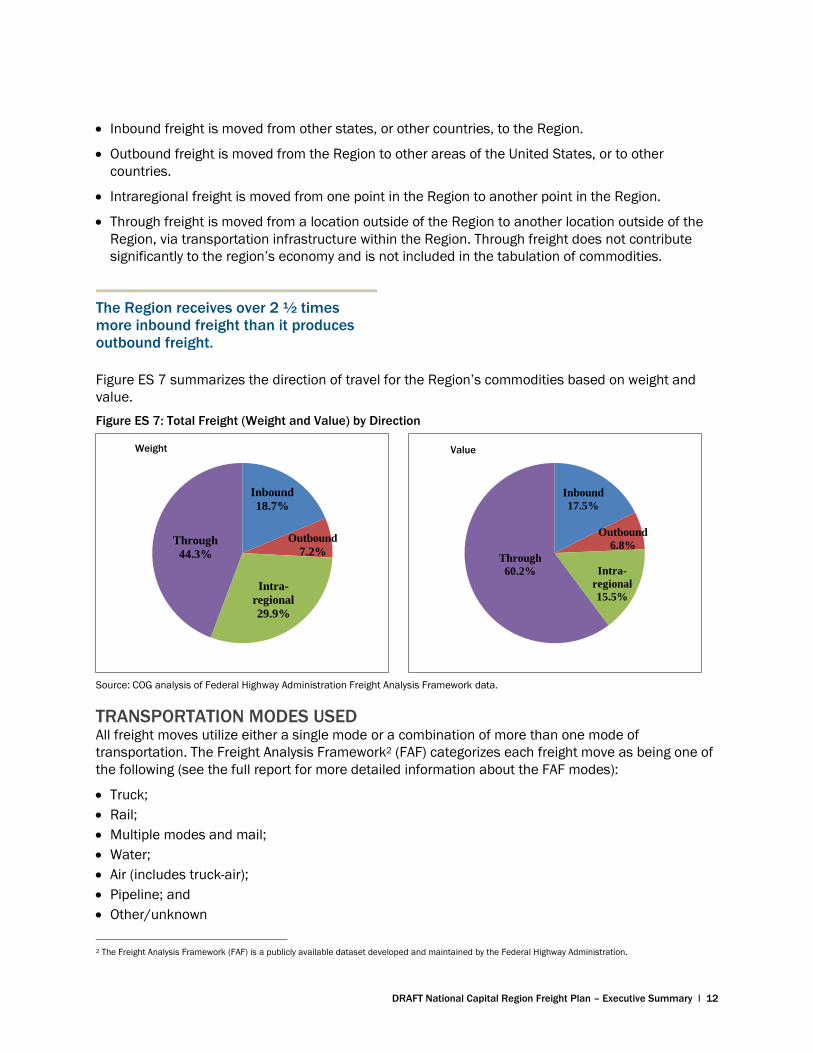
Figure ES 7 summarizes the direction of travel for the Region’s commodities based on weight and
value.
Source: COG analysis of Federal Highway Administration Freight Analysis Framework data.
TRANSPORTATION MODES USED All freight moves utilize either a single mode or a combination of more than one mode of
transportation. The Freight Analysis Framework2 (FAF) categorizes each freight move as being one of
the following (see the full report for more detailed information about the FAF modes):
Truck;
Rail;
Multiple modes and mail;
Water;
Air (includes truck-air);
Pipeline; and
Other/unknown
2 The Freight Analysis Framework (FAF) is a publicly available dataset developed and maintained by the Federal Highway Administration.
Inbound
18.7%
Outbound
7.2%
Intra-
regional
29.9%
Through
44.3%
Inbound
17.5%
Outbound
6.8%
Intra-
regional
15.5%
Through
60.2%
Weight Value
Figure ES 7: Total Freight (Weight and Value) by Direction
The Region receives over 2 ½ times more inbound freight than it produces outbound freight.
DRAFT National Capital Region Freight Plan – Executive Summary I 13
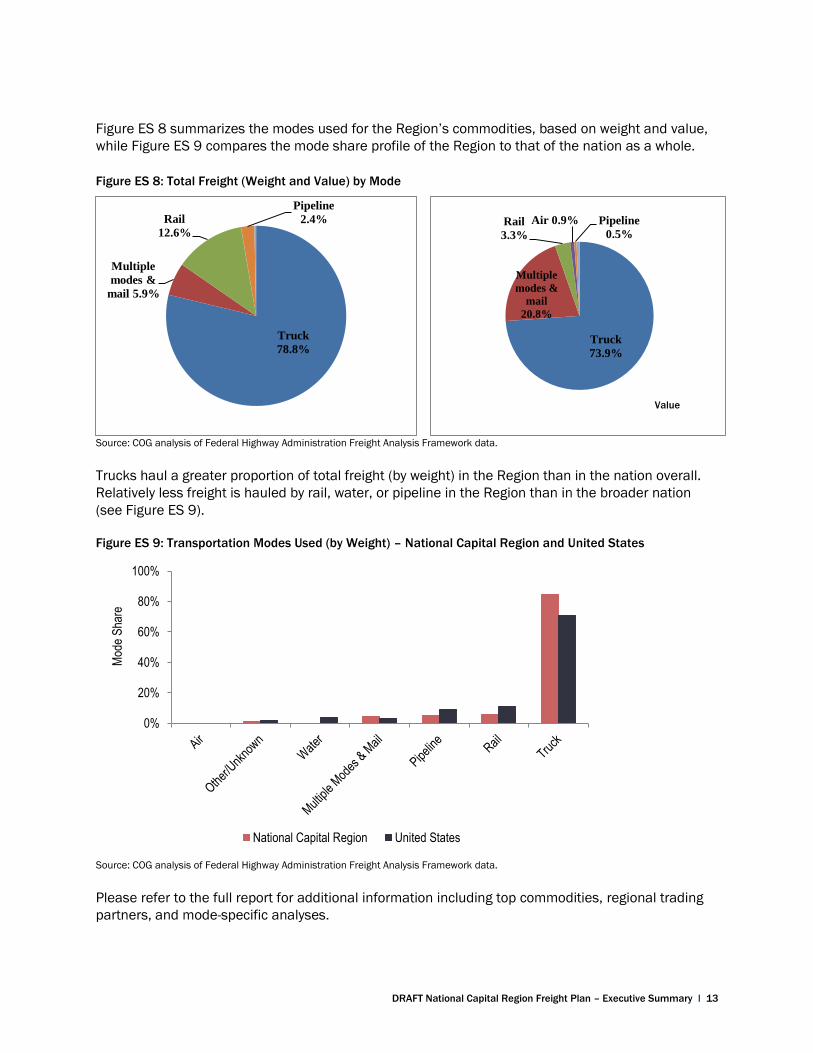
Figure ES 8 summarizes the modes used for the Region’s commodities, based on weight and value,
while Figure ES 9 compares the mode share profile of the Region to that of the nation as a whole.
Source: COG analysis of Federal Highway Administration Freight Analysis Framework data.
Trucks haul a greater proportion of total freight (by weight) in the Region than in the nation overall.
Relatively less freight is hauled by rail, water, or pipeline in the Region than in the broader nation
(see Figure ES 9).
Source: COG analysis of Federal Highway Administration Freight Analysis Framework data.
Please refer to the full report for additional information including top commodities, regional trading
partners, and mode-specific analyses.
Truck
73.9%
Multiple
modes &
20.8%
Rail
3.3%
Air 0.9% Pipeline
0.5%
Weight Value
Truck
78.8%
Multiple
modes &
mail 5.9%
Rail
12.6%
Pipeline
2.4%
Figure ES 8: Total Freight (Weight and Value) by Mode
0%
20%
40%
60%
80%
100%
Mod
e S
hare
National Capital Region United States
Figure ES 9: Transportation Modes Used (by Weight) – National Capital Region and United States
DRAFT National Capital Region Freight Plan – Executive Summary I 14
FREIGHT TRENDS AND ISSUES
While the freight transportation system is currently performing at a level that supports the Region’s
economy and quality of life, recurring bottlenecks on some roadways and railways negatively affect
the reliability of freight deliveries. The growth in freight volumes forecasted for the region is a result
of an increasing demand for goods – demand driven by the Region’s expanding economy, growing
population, and increasing standard of living. To fully realize the benefits associated with the
forecasted growth in freight traffic, the Region will need to address the challenges to the multimodal
transportation system in light of that growth. These challenges include more trucks sharing the
roadways with passenger vehicles, bicycles, and pedestrians; more commuter and intercity
passenger trains sharing the railways with freight trains; and increased wear and tear on pavements,
bridges, and rail infrastructure. Because trucks are the primary means by which goods are delivered
to stores, restaurants, businesses, and residences, the more dense and vibrant a neighborhood
becomes, the more that trucks must share the streets in close proximity to pedestrians, bicyclists,
and other vulnerable road users. Addressing the challenges associated with truck deliveries in dense
and vibrant regional activity centers is a key planning issue.
Trends Impacting Freight in the Region DEMOGRAPHIC AND ECONOMIC DRIVERS OF FREIGHT DEMAND The physical movement of freight is of critical importance to any region’s economy. Consumers rely
on efficient and reliable freight transportation for shipments of consumer products to homes and
retail establishments and for product returns and trash removal. Commercial enterprises rely on
efficient and reliable freight transportation for inbound shipments of raw materials, intermediate
goods, and other supplies required for the production of finished goods as well as outbound
shipments of intermediate goods and finished products to regional, national, and global markets.
Commercial enterprises in the service sector stimulate freight demand by providing income to their
employees, who in turn use that income to purchase goods and services.
All commercial enterprises depend on freight, but those that are directly involved in activities such as
transporting goods, farming, mining, manufacturing, construction, and managing retail operations
depend on it more strongly than others. These freight-dependent industries account for 19 percent
of the Region’s gross domestic product (GDP) and 18 percent of its total employment.
To understand freight movement, it is useful to examine the key economic and demographic drivers of freight demand.
Addressing the challenges associated with truck deliveries in dense and vibrant regional activity centers is a key planning issue.
DRAFT National Capital Region Freight Plan – Executive Summary I 15
To understand freight movement in the Region, it is therefore useful to examine the key economic
and demographic drivers of freight demand, including overall employment, GDP, economic structure,
population, and wealth.
Recent Trends POPULATION
As of 2013 the Washington-Arlington-Alexandria Metropolitan Statistical Area was home to 5.6
million people, making it the 7th most populous metropolitan statistical area in the nation. The
Region is adding population at a faster pace than the nation as a whole. Expanding employment in
the business and professional service- and government-sectors attracts highly educated people from
throughout the United States and the world. The Region’s population is expected to grow an
additional 32 percent by the year 2040. Each new resident creates additional demand for consumer
goods – residents with higher disposable income generate greater demand for material goods and
correspondingly greater overall demand for freight transportation. The Region ranks second in the
nation for median household income ($90,149 in 2013), 73 percent above the national average.
This means that the median regional household earns approximately $38,000 more per year than
the median American household. The combination of a growing population and rising consumer
affluence generates high demand for consumer goods, which translates into high demand for freight
transportation services.
EMPLOYMENT AND GROSS DOMESTIC PRODUCT
The Region’s economy employed 2.8 million people in 2013 , roughly 1.9 percent of all U.S. jobs.
Between 2002 and 2013, total employment in the Region increased by 245,000 or 9.6 percent,
compared to a U.S. growth rate of 5.5 percent.
In 2013, the Region’s gross domestic product (or GDP) was $464 billion. GDP is a measure of the
total value added to goods and services due to economic activity in the Region. As with employment,
the Region has been surpassing the United States as a whole in terms of GDP growth. In nominal
terms, the Region’s GDP grew by 61 percent between 2002 and 2013, compared to 53 percent for
the United States overall. There is a direct relationship between the growth in economic activity, as
measured by GDP, and the demand for freight transportation.3
3 The United States Bureau of Transportation Statistics (BTS) defines this relationship as the ratio of total ton-miles of freight to total GDP. In 2002 this freight
transportation intensity ratio was 0.38 ton-miles per dollar, indicating that every marginal dollar of GDP would be expected to generate an additional 0.38
ton-miles of freight activity.
The Region’s population is expected to grow by 32 percent by 2040.
There is a direct relationship between the growth in economic activity and the demand for freight transportation.
DRAFT National Capital Region Freight Plan – Executive Summary I 16
Forecasts Population and employment forecasts for the Region indicate that demand for goods, along with the
associated demand for freight transportation services, will continue to grow in the future.
The Region’s population is forecast to increase by 32 percent through 2040. By 2040, the Region is
expected to have over 6.6 million people, an increase of 1.6 million people. This population growth
will have a direct impact on freight transportation demand. More people mean more freight trips
generated, more services required, and more goods purchased. In addition, population and
economic growth in the rest of the nation and around the world will result in increased freight
shipments on the regions highways, railroads, and airports.
Employment in the Region is forecasted to grow even faster than population. By 2040 the Region is
expected to employ over 4.3 million people, an increase of 1.3 million or 43 percent. This expansion
of jobs provides evidence that the Region’s businesses, including those that are freight dependent,
will generate increasing demand for freight transportation services in the future.
EVOLVING SUPPLY CHAINS AND LOGISTICS PATTERNS New technology coupled with increasingly demanding customer expectations are pushing businesses
to reduce costs and improve responsiveness. The various aspects of e-commerce are enabling some
businesses to accomplish both of these imperatives while transforming the supply chain in the
process. Consumers are spending less time in retail stores and more time shopping via the internet.
They increasingly expect immediate gratification and successful businesses are working to satisfy
those expectations. Businesses that do not keep up with these changing expectations are at
increased risk of failure. The confluence of e-commerce and customer’s high expectations are
changing the retail landscape and introducing new transportation providers. These changes are
being manifested in terms of the designs and locations of distribution centers and in the way
products are distributed to the end customer.
Evolving Distribution Center Design and Locations A typical distribution center is roughly rectangular in shape and features a large number of loading
docks. Traditional distribution centers typically employ about 0.3 workers per thousand square feet
whose primary work tasks involve shipping and receiving activities. The rise in e-commerce is
resulting in a transformation of the typical distribution center into an e-commerce fulfillment center.
An e-commerce fulfillment center typically employs about 1.0 workers per thousand square feet
whose primary work tasks include picking and packing in addition to shipping and receiving
activities. These additional workers require places to park, so fulfillment centers have larger
Due to forecasted growth in population and employment, demand for freight transportation in the Region will continue to grow.
Newer “fulfillment centers” employ more workers and benefit from transit accessibility.
DRAFT National Capital Region Freight Plan – Executive Summary I 17
employee parking lots. While traditional distribution centers are typically not located to maximize
transit options, newer fulfillment centers are better able to attract the work force needed if they have
robust transit options available.
The Changing Last Mile In an effort to increase speed to market, traditional retailers are converting their brick and mortar
stores into centrally located urban distribution centers. This enables same day fulfillment of a
customer’s online order from the urban department store. Online retailers such as Amazon are
installing lockers in locations such as transit stations, Dunkin Donut shops, and convenience stores
to enable secure delivery of packages while customers are away from home. As the emphasis of last
mile logistics continues to shift towards personalized delivery services, the number of trucks on the
Region’s streets and roadways will grow. However, these additional trucks are likely to be smaller on
average.
The potential impact of automated trucks, drone deliveries, and other disruptive technologies is
difficult to plan for, however, regional planners and transportation officials at all levels would be wise
to keep abreast of developments in these areas and be prepared to engage elected officials and the
general public as needed.
TRENDS IN THE TRANSPORTATION INDUSTRY The freight transportation industry is dynamic and continues to evolve with large firms making
strategic investments in infrastructure and technology.
Trucking Small trucking firms are likely to continue to contract to larger carriers and utilize load-matching
services in an effort to maximize their return on capital. Trucking firms that effectively utilize
information technology are likely to prosper relative to firms that are less technology-adept. This
trend favors larger firms. Driver shortages will continue to be a problem for the industry, particularly
for long haul routes, but as the economy continues to generate high value time sensitive goods,
demand for trucking services will continue to be high.
As of early 2015, the profitability of trucking firms was at multi-year highs due to the combination of
record tonnage, high shipping rates, and low fuel prices. Industry observers expect this environment
to continue through 2015 and fleet owners are investing part of their profits in equipment upgrades
and expansion. While the incentives for these investments are related to the need to expand
capacity rather than the desire for greater fuel efficiency, fleet turnover is likely to result in a higher
proportion of cleaner and more fuel-efficient trucks across the nation and in the Region.
Rail Deregulation of the railroad industry in the 1980s enabled railroads to steadily increase productivity
by restructuring the rail system, shedding unprofitable lines, creating new business opportunities
through long-haul intermodal service, and by transporting coal from mines in Appalachia and
Wyoming’s Powder River Basin. Improvements in hydraulic fracturing techniques enable oil to be
extracted more economically from shale deposits and have provided business opportunities for
railroads to transport this oil to refineries primarily along the Gulf Coast and in the Northeast.
However, due to the steep decline in crude oil prices from midyear 2014 to the publication of this
Plan in midyear 2016, shale oil production has fallen substantially resulting in less demand for rail
DRAFT National Capital Region Freight Plan – Executive Summary I 18
transport. This illustrates the cyclical nature of rail transport demand for energy products such as
coal and crude oil.
The two Class I railroads operating in the National Capital Region, Norfolk Southern and CSX
Transportation, are also working to expand their intermodal business through major initiatives to add
additional track, straighten curves, increase clearances, and add intermodal terminals on key rail
corridors to clear the way for trains hauling double stack container cars moving between Mid-Atlantic
ports and the Midwestern markets (CSX National Gateway) and between the Southeast and the
Northeast (Norfolk Southern Crescent Corridor)
Air Cargo In the air cargo industry, freight forwarder and air carrier networks route freight through operationally
efficient, cost-effective airports that provide the highest level of customer service. To realize the
benefits of these efficient and cost-effective airports, cargo is sometimes trucked many hundreds of
miles before being loaded onto an aircraft.
Air cargo is, in most cases, fluid and has many airport options. The ultimate efficiency of airport
cargo facilities depends largely on local and regional air cargo demand patterns, available aircraft
cargo capacity, sufficient cargo infrastructure, ease of access to the interstate highway system,and
the degree of connectivity among freight forwarders, cross-dock and warehouse facilities, and off
airport properties. Access in and out of the airport is important to air cargo businesses, and truck
transportation is the critical link to the end-user.
Ports and Shipping To realize greater economies of scale, shipping lines have continued to acquire larger and larger
ships. To accommodate them, a program to expand the Panama Canal is currently underway and
expected to be completed in early 2016. Container terminals at the Port of Baltimore and at the Port
of Virginia, along with at least three other East Coast ports, are currently able to accommodate these
larger post-Panamax ships and are anticipating increased container traffic as a result. The advent of
larger container ships may impact the size of nearby distribution centers. This is not only because
greater volumes of containers are expected overall, but also because there are more containers per
ship to offload. This creates demand for larger buildings to accommodate the “surge” volume. While
it is difficult to predict all of the effects that the Panama Canal expansion will have on the National
Capital Region, it will likely result in some increase in economic activity coupled with more rail and
truck freight on the Region’s multimodal transportation system.
REGIONAL FREIGHT ISSUES, CHALLENGES, AND OPPORTUNITIES
Congestion ROADWAYS
Congestion on the nation’s roadways is a significant cost to shippers and to the economy overall. The
American Transportation Research Institute (ATRI) estimates that congestion added over $9.2 billion
in operational costs and resulted in 141 million hours in lost productivity to the trucking industry in
2013. This is the equivalent of over 51,000 truck drivers sitting idle for a working year. Freight
congestion is concentrated in urban areas and is most apparent at bottlenecks on highways -
especially those serving major international gateways, major domestic freight hubs, and in major
urban areas where important national truck flows intersect congested urban areas. ATRI ranked

DRAFT National Capital Region Freight Plan – Executive Summary I 19
congestion in the Washington, DC metropolitan area as fifth in the nation in terms of its contribution
to increased operating costs for the trucking industry.
RAIL
Congestion on the freight rail network increases costs to shippers and hampers the reliability and on-
time performance of commuter and inter-city passenger rail operations. Railroad capacity is not only
a function of track infrastructure; but also of rolling stock and railroad operating strategies related to
train speed, train size, and scheduling. Typical infrastructure related capacity constraints include
insufficient mainline tracks, lack of adequate sidings, low ceiling tunnels, antiquated bridges,
outdated signal systems, missing connections, and inadequate terminal capacity.
The most significant freight rail capacity constraints in the National Capital Region are the Virginia
Avenue Tunnel and the Long Bridge. The Virginia Avenue Tunnel is a roughly ¾ mile passage
beneath Virginia Avenue in southeast Washington, DC housing a single track without enough vertical
clearance to accommodate double stack container traffic. The Long Bridge is a two-track railroad
bridge across the Potomac River between Virginia and the District of Columbia. These two
constraints are both located on a critical, CSX-owned, rail line linking port terminals in the Hampton
Roads area to markets in the Northeast and Midwest. A project to remove the capacity and
clearance constraints of the Virginia Avenue Tunnel is currently underway. The Long Bridge project,
which will double the rail capacity over the Potomac River to accommodate additional passenger and
freight trains, is currently in the planning stages.
Freight Rail Safety and Security The Transportation Planning Board (TPB) is particularly interested in and concerned about the safety
and security of the Region’s freight rail system. Rail incidents such as the May 1, 2016 CSX
derailment in northeast Washington, DC, have highlighted the need for continual improvement of
preventative safety and security measures on the freight rail system. Major concerns include the
operational handling and tracking of railcars that carry Toxic Inhalation Hazard (TIH) materials, which
can cause fatalities if released into the atmosphere. Safety on the nation’s railroads is regulated by
the Federal Railroad Administration (FRA). It enforces regulations for hazardous materials, highway-
rail crossings, track conditions, rail motive power and equipment, operating practices, and train
control and signaling. Federal rail safety regulations preempt state rail safety laws and the FRA
maintains direct oversight of railroad practices relevant to safety. States can participate in railroad-
related investigative and surveillance activities through the FRA’s State Safety Participation Program.
To participate in the Program, states must have an agreement with the FRA to enable the delegation
of some federal investigative and surveillance authority to the State.
The most significant freight rail capacity constraints in the National Capital Region are the Virginia Avenue Tunnel and the Long Bridge.
Safety on the nation’s railroads is regulated by the Federal Railroad Administration.
DRAFT National Capital Region Freight Plan – Executive Summary I 20
The FRA reserves exclusive authority to assess penalties, issue emergency orders, and undertake
any other enforcement actions under federal railroad safety laws. Maryland’s rail safety authority is
under the jurisdiction of the Department of Labor, Licensing, and Regulation (DLLR). Virginia’s rail
safety authority is under the Virginia State Corporation Commission Division of Utility and Railroad
Safety. Currently, the District of Columbia does not have an office of rail safety.
POSITIVE TRAIN CONTROL
As part of their safety oversight responsibilities and in response to a mandate within the Rail Safety
Improvement Act of 2008, the FRA published a final rule on January 15, 2010 requiring mainlines
that transport any poisonous-inhalation-hazardous (PIH) materials and where regularly scheduled
intercity passenger or commuter rail services are provided to implement positive train control (PTC).
PTC is a technological system designed to prevent train-to-train collisions, derailments, incursions
into work zones, and movement through an improperly positioned switch. The implementation
deadline, originally set for December 31, 2015 has been extended to December 31, 2018.
RAIL SECURITY
The U.S. Department of Homeland Security (DHS) is the primary federal agency responsible for
security of the transportation sector. The DHS National Infrastructure Protection Plan (2013)
includes the Transportation Systems Sector-Specific Plan, which is focused on developing strategies
to reduce the risks to critical transportation infrastructure from terrorism threats. The leadership of
the District of Columbia, the State of Maryland, the Commonwealth of Virginia, area local
governments, and the Department of Homeland Security’s Office for National Capital Region
Coordination (NCRC) are working in partnership with non-profit organizations and private sector
interests to reduce the vulnerability of the National Capital Region (NCR) from terrorist attacks. The
Metropolitan Washington Council of Governments (MWCOG) coordinates and hosts many of the
regional emergency support function (R-ESF) committees that are working together to advance
preparedness in the region. The RESF-1 Transportation Committee meets monthly to address role of
transportation (including freight rail) in the NCR Homeland Security Program. The committee has
representation at the local, state, regional, and federal levels from all NCR jurisdictions and provides
a forum for regional transportation officials to exchange information and discuss emergency
response, coordination, and recovery requirements.
Freight in Regional Activity Centers The National Capital Region Transportation Planning Board (TPB) and the Metropolitan Washington
Council of Governments (MWCOG) recognize that the Region is supported largely by the economic
activity that occurs in major housing and jobs centers, known as activity centers. These mixed-use
activity centers are places that are intended to accommodate much of the Region’s future growth
States can participate in railroad-related investigative and surveillance activities through the FRA’s State Safety Participation Program.
COG coordinates and hosts many of the regional emergency support function (R-ESF) committees that are working together to advance preparedness in the region.
DRAFT National Capital Region Freight Plan – Executive Summary I 21
and development. Concentrating future growth within activity centers enables the more effective and
efficient use of existing facilities and fosters increased economic activity.
Because the initial impetus for rethinking how urban and suburban places should be developed
came from planners and other stakeholders interested in improving livability, they most often
focused on improving accommodations for pedestrians, cyclists, and transit users. Stakeholders
involved in goods movement were included less often in the urban design conversation. Recently,
however, cities and states around the country are beginning to include the consideration of truck
movements in their land-use and transportation planning activities. In the National Capital Region,
the District Department of Transportation (DDOT) is developing and implementing strategies to
address goods movement issues in the urban core. The Region has an opportunity to apply the
findings of recent and ongoing research as well as the lessons learned by cities and counties across
the nation to ensure that as more development is concentrated in activity centers, the needs of all
users, including those that move goods, are considered in the planning process.
As more development is concentrated in activity centers, the needs of all users, including those that move goods, must be considered in the planning process.
DRAFT National Capital Region Freight Plan – Executive Summary I 22
REGIONAL FREIGHT POLICIES
The Regional freight policies are intended to provide a framework for transportation planning
activities conducted by the Transportation Planning Board (TPB). TPB member jurisdictions are also
encouraged to consider these freight policies as they conduct their respective transportation
planning functions.
Freight Policy Background These freight policy statements are the result of an extensive development process based upon TPB
member input, a review of existing policy language within published Virginia, Maryland, and District
of Columbia documents, regional stakeholder outreach, and multiple TPB freight subcommittee and
TPB technical committee reviews. To ensure coverage of all the relevant topic areas, the set of
freight policy statements has been correlated with both Regional Transportation Priority Plan goals
and National Freight Goals.
TPB Freight Policies The Transportation Planning Board…
1. supports the prioritized advancement of freight-related transportation projects that provide
maximum value, efficiency, and safety with particular emphasis on those that improve freight
access to activity centers.
2. supports investments that maintain a state of good repair for the Region’s freight
transportation system.
3. supports the use of best practices for safety, engineering, and maintenance, of freight-
related transportation infrastructure.
4. supports the alleviation of roadway bottlenecks where feasible to improve travel times and
reliability for trucks and passenger vehicles.
5. supports maximizing opportunities to expand transportation options, address roadway
congestion, and reduce pollution by increasing the use of passenger and freight rail.
6. supports the consideration of potential social, economic, and environmental effects of
freight-related programs, policies, and activities on minority populations, low-income
populations, and people with disabilities.
7. recognizes freight’s role in economic development and supports efforts to maximize the use
of important economic drivers, including airports, ports, and intermodal facilities serving the
Region’s residents and businesses.
8. supports the safe and community-friendly accommodation of freight deliveries within the
Region’s activity centers.
9. supports improvements in truck safety using education, enforcement, and engineering
strategies.
10. supports efforts to route hazardous materials away from the National Capital Region; for
hazardous materials that must be transported to, from, within, and through the Region, the
TPB supports the selection of the safest and most secure modes and routes.

DRAFT National Capital Region Freight Plan – Executive Summary I 23
11. encourages information sharing on explosive, toxic by inhalation, and radioactive materials
being shipped to, from, within, and through the Region, including real-time notifications and
long-term planning information.
12. supports robust first responder training and exercise activities regarding freight in general
and hazardous materials transport in particular.
13. supports collaboration among agencies and with the private sector on freight planning and
operations concerns to support mutual goals.
14. supports the proactive analysis of freight-related performance measures in the context of
overall regional performance measurement to identify lessons learned and promote regional
goals.
15. promotes sustainable methods of freight operations that are sensitive to environmental,
cultural, and community resources.
16. encourages collaboration among transportation planners, land use planners, private
railroads, elected officials, and other stakeholders to find creative ways to facilitate
community-beneficial land use development (residential, commercial, or industrial as
appropriate) while providing space for necessary future rail expansion along key rail
corridors.
17. supports the review and study of new freight-related technologies, emerging business
practices, and evolving commodity mixes and mode shares to advance regional goals.
DRAFT National Capital Region Freight Plan – Executive Summary I 24
RECOMMENDATIONS AND NEXT STEPS
The TPB vision is to develop, implement, and maintain an interconnected transportation system that
enhances quality of life and promotes a strong and growing economy including a healthy regional
core and dynamic regional activity centers. Realizing this vision requires a focus on the efficient
transportation of both people and goods. The following recommended actions, which can be
accomplished with resources that are already in place, will help the Region move towards its vision.
These actions are organized into two categories; those related to maintaining and strengthening the
existing regional freight planning process and longer-term, strategic actions.
Actions Related to Maintaining and Strengthening the Regional Freight Planning Process
Continue to Support the TPB Freight Subcommittee
Maintain and Strengthen Private-Sector Participation in the TPB Freight Subcommittee
Create Opportunities to Hold Joint Meetings with Other TPB Subcommittees
Develop “Freight Around the Region” Brochures in Coordination with Member Jurisdictions
Organize Periodic Regional Freight Forums
Collect and Analyze Freight Data and Make Available to Member Jurisdictions and the Public
Continue Coordination with Federal, State, Local, and Private-Sector Freight Partners
Coordinate TPB’s MAP-21/FAST Freight-Related Activities – Including Performance Measures
Identify and Communicate Freight-Related Infrastructure Issues to Member Agencies to Address in
their Planning and Programming Activities
Strengthen Relationships with Local Jurisdiction Planners
Highlight Economic Development Aspects of Freight with Local Jurisdiction Planners
Strategic Regional Freight Planning Activities
Raise Freight Profile within Local and Regional Planning Processes
Develop and Communicate Helpful Information about Accommodating Freight within Regional
Activity Centers
Continue Participation in FHWA Effort to Develop Innovative Strategies for Improving Freight
Movement in Urban Areas
Monitor Developments of Autonomous and Connected Freight Vehicles
Monitor Key Economic and Industry Trends Impacting Goods Movement
Monitor the Development of New and Emerging Freight-Relevant Data Sources and Incorporate
them into Transportation Planning Activities as Appropriate
Provide Information to the TPB and Freight Stakeholders on the Status or Progress on this Plan’s
Identified Freight Policies When Such Information Becomes Available