national brands and store brands: competition through public quality labels
TRANSCRIPT
National Brands and Store Brands: CompetitionThrough Public Quality Labels
Daniel Hassan and Sylvette Monier-DilhanNational Institute for Agricultural Research, Rural Economy and SociologyUnit, BP 52 627 Auzeville, 31326 Castanet Tolosan, France
ABSTRACT
In this article the authors study one aspect of the proliferation of quality labels in the agro-foodsector: the coexistence of two signs on one same product and its consequences on the value of eachsign+ The context is that of the competition between national brands and private labels on a certainnumber of goods carrying a public quality label+ The authors show that the value of a sign decreaseswhen it is combined with another one on the same product+ This result is verified for six productsinvolving four quality labels+ This allows for an interpretation of retailers’ strategy concerning theirprivate labels+ @EconLit Classification: D120#+ © 2006 Wiley Periodicals, Inc+
1. INTRODUCTION
The development of private labels ~PL! is one of the most striking phenomena inthe evolution of the agro-food sector in the last 25 years+ In the year 2000, in France andin the United States, private labels represented 20% of the mass retail industry’ salesvolumes, that is 15+5% of their turnover+ In the UK, they represented 41% of thesales volumes+ The reasons for their development and the factors of their success havebeen the subjects of many recent studies ~for a recent review of this literature, see Bergès-Sennou, Bontems, & Réquillart, 2004!+ Private labels have enabled the mass retail indus-try to increase product variety offered to consumers+ They have also restored the balanceof power between retailers and the manufacturers of leading brands ~Bontems, Monier-Dilhan,& Réquillart et al+, 1999;Caprice, 2000;Gabrielsen & Sorgard, 2000;Mills, 1995!+The empirical studies that analyze the factors of PL success ~Bonfrer & Chintagunta,2004; Dhar & Hoch, 1997; Raju, Sethuraman, & Dhar, 1995! highlight the influence ofconsumers’ preferences and their demographic characteristics ~brand loyalty, price sen-sitivity! and competition conditions ~number of brands, level of advertising!+
Initially, PLs developed a low-price strategy that enabled them to compete with nationalbrands ~NB!+ They aimed at attracting low-income consumers and at showing them thatthe high prices of NB were largely because of the cost of elements other than the ones ofthe product ~packaging for example!+ From the mid-1980s, quality strategies of PLschanged: The aim of the leading mass retail companies was then to offer goods that wouldbe close substitutes to national brand products ~“me too” products!+ The “generic” brandwas then attributed to low-quality products+
Agribusiness, Vol. 22 (1) 21–30 (2006) © 2006 Wiley Periodicals, Inc.Published online in Wiley InterScience (www.interscience.wiley.com). DOI: 10.1002/agr.20070
21
Recently, mass distributors decided to enter, using their private labels, the market ofhigh-quality products+ For this purpose, a retailers’ strategy consists in introducing storebrands devoted to high-quality products+ Another strategy consists in commercializingproducts with public-quality labels+ These labels were introduced to meet the increasingdemand for products with an identifiable geographical origin, for products that are freefrom health risks and of superior quality+ Public-quality labels belong to the State+ Thelatter grants private actors the right to use these quality labels and ensures that specifi-cations are met for their obtention+ Some of these national labels have been harmonizedat the European level+
The Protected Designation of Origin ~PDO! and the Protected Geographical Indication~PGI! inform the consumer about the product’s origin+ The PDO guarantees foodstuffsthat are produced, processed, and prepared in a given geographical area using recognizedknow-how+ In the case of the PGI the geographical link must occur in at least one of thestages of production, processing, or preparation+ Besides PDO and PGI, the EuropeanUnion has created the Traditional Speciality Guaranteed ~TSG!+ The TSG does not referto the origin but highlights traditional character, either in the composition or means ofproduction+ The label, Bio guarantees that the product is made under strict productionstandards+1 The Label Rouge ~Red Label! is a French signal of quality that certifies theintrinsic quality of the products+ Public-quality labels are known by consumers+ 44% ofthe wine produced in France and 16% of French cheeses carry the PDO label and over25% of the chickens produced nationally are fed under the Red Label program+ The dif-fusion of Bio-certified products remains low+
The addition of a private label to products carrying a public-quality label gives rise toan original situation in the sense it creates a double vertical differentiation: ~a! a differ-entiation between national brands and private labels—national brands being associatedwith high quality and private labels being associated with low quality, and ~b! a differ-entiation based on the presence or absence of a public-quality label+ How do PLs exploitpublic quality labels to compete with NBs? When public-quality labels coexist with asignal of low quality ~PL!, how do they remain attractive to consumers? To answer thisquestion, we adopt a hedonic approach for estimating consumers’ willingness to pay+Wemeasure the implicit prices of public-quality labels and those of brands ~NBs and PLs! aswell as the interactions between the two+
Many studies have been dedicated to the measurement of consumers’ willingness topay for product characteristics+ Wine production, for which there are measurements ofintrinsic quality, has been the object of many investigations ~Combris, Lecocq, & Visser,1997; Landon & Smith, 1997; Nerlove, 1995!+ These studies show that in a situation ofinformational asymmetry, the prices reflect the presence of certain signals of quality ~des-ignation of origin or vintage!more than the intrinsic quality characteristics of the product+
Few studies aim to measure the impact of the combination of several signs on the sameproduct+ Cavero, Cebolleda, and Salas ~1998! address this question by studying the influ-ence of the place of purchase on the value of brands+ They believe that by selecting a
1The standards of production are specific to the product+An organic can either be a vegetable or an animal+For a product to be labeled organic, a vegetable product must be cultivated, processed, and preserved withoutsynthetic pesticides or chemicals+ Livestock can be certified organic if they have been raised with organicfoodstuffs ~90% organic food!+ The specifications for the Red Label chicken also specify the duration of thebreeding cycle+ In the case of a vegetable product such as table grapes, the PDO label corresponds to a zone ofproduction and imposes a limit in production yields+
22 HASSAN AND MONIER-DILHAN
Agribusiness DOI 10.1002/agr
specific place of purchase, consumers choose a certain level of quality+ Loureiro andMcCluskey ~2000! study the effect of a PGI label on consumers’ willingness to pay for aproduct that is already differentiated vertically: Bovine meat+ This vertical differentiationconcerns meat cuts, for which the authors distinguish three levels of quality+ They showthat for consumers the PGI label is mostly significant for cuts of meat of average quality+For high quality cuts the value of the PGI label is not significant+
Our study expands this analysis to include other public signs of quality and severalother products+ The dataset is presented in section 2+ The method is discussed in sec-tion 3+ Section 4 presents the results, and we conclude in section 5+
2. DATA
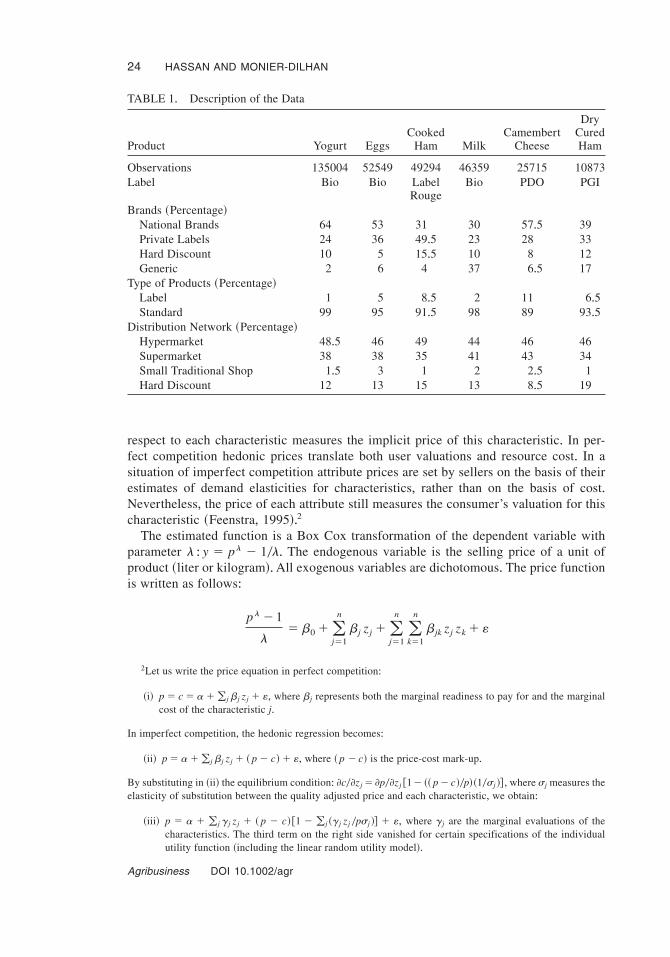
We use panel data collected by the Secodip company ~Bureau of Studies on Consump-tion, Distribution, and Advertising, Chambourcy, France!+ This database contains infor-mation about daily food purchases by 8,000 French consumers during the year 2000+ Foreach purchase the following information was collected: the price of the product pur-chased, the brand, the existence or absence of a public quality label, the distribution net-work in which the product was bought ~hypermarket, supermarket, small traditionalshop, or hard discount store! and characteristics of each good ~making, packaging, con-tainer + + + !+ The sample is representative of the French retailers’ network in terms of storesand brands+ The price distribution of each product is therefore representative of the pur-chasing structure+ The products we selected had to fit in each of the following four cat-egories: national brands with or without a public-quality label, private labels with or withouta public-quality label+This constraint led us to choose the following products:milk, yogurt,eggs, and cooked ham, which are purchased in large quantities by consumers, plus cam-embert cheese and dry cured ham, bought in smaller quantities+ The data are presented inTable 1+ The six products we have selected have the advantage of reflecting the diversityof public-quality labels: the Bio label ~three products!, the PDO, the PGI, and the LabelRouge+ In terms of brands, beside NBs and PLs, we distinguish two other brands: the“hard discount” brand, sold exclusively in hard discount stores, and the “generic” brandsfound exclusively in traditional mass retail stores which introduced them to slow downthe growth of hard discount market shares+
For all six products, the number of purchases made during the year 2000 was high+ ThePLs market shares range between 23 and 50%+ These figures are superior to the averagemarket share of PLs in food products, which is around 21%+ The PDO label reaches 11%of all purchases, the Label Rouge represents 7%, and the Bio label stays under 5%+ Theproducts are essentially sold in hypermarkets and supermarkets+ Such distribution net-works represent, for each product selected, over 80% of the market+ Small traditionalshops have a marginal position on the market+ The market share of hard discount groups~between 8+5 and 19%! reflects the development of this type of distribution+
3. METHOD
To determine consumers’ willingness to pay for public-quality labels, for the brand ~NBsor PLs! and the interaction between these two characteristics, we estimate a hedonicprice function for each product+ Using Rosen’s formulation ~1974!, we write the follow-ing function: p � p~Z!, where p is the price of the product and Z � ~z1, + + + , zn ! is thevector of its characteristics+ The partial derivative of the hedonic price function with
COMPETITION THROUGH PUBLIC QUALITY LABELS 23
Agribusiness DOI 10.1002/agr
respect to each characteristic measures the implicit price of this characteristic+ In per-fect competition hedonic prices translate both user valuations and resource cost+ In asituation of imperfect competition attribute prices are set by sellers on the basis of theirestimates of demand elasticities for characteristics, rather than on the basis of cost+Nevertheless, the price of each attribute still measures the consumer’s valuation for thischaracteristic ~Feenstra, 1995!+2
The estimated function is a Box Cox transformation of the dependent variable withparameter l : y � pl � 10l+ The endogenous variable is the selling price of a unit ofproduct ~liter or kilogram!+All exogenous variables are dichotomous+ The price functionis written as follows:
pl � 1
l� b0 �(
j�1
n
bj zj �(j�1
n
(k�1
n
bjk zj zk � «
2Let us write the price equation in perfect competition:
~i! p � c � a�(j bj zj � «, where bj represents both the marginal readiness to pay for and the marginalcost of the characteristic j+
In imperfect competition, the hedonic regression becomes:
~ii! p � a�(j bj zj � ~ p � c!� «, where ~ p � c! is the price-cost mark-up+
By substituting in ~ii! the equilibrium condition: ]c0]zj � ]p0]zj @1� ~~ p � c!0p!~10sj !# , where sj measures theelasticity of substitution between the quality adjusted price and each characteristic, we obtain:
~iii! p � a � (j gj zj � ~ p � c!@1 � (j ~gj zj 0psj !# � «, where gj are the marginal evaluations of thecharacteristics+ The third term on the right side vanished for certain specifications of the individualutility function ~including the linear random utility model!+
TABLE 1+ Description of the Data
Product Yogurt EggsCooked
Ham MilkCamembert
Cheese
DryCuredHam
Observations 135004 52549 49294 46359 25715 10873Label Bio Bio Label
RougeBio PDO PGI
Brands ~Percentage!National Brands 64 53 31 30 57+5 39Private Labels 24 36 49+5 23 28 33Hard Discount 10 5 15+5 10 8 12Generic 2 6 4 37 6+5 17
Type of Products ~Percentage!Label 1 5 8+5 2 11 6+5Standard 99 95 91+5 98 89 93+5
Distribution Network ~Percentage!Hypermarket 48+5 46 49 44 46 46Supermarket 38 38 35 41 43 34Small Traditional Shop 1+5 3 1 2 2+5 1Hard Discount 12 13 15 13 8+5 19
24 HASSAN AND MONIER-DILHAN
Agribusiness DOI 10.1002/agr
where the b are the parameters to estimate and « an error term+ Redundant observations~several purchases by one consumer of a product with the same brand name, in the samestore, and at the same price! were discarded in order not to enhance artificially the reli-ability of the estimators+
The variables describing the distribution networks ~hypermarket @HM# , supermarket@SM# , hard discount @HD# , and small traditional shop @STS# ! enable us to take into accountthe location of the purchase as an indicator of the level of quality ~Cavero et al+, 1998!+
The variables defining the type of brands are named NB ~for national brands! or PL ~forprivate labels!+ The quality sign is named Label+ The other variables zj depend on theproduct studied: type of packaging, size of packaging, season+ + + +
The estimation must enable us to measure the value of the quality signs ~NB0PL, Label0Standard! when different signs coexist+ For this purpose we therefore introduce the crosseffects NB{Label and PL{Label+ The resulting estimated equation is thus the following:
pl � 1
l� b0 � b1 SM � b2 STS � b3 HD � b4 NB � b5 PL
� b6 Label �(j�7
n
bj zj � b4,6 NB{Label � b5,6 PL{Label � « ~2!
The reference product is a “generic” product, sold without a label in a hypermarket+ Itsprice is deduced from the constant+
4. RESULTS
The detailed results for one product ~camembert cheese! are presented in section 4+1 andserve as an illustration+ The overall results of the model are presented in section 4+2+ Inparagraph 4+3, we distinguish distinction between national brands according to their mar-ket shares+
4.1 Detailed Results for One Product: Camembert Cheese
Table 2 describes successively the generic characteristics ~brands, distribution networks,and label!, the specific characteristics of camembert cheese ~packaging, fat content!and the cross-effects+ The reference product is a “generic” brand of camembert cheese,sold without a label, in family-size packages in a hypermarket+ Its estimated price is3+76 euros0kilogram+
As expected, the value of the NB is superior to that of the PL+ The price differencerelated to the distribution network follows the classic rank: hard discount, hypermarket,supermarket, and small traditional shop+ The value of the label is high: It represents 45%of the price of the reference product+ The type of packaging is an important factor ofdifferentiation; the fat content is much less important+ The interaction between a nationalbrand and the PDO label is measured by the coefficient of the variable NB{PDO+ Theinteraction PL{PDO is indeed normalized at zero+ The coefficient associated to the cross-effect NB{PDO is significant and negative: in other words the PDO label has less value
COMPETITION THROUGH PUBLIC QUALITY LABELS 25
Agribusiness DOI 10.1002/agr

when it is combined with a NB than when it is combined with a PL+ The value differenceis of 8 euro cents per kilogram, in favor of the PL, that is almost 5% of the implicit priceof the label+
4.2 Overall Results
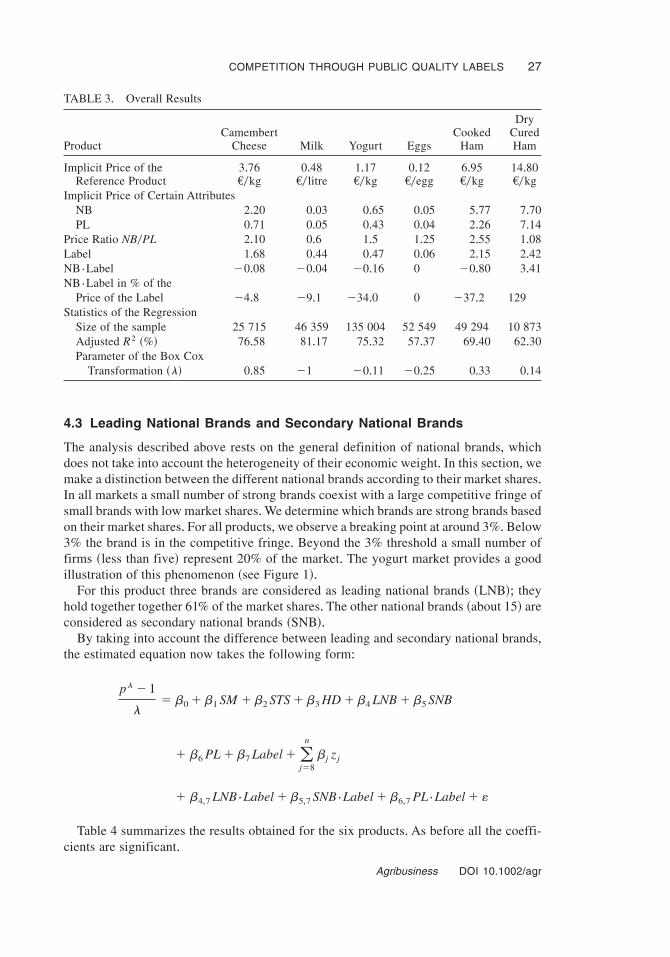
A summary of the results for the six products selected is presented in Table 3+ On thewhole, the adjustment obtained from the Box Cox transformation ~see values of param-eter l! is of good quality ~see values of adjusted R2 !+ Moreover all the coefficients aresignificant+
The values taken by the price ratio NB0PL do not contradict the hypothesis of verticaldifferentiation between NB and PL+ For five products out of six, this ratio is higherthan 1+ It is below 1 for milk: This may be due to the fact that, for this product, PLs oftencarry a “Mountain” label that increases the perceived quality and the price+ Unfortu-nately, the information is not available in the database+
For most products ~four out of six!, PLs derive more value from public-quality labelsthan NB do+ The differential represents between 5 and 37% of the implicit price of thelabel+ For one product ~eggs! the value of the quality label is identical whether it is asso-ciated with a PL or a NB+ In only one case ~dry cured ham!, NBs obtain a much higherpremium from the quality label ~in this case the PGI label! than PLs do+ Is this resultrelated to the product itself or to the method? We address this question in the followingsection based on a more refined definition of national brands+
TABLE 2+ Results for Camembert Cheese
Variables CoefficientCritical
Probability Price Y0Kg
Generic Characteristics ~Zi , i � 1 to 6!Constant 16+60 0+00 3+76
BrandsNB 8+48 0+00 2+20PL 2+96 0+00 0+75Hard Discount 2+79 0+00 0+71
Distribution NetworkSupermarket 0+24 0+00 0+06Small traditional shop 2+14 0+00 0+54Hard Discount �0+11 0+50 0
LabelPDO 6+51 0+00 1+68
Specific Characteristics ~Zi , i � 7 to j !Packaging
Individual Portions 5+00 0+00 1+28Fat Content
Below 45% 0+73 0+00 0+18Over 45% 1+23 0+00 0+31
Cross-EffectsNB{PDO �0+31 0+03 �0+08
Note+ Adjusted R2 � 76+58%, coefficient of the Box Cox transformation g� 0+85+
26 HASSAN AND MONIER-DILHAN
Agribusiness DOI 10.1002/agr
4.3 Leading National Brands and Secondary National Brands
The analysis described above rests on the general definition of national brands, whichdoes not take into account the heterogeneity of their economic weight+ In this section, wemake a distinction between the different national brands according to their market shares+In all markets a small number of strong brands coexist with a large competitive fringe ofsmall brands with low market shares+We determine which brands are strong brands basedon their market shares+ For all products,we observe a breaking point at around 3%+ Below3% the brand is in the competitive fringe+ Beyond the 3% threshold a small number offirms ~less than five! represent 20% of the market+ The yogurt market provides a goodillustration of this phenomenon ~see Figure 1!+
For this product three brands are considered as leading national brands ~LNB!; theyhold together together 61% of the market shares+ The other national brands ~about 15! areconsidered as secondary national brands ~SNB!+
By taking into account the difference between leading and secondary national brands,the estimated equation now takes the following form:
pl � 1
l� b0 � b1 SM � b2 STS � b3 HD � b4 LNB � b5 SNB
� b6 PL � b7 Label �(j�8
n
bj zj
� b4,7 LNB{Label � b5,7 SNB{Label � b6,7 PL{Label � «
Table 4 summarizes the results obtained for the six products+ As before all the coeffi-cients are significant+
TABLE 3+ Overall Results
ProductCamembert
Cheese Milk Yogurt EggsCooked
Ham
DryCuredHam
Implicit Price of theReference Product
3+76Y0kg
0+48Y0litre
1+17Y0kg
0+12Y0egg
6+95Y0kg
14+80Y0kg
Implicit Price of Certain AttributesNB 2+20 0+03 0+65 0+05 5+77 7+70PL 0+71 0+05 0+43 0+04 2+26 7+14
Price Ratio NB0PL 2+10 0+6 1+5 1+25 2+55 1+08Label 1+68 0+44 0+47 0+06 2+15 2+42NB{Label �0+08 �0+04 �0+16 0 �0+80 3+41NB{Label in % of the
Price of the Label �4+8 �9+1 �34+0 0 �37+2 129Statistics of the Regression
Size of the sample 25 715 46 359 135 004 52 549 49 294 10 873Adjusted R2 ~%! 76+58 81+17 75+32 57+37 69+40 62+30Parameter of the Box Cox
Transformation ~l! 0+85 �1 �0+11 �0+25 0+33 0+14
COMPETITION THROUGH PUBLIC QUALITY LABELS 27
Agribusiness DOI 10.1002/agr
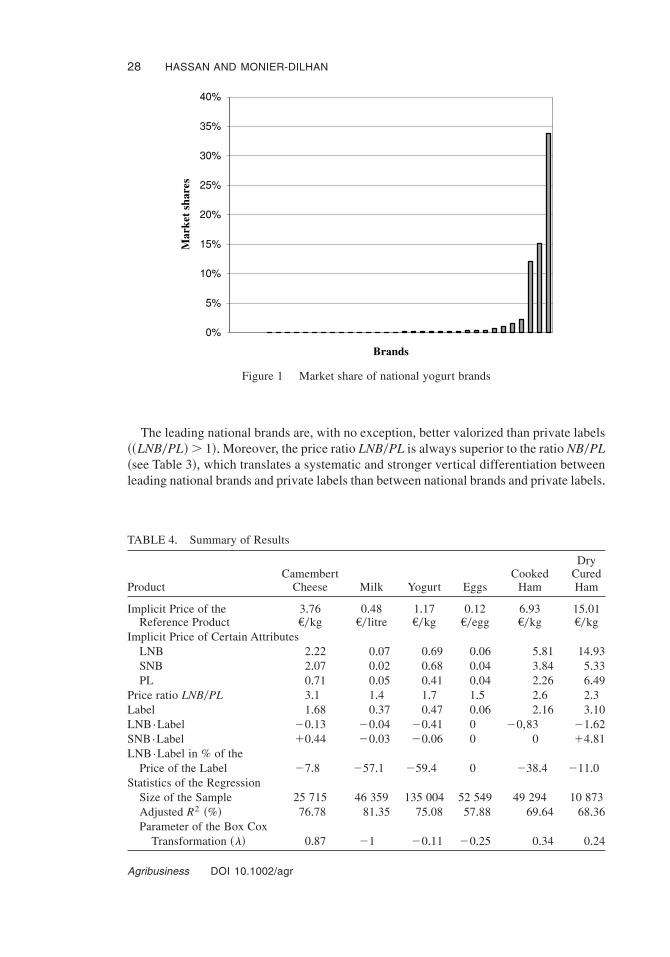
The leading national brands are, with no exception, better valorized than private labels~~LNB0PL!� 1!+Moreover, the price ratio LNB0PL is always superior to the ratio NB0PL~see Table 3!, which translates a systematic and stronger vertical differentiation betweenleading national brands and private labels than between national brands and private labels+
Figure 1 Market share of national yogurt brands
TABLE 4+ Summary of Results
ProductCamembert
Cheese Milk Yogurt EggsCooked
Ham
DryCuredHam
Implicit Price of theReference Product
3+76Y0kg
0+48Y0litre
1+17Y0kg
0+12Y0egg
6+93Y0kg
15+01Y0kg
Implicit Price of Certain AttributesLNB 2+22 0+07 0+69 0+06 5+81 14+93SNB 2+07 0+02 0+68 0+04 3+84 5+33PL 0+71 0+05 0+41 0+04 2+26 6+49
Price ratio LNB0PL 3+1 1+4 1+7 1+5 2+6 2+3Label 1+68 0+37 0+47 0+06 2+16 3+10LNB{Label �0+13 �0+04 �0+41 0 �0,83 �1+62SNB{Label �0+44 �0+03 �0+06 0 0 �4+81LNB{Label in % of the
Price of the Label �7+8 �57+1 �59+4 0 �38+4 �11+0Statistics of the Regression
Size of the Sample 25 715 46 359 135 004 52 549 49 294 10 873Adjusted R2 ~%! 76+78 81+35 75+08 57+88 69+64 68+36Parameter of the Box Cox
Transformation ~l! 0+87 �1 �0+11 �0+25 0+34 0+24
28 HASSAN AND MONIER-DILHAN
Agribusiness DOI 10.1002/agr
The interaction PL{Label is normalized at zero+ For national brands ~leading and sec-ondary!, the value of the label must be corrected with the cross-effect+ This effect is alwaysnegative for the leading national brands+ Furthermore, this loss of value is now verifiedfor the PGI label of dry cured ham+ For the other goods the loss in value, in comparisonto private labels, is higher when we only consider the leading national brands+ In otherwords, when the reputation of a national brand increases, its capacity to benefit from asecond quality sign decreases+ This logic of valorization is verified within the segmentsof national brands+ Indeed,we show that the secondary national brands extract more valuefrom the label than the leading national brands do+However, there is no hierarchy betweenthe secondary national brands and the private labels+
5. CONCLUSION
The question raised in this article concerns one of the forms of proliferation of qualitylabels: The combination of two signs on one same product, and its consequences on thebenefits from each sign+ We show that when two quality signals coexist on the sameproduct their value declines+ This study generalizes the results obtained by Loureiro andMcCluskey ~2000! by including several products and several public-quality labels+
One interpretation of this result is that selling products carrying a public-quality labelunder a private label does not lead to a devaluation of the public label: Producers’ reluc-tance to commercialize public-quality label products under PL is not justified+
Another interpretation of the result is that the use of these signals by retail firms is astrategy that allows them to compete successfully against national brands+ Indeed, it enablesPL to provide consumers with clearer information about their products and thus to improvetheir perceived quality+ Such a strategy helps retailers to build a positive reputation thatwill enable them to win the loyalty of consumers+ Consumer loyalty is a crucial elementin the balance of power between producers and retailers+ As Steiner ~1985! underlined,depending on whether the consumer is more loyal to the brand or to the private label,producers or retailers do enjoy market power+
ACKNOWLEDGMENTS
The authors would like to thank two anonymous readers for their helpful comments+ Finan-cial support from the Midi-Pyrénées Region and the INRA ~Program of Research For andAbout Regional Development! is gratefully acknowledged+
REFERENCES
Bergès-Sennou, F+, Bontems, Ph+,& Réquillart,V+ ~2004!+ Economics of private labels:A survey ofliterature+ Journal of Agricultural and Food Industrial Organization, 2, article 3, 25 pages+
Bontems, Ph+,Monier-Dilhan, S+, & Réquillart, V+ ~1999!+ Strategic effects of private labels+ Euro-pean Review of Agricultural Economics, 26~2!, 147–165+
Bonfrer, A+, & Chintagunta, P+K+ ~2004!+ Store brands:Who buys them and what happens to retailprices when they are introduced? Review of Industrial Organization, 24, 195–218+
Caprice, S+ ~2000!+ Contributions à l’analyse de la puissance d’achat dans les relations verticals:Interactions stratégiques et marques de distributeur ~Contributions to the analysis of buyer powerin retailer-manufacturer relationships: Strategic reciprocal actions and store brands!+ Unpub-lished doctoral dissertation, University of Paris I, France+
COMPETITION THROUGH PUBLIC QUALITY LABELS 29
Agribusiness DOI 10.1002/agr
Cavero, S+, Cebolleda, J+, & Salas, V+ ~1998!+ Price formation in channels of distribution withdifferenciated products+ Theory and empirical evidence+ International Journal of Research inMarketing, 15, 427– 441+
Combris, P+, Lecocq, S+, & Visser,M+ ~1997!+ Estimation of a hedonic price equation for Bordeauxwine+ Does quality matter? The Economic Journal, 107, 390– 402+
Dhar, S+, & Hoch, S+ ~1997!+ Why store brand penetration varies by retailer+ Marketing Science,16~3!, 208–227+
Feenstra, R+C+ ~1995!+ Exact hedonic price indexes+ The Review of Economics and Statistics, 77,634– 653+
Gabrielsen, S+T+,& Sorgard, L+ ~2000!+ Private labels, price rivalry, and public policy ~Papers 8000!+Norwegian School of Economics and Business Administration, Bergen+
Landon, S+, & Smith, C+ ~1997!+ The use of quality and reputation indicators by consumers: Thecase of Bordeaux Wine+ Journal of Consumer Policy, 20, 289–323+
Loureiro, M+L+, & McCluskey, J+ ~2000!+ Assessing consumer response to protected geographicalidentification labeling+ Agribusiness, 16~3!, 309–320+
Meza, S+, & Sudhir, K+ ~2003!+ The role of strategic pricing by retailers in the success of storebrands+ Unpublished manuscript, Stern School of Business, New York University, New York+
Mills, D+E+ ~1995!+Why retailers sell private labels+ Journal of Economic Management and Strat-egy, 4~3!, 509–528+
Nerlove, M+L+ ~1995!+ Hedonic price functions and the measurement of preferences: The case ofSwedish Wine consumers+ The European Economic Review, 39, 1697–1716+
Raju, J+S+, Sethuraman, R+,& Dhar, S+K+ ~1995!+ The introduction and performance of store brands+Management Science, 41~6!, 957–978+
Rosen, S+M+ ~1974!+ Hedonic prices and implicit markets: Product differenciation in pure compe-tition+ Journal of Political Economy, 82~1!, 34–55+
Steiner, R+L+ ~1985!+ The nature of vertical restraints+ The Antitrust Bulletin, 30, 143–197+
Daniel Hassan is a Researcher at the National Institute for Agricultural Research, Castanet Tolosan,France. He received his PhD in Economics from the University of Paris 1. His research interestsinclude industrial organization applied to the food policy industry and the vertical relationshipsbetween manufacturers and retailers. E-mail: hassan @toulouse.inra.fr
Sylvette Monier-Dilhan is a Researcher at the National Institute for Agricultural Research, CastanetTolosan, France. She received her PhD in Economics from the University of Paris 1. Her researchinterests include industrial organization applied to the food policy industry and qualitative meth-ods applied to agricultural policy analysis. E-mail: [email protected]
30 HASSAN AND MONIER-DILHAN
Agribusiness DOI 10.1002/agr