national bank of romania si interviuri/e20020516.pdfnational bank of romania spread of...
TRANSCRIPT

NATIONAL BANK OF ROMANIANATIONAL BANK OF ROMANIANATIONAL BANK OF ROMANIANATIONAL BANK OF ROMANIANATIONAL BANK OF ROMANIA

NATIONAL BANK OF ROMANIANATIONAL BANK OF ROMANIA
Summary� Moving closer to the Euro: real economy and external
sector
� Closer to the Euro: forex transactions, reserves, debt and the exchange rate
� Closer to the Euro: banking sector ownership and resilience;
� Closer to the Euro: progress in EU accession negotiations and upcoming legislative and regulatory
improvement
� Conclusion: progress in nominal and real convergence

NATIONAL BANK OF ROMANIANATIONAL BANK OF ROMANIA
–4.8
–1.2
1.8
5.34.5
1998 1999 2000 2001 2002p
Source: National Institute of Statistics
Real GDPannual percentage change

NATIONAL BANK OF ROMANIANATIONAL BANK OF ROMANIA
-5.7
-13.8
-4.8
-2.2
4.6
7.1* 6.68.2* 8.0
6.1
1998 1999 2000 2001 2002p
Source: National Institute of Statistics
Gross Fixed Capital Formation and Industrial Output
gross fixed capital formation
industrial output
annual percentage change
*) based on 1998 output composition; for the previous years, data refer to 1995 output composition.

NATIONAL BANK OF ROMANIANATIONAL BANK OF ROMANIA
1997 1998 1999 2000 1997 1998 1999 2000
Czech Rep. 35.9 36.9 35.5 36.0 5.0 4.8 3.9 3.9Hungary 25.0 25.9 26.9 n.a. 5.8 5.4 5.3 n.a.Poland 28.1 28.1 28.2 29.0 5.7 5.5 5.2 5.0Romania 30.9 26.3 24.8 25.2 18.0 14.4 13.3 11.1Bulgaria 25.3 25.5 24.6 25.1 23.8 18.8 15.9 13.4Slovak Rep. 26.8 25.5 24.2 25.8 4.8 4.4 4.4 4.4Slovenia 28.0 28.1 27.3 27.7 3.7 3.6 3.2 2.9
Source: EBRD - Transition Report 2001 National Institute of Statistics (Romania)
Contribution of Main Economic Sectors to GDP Formation
INDUSTRY (as % of GDP)
AGRICULTURE (as % of GDP)

NATIONAL BANK OF ROMANIANATIONAL BANK OF ROMANIA
Openness of the Economy
53.0
60.1
71.075.2
1998 1999 2000 2001
percent
Source: National Institute of Statistics, NBR calculations

NATIONAL BANK OF ROMANIANATIONAL BANK OF ROMANIA
Foreign Trade by Group of Countries
0%
20%
40%
60%
80%
100%
1994
1995
1996
1997
1998
1999
2000
2001
2002
*
1994
1995
1996
1997
1998
1999
2000
2001
2002
*
Source: National Institute of Statistics
Russian Federation
countries intransition
developingcountries
USA and otherdeveloped countries
EU
Exports Imports
*) March

NATIONAL BANK OF ROMANIANATIONAL BANK OF ROMANIA
Foreign Trade with EU
0
1
2
3
4
5
6
7
8
919
95
1996
1997
1998
1999
2000
2001
1995
1996
1997
1998
1999
2000
2001
Source: National Institute of Statistics
USD billion
Exports fob Imports cif

NATIONAL BANK OF ROMANIANATIONAL BANK OF ROMANIA
Foreign Trade Composition by Currency
0%
20%
40%
60%
80%
100%
1999 2000 2001 2002* 1999 2000 2001 2002*
Source: National Bank of Romania
othercurrencies
GBP
USD
EUR
Exports Imports
*) March

NATIONAL BANK OF ROMANIANATIONAL BANK OF ROMANIA
3.2
4.0
6.1
6.6
6.7
7.0
8.3
8.7
10.4
14.7The Netherlands
Germany
USA
France
Cyprus
Austria
Italy
NetherlandsAntillesTurkey
United Kingdom
percent; as a share of total subscribed capital
Source: The Chamber of Commerce and Industry of Romania and Bucharest Municipality
Top-Ten Countries by Investment in Joint-Stock Companies in Romania as at March 31, 2002
NATIONAL BANK OF ROMANIANATIONAL BANK OF ROMANIA
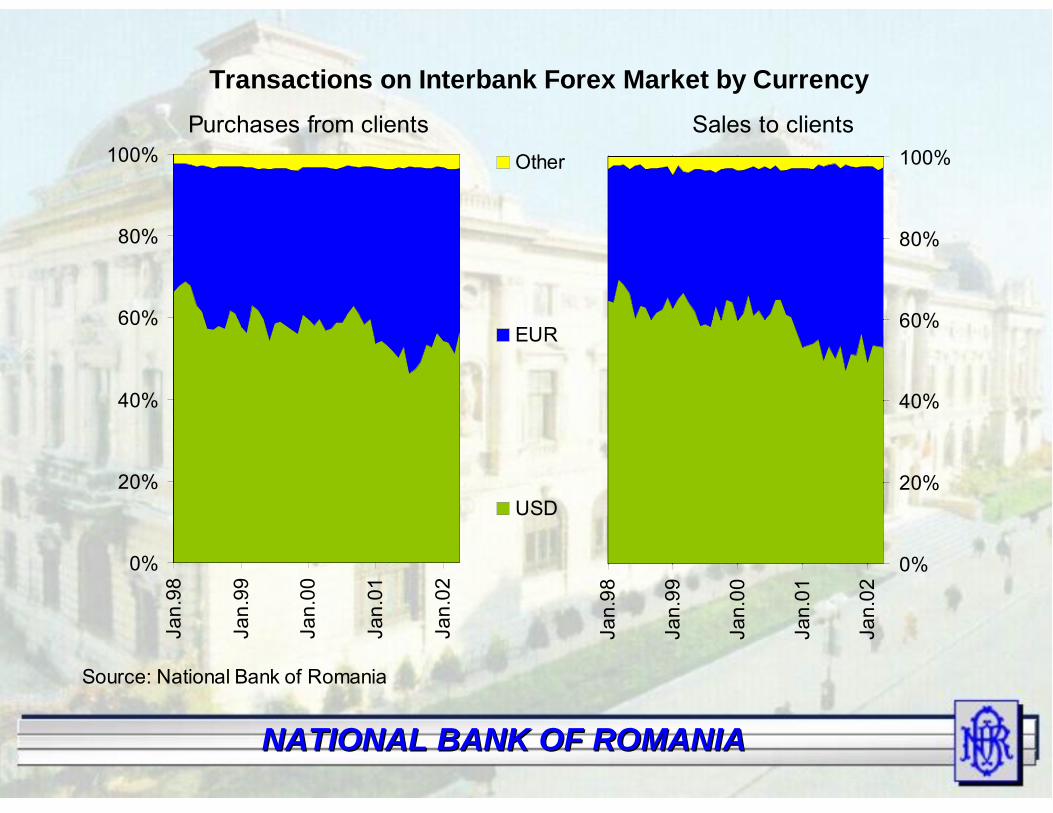
Transactions on Interbank Forex Market by Currency
0%
20%
40%
60%
80%
100%Ja
n.98
Jan.
99
Jan.
00
Jan.
01
Jan.
02
Source: National Bank of Romania
Other
EUR
USD
0%
20%
40%
60%
80%
100%
Jan.
98
Jan.
99
Jan.
00
Jan.
01
Jan.
02
Purchases from clients Sales to clients

NATIONAL BANK OF ROMANIANATIONAL BANK OF ROMANIA
Public Debt as a Share of GDP
16.5 17.5 18.8 19.3
7.2
12.6 9.2 8.0
0
5
10
15
20
25
30
35
40
1998 1999 2000 2001
Source: Ministry of Public Finance, National Institute of Statistics
domestic public debt / GDP
foreign public debt /GDP
percent

NATIONAL BANK OF ROMANIANATIONAL BANK OF ROMANIA
Public Debt as a share of GDP*2001
0
20
40
60
80
100
CzechRepublic
Hungary Poland Romania Bulgaria Slovakia Slovenia
*) 6 months, except Romania
percent
Source: IMF, International Financial Statistics; national statistics for Romania

NATIONAL BANK OF ROMANIANATIONAL BANK OF ROMANIA
External Debt by Currency
54.0%
6.2%
39.9%
USD EURO other
Source: National Bank of Romania
March 31, 2002

NATIONAL BANK OF ROMANIANATIONAL BANK OF ROMANIA
MLT External Debt
0
1
2
3
4
5
6
7
8
9
10
11
1219
97
1998
1999
2000
2001
Mar
.02
public and publiclyguaranteed debt private debt
USD billionMLT External Debt / GDP
0
2
4
6
8
10
12
14
16
18
20
22
24
1997
1998
1999
2000
2001
public and publicly guaranteeddebt /GDP
private debt /GDP
percent
Source: National Bank of Romania, National Institute of Statistics

NATIONAL BANK OF ROMANIANATIONAL BANK OF ROMANIA
External Debt Indicators
8.8
7.66.9
2.7 2.8
4.0 4.2
7.06.9
3.3
0
2
4
6
8
10
12
1998 1999 2000 2001 2002 (Mar.)Source: National Bank of Romania
public and publicly guaranteed debt - months of goods-
and-services exports foreign reserves - months of goods-and-services imports
months

NATIONAL BANK OF ROMANIANATIONAL BANK OF ROMANIA
MLT External Debt Service
1,519
2,160
1,3681,841
2,0531,570 1,484 1,350
1,104
586
612
1,202
1,3281,040
708
665
716
726
0
500
1,000
1,500
2,000
2,500
3,000
3,500
1998 1999 2000 2001 2002* 2003* 2004* 2005* 2006*Source: National Bank of Romania *) projection
private debt
public and publicly guaranteed debt
USD million

NATIONAL BANK OF ROMANIANATIONAL BANK OF ROMANIA
Spread of Romania's Eurobonds 2005, 2008 & 2012
250
300
350
400
450
500
550
600
650
700
750
800
Jul.01 Aug.01 Sep.01 Oct.01 Nov.01 Dec.01 Jan.02 Feb.02 Mar.02 Apr.02 May.02
Source: Reuters, Bloomberg
Spre
ad v
s. B
unds
(bps
)
7.0
7.5
8.0
8.5
9.0
9.5
10.0
10.5
11.0
11.5
12.0
12.5
Yiel
d (%
)
spread (2005)
spread (2008)
spread (2012)
yield (2005)
yield (2008)
yield (2012)
Note: Romania '05 was 660 bps over Bunds at launch and 300 bps on 10 May '02 Romania '08 was 592 bps over Bunds at launch and 358 bps on 10 May '03 Romania '12 was 565 bps over Bunds at launch and 364 bps on 10 May '03

NATIONAL BANK OF ROMANIANATIONAL BANK OF ROMANIA
Distribution by Investor
Insurance 7%
Pension3%
Banks42%
Asset Managers
48%
Distribution by Geography
Italy18%
UK18%
Germany27%
Switzerland7%
Benelux8%
Austria3%
France2%
Scandinavia1% Iberia
1%
US offshore2%
Greece13%
Romania's Eurobonds 2008
Source: Ministry of Public Finance

NATIONAL BANK OF ROMANIANATIONAL BANK OF ROMANIA
Distribution by Investor
Pension funds5.0%
Insurance6.0%
Other8.0%
Retail5.0%
Banks21.0%
Funds55.0%
Distribution by Geography
UK17%
USA11%
Italy17%
Greece4%
Austria3%
Spain4%
Switzerland4%
Scandinavia3%
Other4%
Netherlands6% Germany
27%
Romania's Eurobonds 2012
Source: Ministry of Public Finance
NATIONAL BANK OF ROMANIANATIONAL BANK OF ROMANIA
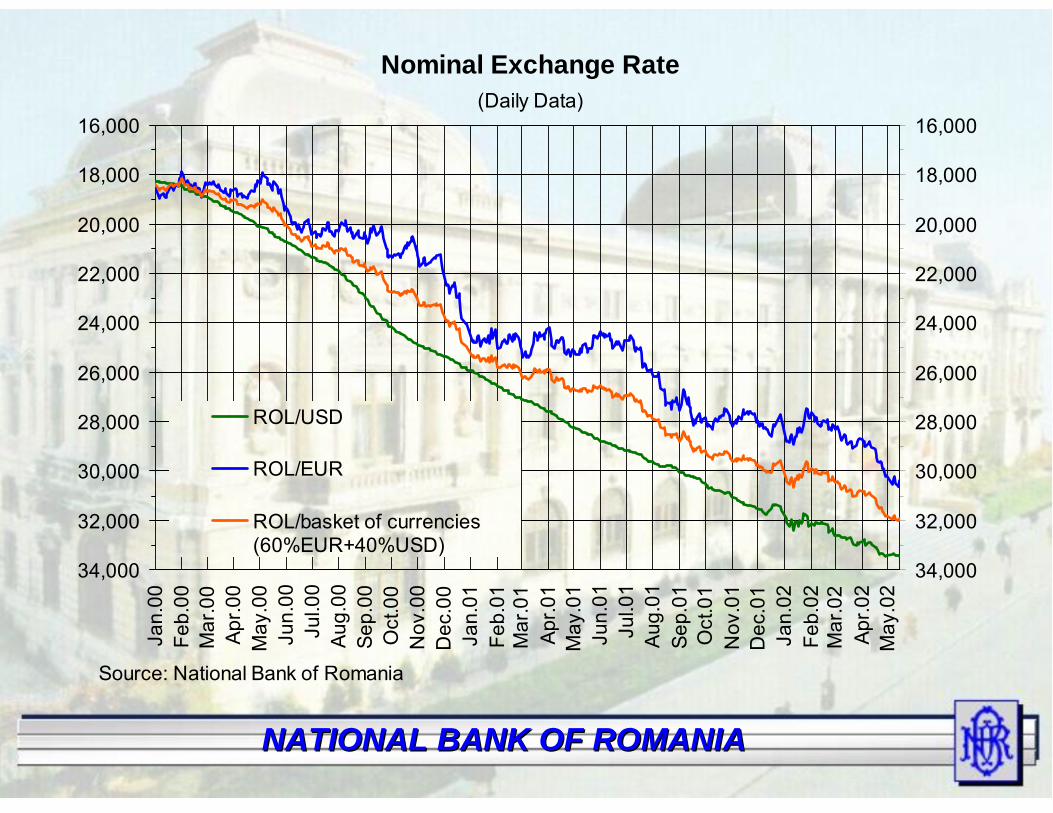
Nominal Exchange Rate
16,000
18,000
20,000
22,000
24,000
26,000
28,000
30,000
32,000
34,000
Jan.
00Fe
b.00
Mar
.00
Apr.0
0M
ay.0
0Ju
n.00
Jul.0
0Au
g.00
Sep.
00O
ct.0
0N
ov.0
0D
ec.0
0Ja
n.01
Feb.
01M
ar.0
1Ap
r.01
May
.01
Jun.
01Ju
l.01
Aug.
01Se
p.01
Oct
.01
Nov
.01
Dec
.01
Jan.
02Fe
b.02
Mar
.02
Apr.0
2M
ay.0
2
Source: National Bank of Romania
16,000
18,000
20,000
22,000
24,000
26,000
28,000
30,000
32,000
34,000
ROL/USD
ROL/EUR
ROL/basket of currencies(60%EUR+40%USD)
(Daily Data)

NATIONAL BANK OF ROMANIANATIONAL BANK OF ROMANIA
Real Exchange Rate*
75
80
85
90
95
100
105
110
115
120
125D
ec.9
8
Apr.9
9
Aug.
99
Dec
.99
Apr.0
0
Aug.
00
Dec
.00
Apr.0
1
Aug.
01
Dec
.01
Apr.0
2
index, December 1998=100
75
80
85
90
95
100
105
110
115
120
125
Source: National Bank of Romania
ROL/EUR
ROL/basket of currencies(60%EUR+40%USD)
ROL/USD
*) based on CPI differential between Romania and USA / Euro area

NATIONAL BANK OF ROMANIANATIONAL BANK OF ROMANIA
Real Exchange Rate of the ROL Against the EUR
60
70
80
90
100
110
120
130
140
150D
ec.9
8
Apr.9
9
Aug.
99
Dec
.99
Apr.0
0
Aug.
00
Dec
.00
Apr.0
1
Aug.
01
Dec
.01
Apr.0
2
index, December 1998=100
60
70
80
90
100
110
120
130
140
150
Source: National Bank of Romania
based on CPI differential between Romania and Euro area
based on PPI differential between Romania and Euro area
based on Romanian ULC
Appreciation (+)/Depreciation (–)

NATIONAL BANK OF ROMANIANATIONAL BANK OF ROMANIA
Real Salary Earnings and Labour Productivity in Industry
-25
-20
-15
-10
-5
0
5
10
15
20
25
1997 1998 1999 2000 2001 2002*
Source: National Institute of Statistics, NBR calculations
labour productivity
real salary earnings
annual percentage change
*) March

NATIONAL BANK OF ROMANIANATIONAL BANK OF ROMANIA
Gross International Reserves
0
1,000
2,000
3,000
4,000
5,000
6,000
7,000
1999 2000 2001 2002 (Mar.)
Source: National Bank of Romania
0
1,000
2,000
3,000
4,000
5,000
6,000
7,000commercial banks' forex reservesNBR forex reservesgold
USD million

NATIONAL BANK OF ROMANIANATIONAL BANK OF ROMANIA
Gross Official Reserves
0
500
1,000
1,500
2,000
2,500
3,000
3,500
4,000
4,500
5,000
5,500
6,000
6,500
1999 2000 2001 2002(May 16)Source: National Bank of Romania
USD million
NBR forex reserves
gold

NATIONAL BANK OF ROMANIANATIONAL BANK OF ROMANIA
NBR Forex Reserves Composition
0%
20%
40%
60%
80%
100%
1999 2000 2001 2002 (May.13)
othercurrencies
EUR
USD
Source: National Bank of Romania

NATIONAL BANK OF ROMANIANATIONAL BANK OF ROMANIA
Debt and Reserves
3,061
2,493
3,390
1,581 1,520
2,160
1,368
4,861
2,299
1,841
0
500
1,000
1,500
2,000
2,500
3,000
3,500
4,000
4,500
5,000
5,500
1997 1998 1999 2000 2001Source: National Bank of Romania
USD million
NBR gross reserves MLT external debt service(public and publicly guaranteed debt)

NATIONAL BANK OF ROMANIANATIONAL BANK OF ROMANIA
Share of Majority State-owned Banks* in Total Banks
0
10
20
30
40
50
60
70
80
90
100D
ec.9
1
Dec
.98
Dec
.99
Dec
.00
Dec
.01
Mar
.02
Source: National Bank of Romania
%
non-government credit total assetsnon-bank clients' deposits
Note: Starting Sep. '99 BANCOREX was subject to merger with BCR; Except BANC POST and Banca Română pentru Dezvoltare (BRD) starting Feb. '99 and Banca Agricolă (BA) starting Sep. '01.
*) Banca Comercială Română (BCR), Banca de Export Import a României (EXIMBANK), Casa de Economii şi Consemnaţiuni (CEC)
11.02.610.4
Banks with majority domestic state-owned capital1,2
1) including CEC; 2) excluding BCR
45.031.342.4
Banks with majority domestic state-owned capital1
52.265.154.4
Banks with majority foreign capital
Non-bank clients
deposits
Non-govt. credit
Total assets
share in total banks (%); March 2002

NATIONAL BANK OF ROMANIANATIONAL BANK OF ROMANIA
end-March 2002
CountryPercentage of total private
foreign share capitalPercentage of
total share capital
Greece 12.9 6.6 France 7.0 3.6 Austria 43.7 22.1 Netherlands 6.7 3.4 Italy 2.2 1.1 United Kingdom 1.7 0.9 Portugal 0.9 0.5 Total EU 75.1 38.2 Turkey 9.1 4.6 U.S.A. 8.5 4.3 Republic of Korea 2.2 1.1 Monaco 1.3 0.7 Other countries including EBRD 3.8 1.8 Total 100 50.7 Source: NBR
Foreign equity interest
Foreign Equity Interest in the Share Capital of Romanian Banks

NATIONAL BANK OF ROMANIANATIONAL BANK OF ROMANIA
Analysis Ratios for the Banking System
2.32.73.3
253.6
31.2
23.8
17.9
10.3
28.8 27.2
27.1
21.8
12.5
1.0
-15.3-20
-15
-10
-5
0
5
10
15
20
25
30
35D
ec-9
8
Dec
-99
Dec
-00
Dec
-01
Mar
-02
Source: National Bank of Romania
percent
-200
-150
-100
-50
0
50
100
150
200
250
300
350past-due anddoubtful claims /own capital(right-sidescale)
solvency ratio 1(>12%)
ROE (Netincome / Totalequity)
percent

NATIONAL BANK OF ROMANIANATIONAL BANK OF ROMANIA
The Weight of Banks Classified by the Five Composite Ratings in Total Bank Assets
0.0
70.8
19.4
8.0
1.83.4
76.4
16.0
3.8
0.4
10. 0
69. 1
17. 1
3 .4
0 .3
0.7
0.7
0.7
78.7
7.2
6.7
6.7
0.7
78.7
7.2
6.7
6.7
0.7
78.7
7.2
6.7
6.7
0.7
0.7
78.7
7.2
6.7
6.7
6.7
0.7
78.7
7.2
0
10
20
30
40
50
60
70
80
90
RATING 1 RATING 2 RATING 3 RATING 4 RATING 5
Source: National Bank of Romania
percent
December 1999
December 2000
December 2001
March 2002

NATIONAL BANK OF ROMANIANATIONAL BANK OF ROMANIA
Harmonisation of banking legislative and regulatory framework with EU Directives – steady concern of the NBR
� Progress in harmonisation of prudential supervision and accountancy practices :� New banking laws (1998), including subsequent amendments (the latest – 2001);� Regulatory framework for credit cooperatives (2000);� NBR’s norms:
� on access of credit institutions to banking business (minimum capital, licensing requirements);
� on banks’ pursuit of banking business (own funds, solvency, large exposures, derivatives);� harmonisation of accountancy practices: banks’ chart of accounts, introduction of the
International Accounting Standards, annual and consolidated accounts ;
� The relevant acquis will be fully incorporated in 2002– 2003:� amendment of The Banking Act (2002) and adjustment of the present regulatory
framework (2002-2003);� adjustment of bank chart of accounts and prudential regulations on pursuit of
banking business to the requirements of credit cooperatives (2002); � regulations on internal control of credit institutions (2002);� prudential regulations applicable to e-money issuers (2003);� regulations on consolidated supervision of credit institutions (2003 – 2004);� regulations on market risk management by credit institutions (2003 – 2004).

NATIONAL BANK OF ROMANIANATIONAL BANK OF ROMANIA
Regulatory Framework for Banks Type Prudential Regulation Comparison with EU
Standards Solvency Ratio 12% (risk-weighted) 8% (risk-weighted) Liquidity indicator Actual liquidity ≥≥≥≥ Required
liquidity
No liquidity indicator
Limits on lending (as % of own funds)
•
Credit concentration per client (group of connected clients)
20%
25%
•
Insider lending 20% (aggregate) 20% Limits on foreign exchange exposure (as % of own funds)
20% (overall) 10% (any one currency)
>>>> 2% excess multiplied by 8 to get capital adequacy
Minimum registered capital ROL 250 billion (EUR 8.85 million) EUR 5 million Loan classification and provisioning
0% for standard 5% for watch 20% for substandard 50% for doubtful 100% for loss
No EU-wide standards
Audited annual reports By audit companies External comprehensive audits
Source: NBR

NATIONAL BANK OF ROMANIANATIONAL BANK OF ROMANIA
Liberalisation of International Flows1998: liberalisation of current account operations (Art.VIII of the IMF’s Articles of Agreement);1999: liberalisation of medium- and long-term capital inflows2001: schedule of capital account liberalisation
*) including operations in units of collective investment undertakings
� direct and real-estate investment by residents abroad;� admission to quotation of national securities* on foreign capital
markets� collateral granted by foreigners to residents� personal capital movements� medium- and long-term loans related to commercial transactions or
services granted by residents to non-residents� capital transfers in performance of insurance contracts� collateral granted by residents to foreigners
Liberalisation of capital flows with significant impact on the balance of payments
Liberalisation of capital flows with low impact on balance of payments
Liberalisation of capital movements consisting of transfers in performance of insurance contracts and other capital flows with significant impact on the real sector
2004
upon accession to EU
2001-02
2003� acquisition by residents of traded foreign securities* (including OTC)� financial borrowings and loans with maturity less than 1 year
granted by foreigners to residents� financial borrowings and loans granted by residents to foreigners
� admission of foreign securities* to quotation on domestic capitalmarkets
� operations in ROL-denominated deposit accounts of foreignersopened with resident financial institutions
� operations in securities and other money-market specificinstruments
� operations in current and deposit accounts carried out by residentswith foreigners

NATIONAL BANK OF ROMANIANATIONAL BANK OF ROMANIA
Inflation Rate and Average Yield on 3M T-Bills
0
20
40
60
80
100
120Ja
n-99
Apr
-99
Jul-9
9
Oct
-99
Jan-
00
Apr
-00
Jul-0
0
Oct
-00
Jan-
01
Apr
-01
Jul-0
1
Oct
-01
Jan-
02
Apr
-02
Source: National Institute of Statistics
percent
average yield on 3M T-bills (percent per annum)
inflation rate (percentage change against the same period of previous year)
22
2002
p

NATIONAL BANK OF ROMANIANATIONAL BANK OF ROMANIA
-2.6
-3.9-3.5 -3.6
-1.9
-4.0
-3.5
-3.0
1995 1996 1997 1998 1999 2000 2001 2002p
Source: Ministry of Public Finance, National Institute of Statistics
Fiscal Deficit as Share in GDP*
*) adjusted to IMF methodology