national bank of poland working paper no. 145 · warsaw 2013 janusz jabłonowski, christoph müller...
TRANSCRIPT

Warsaw 2013
Janusz Jabłonowski, Christoph Müller
NATIONAL BANK OF POLANDWORKING PAPER
No. 145
3 sides of 1 coin – Long-term Fiscal Stability,Adequacy and Intergenerational Redistribution ofthe reformed Old-age Pension System in Poland

Design:
Oliwka s.c.
Layout and print:
NBP Printshop
Published by:
National Bank of Poland Education and Publishing Department 00-919 Warszawa, 11/21 Świętokrzyska Street phone: +48 22 653 23 35, fax +48 22 653 13 21
© Copyright by the National Bank of Poland, 2013
ISSN 2084–624X
http://www.nbp.pl
123
3 sides of 1 coin – Long-term Fiscal Stability,
Adequacy and Intergenerational Redistribution of
the reformed Old-age Pension System in Poland
Janusz Jabłonowski*
Christoph Müller**
March 2013
We would like to thank Agnieszka Chłoń-Domińczak, Tomasz Jędrzejowicz, Joanna Stachura, Paweł
Strzelecki, Stefan Moog and Natalie Laub for valuable comments as well as Lukas Leichtle and
Michael Huch for their assistance. All errors remain our own.
This paper should not be reported as representing the official views of the National Bank of Poland.
* Janusz Jabłonowski: [email protected]. ** Christoph Müller: [email protected]

WORKING PAPER No. 145 3
List of Contents
1
List of Contents
1 Introduction ................................................................................................................. 10
2 Legal framework .......................................................................................................... 12
2.1 The ‘old’ defined benefit formula ............................................................................. 12
2.2 1999 reform: introduction of the NDC & FDC schemes ........................................... 13
2.3 FDC cut ...................................................................................................................... 15
2.4 Increase in legal retirement ages to 67 .................................................................... 16
3 Applied Indicators ........................................................................................................ 19
3.1 The methodology of the Generational Accounting .................................................. 19
3.2 Long-term fiscal stability and intergenerational redistribution Indicators .............. 21
3.3 Adequacy Indicators ................................................................................................. 23
4 Computation Approach ............................................................................................... 25
4.1 Population projection ............................................................................................... 25
4.2 Micro-Simulation Model ........................................................................................... 28
4.2.1 Contribution history – initial capital and NDC/FDC contributions ........................ 29
4.2.1.1 Initial capital ....................................................................................................... 29
4.2.1.2 Pension contributions (NDC or NDC&FDC) paid between 1999 and 2011 ......... 31
4.2.2 Projection of future pension benefits.................................................................... 33
4.3 Macro Cohort Model ................................................................................................ 37
4.3.1 Revenue side – NDC system .................................................................................. 38
4.3.2 Expenditure side – NDC system ............................................................................. 47
4.4 Miners ....................................................................................................................... 55
5 Results .......................................................................................................................... 59
5.1 Long-term fiscal stability ........................................................................................... 59
5.1.1 Starting point – large deficit in 2010 ..................................................................... 59
5.1.2 Evaluation of pre-reform cash balances (before FDC cut)..................................... 60
5.1.3 Evaluation of the shift in FDC contributions (FDC cut) on cash balances .............. 61
14
16
16
17
19
20
23
23
25
27
29
29
32
33
33
35
37
41
42
51
59
63
63
63
64
65

N a t i o n a l B a n k o f P o l a n d4
List of Contents
2
5.1.4 Evaluation of the increase in retirement ages (RA67) on cash balances .............. 62
5.1.5 The sustainability gap of the ZUS old-age pension fund ....................................... 64
5.2 Intergenerational redistribution effects of past reforms ......................................... 66
5.2.1 Intergenerational redistribution effects of the FDC cut and RA67 ........................ 66
5.2.2 Intergenerational redistribution effects for the miners pensions scheme ........... 68
5.3 Adequacy of future pension benefits ....................................................................... 69
5.3.1 The status quo scenario ......................................................................................... 70
5.3.1.1 Gender specific outlook, for employees and the self-employed ....................... 70
5.3.1.2 Comparison between employees and the self-employed for each gender ....... 73
5.3.1.3 The main drivers for the drop of adequacy ratios .............................................. 75
5.3.2 The FDC cut reform ................................................................................................ 77
5.3.3 The 67 retirement age reform ............................................................................... 79
5.3.3.1 Gender specific outlook for employees and the self-employed. ....................... 79
5.3.3.2 Comparison between men and women ............................................................. 83
5.3.4 The impact of minimum pensions ......................................................................... 85
5.3.4.1 Comparison between men and women ............................................................. 86
5.3.4.2 Comparison with the adequacy of the miners’ pension scheme ....................... 88
6 Conclusions and outlook .............................................................................................. 90
Sensitivity Analysis ............................................................................................................... 95
References ........................................................................................................................... 98
Annex 1 .............................................................................................................................. 100
Adequacy for non-FDC members: status quo............................................................... 100
Employees ..................................................................................................................... 100
Self-employed ............................................................................................................... 101
Adequacy for non-FDC members: 67RA ....................................................................... 102
Non-FDC employees, women ....................................................................................... 102
66
68
70
70
72
73
74
74
77
79
81
83
83
87
89
90
92
94
98
101
103
103
103
104
105
105

WORKING PAPER No. 145 5
List of Contents
3
Annex 2 .............................................................................................................................. 105
Input data ..................................................................................................................... 105
Filter for the 1% sample: removing empty accounts .................................................... 105
Division of the micro data into 4 groups ...................................................................... 106
Statistical distribution of the initial capital and pension contributions ....................... 108
The 35% filter for the initial capital .............................................................................. 109
Computation data for non-FDC members (employees and the self-employed) .......... 114
Annex 3 .............................................................................................................................. 119
List of figures
Figure 1: Structure of Polish population ............................................................................... 27
Figure 2: The development of the age dependency ratio in Poland .................................... 28
Figure 3: Initial capital of employees, FDC members ........................................................... 30
Figure 4: Initial capital of self-employed FDC members ....................................................... 30
Figure 5: Employees FDC members, pension contributions ................................................. 31
Figure 6: Self-employed FDC members, monthly pension contributions ............................. 32
Figure 7: Overview of the future rates of return .................................................................. 36
Figure 8: Monthly average gross earnings and contribution basis ....................................... 39
Figure 9: Probability to be an FDC participant in January 2011 ........................................... 40
Figure 10: Average male NDC contribution rates ................................................................. 41
Figure 11: Monthly average male NDC contributions per contributor: 2010 vs. 2020 ........ 42
Figure 12: Probability to contribute to NDC, male ............................................................... 44
Figure 13: NDC contributions per capita of population ........................................................ 46
Figure 14: Average NDC accounts per capita of the population .......................................... 48
Figure 15: Male pension level per capita of the population, in PLN, in 2020 ....................... 51
Figure 16: Probability to retire in the new system ............................................................... 53
Figure 17: Accumulated pension benefit of males: 2010 vs. future years ........................... 54
Figure 18: Actual number of miners in the public sector ..................................................... 56
Figure 19: Projected number of miners (active contributors and pensioners) .................... 57
Figure 20: Cash balance of the miners’ pension system, in % of GDP .................................. 58
108
108
108
109
111
112
117
121

List of Figures
N a t i o n a l B a n k o f P o l a n d6
4
Figure 21: Annual cash balances – with and without FDC cut .............................................. 61
Figure 22: Annual cash balances – with and without RA67 .................................................. 63
Figure 23: ZUS deficit under different reform scenarios ...................................................... 64
Figure 24: Sustainability gaps of the public pension scheme after the recent reforms ....... 66
Figure 25: Generational accounts of ZUS-pensions .............................................................. 68
Figure 26: Generational accounts of miners’ pensions ........................................................ 69
Figure 27: Adequacy ratio (AR) for female & male employee .............................................. 72
Figure 28: Adequacy ratio (AR) for female & male self-employed ....................................... 73
Figure 29: Adequacy ratio (AR) for male self-employed & employee .................................. 74
Figure 30: Adequacy ratio (AR) for female self-employed & employee ............................... 74
Figure 31: Adequacy ratio (AR) without FDC cut, for male employee .................................. 78
Figure 32: Adequacy ratio (AR) without FDC cut, for female employee .............................. 78
Figure 33: Adequacy ratio (AR) for female employee, FDC member; RA: 60f/67f ............... 80
Figure 34: Adequacy ratio (AR) for female self-employed, FDC member; RA: 60f/67f ........ 81
Figure 35: Adequacy ratio (AR) for male employee, FDC member; RA: 65m/67m .............. 82
Figure 36: Adequacy ratio (AR) for male self-employed, FDC member; RA: 65m/67m ....... 83
Figure 37: Adequacy ratio (AR) for male & female employee, FDC member; RA: 67m/67f..
.............................................................................................................................................. 84
Figure 38: Adequacy ratio (AR) for male & female self-employed, FDC member; RA:
67m/67f ................................................................................................................................ 85
Figure 39: Adequacy ratio (AR) for male & female employee, FDC member; RA: 67m/67f,
rFDC = 3%, in relation to minimum pension ......................................................................... 86
Figure 40: Adequacy ratio (AR) for male & female self-employed, FDC member; RA:
67m/67f, rFDC = 3%, in relation to minimum pension ......................................................... 87
Figure 41: Adequacy ratio (AR) for male & female self-employed, FDC member; RA:
67m/67f, rFDC = 3%, in relation to miners’ pension and minimum pension ....................... 89
Figure 42: Adequacy ratio (AR) for female employee, FDC member; RA: 60f/67f, rFDC = 3%,
wg = AWG (constant overtime from a base year) ................................................................ 95
Figure 43: Adequacy ratio (AR) for male employee, FDC member; RA: 65m/67m, rFDC =
3%, wg = AWG (constant overtime from a base year) .......................................................... 96
Figure 44: Adequacy ratio (AR) for female employee, FDC member; RA: 60f/67f, rFDC = 3%,
wg = AWG (LE constant overtime from a base year) ............................................................ 97
3
Annex 2 .............................................................................................................................. 105
Input data ..................................................................................................................... 105
Filter for the 1% sample: removing empty accounts .................................................... 105
Division of the micro data into 4 groups ...................................................................... 106
Statistical distribution of the initial capital and pension contributions ....................... 108
The 35% filter for the initial capital .............................................................................. 109
Computation data for non-FDC members (employees and the self-employed) .......... 114
Annex 3 .............................................................................................................................. 119
List of figures
Figure 1: Structure of Polish population ............................................................................... 27
Figure 2: The development of the age dependency ratio in Poland .................................... 28
Figure 3: Initial capital of employees, FDC members ........................................................... 30
Figure 4: Initial capital of self-employed FDC members ....................................................... 30
Figure 5: Employees FDC members, pension contributions ................................................. 31
Figure 6: Self-employed FDC members, monthly pension contributions ............................. 32
Figure 7: Overview of the future rates of return .................................................................. 36
Figure 8: Monthly average gross earnings and contribution basis ....................................... 39
Figure 9: Probability to be an FDC participant in January 2011 ........................................... 40
Figure 10: Average male NDC contribution rates ................................................................. 41
Figure 11: Monthly average male NDC contributions per contributor: 2010 vs. 2020 ........ 42
Figure 12: Probability to contribute to NDC, male ............................................................... 44
Figure 13: NDC contributions per capita of population ........................................................ 46
Figure 14: Average NDC accounts per capita of the population .......................................... 48
Figure 15: Male pension level per capita of the population, in PLN, in 2020 ....................... 51
Figure 16: Probability to retire in the new system ............................................................... 53
Figure 17: Accumulated pension benefit of males: 2010 vs. future years ........................... 54
Figure 18: Actual number of miners in the public sector ..................................................... 56
Figure 19: Projected number of miners (active contributors and pensioners) .................... 57
Figure 20: Cash balance of the miners’ pension system, in % of GDP .................................. 58
31
32
34
34
35
36
40
43
44
45
46
48
50
52
55
57
58
60
61
62
65
67
68
70
72
73
76
77
78
78
82

List of Figures
WORKING PAPER No. 145 7
4
Figure 21: Annual cash balances – with and without FDC cut .............................................. 61
Figure 22: Annual cash balances – with and without RA67 .................................................. 63
Figure 23: ZUS deficit under different reform scenarios ...................................................... 64
Figure 24: Sustainability gaps of the public pension scheme after the recent reforms ....... 66
Figure 25: Generational accounts of ZUS-pensions .............................................................. 68
Figure 26: Generational accounts of miners’ pensions ........................................................ 69
Figure 27: Adequacy ratio (AR) for female & male employee .............................................. 72
Figure 28: Adequacy ratio (AR) for female & male self-employed ....................................... 73
Figure 29: Adequacy ratio (AR) for male self-employed & employee .................................. 74
Figure 30: Adequacy ratio (AR) for female self-employed & employee ............................... 74
Figure 31: Adequacy ratio (AR) without FDC cut, for male employee .................................. 78
Figure 32: Adequacy ratio (AR) without FDC cut, for female employee .............................. 78
Figure 33: Adequacy ratio (AR) for female employee, FDC member; RA: 60f/67f ............... 80
Figure 34: Adequacy ratio (AR) for female self-employed, FDC member; RA: 60f/67f ........ 81
Figure 35: Adequacy ratio (AR) for male employee, FDC member; RA: 65m/67m .............. 82
Figure 36: Adequacy ratio (AR) for male self-employed, FDC member; RA: 65m/67m ....... 83
Figure 37: Adequacy ratio (AR) for male & female employee, FDC member; RA: 67m/67f..
.............................................................................................................................................. 84
Figure 38: Adequacy ratio (AR) for male & female self-employed, FDC member; RA:
67m/67f ................................................................................................................................ 85
Figure 39: Adequacy ratio (AR) for male & female employee, FDC member; RA: 67m/67f,
rFDC = 3%, in relation to minimum pension ......................................................................... 86
Figure 40: Adequacy ratio (AR) for male & female self-employed, FDC member; RA:
67m/67f, rFDC = 3%, in relation to minimum pension ......................................................... 87
Figure 41: Adequacy ratio (AR) for male & female self-employed, FDC member; RA:
67m/67f, rFDC = 3%, in relation to miners’ pension and minimum pension ....................... 89
Figure 42: Adequacy ratio (AR) for female employee, FDC member; RA: 60f/67f, rFDC = 3%,
wg = AWG (constant overtime from a base year) ................................................................ 95
Figure 43: Adequacy ratio (AR) for male employee, FDC member; RA: 65m/67m, rFDC =
3%, wg = AWG (constant overtime from a base year) .......................................................... 96
Figure 44: Adequacy ratio (AR) for female employee, FDC member; RA: 60f/67f, rFDC = 3%,
wg = AWG (LE constant overtime from a base year) ............................................................ 97
5
Figure 45: Adequacy ratio (AR) for male employee, FDC member; RA: 65m/67m, rFDC =
3%, wg = AWG (LE constant overtime from a base year) ..................................................... 97
Figure 46: Adequacy ratio (AR) for female & male employee, non FDC member; RA:
60f/65m, rFDC = 3%, wg = AWG ......................................................................................... 101
Figure 47: Adequacy ratio (AR) for female & male self-employed, non FDC member; RA:
60f/65m, rFDC = 3%, wg = AWG ......................................................................................... 102
Figure 48: Adequacy ratio (AR) for female employee, non FDC member; RA: 60f/67f, rFDC =
3%, wg = AWG ..................................................................................................................... 103
Figure 49: Adequacy ratio (AR) for male employee, non FDC member; RA: 65m/67m, rFDC
= 3%, wg = AWG .................................................................................................................. 103
Figure 50: Adequacy ratio (AR) for male & female employee, non FDC member; RA:
67m/67f, rFDC = 3%, in relation to minimum pension (idx = 20%gAWG; idx = gAWG) ..... 104
Figure 51: Female relative group sizes ............................................................................... 107
Figure 52: Male relative group sizes ................................................................................... 107
Figure 53: employees FDC….………………………………………………………………………………………….108
Figure 54: self-employees FDC............................................................................................ 108
Figure 55: employees non FDC……………………………………………………………………………………….108
Figure 56: self-employees non FDC .................................................................................... 108
Figure 57: Distribution of the initial capital of employed males born in 1961 .................. 109
Figure 58: Distribution of the pension contributions of employed females .................... 110
Figure 59: Distribution of the pension contributions of self-employed females .............. 111
Figure 60: non FDC employees initial capital, January 2011, PLN ...................................... 116
Figure 61: non FDC self-employed initial capital, January 2011, PLN ................................. 117
Figure 62: employees non FDC members, pension contributions in 2010, PLN ................ 118
Figure 63: non employees non FDC members, pension contributions (NDC only) ............ 118
82
84
85
86
87
88
89
90
91
93
98
99
100
100
104
105
106
106
107

List of Figures
N a t i o n a l B a n k o f P o l a n d8
5
Figure 45: Adequacy ratio (AR) for male employee, FDC member; RA: 65m/67m, rFDC =
3%, wg = AWG (LE constant overtime from a base year) ..................................................... 97
Figure 46: Adequacy ratio (AR) for female & male employee, non FDC member; RA:
60f/65m, rFDC = 3%, wg = AWG ......................................................................................... 101
Figure 47: Adequacy ratio (AR) for female & male self-employed, non FDC member; RA:
60f/65m, rFDC = 3%, wg = AWG ......................................................................................... 102
Figure 48: Adequacy ratio (AR) for female employee, non FDC member; RA: 60f/67f, rFDC =
3%, wg = AWG ..................................................................................................................... 103
Figure 49: Adequacy ratio (AR) for male employee, non FDC member; RA: 65m/67m, rFDC
= 3%, wg = AWG .................................................................................................................. 103
Figure 50: Adequacy ratio (AR) for male & female employee, non FDC member; RA:
67m/67f, rFDC = 3%, in relation to minimum pension (idx = 20%gAWG; idx = gAWG) ..... 104
Figure 51: Female relative group sizes ............................................................................... 107
Figure 52: Male relative group sizes ................................................................................... 107
Figure 53: employees FDC….………………………………………………………………………………………….108
Figure 54: self-employees FDC............................................................................................ 108
Figure 55: employees non FDC……………………………………………………………………………………….108
Figure 56: self-employees non FDC .................................................................................... 108
Figure 57: Distribution of the initial capital of employed males born in 1961 .................. 109
Figure 58: Distribution of the pension contributions of employed females .................... 110
Figure 59: Distribution of the pension contributions of self-employed females .............. 111
Figure 60: non FDC employees initial capital, January 2011, PLN ...................................... 116
Figure 61: non FDC self-employed initial capital, January 2011, PLN ................................. 117
Figure 62: employees non FDC members, pension contributions in 2010, PLN ................ 118
Figure 63: non employees non FDC members, pension contributions (NDC only) ............ 118
110
110
111
111
111
111
112
113
114
118
119
120
120

List of Tables
WORKING PAPER No. 145 96
List of tables
Table 1: Old-age pension contribution rates for NDC 1, NDC2, and FDC ............................ 16
Table 2: Assumptions of the demographic scenarios .......................................................... 26
Table 3: Valorisation factor of the FDC contributions and of NDC contributions & the initial
capital................................................................................................................................... 35
Table 4: development of the minimum salary levels......................................................... 112
Table 5: Development of the contribution ceiling and a minimum possible basis for the
pension contribution purposes for self-employed ............................................................ 113
Table 6: Birth date, age required to retire, and expected earliest date of retirement for
women ............................................................................................................................... 119
Table 7: Birth date, age required to retire, and expected earliest date of the retirement for
men (all male cohorts are entitled to POAP) ..................................................................... 122
List of abbreviations
AWG: Ageing Working Group (European Commission)
DB: defined benefit
FDC: Funded defined contribution,
FGB: Future Generations’ Burden
FR: Fertility rate
GA: Generational Accounting
GAs: Generational Accounts
MoF: Ministry of Finance
NDC: Notional defined contribution
PAYG: Pay-As-You-Go
ZUS: Zakład Ubezpieczeń Społczenych (Social Insurance Institution)
20
30
39
115
116
121
124

List of Abbreviations
N a t i o n a l B a n k o f P o l a n d10
6
List of tables
Table 1: Old-age pension contribution rates for NDC 1, NDC2, and FDC ............................ 16
Table 2: Assumptions of the demographic scenarios .......................................................... 26
Table 3: Valorisation factor of the FDC contributions and of NDC contributions & the initial
capital................................................................................................................................... 35
Table 4: development of the minimum salary levels......................................................... 112
Table 5: Development of the contribution ceiling and a minimum possible basis for the
pension contribution purposes for self-employed ............................................................ 113
Table 6: Birth date, age required to retire, and expected earliest date of retirement for
women ............................................................................................................................... 119
Table 7: Birth date, age required to retire, and expected earliest date of the retirement for
men (all male cohorts are entitled to POAP) ..................................................................... 122
List of abbreviations
AWG: Ageing Working Group (European Commission)
DB: defined benefit
FDC: Funded defined contribution,
FGB: Future Generations’ Burden
FR: Fertility rate
GA: Generational Accounting
GAs: Generational Accounts
MoF: Ministry of Finance
NDC: Notional defined contribution
PAYG: Pay-As-You-Go
ZUS: Zakład Ubezpieczeń Społczenych (Social Insurance Institution)

Abstract
WORKING PAPER No. 145 117
Abstract
In this paper we evaluate the long-term performance of the Polish public pension system
from three perspectives: fiscal stability, intergenerational redistribution and adequacy of
pension benefits. We assess the two recent public pension reforms undertaken in Poland:
1) the shift of a part of pension contributions from the funded to the unfunded pension
pillar and 2) the gradual increase in retirement ages to 67 for both men and women. The
results suggest that the combined effect of both reforms shows a significant improvement
in cash balances until 2040. The burden of the reforms is shared relatively equally across
generations. The effect of higher retirement ages on benefit levels is also positive,
especially for those having standard job contracts. What is worrying, however, is the
general future drop of benefit levels, in particular for the group of self-employed persons.
Policy makers should, therefore, start discussing possible measures today if they aim to
avoid a significant increase in old age poverty in the future.
Key words: Generational Accounting, fiscal sustainability, fiscal policy, Poland, pension
reform
JEL Classification: H50, H55, H60, H68, J10, H30

Non-technical summary
N a t i o n a l B a n k o f P o l a n d12 8
Non-technical summary
During the coming decades Poland faces one of the most rapid population ageing process
in the entire EU. In the light of this development the Polish government adopted a
profound pension reform in 1999. Instead of the previous defined benefit system a new
two pillar system, consisting of a notional defined contribution (NDC) and a funded
defined contribution pillar (FDC), was introduced. After a decade of less profound pension
reforms, the Polish government legislated two significant changes of the public pension
system in 2011 and 2012: 1) a partial shift of contributions from the mandatory FDC to the
NDC system – called here the FDC cut reform – and 2) a gradual increase in the statutory
retirement age to 67 for both men and women.
Against this background, our paper aims to provide an evaluation of both recent pension
reforms from three perspectives: 1) long-term cash balances, 2) intergenerational
redistribution, and 3) adequacy of future individual pension levels. The ‘three sides’
perspective approach allows to evaluate simultaneously if the improvement from one
perspective is followed by an improvement or worsening of the others.
Thanks to a new 1% data sample of ZUS contributors, we are able to differentiate the
adequacy analysis by earnings groups and by types of job contracts, which vary in terms of
amounts of pension contributions. We distinguish between standard job contracts and
self-employed. On this basis we can evaluate the consequences of the choice of a
particular job contract (employee or self-employed) on future pension levels.
Our results show that the cut of the FDC contribution rate significantly reduces the ZUS
deficit over the next 30 years. In the very long perspective it has no effect on its deficit
level. The consequences of this reform are shared relatively equally across generations.
Finally, adequacy ratios – i.e. initial pension benefits in relation to the average earnings in
the economy – do not change significantly with the FDC cut reform in the coming two
decades. This fact can be explained by the little difference between the expected
(accumulated) rate of return of the funded pillar assets and the notional accounts
indexation over the coming 15 years. In the long-term, however, adequacy ratios may drop
due to the FDC cut reform as the indexation of the NDC system is expected to shrink
significantly in future decades in line with the ageing process.
Non-technical summary
WORKING PAPER No. 145 139
The increase in retirement ages to 67, which will take its full effect in 2020 for men and
2040 for women has a positive impact on cash balances over the next three decades. A
later retirement increases revenues and reduces the inflow of new pensioners until 2040
significantly. The increase in retirement ages does not imply significant intergenerational
redistribution effects. Adequacy ratios increase due to longer accrual of pension
entitlements and a shorter retirement period.
The miners’ pension subsystem is untouched by recent reforms. It shows a significant long
term cash imbalance, significant intergenerational imbalance, and much higher adequacy
ratios when compared with general employees and especially, the self-employed.
In conclusion, both recently adopted pension reforms show a positive (or relatively
neutral) effect in all analysed perspectives. Worrying is, however, the general future drop
in benefit levels. This decrease is driven equally by 1) the NDC benefit formula,
automatically reducing benefits in line with the demographic development, and by 2)
changes in the contribution history. The drop of future pension levels can be moderated
by the analysed reforms only to some extent. In particular the group of self-employed
persons can expect a tremendous shrinking of adequacy ratios in the coming decades,
mainly due to the low income declared for pension contribution purposes. Researchers
and policy makers should, therefore, start discussing possible measures today, if they aim
to avoid a significant increase in old-age poverty in the future.

Introduction
N a t i o n a l B a n k o f P o l a n d14
1
10
1 Introduction
In the coming decades Poland faces one of the most rapid population ageing process in
the entire EU. In light of this development the Polish government adopted a profound
pension reform in 1999. Instead of the old defined benefit system a new two pillar system,
consisting of a notional defined contribution (NDC) and a funded defined contribution
pillar (FDC), was introduced. Currently, after over a decade, the Polish government
legislated two further significant reforms of the public pension system: 1) a partial shift of
contributions from the mandatory FDC to the NDC system in 2011 and 2) a gradual
increase in the statutory retirement age to 67 for both men and women in 2012.
The aim of this paper is to evaluate these recent changes of the Polish public pension
system from three perspectives. First, we assess the fiscal long-term stability of the ZUS
old-age pension fund estimating long-term cash balances and the sustainability gap.
Second, we analyse the intergenerational redistribution effects of the recent pension
reforms on the basis of generational accounts. Third, we evaluate the adequacy of future
pension benefits by means of adequacy ratios. The evaluation of the undertaken reforms
from these three perspectives, in our opinion, takes into account the interest of all actors
involved in the reform process: the political decision makers and the managers of the
public finances, who are interested in long-term fiscal stability; contributors and
pensioners, who seek for adequate benefits to finance retirement, and, at last, but not
least, all those, who are interested in the intergenerational redistribution effects of reform
measures.
There are only a few similar studies on the Polish old-age pension system which have been
carried out in the past years. This may be surprising given the fact that the common old-
age pension system represents the largest public budget with 7.2% of GDP. Previous
studies provide only a limited perspective on the long-term performance of the Polish old-
age pension system. A part of the past studies focuses only on “one side of the coin” and
addresses either total pension expenditures and revenues (EC, 2007; Kempa, 2010) or only
adequacy (ISG, 2009). Two sides, namely adequacy and fiscal long-term stability are
addressed by Chłoń-Domińczak and Gora (2006), Bielecki (2011), EC (2012) and Egert
(2012). The methodological consistency in those latter studies may be, to some extent,

Introduction
WORKING PAPER No. 145 15
1
11
questionable (Chłoń-Domińczak and Góra, 20061; Bielecki, 20112). Additionally, these
studies rely on discussible assumptions (e.g. Chłoń-Domińczak and Góra, 20063; Egert,
20124). The issue of minimum pensions was tackled in Chłoń-Domińczak and Strzelecki
(2010). To our knowledge none of the previous studies takes into account the full and
actual contribution history of current contributors. Moreover, the “third side of the coin”,
the intergenerational redistribution perspective is not considered in any of the former
studies.
Our study seeks to bridge this gap of previous findings and aims to provide a more
complete and consistent evaluation of the Polish pension system. It relies on a large panel
dataset which covers the contribution history, i.e. the accrued pension rights, until the
year 2011 of a representative 1% sample of all contributors in Poland registered in the
Social Insurance Office database (Polish: ZUS). The 1% sample provides a background for
the analyses of the distribution of future pension levels. Additionally, more precise
forecasts of expected number of minimum pension beneficiaries are possible. Also an
impact of the recently adopted increase in retirement ages on the long-term performance
of the pension fund is analysed in this study for the first time independently of the official
legal act justification.
The study is structured as follows: chapter 2 outlines the legal framework of the Polish old-
age pension system and its latest reforms. The indicators used to assess the long-term
performance of the pension system are described in chapter 3. Then, the computation
approach for the projection of future pension benefits is presented in chapter 4. It
includes a description of the pension data as well as of the assumptions taken. Chapter 5
presents the results of our study from three perspectives: 1) an assessment of the long-
term cash balance forecast, 2) an analysis of the intergenerational redistribution and 3) of
the adequacy of future pension benefits. Finally, chapter 6 provides a summary of the
main findings and the outlook on future research.
1 The authors apply a different wage growth for adequacy analysis than for the aggregate expenditure projections. 2 The outcomes provided by Bielecki (2011) are estimated by different institutions, consistency of the estimation approach is therefore questionable. 3 The authors take the simplifying assumption that individuals show no interruptions in their working career. 4 Egert (2012) e.g. bases on the assumption that all individuals born after 1948 participate in the FDC system.

Legal framework
N a t i o n a l B a n k o f P o l a n d16
2
12
2 Legal framework
The Polish old-age provision in its current shape was founded in 1999, when the NDC and
FDC pillar was introduced. It replaced the old-age-pension provision system, with a
traditional defined benefit formula (DB). In the following passages we outline the old
pension rules set up during the transformation period (section 2.1). Thereafter, the benefit
formula of the new NDC system introduced in 1999 is described (section 2.2). Finally, we
illustrate the main changes introduced with the FDC cut (section 2.3) and the increase in
retirement ages to 67 (section 2.4).
2.1 The ‘old’ defined benefit formula
The pension benefit formula for the old system (persons born before 1949 and miners5) is
a quite complex procedure, so the initial remarks on the computation stages and used
variables might be useful. The calculation of the pension benefit amount for year j consists
of several steps. Firstly, a person that applies for the old-age pension chooses any 10
consecutive years from his/her career path, out of the last 20 years of the career (j-20)
that will serve as a background for the individual index of the basis for contribution rates
(IBCR), expressed in percentage points. Obviously, 10 consecutive years with the highest
salaries are chosen: the IBCR is an average of the annual gross income earned in the
chosen 10 consecutive years in relation to respective annual average salaries in the
economy. The IBCR maximum level is limited to 250%. The individual IBCR serves then as a
multiplier for the general base amount (BA), a countrywide figure common for all types of
social benefits. BA is computed as an average gross salary in the entire economy in the last
quarter of the year j-1 net of the social contributions. In effect, the individual basis for
contribution rates (BCR) is expressed in Polish zloty.
Further crucial individual indicators necessary to calculate the benefit level are: the
number of contributory periods6 and non-contributory periods . The
contributory periods are those when the social contributions were actually paid, whilst
non-contributory periods are those for which the given person was regarded as insured,
5 The formula for miners is slightly different, nevertheless we do not enter into details in this paper. 6 Expressed in months. For the purpose of this study we round them to full years.

Legal framework
WORKING PAPER No. 145 17
2
13
though the contributions were not paid. The non-contributory periods taken to the old-
age pension formula cannot exceed 1/3 of contributory periods.
The initial monthly old-age pension for a person (OAP) who applied for a benefit in year (j)
is computed as follows:
2.2 1999 reform: introduction of the NDC & FDC schemes
In the new mixed system based on individual funded and unfunded accounts the statutory
retirement age remained unchanged: 60 years for women and 65 years for men. However,
after 1999, the possibility to retire earlier, easily accessible to many professions included
in the new system (e.g. miners, railway workers, teachers, persons working in specific
conditions), hampered the positive, self-stabilizing effect of the new NDC rules. Early
retirement was partly abolished in 2008. The only professional group which kept their
early retirement privileges in an infinite time horizon, are miners. For the other groups a
temporary ‘bridging pension’ system was installed to ease the process of the abolition of
early retirement. The new reformed NDC system treats insured persons differently
depending on their year of birth:
For persons born before 31st December 1948 all paid contributions remained in the
old system, so for them the pension is calculated using the old rules.
Persons born between 1st January 1949 and 31st December 1968 could choose
whether to stay only in the NDC system or enter the one with split contributions
between NDC and FDC schemes. Despite their choice the ‘initial capital’ was computed
to reflect the notional contributions virtually collected during the working life by
persons with work experience before 1999. Initial capital was computed to translate
the pre-reform working career to NDC contributions.
All contributors born after 1st January 1969 are mandatorily covered by the new,
shared NDC/FDC system.
Since the pension reform of 1999 the Polish general pension system is based on a three
pillar system, consisting of the following public and private schemes:

Legal framework
N a t i o n a l B a n k o f P o l a n d18
2
14
1. 1st pillar: mandatory notional defined contribution scheme (NDC), where amounts of
contributions are recorded on individual accounts, set for every insured person. The
actual contributions are spent on current social benefits. The collected, “virtual”
amounts are indexed annually with the floating interest rate, currently reflecting ZUS
pension contributions fund growth. The sum of contributions collected over lifetime
and indexed is divided upon retirement by the number of (expected) months of
remaining life. Life expectancy tables are unisex, officially published and updated
annually by the NSI.
2. 2nd pillar: mandatory funded defined contribution schemes, so called open pension
funds (FDC), where around 60% of employee contributions from the 1st pillar is
transferred and then invested.
3. 3rd pillar: consists of diverse forms of private voluntary pension insurance funds.
The pension benefit which applies for the NDC old-age pension (NOAP) in year (j), equals
the quotient of the basis for contribution rates (BCR) and the expected unisex life
expectancy at the age (reached in year x) of the pension applicant (LEj) expressed in
months.
The individual benefit basis BCR is equal to the sum of pension contributions collected on
the notional individual pension account (NDC) and the initial capital (IC).
The stock of the initial capital is computed similarly to the OAP (3), although, always for
the 1 January 1999, and then increased with the use of full wage indexation until the
moment of application for computation, e.g. upon retirement. Comparing with the DB old-
age pension formula, there are a few modifications: there’s no limitation on the number of
non-contributory periods considered in the formula, as in the case of OAP – the entire
proven career path is considered. Secondly, the so called social part is computed with the
use of basis amount (see (1)) from the second quarter of 19987 ( ) and the p factor,
which is calculated on the basis of the age of a contributor , contributor’s work
7 PLN 1220,89. More insight into actual IC figures in Annex 2.

Legal framework
WORKING PAPER No. 145 19
2
15
experience and the required number of contributory and non-contributory
periods (gender specific: 20 years for women, and 25 years for men). The p is
limited to 100%. The retirement age is administratively set to the age of 60 for
women, and 65 for men,8 the unisex life expectancy in 1999 for a person aged 62 (LEIC)
amounts to 209 months, whilst the number 18 (in p) refers to the presumed starting point
of the professional career, replaced possibly by the actual age, upon verification.
√
∑
( )
where:
The insured persons born after 1969 and those who had chosen to participate in the FDC
scheme have their pensions raised by the adequate portion of the FDC contributions:9
There are also other systems, established for certain professions, e.g. farmers, uniformed
services and judges and prosecutors. These systems are in principle based on defined
benefits formulas, and are not covered by this paper.
2.3 FDC cut
In 2011 the government decided to change the proportions between the notional and
funded part of the old-age pension contribution. Since the introduction of the NDC/FDC
reform in 1999, the contribution rates remained unchanged until 2011, amounting, as
stated above, to 12.22% notionally recorded on the individual NDC account, and 7.3%
actually saved on the FDC account. Due to public budget constraints and sluggish
8 The rules have not changed after the introduction of RA67 reform. Such change would increase the denominator in the p factor and decrease the level of initial capital, especially for women. 9 For a more comprehensive description see chapter: Revenue side – NDC system.

Legal framework
N a t i o n a l B a n k o f P o l a n d20
2
16
investment policy of the FDC managing funds, the government changed in 2011 the
proportions of the contributions transferred to the unfunded and funded pillar.
In May 2011 the new split of contributions was introduced: the FDC part was lowered from
the initial 7.3% to 2.3% and the NDC part was split into two subaccounts: NDC 1 and NDC
2. The indexation rules for the NDC 1 remained unchanged and equal to the nominal
growth of the wage fund in the economy, whilst the new NDC 2 part, held also in the ZUS,
will be indexed in accordance with the average past 5 year nominal growth of the GDP.
The table below explains the exact contribution split in the coming years between NDC 1,
NDC 2 and FDC:
Table 1: Old-age pension contribution rates for NDC 1, NDC2, and FDC in the coming
years
Years NDC 1 in %
of gross income
NDC 2 in %
of gross income
FDC in %
of gross income
1999 - May 2011 12.22 0.0 7.3
May 2011-2012 12.22 5.0 2.3
2013 12.22 4.5 2.8
2014 12.22 4.2 3.1
2015 12.22 4.0 3.3
2017 onwards 12.22 3.8 3.5
Source: own illustration based on official act
Moreover, the contribution fees of FDC accounts were cut from the possible maximum of
7% to 3.5%. The structure of investment of the FDC will change as well in the future: the
limit of the investment in shares10 will be raised gradually from 40% now to 90% in 2034.
However, the limit for investment in foreign assets will remain unchanged at 5%.
2.4 Increase in legal retirement ages to 67
With the reform proposal, passed by the Parliament in May 2012, the statutory retirement
age for men and women insured in the general public old-age pension system (NDC/FDC)
will gradually rise for women from 60 to 67 (from 2013 until 2040) and for men from 65 to
10 Only these quoted on the domestic stock exchange (GPW).

Legal framework
WORKING PAPER No. 145 21
2
17
67 (from 2013 until 2020). Actually, the retirement age would be increased by 3 months
each year, but our model recognizes whole years cohorts, so in the results we will observe
retirement age increase by 1 full year every 4 years. In principle the retirement age (RA)
for men would increase as follows: 2016 RA=66; 2020 RA=67. Regarding women, their
retirement age would be increased as follows: 2016 RA=61, 2020 RA=62, 2024 RA=63,
2028 RA=64, 2032 RA=65, 2036 RA=66, 2040 RA=67. The detailed table with birthdates,
ages, and respective earliest retirement dates can be followed in Annex 3. The reform
leaves unchanged the special privileges granted in the past decades e.g. to miners,
bridging pensioners, teachers or pre-retirement beneficiaries.
To ease the possible social tensions related to the extended working period, the reform
introduces the possibility to retire before the statutory retirement age under a mechanism
of a so-called partial old-age pension (POAP). The POAP would apply if the following
conditions were met for women: 62 years of age and 35 years of working experience
(insurance11) and for men respectively: 65 years of age and 40 years of working experience
(insurance). Where these conditions are satisfied, the POAP will be possible, amounting to
50% of the full old-age pension (FOAP). The POAP would not be increased to the level of
the minimum pension, however, it would be indexed in accordance with the standard
rules applied to FOAP and other social benefits. The POAP would be paid despite
(dis)continuation of work. Therefore, in practice it would be possible to reduce partly the
workload from the age of 62/65 for women/men with a partial reduction of the salary
replaced to some extent by the POAP. Upon reaching the statutory retirement age, an
insured person could apply for the retirement, and then the POAP would turn into FOAP.
In such cases, the basis for the calculation of the FOAP would be reduced by the gross
amounts of already paid POAP benefits. The capital (funded) old-age pension would be
adequately affected, too. Specifically, the temporary capital old-age pensions (TCOAP),
paid currently until the age of 65, would have to be adjusted to the extended working
period of women. Therefore, in the transition period of 2014-2020, the age required in
order to be able to receive the TCOAP would be extended from 65 to 67. After a woman
reaches the statutory retirement age, the TCOAP would transform into the lifetime capital
11 To be precise, it denotes so-called contributory and non-contributory periods. Contributory periods entail employment or self-employment. Non-contributory periods mean the periods of insurance, when contributions were paid for the insured person, e.g. during unemployment or a maternal leave. The non-contributory periods may amount to up to ¼ of the overall working experience (e.g. studies).

Legal framework
N a t i o n a l B a n k o f P o l a n d22
2
18
old-age pension (LCOAP). The TCOAP is a temporary instrument, applicable until the full
phase-in of the gender-unified retirement age.12
The minimum pensions were also adjusted: the working experience (insurance) period
required to obtain entitlement to compensation of the pension to the minimum level will
be extended gradually for women from 20 to 25 years. The transition periods starts in
2014, and since then the working experience period will be extended 1 year every two
years, until the end of 2021.
12 Temporary pensions (POAP and TCOAP) will not be addressed in the results for the first two facets: cash flows and intergenerational redistribution. We will tackle them shortly in the part devoted to adequacy ratios.
Applied Indicators
WORKING PAPER No. 145 23
3
19
3 Applied Indicators
To assess the long-term performance of the pension system a number of indicators are
applied in this study. Our indicators of the long-term fiscal stability are based on the
methodology of Generational Accounting which is outlined in section 3.1. The applied
indicators of fiscal sustainability and intergenerational redistribution are described in
section 3.2. Thereafter, the applied adequacy indicator is presented in section 3.3.
3.1 The methodology of the Generational Accounting
To measure the sustainability of a country’s public sector we use the method of
Generational Accounting developed by Auerbach, Gokhale and Kotlikoff (1991, 1992 and
1994).13 In contrast to traditional budget indicators which are based on annual cash flow
budgets, Generational Accounting is founded on the intertemporal budget constraint and
therefore the long-term implications of a current policy can be computed.
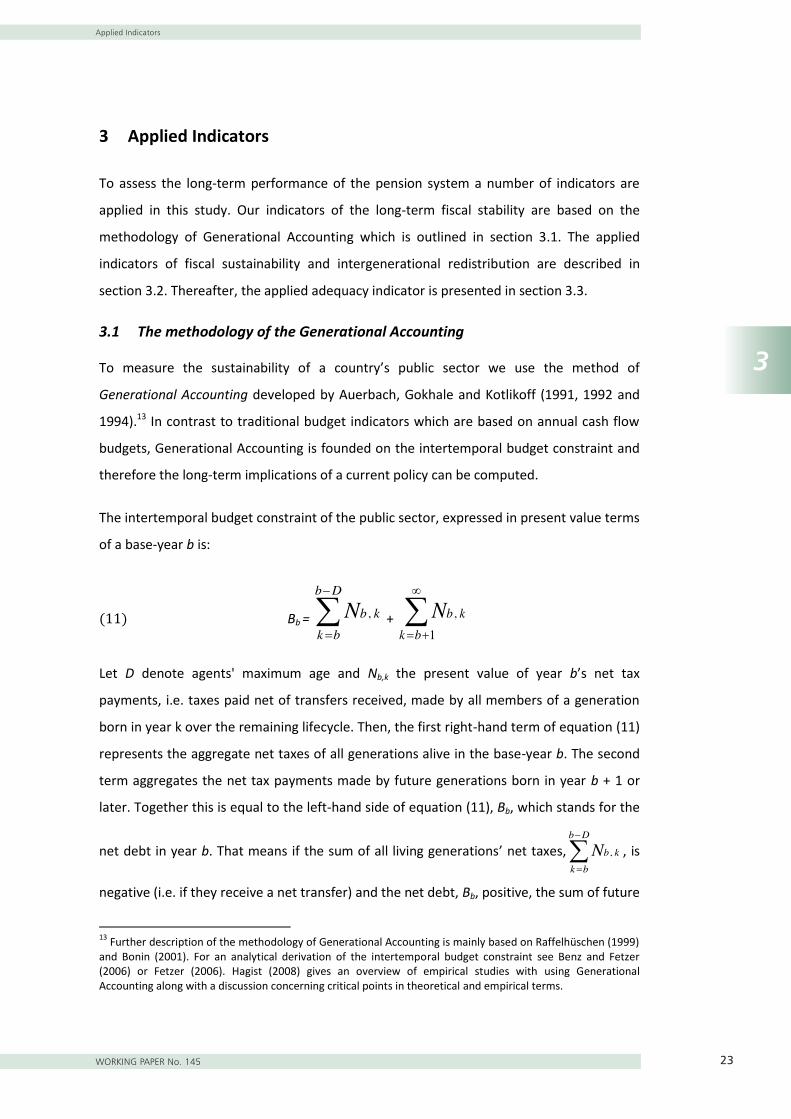
The intertemporal budget constraint of the public sector, expressed in present value terms
of a base-year b is:
Bb =
Db
bkkbN ,
+
1,
bkkbN
Let D denote agents' maximum age and Nb,k the present value of year b’s net tax
payments, i.e. taxes paid net of transfers received, made by all members of a generation
born in year k over the remaining lifecycle. Then, the first right-hand term of equation (11)
represents the aggregate net taxes of all generations alive in the base-year b. The second
term aggregates the net tax payments made by future generations born in year b + 1 or
later. Together this is equal to the left-hand side of equation (11), Bb, which stands for the
net debt in year b. That means if the sum of all living generations’ net taxes,
Db
bk
kbN , , is
negative (i.e. if they receive a net transfer) and the net debt, Bb, positive, the sum of future
13 Further description of the methodology of Generational Accounting is mainly based on Raffelhüschen (1999) and Bonin (2001). For an analytical derivation of the intertemporal budget constraint see Benz and Fetzer (2006) or Fetzer (2006). Hagist (2008) gives an overview of empirical studies with using Generational Accounting along with a discussion concerning critical points in theoretical and empirical terms.

Applied Indicators
N a t i o n a l B a n k o f P o l a n d24
3
20
generations’ net taxes has to be positive to balance the government’s intertemporal
budget i.e. in a long-term perspective net transfers received by living generations plus the
net debt of the base-year have to be financed by net taxes paid by future generations.
To calculate generations' aggregated lifecycle net tax payments, the net payment terms in
equation (11) are decomposed into:
Nb,k =
Dk
kbs ,maxTs,k Ps,k (1+r)b-s
In equation (12), Ts,k denotes the average net tax paid in year s by a representative
member of the generation born in year k, whereas Ps,k stands for the number of members
of a generation born in year k who survive until year s. To compute the remaining lifetime
net payments of living generations, the future demographic structure is specified
conducting long-term population forecasts.
Typically, Generational Accountants disaggregate equation (12) even further. To
incorporate gender-specific differences in average tax payments and transfer receipts by
age, separate aggregation of the average net taxes paid by male and female cohort
members is required. The products aggregated in equation (12) represent the net taxes
paid by all members of generation k in year s. For generations born prior to the base-year
the summation starts from year b, while for future born cohorts, the summation starts in
year k > b. Irrespective of the year of birth, all payments are discounted back to the base-
year b by application of a real interest rate r.
The age-specific net tax payment in year s of agents born in year k can be decomposed as
Ts,k = i
iksh ,,

Applied Indicators
WORKING PAPER No. 145 25
3
21
hs,k,i stands for the average tax or transfer of type i paid or received in year s by agents
born in year k, thus of age s – k. 14 In equation (13), h > 0 indicates a tax payment, whereas
h < 0 defines a transfer.
Applying the method of Generational Accounting it is conventionally assumed that the
initial fiscal policy and economic behaviour are constant over time. Under this condition it
is possible to project future average tax payments and transfer receipts per capita from
the base-year age profile of payments according to
hs,k,i = hb, b-(s-k),i (1 + pg)s-b
where pg represents the annual rate of productivity growth. Equation (14) assigns to each
agent of age s – k in year s the tax and transfer payment observed for agents of the same
age in base year b, uprated for gains in productivity. The base-year cross section of age-
specific tax and transfer payments per capita is generally determined in two steps. First,
the relative position of age cohorts in the tax and transfer system is estimated from micro-
data profiles. In a second step the relative age profiles are re-evaluated proportionally to
fit the aggregated expenditure and tax revenues of the base-year.
3.2 Long-term fiscal stability and intergenerational redistribution Indicators
Generational Accounts
For living and future generations, the division of the aggregate remaining lifetime net tax
payments by the number of cohort members alive in year s defines the cohort’s
Generational Account in year s:
GAs,k = ks
ks
PN
,
,
Generational Accounts are constructed in a purely forward-looking manner, only the taxes
paid and the transfers received in or after the base-year are considered. As a
consequence, Generational Accounts cannot be compared across living generations
because they incorporate effects of differential lifetime. One may compare, however, the
14 In the case of an analysis of isolated subsystems of public finances, like health care or pensions as conducted in the following chapters, i is chosen so that all relevant payment streams are included in the analysis.

Applied Indicators
N a t i o n a l B a n k o f P o l a n d26
3
22
Generational Accounts of base-year and future born agents, who are observed over their
entire lifecycle. Additionally, one may compare generational accounts before and after the
introduction of a fiscal reform to measure intergenerational redistribution effects, i.e. to
estimate which cohorts bear the highest burden of a legislative change. This latter
approach is applied in section 5.
The Sustainability Gap
To illustrate the fiscal burden of current fiscal policy we use seven sustainability
indicators.15 The starting points for the first indicators are the intertemporal public
liabilities which can be computed by the assumption that the intertemporal budget
constraint of the public sector (11) is violated:
IPLb = Bb -
DbkkbN ,
The amount of intertemporal public liabilities (IPL) measures aggregate unfunded claims
on future budgets, assuming that the present policy will hold for the future. The first
sustainability indicator, the sustainability gap (SGb), can be derived if the intertemporal
public liabilities are set in relation to base-year’s GDP (GDPb). This indicator is akin to the
debt quota well known since the Maastricht Treaty but it addresses the debt which will
occur in the future and in the past:
SGb = b
b
GDPIPL
As Benz and Fetzer (2006) have shown all the indicators described above are computed
with an infinite time horizon. In the practical calculation all relevant variables like
population or cohorts’ tax payments are projected for 300 years from the base-year on.
Afterwards a geometrical series is used to determine the remaining net tax payments. The
15 For a discussion of measuring fiscal sustainability and the development of sustainability indicators, see Raffelhüschen (1999) and Benz and Fetzer (2006).

Applied Indicators
WORKING PAPER No. 145 27
3
23
choice of 300 periods is nearly completely arbitrary and just reflects a good approximation
point for our analysis.16
Annual Cash Flows of revenues and expenditures
The above presented indicators measure sustainability by one single number. This
approach is valuable as it provides a comprehensive indicator of sustainability. It is
especially appropriate for comparisons of reforms and between fiscal systems. Most policy
makers are, however, not yet familiar with such aggregated figures and the underlying
concepts. Therefore, we provide the standard indicator of annual cash flows, too. On this
basis we demonstrate the development of aggregate expenditures and revenues
in future years . Additionally, cash flows are valuable as they outline “timing effects”.
In other words, one may illustrate the extent of deficits and surpluses of a fiscal system for
a given future year. They are simply estimated by a multiplication of age average
contributions and (per capita of the population) with the respective cohort sizes
of the population in year s.17
∑
∑
3.3 Adequacy Indicators
Adequacy ratios
The standard figure for adequacy analysis is the replacement rate (RR). The RR expresses
the pension level in relation to earnings. Usually, pensions are compared to the pre-
retirement income of the pensioner. The idea is that the individual aims to (at least partly)
replace former earnings. In other words, a pensioner wants to have a certain proportion of
his former earnings. We deviate from this approach and relate the initial pension benefit
to the average wage in the economy for two reasons: 1) For some employment groups,
16 Due to the higher level of discount in relation to the growth rate fiscal flows in the very remote future do not play a large role for our present value calculation since they are highly discounted. Therefore, it has only a marginal effect if one ends the projection after 300 years instead of 300 + x years. 17 We further differentiate the estimation by gender. For reasons of simplicity this aspect is left out in the equations above.

Applied Indicators
N a t i o n a l B a n k o f P o l a n d28
3
24
namely the self-employed, the contribution basis is rather low and does not provide an
indication for the earnings which need to be replaced. 2) For some individuals the pre-
retirement earnings are very low or even zero due to unemployment. Therefore, we opt,
like Egert (2012), for the average wage in the economy as a benchmark for pension levels.
This adequacy ratio (AR) is formally estimated for a year s, age x and gender g by dividing
the new pension benefit in year s by the average wage in the economy in year s s.

Computation Approach
WORKING PAPER No. 145 29
4
25
4 Computation Approach
To cover all three perspectives of the pension system evaluation we rely on two pension
models. We start with abrief description of the demographic developments in section 4.1.
The applied micro-simulation model and the respective data inputs used for the
calculation of adequacy ratios is described in section 4.2. The cohort model to project
future aggregate expenditures and revenues and to estimate generational accounts is
presented in the following section 4.3. Both models are based on a consistent framework
of data inputs as well as of demographic and economic assumptions, as far as feasible.
4.1 Population projection
The projections used to compute the the fiscal projection of the Polish pension system is
based on assumptions of EUROPOP2010, the latest population projection of Eurostat,
which is consistent with the available national forecasts of the CSO.
Based on different assumptions about the three main demographic drivers , i.e. life
expectancy, fertility and migration it is possible to derive a population projection for
various demographic scenarios. Own calculations are necessary for the reason of GA
assumed infinite time horizon: the official projections end in 2060 while we apply a 300
years projection period. For these calculations we rely on the data and assumptions of
Europop 2010 (convergence scenario) which give assumptions on the above mentioned
parameters until the year 2060. After this year the demographic parameters are held
constant. Table 2 shows those central assumptions for our standard scenario.

Computation Approach
N a t i o n a l B a n k o f P o l a n d30
4
26
Table 2: Assumptions of the demographic scenarios
Standard scenario
Female life expectancy at birth in 2010 80,1
Male life expectancy at birth in 2010 71,7
Female life expectancy at birth in 2060 87,9
Male life expectancy at birth in 2060 82,4
Fertility – 2010 1,40
Fertility – 2060 1,56
Net migration 2010 11.732
Net migration 2060 14.123
Source: own illustration based on Eurostat
Figure 1 illustrates our population projection – the main basis for our calculations. It is said
that demography reflects to a great extent the history of the respective country. This
becomes apparent when looking at Poland’s age specific population structure in the base
year 2010. First of all, one can clearly identify the impact of World War II on the cohorts
born between 1941 and 1946. As commonly observed during periods of war and unrest,
birth rates were relatively low, resulting in relatively small cohorts aged around 65 in 2010.
After the end of World War II the fertility rate recovered quite rapidly, which led to strong
cohorts aged 45 to 60. During the 1960s and 1970s the total fertility rate decreased from
nearly 3.0 to 2.2 children per woman. This explains to some extent the drop in cohort
sizes, which can be observed around the age group of 40 in 2010. The subsequent gains in
birth numbers can be traced back to the fact that the respective cohorts have been born
by those aged 45 to 60 in 2010. Due to the fact that these are quite large in numbers, their
children are numerous as well. After the opening of the Iron Curtain in 1989, however,
Poland displayed a steep fall in natality—as in most formerly communist countries. In
order to project Poland’s demographic future, assumptions about fertility rates and life
expectancy for the coming decades are needed. In accordance with the population
projection,Europop2010 (conducted by Eurostat) we assume that the fertility rate will
remain low and will only slightly increase from currently 1.4 children per woman to 1.56
until 2060. The assumed evolution of life expectancy in Poland is broadly similar to the rest

Computation Approach
WORKING PAPER No. 145 31
4
27
of Europe. While an average male (female) born in 1990 could expect to live for 66.3 (75.3)
years, this value is assumed to rise to 71.7 (80.1) for a male (female) born in 2010. In
comparison to most other EU countries this increase in life expectancy by three months
per year is particularly fast. According to Eurostat life expectancy of a male (female)
newborn will further increase by around eleven (seven) years until 2060.
Figure 1: Structure of Polish population
Source: own calculations based on Eurostat data
Both, declining fertility rates and the ongoing and rather steep increase in life expectancy
lead to a significant ageing process in Poland. As a result, the Polish population pyramid’s
appearance will considerably change in the coming decades (see Figure 2).The pace of this
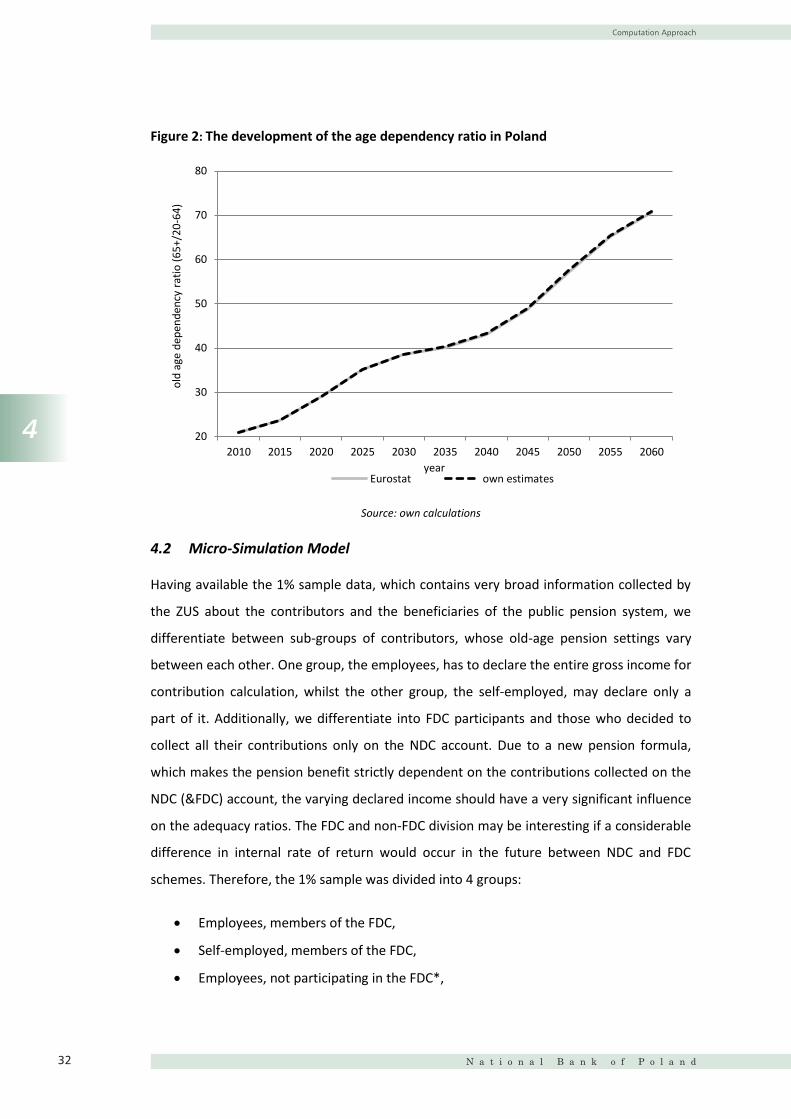
aging process is exceptional—compared with other European countries. This can be
illustrated by the old-age dependency ratio, defined as the number of persons aged 65 and
older, relative to those between 15 and 64. As illustrated in Figure 2, this indicator will rise
from about 20% in 2010 to roughly 70% in 2060, which is a steeper increase than in any
other EU country, except Slovakia. The demographic development of this kind puts
substantial pressure on a pay-as-you-go (PAYG) pension system and can thus be
understood as the main reason for the sweeping pension reforms that are described in
detail in chapter 2.3 and 2.4. As Figure 2 outlines, our demographic projection follows
closely the forecast of the Eurostat
0
10
20
30
40
50
60
70
80
90
100
400 300 200 100 0 100 200 300 400
Age
Cohort Members (in 1000)
2010 2030 2060
female male
Computation Approach
N a t i o n a l B a n k o f P o l a n d32
4
28
Figure 2: The development of the age dependency ratio in Poland
Source: own calculations
4.2 Micro-Simulation Model
Having available the 1% sample data, which contains very broad information collected by
the ZUS about the contributors and the beneficiaries of the public pension system, we
differentiate between sub-groups of contributors, whose old-age pension settings vary
between each other. One group, the employees, has to declare the entire gross income for
contribution calculation, whilst the other group, the self-employed, may declare only a
part of it. Additionally, we differentiate into FDC participants and those who decided to
collect all their contributions only on the NDC account. Due to a new pension formula,
which makes the pension benefit strictly dependent on the contributions collected on the
NDC (&FDC) account, the varying declared income should have a very significant influence
on the adequacy ratios. The FDC and non-FDC division may be interesting if a considerable
difference in internal rate of return would occur in the future between NDC and FDC
schemes. Therefore, the 1% sample was divided into 4 groups:
Employees, members of the FDC,
Self-employed, members of the FDC,
Employees, not participating in the FDC*,
20
30
40
50
60
70
80
2010 2015 2020 2025 2030 2035 2040 2045 2050 2055 2060
old
age
depe
nden
cy ra
tio (6
5+/2
0-64
)
year Eurostat own estimates

Computation Approach
WORKING PAPER No. 145 33
4
29
Self-employed, not participating in the FDC*.18
More detailed description of the data can be found in Annex 2 on the input data.
The micro simulation model is used for the estimation of future adequacy ratios. The main
input data represent the initial capital as well as NDC and FDC contributions paid since
1999 – described in section 4.1.1. Based on this past contribution history future
contributions are projected until the point of retirement – outlined in section 4.1.2.
4.2.1 Contribution history – initial capital and NDC/FDC contributions
4.2.1.1 Initial capital
The initial capital (IC), which reflects the contribution career before 1999, if any, computed
by the ZUS for each individual who decided to declare it upon the introduction of the
reform in 1999, shows interesting regularities, to be followed in details from Figure 3 to
Figure 6. First, it has to be noted that the 1% sample IC data was full of empty records.
Often the two lower quartiles were filled with zeros. According to our estimates based on
data provided by the ZUS, nearly 35% of insured persons born between 1950 and 1980
have not applied yet for the initial capital calculation. Therefore, the lower 35%
distribution of the IC data was removed for these cohorts, assuming that the statistical
distribution of the initial capital for these persons will follow the data of persons who have
already applied for the initial capital calculation. For a detailed description of the
consequences and a profound description of the input data see Annex 2. Regarding the
meaning of the remaining 65% of the initial capital, men’s accounts are more numerous
and have recorded slightly higher values for all statistical measures than women’s – from
the 1st quartile up to a margin of statistical error (97.5%), as shown in Figure 3. The dump
in early data for females stems most probably from the fact that women retire earlier by 5
years. As a consequence, older cohorts are less covered in the database – as they have
already retired.
18 * Due to the fact non-FDC members to a large extent show very similar characteristics as FDC members, we describe them in Annex 1.

Computation Approach
N a t i o n a l B a n k o f P o l a n d34
4
30
Figure 3: Initial capital of employees, FDC members, indexed to January 2011
Source: own calculations based on 1% sample provided by the ZUS
Figure 4: Initial capital of self-employed FDC members, indexed to January 201119
Source: 1% sample provided by the ZUS
19 The zigzag shape of the chart for all analyzed measures is due to the smaller number of representatives in the self-employed persons’ group, compared with employees, see Figure 53 - Figure 55.
0
100 000
200 000
300 000
400 000
500 000
600 000
700 000
800 000
1949
1950
1951
1952
1953
1954
1955
1956
1957
1958
1959
1960
1961
1962
1963
1964
1965
1966
1967
1968
1969
1970
1971
1972
1973
1974
1975
1976
1977
1978
1979
1980
1981
1982
Initi
al c
apita
l in
PLN
Birth year median f median m 1st quartile f 1st quartile m3rd quartile f 3rd quartile m 97.5% f 97.5% m
0
100 000
200 000
300 000
400 000
500 000
600 000
700 000
1949 1954 1959 1964 1969 1974 1979
initi
al c
apita
l in
PLN
Birth year median f median m 1st quartile f 1st quartile m3rd quartile f 3rd quartile m 97.5% f 97.5% m

Computation Approach
WORKING PAPER No. 145 35
4
31
4.2.1.2 Pension contributions (NDC or NDC&FDC) paid between 1999 and 2011
The following passages will be devoted to the analyses of the amount of contributions paid
by the ZUS contributors in the base year 2010, using also 1% sample filtered data.
According to existing rules, the employees are required to declare full income for pension
contribution purposes. The law imposes a minimum contribution threshold via the
minimum salary level for employees.20 The contributions paid on this basis amount to PLN
257 in the base year. The self-employed have a choice to declare their entire income or its
amount limited to the minimum of the annual floor of 60% of the average salary in the
economy. The pension contributions paid on this basis amounted to PLN 368 in the base
year.
Figure 5: Employees FDC members, pension contributions (NDC&FDC), 2010
Source: 1% sample provided by the ZUS
The gender specific distribution of the contributions paid by employees shows no
significant differences. Two horizontal lines in Figure 5 represent the lowest possible
amounts of payable contributions: solid line gives an indication of the contributions
related to the minimum possible amount payable by the self-employed (60% of the
average salary) – expected to be prominent in the self-employed group, however present
20 For details see Annex 2.
0
500
1000
1500
2000
2500
3000
3500
1949 1951 1953 1955 1957 1959 1961 1963 1965 1967 1969 1971 1973 1975 1977 1979 1981 1983 1985 1987 1989
Mon
thly
pen
sion
cont
ribut
ions
in P
LN
Birth year
av f av m min salary 60% floor median fmedian m 3rd quartile f 3rd quartile m 97.5% f 97.5% m

Computation Approach
N a t i o n a l B a n k o f P o l a n d36
4
32
also in the employees group.21 Second horizontal line (dotted black) represents the
minimum contribution level paid on the basis of the minimum salary. Apparently, in the
group of employees these two margins serve as ‘resistance levels’22 for individuals, who
pay the median contributions. The 3rd quartile and the average employee, irrespective of
gender, show gradual decrease in the salary/contribution starting from the birth year
around 1972, which may prove to be the effect of the shorter promotion path decreasing
with each consecutive birth year.
Figure 6: Self-employed FDC members, monthly pension contributions (NDC&FDC), 2010
Source: 1% sample provided by the ZUS
The differences between particular contribution sub-groups are more visible in the group
of self-employed persons, depicted in Figure 6. The outliers (97.5% quintile), who pay the
highest contributions, declare half of the earnings compared to employees-outliers. The
third quartile self-employed contributors (75%) pay a minimum possible amount of PLN
368, until the birth year of around 1970, when all referred statistical measures start
21 An individual is classified as employee (self-employed) if for the majority of the 1999-2011 period he has an employee (self-employed) record. As a consequence, some individuals from the group of employees may in fact be self-employed in the base year, or vice versa. 22 The references we make to each group will be used later in the description of adequacy rates, where we will look how the minimum salary and the 60% of the average salary correspond to the replacements rates for particular cohorts.
0
200
400
600
800
1000
1200
1400
1600
1949 1954 1959 1964 1969 1974 1979
Mon
thly
pen
sion
cont
ribut
ions
, PLN
Birth year av f av m 60% floor median f median m3rd quartile f 3rd quartile m 97.5% f 97.5% m

Computation Approach
WORKING PAPER No. 145 37
4
33
decreasing (short career path effect). Figure 5 and Figure 6 show significant difference
between the average values and the median: the reason lies in the method of data
selection, which in the base year includes all IDs for which the IC or any contributions were
recorded in the period 1999-2010. In consequence, the average is ‘polluted’ by individuals,
who did not declare any contributions in the base year or were unemployed without
resorting to an unemployment benefit.
In conclusion to the analyses of the pre- and post-1999 reform records of the registered
labour activity for pension contribution purposes, we may summarize our findings as
follows:
There are no significant differences in the amount of the initial capital recorded so
far on men’s and women’s accounts;
The initial capital as well as the NDC/FDC pension contributions of self-employed
persons amount roughly to half of these recorded on average in the case of
employees;
Up to 75% of the self-employed pay the lowest allowed amount of contributions
(or less); 50% of employees declare the minimum salary (or less) in the ZUS
records.
Around 25% of employees declare gross income ranging from the minimum to
average salary level in the economy (3rd quartile) for pension purposes.
If employees switched to self-employment after 2005, the median of their
declared income would fall to around the 60% of the average salary in the
economy.
Statistical measures are highly affected by individuals who evade the registered
forms of the employment or who are indeed inactive on the labour market
(significant number of empty or nearly empty accounts).
4.2.2 Projection of future pension benefits
The level of future pension benefits depends first of all on the pension rights accrued-to-
date until the end of base year b, in our case the year 2010. With the use of the 1%
sample, described in the previous section, we can estimate these pension entitlements on
the basis of data of actual contribution histories. Furthermore, the 1% sample provides the

Computation Approach
N a t i o n a l B a n k o f P o l a n d38
4
34
basis to differentiate the estimation of pension rights by one year cohorts of age x, by
gender g and by group types t.23
We divide the calculation of pension rights accrued until the end of base year b into NDC
( and FDC ( ) pension entitlements – as
illustrated in the equations below.
∏ ( )
∑ ∏ (
)
∑ ∏ (
)
The level of the total NDC account in 2010 depends on the actual level of initial capital
( of the year 1999 indexed to the end of the base year as well as on the actual
NDC contributions paid in the period 1999-2010 of a birth year cohort c. The
level of the total FDC account in 2010 is determined by FDC contributions (
paid from 1999 till 2010. For the estimation of FDC pension rights we take additionally
into account the FDC contribution fees ( ).24
All past contributions as well as the initial capital are revaluated to the base year. This is
carried out via the valorisation factor which reflects the product of past NDC
( and FDC (
rates of return from the year after the contribution was
made until the year b+1. In the case of FDC we additionally consider the account fee
.25 Table 3 summarizes the applied valorisation factors for NDC and FDC.
23 We differentiate our calculations by one year age groups from age 20 to 60 in 2010, by male and female gender as well as by the four groups 1) employed FDC member, 2) employed non-FDC member, 3) non-employed FDC member and 4) non-employed non-FDC member. For a further description of group types see the previous section and the annex on input data. 24 The past FDC contribution fees amount to 7% of contributions in our computations for the years 1999 until 2009. Thereafter, they add up to 3.5% of contributions. 25 The past FDC account fee is set at 0.6% (annually) of the total FDC account for the years 2000 until 2009. For the years after 2009, they amount to 0.5% of the total FDC account.
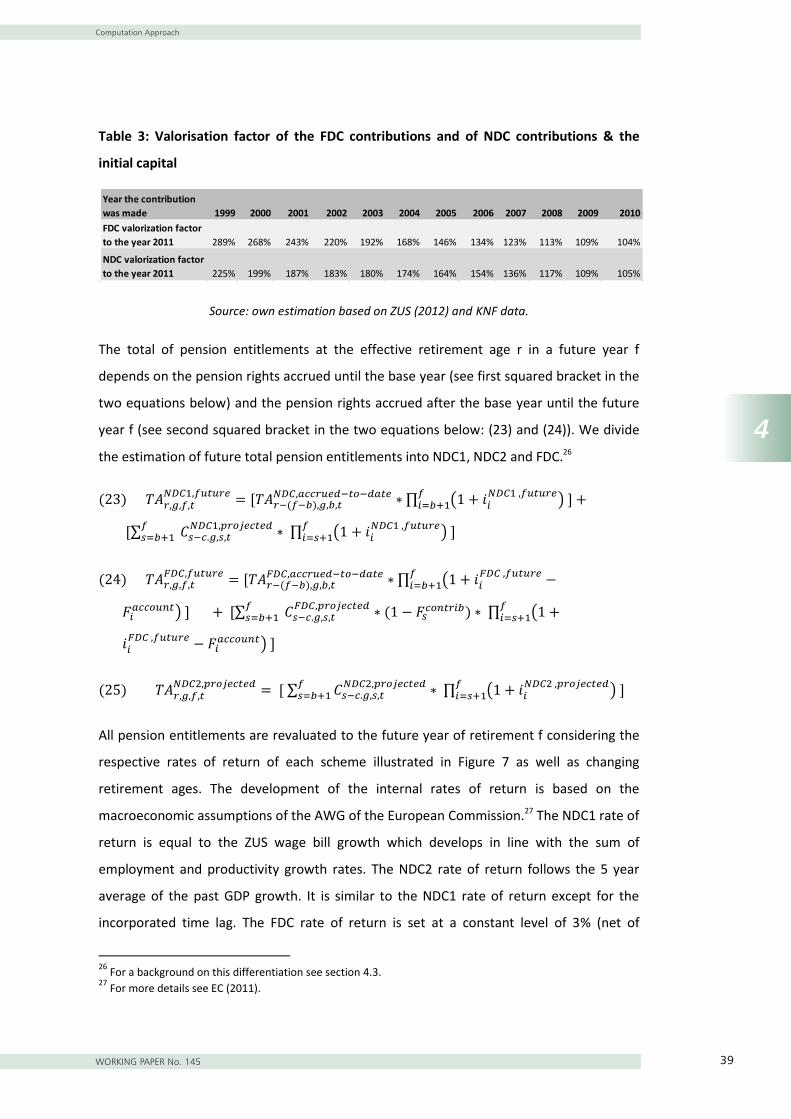
Computation Approach
WORKING PAPER No. 145 39
4
35
Table 3: Valorisation factor of the FDC contributions and of NDC contributions & the
initial capital
Source: own estimation based on ZUS (2012) and KNF data.
The total of pension entitlements at the effective retirement age r in a future year f
depends on the pension rights accrued until the base year (see first squared bracket in the
two equations below) and the pension rights accrued after the base year until the future
year f (see second squared bracket in the two equations below: (23) and (24)). We divide
the estimation of future total pension entitlements into NDC1, NDC2 and FDC.26
∏ (
)
∑
∏ ( )
∏ (
) ∑
∏ (
)
∑
∏ (
)
All pension entitlements are revaluated to the future year of retirement f considering the
respective rates of return of each scheme illustrated in Figure 7 as well as changing
retirement ages. The development of the internal rates of return is based on the
macroeconomic assumptions of the AWG of the European Commission.27 The NDC1 rate of
return is equal to the ZUS wage bill growth which develops in line with the sum of
employment and productivity growth rates. The NDC2 rate of return follows the 5 year
average of the past GDP growth. It is similar to the NDC1 rate of return except for the
incorporated time lag. The FDC rate of return is set at a constant level of 3% (net of
26 For a background on this differentiation see section 4.3. 27 For more details see EC (2011).
Year the contribution was made 1999 2000 2001 2002 2003 2004 2005 2006 2007 2008 2009 2010FDC valorization factor to the year 2011 289% 268% 243% 220% 192% 168% 146% 134% 123% 113% 109% 104%
NDC valorization factor to the year 2011 225% 199% 187% 183% 180% 174% 164% 154% 136% 117% 109% 105%

Computation Approach
N a t i o n a l B a n k o f P o l a n d40
4
36
administrative costs). Also for the choice of the FDC rate of return we follow the AWG
assumptions.28 We demonstrate in section 5.3, that the deviation of the FDC rate of return
from the NDC1 and NDC2 rates of return is crucial for the evaluation of the FDC cut
reform.
Figure 7: Overview of the future rates of return
Source: own estimation based on AWG assumptions.
Future contributions are projected on the basis of age specific contribution profiles in the
base year. In order to model changes of contribution rates to NDC1 ( ), to NDC2
( ) and to FDC ( we first project total contributions ( , i.e. 19.52% of the
contribution base, to a future year s. The applied wage growth follows the productivity
growth assumptions of the EC (2011). Additionally, in our micro-simulation we consider
the age-specific career path – observed in the base year for each group type t and gender
g.29
28 See EC (2011), p. 142f. 29 With the current relatively early retirement, well before the age of 65, our data sample covers only a small number of individuals older than 60. In fact, for some groups, namely FDC participants, the observations are not very numerous for cohorts aged 55+. Therefore, we apply a flat contribution profile for these cohorts aged 55 and older.
-2%
-1%
0%
1%
2%
3%
4%
5%
6%
2011 2016 2021 2026 2031 2036 2041 2046 2051 2056
gro
wth
rate
(in
real
term
s)
year AWG employment growth AWG productivity growth NDC1 rate of returnNDC2 rate of return FDC rate of return

Computation Approach
WORKING PAPER No. 145 41
4
37
= * ∏
Finally, the future initial pension benefit is estimated by dividing the sum of pension
entitlements accrued until the effective retirement age r by the unisex life expectancy
. The latter factor is age specific and changes in line with the increase in life
expectancy.30
Our estimated pension benefits are computed on a gross basis. We discard coincidence
pensions (e.g. when an individual is entitled to a pension from the farmers’ system, a civil
servant scheme or survivors’ pensions) as well as benefits paid by pension schemes from
abroad.
4.3 Macro Cohort Model
In the next section we describe the computation of the NDC pension system and its
gradual transformation over the coming decades. The model is structured in such a way as
to isolate the most important factors determining the future levels of pension
expenditures and revenues. In particular we consider:
- the changing cohort specific participation rates in the single (NDC) and mixed pillar
system (NDC + FDC).
- the changing cohort and gender specific retirement ages and consequent
alterations of old-age as well as disability retirement probabilities.
30 Our assumptions on the future life expectancy development are based on EUROPOP2010 provided by Eurostat.

Computation Approach
N a t i o n a l B a n k o f P o l a n d42
4
38
First, we outline the age and gender specific computation of future aggregated pension
revenues step by step (section 4.2.1). Thereafter, we describe the approach to estimate
future pension benefits and expenditures (section 4.2.2). A separate estimation approach
has been applied for miners’ pensions and it is outlined in section 4.3.
4.3.1 Revenue side – NDC system
For the estimation of revenues we first calculate the contribution basis of an average
participant in ZUS. In our former estimations31 we applied the NSI gross wage profile
(illustrated in Figure 8 for the year 2010). With this earnings profile, however, we largely
overestimate the contribution basis of an average contributor. The latter representative is
with a certain probability active – paying some positive value of contributions in the base
year 2010 – and with a certain probability inactive or dormant – paying no contribution in
the base year.
Interestingly, the average contribution basis of an active contributor (derived from the 1%
sample) is much lower than gross earnings recorded by the NSI statistics (see Figure 8).
Reasons for this gap have been discussed in the previous section and Annex 2. A few shall
be repeated here: a number of active contributors are self-employed and only pay the
minimum threshold of 60% of the average salary in the economy. Moreover, a large
proportion of employees only pay contributions based on the minimum wage. And last but
not least, some ZUS scheme members are unemployed but pay contributions. Their
contributions are significantly lower than the average NSI earnings, too.
In our calculations we consider the average contribution basis profile of an average
participant in ZUS (see solid line in Figure 8). This profile runs lower than the respective
data of an active contributor as it covers also dormant contributors who are not
contributing. According to our estimations roughly one third of scheme members are not
actively contributing in the base year.
31 Jabłonowski et al. (2011).

Computation Approach
WORKING PAPER No. 145 43
4
39
Figure 8: Monthly average gross earnings and contribution basis, age brackets 20-70, in
2010
Source: own calculations based on CSO (2012) and 1% sample data.
On the basis of this 1% profile covering active and inactive contributors we derive the
average monthly contribution basis by age and gender in the base year 2010. For
the calculation of this monthly contribution basis in future years we adjust the base year
profile with the productivity growth forecast of the AWG.
∏
The next step in our procedure reflects the probability of being either an NDC or an
NDC/FDC member. The probability was estimated on the basis of a 1% sample of FUS
members. The resulting age and gender specific participation rates in the FDC system are
shown in Figure 9 below. These probabilities are required to estimate average contribution
rates by gender and birth year. On this basis we can model the aggregate impact of
changing contribution rates.
0
1000
2000
3000
4000
5000
6000
21 26 31 36 41 46 51 56 61 66
mon
thly
gro
ss e
arni
ngs/
cont
ribut
ion
base
, in
PLN
age
NSI gross incomes - males NSI gross income - females
1 % declared contribution basis, active contributors - males 1 % declared contribution basis, active contributors - females
1 % declared contribution basis, all contributors - males 1 % declared contribution basis, all contributors - females

Computation Approach
N a t i o n a l B a n k o f P o l a n d44
4
40
Figure 9: Probability to be an FDC participant in January 2011
Source: own calculations based on 1% sample data provided by ZUS.
For all persons born before 1949 (i.e. aged 62 and older in the base year) the probability to
be a member of the NDC and FDC system ( ) is zero as these birth years had no
option to participate in the FDC system. Hence, their average contribution rate ( )
is 19.52% of gross earnings (see Figure 10) – reflecting the single pillar contribution rate
( . Some cohorts had, however, an option to participate in the FDC system,
namely cohorts born after 1948 and before 1969. For these age groups we apply the FDC
participation rates (shown in Figure 9) to estimate average contribution rates. The
resulting cohort and gender specific average contribution rates are shown exemplarily for
males in Figure 10 (see cohorts aged 42-61). All persons born in 1969 and later enter the
mixed NDC/FDC scheme. They have an average contribution rate of 12.22% of gross
earnings in 2010 which corresponds to the standard mixed pillar contribution rate
( ).
(
)
0%
10%
20%
30%
40%
50%
60%
70%
80%
90%
100%
1949 1950 1951 1952 1953 1954 1955 1956 1957 1958 1959 1960 1961 1962 1963 1964 1965 1966 1967 1968 1969
Part
icip
atio
n in
the
FDC
syst
em in
per
cent
of c
ontr
ibut
ors
Year male female

Computation Approach
WORKING PAPER No. 145 45
4
41
Figure 10: Average male NDC contribution rates
Source: own calculations.
Additionally, we reflect an increase in NDC contribution rates adopted in 2011 (see also
section 2). This reform step leads to a significant rise of average contribution rates, in
particular for cohorts born after 1968 who fully participate in the FDC system. The impact
of the 2011 reform is exemplarily shown in Figure 10 for the average male contribution
rates in 2020. The dashed line represents the legal status quo, i.e. the adopted increase in
contribution rates from 12.22 to 16.02% of gross wages (after 2016). The dotted line, on
the contrary, outlines the average contribution rates in 2020 in a scenario without
increase in contribution rates. In the latter scenario – reflecting the legal status before the
2011 reform – all age groups would pay significantly lower average contribution rates in
the long run than their 2010 counterparts. This scenario would have led to a significant
mismatch of ZUS revenues (in % of GDP) in the long-term and to a challenge for the mid-
term fiscal stability of the ZUS fund. In the 2011 reform scenario, on the contrary, all
cohorts who participate (to a large degree) in the mixed FDC/NDC system pay higher
contributions than current contributors. The increase in the NDC contribution rates with
the 2011 reform more than outweighs the decrease in average contribution rates due to
0
5
10
15
20
25
20 25 30 35 40 45 50 55 60 65 70
aver
age
cont
ribut
ion
rate
to th
e N
DC sy
stem
age
2010 2020 legal status quo 2020 without contribution rate change
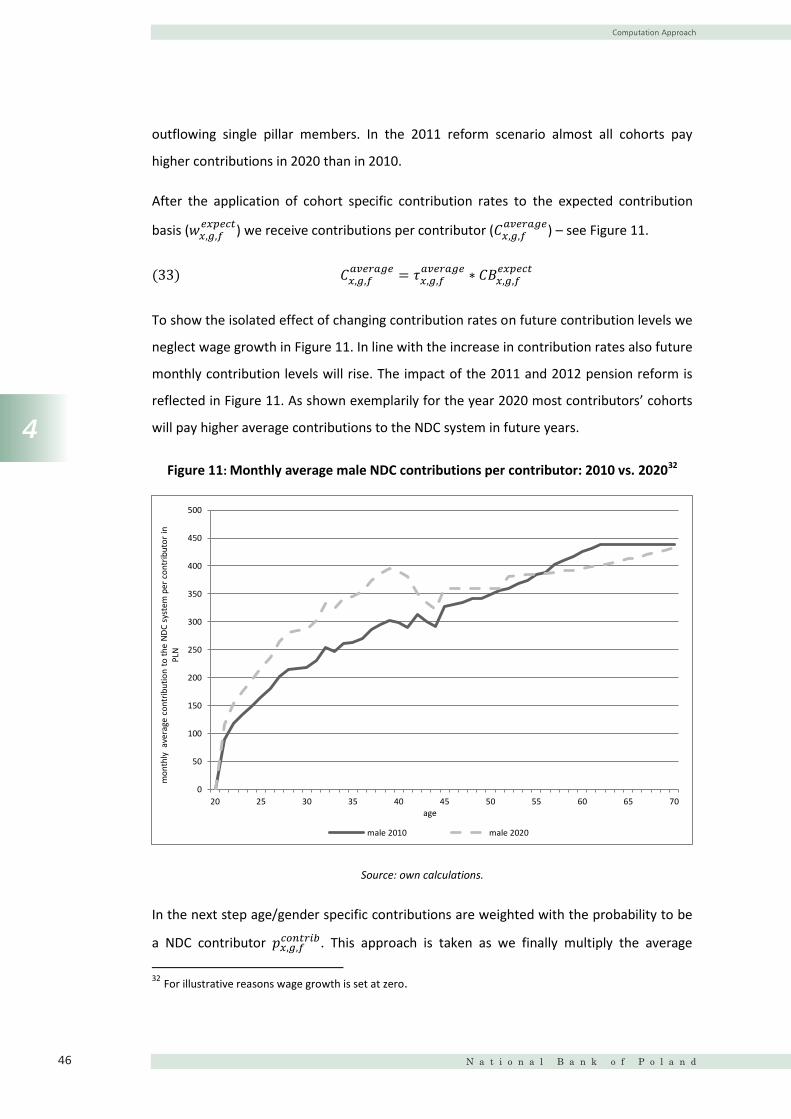
Computation Approach
N a t i o n a l B a n k o f P o l a n d46
4
42
outflowing single pillar members. In the 2011 reform scenario almost all cohorts pay
higher contributions in 2020 than in 2010.
After the application of cohort specific contribution rates to the expected contribution
basis ( ) we receive contributions per contributor (
) – see Figure 11.
To show the isolated effect of changing contribution rates on future contribution levels we
neglect wage growth in Figure 11. In line with the increase in contribution rates also future
monthly contribution levels will rise. The impact of the 2011 and 2012 pension reform is
reflected in Figure 11. As shown exemplarily for the year 2020 most contributors’ cohorts
will pay higher average contributions to the NDC system in future years.
Figure 11: Monthly average male NDC contributions per contributor: 2010 vs. 202032
Source: own calculations.
In the next step age/gender specific contributions are weighted with the probability to be
a NDC contributor . This approach is taken as we finally multiply the average
32 For illustrative reasons wage growth is set at zero.
0
50
100
150
200
250
300
350
400
450
500
20 25 30 35 40 45 50 55 60 65 70
mon
thly
ave
rage
con
trib
utio
n to
the
NDC
syst
em p
er c
ontr
ibut
or in
PL
N
age
male 2010 male 2020

Computation Approach
WORKING PAPER No. 145 47
4
43
contributions per capita of population by the respective population sizes in order to derive
total revenues.33 The initial value of is calculated by dividing the number of
contributors by the overall population sizes in each cohort and for both sexes.
By means of example Figure 12 outlines the resulting contribution probabilities
for males. Not surprisingly, the probability to be a contributor is initially increasing with
age as more individuals enter the labour market. It reaches its maximum for male cohorts
aged 33. At this age about 74% of the overall population is paying contributions to ZUS.
Thereafter, the probability drops due to cohort effects. Older cohorts participate to a
higher degree in other schemes (farmers’ and miners’ pension schemes).34 Moreover,
contribution probabilities are decreasing after the age of 33 due to rising disability and
old-age retirement.
33 The estimation of average contributions not per capita of contributors but per capita of population provides the basis to model changing participation rates in ZUS and an inflow of special employment groups such as farmers or civil servants. 34 One may additionally reflect an inflow of contributors into ZUS due to the future transformation of the farming sector and mining sector. Such an approach has been e.g. chosen in Jablonowski et al. (2011).

Computation Approach
N a t i o n a l B a n k o f P o l a n d48
4
44
Figure 12: Probability to contribute to NDC, male
Source: own calculations
For our calculation we assume that the probability to contribute to the NDC system (per
capita of the population) is constant over time and we keep the (age-specific) probability
to contribute to the NDC system fixed until the age of 45.
For older age groups, however, it is necessary to reflect the impact of changing retirement
patterns on probabilities to be a contributor. In order to model the change of future
retirement behaviour – due to the increase in legal retirement ages as well as due to
decreasing disability prevalence rates – we separate the influence of retirement decisions
in our computation. For this reason we first keep the probability to be a contributor
constant for cohorts aged 45 and older (see dotted line in Figure 12). In a second step we
correct for outflows of the labour market into retirement. More precisely depends
for these older cohorts (x>44) on the probability to be already retired into old-age ,
the probability to be completely unable to work and receive a disability benefit,
the probability to be partially unable to work and receive a disability benefit and
the probability to benefit from a bridge pension. We assume that about 30% of all
0%
10%
20%
30%
40%
50%
60%
70%
80%
20 25 30 35 40 45 50 55 60 65
Prob
abili
ty to
con
trib
ute
to Z
US
in p
erce
nt o
f the
pop
ulat
ion
age male 2010 male (without retirement exits)

Computation Approach
WORKING PAPER No. 145 49
4
45
partial disability beneficiaries work partially and contribute to ZUS.35 The residual roughly
70% is not contributing to ZUS anymore.
The single probabilities or prevalence rates to be in one of the old-age, disability (complete
and partial) and bridge pension statuses in a future year f depend not only on the
respective past prevalence rates in the base year b but also on entrance/incidence rates i
of the respective statuses. Namely the probability to enter into old-age ( ), into
complete disability ( ), into partial disability ( ) and into the bridge pension
scheme ( ) need to be considered. In the case of bridge pensions we do not allow
any new entrants after 2014.
For the estimation of disability prevalence rates we consider two further aspects: First,
retirement before our cutting age of 45 is possible – though rare. Such retirement patterns
are already reflected in the base year profile. In fact, the inflow into disability may to some
extent explain the dropping contributors’ probabilities from age 33 onwards. Against this
background, we correct for the probabilities to be a disability pensioner before the age of
45 by subtracting the disability prevalence rate at age 44. Second, exit probability
rates / to leave the disability scheme after a complete/partial disability due
to reasons such as death, loss of eligibility, etc. are considered. Also in the case of bridge
pension we have to consider that after the statutory retirement age all beneficiaries leave
the system and switch to old-age pension with a certain probability .
∑
35 This assumption is based on the information that 18% of all disability beneficiaries are employed (see OECD (2009), p.33) – the lowest level of all OECD countries. We assume that only the partially disabled work and they represent about 63% of all disability beneficiaries.. Consequently, we may presume that roughly 30% of all partially disabled – which represent 18% of all disabled – are employed.

Computation Approach
N a t i o n a l B a n k o f P o l a n d50
4
46
∑
Under the changing retirement age scenario (2012 legal status) we take into account that
incidence and exit rates change in line with the increase in statutory retirement ages.36
With the given probability to be a NDC contributor we finally receive the
contributions per capita of population – see Figure 13.
Figure 13: NDC contributions per capita of population37
Source: own calculations
The dotted line in Figure 13 is a sign of the ‘walking profile’ over the years – clearly
showing that in 2020 all cohorts will be paying higher contributions due to increased
contribution rates for NDC schemes after 2010. Also the impact of the later retirement is
36 For a further description of the impact of increasing statutory retirement ages on disability incidence and exit rates see also Jablonowski et al. (2012). 37 For illustrative reasons wage growth is set at zero.
0
50
100
150
200
250
300
20 25 30 35 40 45 50 55 60 65 70
mon
thly
ave
rage
con
trib
utio
n to
the
NDC
sys
tem
per
cap
ita o
f po
pula
tion
in P
LN
age
male 2010 male 2020

Computation Approach
WORKING PAPER No. 145 51
4
47
remarkable. The increase in statutory retirement ages and the abolishment of early
retirement channels will significantly increase the contribution levels of cohorts aged 60
and older in the years to come (see dotted line in Figure 13).
In order to guarantee a match with actual aggregate data we finally rescale these
computed contributions to the sum of actual contributions in 2010 ( We apply the
rescale factor , which is equal for all ages, gender and years.38 On this basis we derive the
corrected contributions per capita of the population .
∑ ∑
Finally, for the estimation of future ZUS total revenues we weight average
contributions per capita of the population with the respective cohort sizes in future
years.
4.3.2 Expenditure side – NDC system
For the modelling of expenditure side we compute future pension benefits. For this
calculation not only future contributions (estimated in the previous section) but also
pension rights accrued in the past have to be taken into account. These current pension
entitlements are recorded on NDC accounts which reflect accumulated contributions
(since 1999) plus the initial capital (i.e. entitlements accrued before 1999). The applied
average NDC account levels for our calculation are shown in Figure 14 differentiated by
age and gender and measured per capita of the population.
NDC values shown in Figure 14 are based on average NDC accounts of ZUS participants
( ) To derive the average NDC account per capita of the population
38 With our computation we are able to match the actual sum of contributions in 2010 very closely. The rescale factor amounts to 1.06.

Computation Approach
N a t i o n a l B a n k o f P o l a n d52
4
48
( we multiply average NDC accounts of ZUS participants by the approximated
ZUS participation rate .39
Figure 14: Average NDC accounts per capita of the population (incl. initial capital and
pre1999 contributions) indexed to 2010
Source: own calculations based on the ZUS cohort data
The amount of NDC accounts in future years depends on the indexation of pension
entitlements . With the introduction of a second separate NDC account from 2011
onwards (see section 2.2) two different indexation regimes have to be reflected in our
estimations. The first initial NDC account is annually adjusted by the wage bill 39 The ZUS participation rate differs from the probability to contribute to ZUS (estimated in the previous section). In fact, a slightly higher share of the population participates in ZUS than contributes to ZUS. Some participants may be “dormant contributors” not contributing for some period (see Figure 8). We approximate that amounts to 75.8% of the population for males and 72.5 % for females. The value of
is estimated by dividing the number of old-age beneficiaries at age 66 (61) by the respective population sizes. Miners are not included in these figures but estimated separately. For younger cohorts this approach may lead to an underestimation of because in this age groups more citizens may participate in ZUS than in older cohorts. In contrast to these older age groups, younger cohorts are less likely to join other non-ZUS schemes such as famers’, miners’ or civil servants’.
0
50000
100000
150000
200000
250000
300000
20 25 30 35 40 45 50 55 60 65 70
aver
age
NDC
acc
ount
per
cap
ita 2
010
of th
e po
pula
tion
in P
LN
age male female

Computation Approach
WORKING PAPER No. 145 53
4
49
growth . The second newly introduced NDC account is indexed in accordance with
the average 5-year nominal growth of GDP . A closer look reveals that in theory both
GDP and the wage bill growth should be equal as both reflect the sum of employment and
labour productivity growth. As a consequence, the interest rate is only slightly
higher in the mid-term than due to the 5-year time lag.
Additionally, NDC accounts are increasing with contributions paid over the life-cycle
to ( and . The contributions in our calculation are again estimated
per capita of the population. In other words, they reflect the contributions of an average
citizen who is with a certain probability contributing to ZUS, i.e. has
not retired yet. For cohorts aged below 45 is equal to . For
older age groups we additionally take into account that our standard individual is with a
low (but increasing with age) probability not contributing (due to disability or due to
receiving a miner’s pension). The sum of these contribution probabilities is reflected in the
parameter . In comparison to the estimation of old-age
retirement probabilities are not yet taken into account at this stage, as we aim to reflect
the average contribution of individuals who have not retired on account of old age yet .
Old-age retirement probabilities are considered at a later stage when estimating the
expected pension benefit per capita of the population.
NDC contributions are then corrected by the rescale factor – estimated in the previous
section (4.1). Finally, to compute the amounts paid into NDC1 and NDC2 we split

Computation Approach
N a t i o n a l B a n k o f P o l a n d54
4
50
contributions in accordance with the year specific share to be paid in
NDC1 ( and NDC2 ( .40
The initial old-age pension benefit (per capita of the population) at age x is
estimated on the basis of the benefit formula below. The sum of and is
divided by the expected unisex life expectancy at age x in a future year .41
As shown in Figure 15, a longer working period contributes significantly to a higher
expected pension level upon retirement.
40 For more details on the share of contributions paid into NDC1 and NDC2 see section 2.2. 41 Unisex life expectancy tables are derived from the CSO base year data projection with Europop2010 mortality assumptions.

Computation Approach
WORKING PAPER No. 145 55
4
51
Figure 15: Male pension level per capita of the population, in PLN, in 2020, zero wage
growth
Source: own calculations
In the next step these initial pension benefits are weighted with the respective gender and
age specific old-age retirement probabilities of a future year f.
The starting point for the estimation of retirement probabilities is provided by the
retirement behaviour observed in the base year b. It is measured by dividing the number
of new retirees by the number of ZUS participants.
0
2000
4000
6000
8000
10000
12000
14000
16000
18000
60 61 62 63 64 65 66 67 68 69
Year
ly N
DC p
ensio
n be
nefit
per
cap
ita o
f the
pop
ulat
ion,
in y
ear 2
020
(g=0
) in
PLN
age

Computation Approach
N a t i o n a l B a n k o f P o l a n d56
4
52
But future retirement behaviour is also determined by the retirement history which is
reflected in the age and gender specific retirement rates – defined as the number of
total old-age retirees to the population at age x and gender g.
Each cohort being of age x and gender g in the base year is with a certain probability
already retired or will retire in a future year f at age i (i>x). We assume that the
accumulated life cycle retirement probabilities (LCRP) – shown in equation (60) – should
sum up to one for each cohort. In other words, the sum of the retirement rate in the
base year b and the accumulated future old-age retirement probabilities ∑ ,
i.e. the sum of probabilities of an x year old in the base year to retire at a future age i,
should amount to one.
∑
If we base our assumptions on future retirement behaviour solely on the retirement
decisions observed in the base year ( ), this condition does not necessarily have to be
fulfilled and the parameter – shown in equation (61) below – may be other
than one.
∑
Therefore, we correct the derived retirement probabilities with the cohort and
gender specific parameter – see equation (62) below – to ensure that the LCRP of
each birth year is equal to one.
In our estimation we consider that all cohorts born after 1948 are obliged by the rules of
the new system to retire not sooner than at the male (female) legal retirement age of 65
(60). Furthermore, we take into account that statutory retirement ages gradually increase
for both genders to 67 (see section 2.3). There is an occupation group, which can retire
earlier than the statutory retirement age, namely teachers. We keep their privilege to

Computation Approach
WORKING PAPER No. 145 57
4
53
retire early constant in the future. Of course, miners can retire earlier, but they are treated
separately – see following chapters.
As a final outcome we derive cohort and gender specific retirement probabilities which
reflect possible changes of retirement behaviour due to 1) legal changes and 2) cohort
specific retirement histories (i.e., corrected by ). An example of these final retirement
probabilities is provided in Figure 16 for male and female individuals in the base year and
in the future year 2021. As can be seen, retirement probabilities are shifting – in line with
the increase in statutory retirement ages – to higher age groups over the long-term. What
is remarkable is the relatively low retirement probabilities in the base year. An
explanation for this low pensioner inflow is provided by the retirement rate in 2010 which
illustrates that the overwhelming majority of male (female) age groups 62+ (57+) have
already retired before the base year. As a consequence, the shown retirement
probabilities per scheme member are not adding up to 100%. In the future years
retirement probabilities will gradually increase.
Figure 16: Probability to retire in the new system
Source: own calculations
0%
10%
20%
30%
40%
50%
60%
70%
80%
90%
100%
45 50 55 60 65 70
Prob
abili
ty to
retir
e at
a g
iven
age
, in
per
cent
of
sche
me
mem
bers
age
2010 males 2021 males 2010 females 2021 females

Computation Approach
N a t i o n a l B a n k o f P o l a n d58
4
54
Finally, these expected initial pension benefits are accumulated over the
individual life cycle considering pension indexation rules , i.e. the increase in benefits
after retirement with a 20% wage growth. On this basis we estimate the accumulated
pension benefit of each cohort .
( )
The reduction of old-age benefits per capita of the population over the coming decades is
illustrated in Figure 17 below for males. Until 2050, average benefit levels from the public
pay-as-you-go system are more than halved – ignoring the wage growth effects. The
decline of NDC pension benefits is determined by the following factors: 1) younger cohorts
participate to a higher degree in the mixed FDC/NDC system and therefore pay less
contributions into NDC pensions, 2) younger cohorts experience longer periods of self-
employment and therefore pay less into NDC accounts and 3) younger cohorts have higher
expected life expectancy and therefore can expect lower pension benefits at a given age.
Figure 17: Accumulated pension benefit of males: 2010 vs. future years
0
2000
4000
6000
8000
10000
12000
14000
16000
18000
60 61 62 63 64 65 66 67 68 69
Pens
ion
bene
fit p
er c
apita
of t
he p
opul
atio
n (g
=0) i
n PL
N a
nd p
rices
of
2010
age
2010 (actual data) 2020 2030 2040 2050

Computation Approach
WORKING PAPER No. 145 59
4
55
Source: own calculations
So far the focus of the description lied on the estimation of future new pension benefits.
For our projection of future expenditures pension payments for current retirees are
crucial. Therefore, we first calculate analogously age and gender specific benefit levels of
current pensioners per capita of the population in the base year b. This figure
can be simply measured by multiplying average actual benefits of current retirees by
the respective number of pensioners . Thereafter, these aggregated age and gender
specific expenditures are divided by the respective population sizes .
Also for current retirees of the base year we project their benefits into the future
considering pension adjustment rules ( ).
( )
Finally, we multiply the age and gender specific accumulated benefits of base year and
future new retirees by cohort sizes in future years to derive total expenditures ( in a
respective future year f. The cohort sizes in future years are derived from our
population projection which is based on EUROPOP2010 assumptions.42
In line with the assumptions taken in our previous paper, issued in 201143, we differentiate
between groups of future pensioners, who, despite being insured in one old-age pension
fund, have a different legal status which affects their pension entitlements. Accordingly,
we estimate the pension entitlements of miners separately. The computation approach for
this groups is outlined in greater detail in the following sections.
4.4 Miners
A profession which profits from the early retirement privileges in an infinite time horizon is
mining. Legal rules set for this group in 2005 petrify the old system rules, where a pension 42 The population projection bases on a program initially developed by Bonin (2001). 43 Jablonowski et al. (2011).
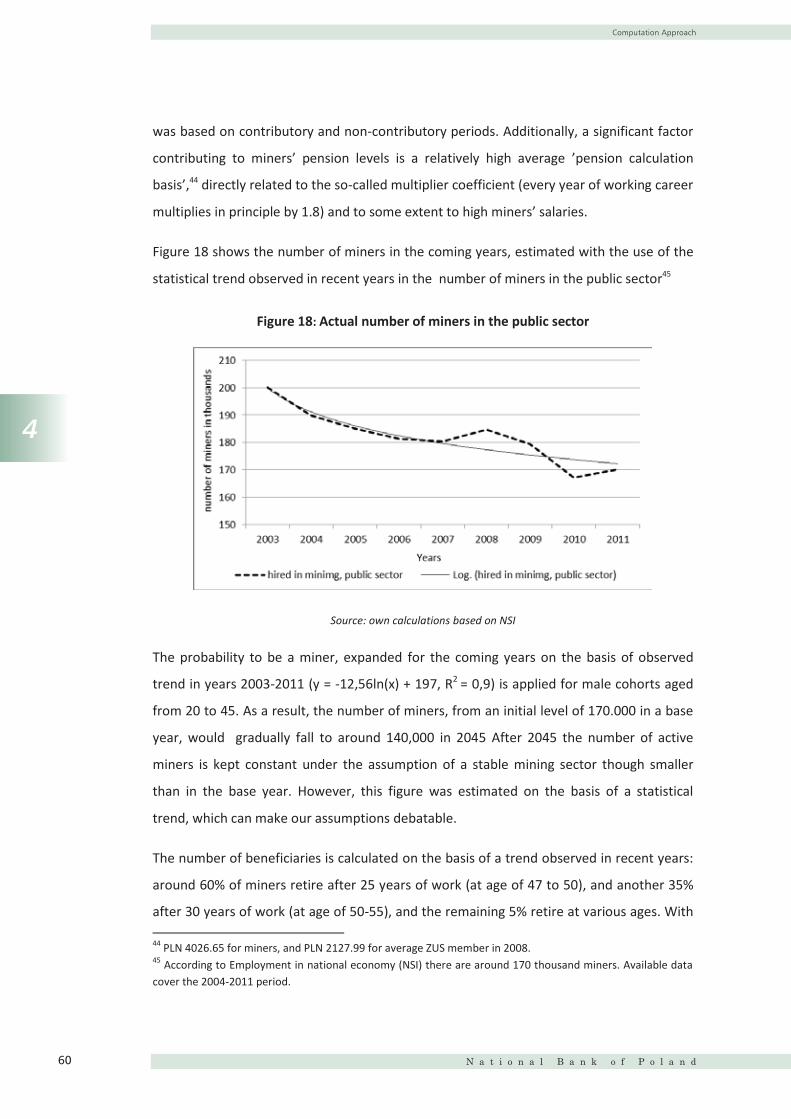
Computation Approach
N a t i o n a l B a n k o f P o l a n d60
4
56
was based on contributory and non-contributory periods. Additionally, a significant factor
contributing to miners’ pension levels is a relatively high average ’pension calculation
basis’,44 directly related to the so-called multiplier coefficient (every year of working career
multiplies in principle by 1.8) and to some extent to high miners’ salaries.
Figure 18 shows the number of miners in the coming years, estimated with the use of the
statistical trend observed in recent years in the number of miners in the public sector45
Figure 18: Actual number of miners in the public sector
Source: own calculations based on NSI
The probability to be a miner, expanded for the coming years on the basis of observed
trend in years 2003-2011 (y = -12,56ln(x) + 197, R2 = 0,9) is applied for male cohorts aged
from 20 to 45. As a result, the number of miners, from an initial level of 170.000 in a base
year, would gradually fall to around 140,000 in 2045 After 2045 the number of active
miners is kept constant under the assumption of a stable mining sector though smaller
than in the base year. However, this figure was estimated on the basis of a statistical
trend, which can make our assumptions debatable.
The number of beneficiaries is calculated on the basis of a trend observed in recent years:
around 60% of miners retire after 25 years of work (at age of 47 to 50), and another 35%
after 30 years of work (at age of 50-55), and the remaining 5% retire at various ages. With 44 PLN 4026.65 for miners, and PLN 2127.99 for average ZUS member in 2008. 45 According to Employment in national economy (NSI) there are around 170 thousand miners. Available data cover the 2004-2011 period.

Computation Approach
WORKING PAPER No. 145 61
4
57
a constant retirement probability , today’s number of 200.000 retired miners46
decreases in our simplified model to 150.000 around 2060.
Figure 19: Projected number of miners (active contributors and pensioners)
Source: own calculations based on ZUS and NSI
Miners’ contributions increase the overall sum of ZUS pension contributions, but are not
registered on the NDC accounts.47 In consequence, the sum of contributions collected on
the NDC accounts is lower than the actual overall amount of pension contributions in the
base year recorded in the Social Insurance Fund. The estimation of miner’s pension
contributions is based in our model on the average miner’s gross salary48 treated with the
time-invariant nominal pension contribution rate 19.52%, and the (AWG) wage growth
– applied also for the NDC system.
The computation of miners’ pensions is based on old rules,49 so in our model the miners’
pension system are computed separately from the NDC pensions. The benefits are based
on modified , with the already observed probabilities to retire . To
46 http://www.zus.pl/files/gornicze2008.pdf The miners’ profile was updated only for 2008 and 2009 due to discontinuation of the publication of the figures for this profession by the ZUS. 47 In fact miners have a right to collect their contributions on the NDC&FDC accounts, though this seems a rather theoretical possibility since upon retirement at a relatively young age (below 50) the small collected amounts divided by long life expectancy would result in very low replacement rate – the choice of such option seems irrational. In cases when a miner has an NDC/FDC account, FDC contributions are transferred to the state budget upon retirement. 48 PLN 5.717 in 2009 according to the ‘Structure of wages and salaries by the occupation’ (CSO). 49 See equations (1)-(3).
0
50 000
100 000
150 000
200 000
250 000
2004
2006
2008
2010
2012
2014
2016
2018
2020
2022
2024
2026
2028
2030
2032
2034
2036
2038
2040
2042
2044
2046
2048
2050
2052
2054
2056
2058
2060
num
ber o
f per
sons
Years number of retired miners active miners - contributors

Computation Approach
N a t i o n a l B a n k o f P o l a n d62
4
58
ensure that our applied micro data match the aggregate data of miners’ pension
expenditures we rescale benefits (with a miners’ specific parameter) to equal
total expenditures.
The cash balance of the miners’ subsystem, in a scenario of full wage growth indexation
(AWG scenario) is depicted in Figure 20 below:
Figure 20: Cash balance of the miners’ pension system, in % of GDP
Source: own calculations
0,0%
0,1%
0,2%
0,3%
0,4%
0,5%
0,6%
0,7%
2010
2012
2014
2016
2018
2020
2022
2024
2026
2028
2030
2032
2034
2036
2038
2040
2042
2044
2046
2048
2050
2052
2054
2056
2058
2060
% o
f GDP
Years miners' contributions miners' pensions

Results
WORKING PAPER No. 145 63
5
59
5 Results
Following a decade of no major pension reforms in Poland, two profound changes of the
public pension system were adopted in the last two years:
a. a cut of contributions paid in the mandatory funded pension pillar (FDC)
introduced in 2011 and
b. a gradual increase in the statutory retirement age to 67 for both men and women,
adopted in May 2012.50
The aim of the following section is to outline the quantitative impact of these reform
measures on:
1) Long-term fiscal stability (section 5.1),
2) Intergenerational redistribution of the ZUS old-age pension fund (section 5.2) and
3) Adequacy of public pension benefits in future decades (section 5.3).
5.1 Long-term fiscal stability51
5.1.1 Starting point – large deficit in 2010
In 2010 the ZUS old-age pension fund was running a deficit of 3.6% of GDP. This gap
between expenditures and revenues in 2010 can be explained to a large degree by the
change to a two pillar FDC/NDC system. In the current transition process relatively
generous pensions from the pre-1999, pure PAYG system need to be financed by
decreasing contributions to the current NDC system. Additionally, the actuarially
unbalanced miners’ pension scheme adds to the ZUS deficit – as will be outlined in further
detail below. The overall resulting current deficit is financed by taxpayers.52
In the following sections, we assess the future development of annual cash balances under
the legal status in place before the shift of FDC contributions to the NDC pillar (FDC cut), 50 For a detailed description of these reform acts see chapter 2. 51 The following illustration of cash balances covers all the NDC as well as miners’ pension contributions and revenues. Bridge pensions and contributions – which account for only 0.1% of total expenditures – are not taken into account. 52 One can assume that it is mostly the working age population that is financing the current deficit as they pay the highest taxes per capita. Additionally, these young cohorts need to save for their old-age as future NDC pension levels will be less generous. Therefore, one often refers to a double burden for younger cohorts who finance the transition from a PAYG to a (partially) funded pension system.

Results
N a t i o n a l B a n k o f P o l a n d64
5
60
followed by an evaluation of the FDC cut and of the increase in retirement ages to 67
(RA67).
5.1.2 Evaluation of pre-reform cash balances (before FDC cut)
Under the pre-reform scenario the deficit is expected to shrink until 2014 to roughly 2.3%
of GDP. The main reason for this deficit reduction is the low inflow of new retirees. Most
cohorts born around 1950 have to retire significantly later than their previous
counterparts as early retirement rules have been mostly abolished for cohorts born after
1948.
After 2014 the deficit will again start to rise reaching 2.7% of GDP in 2025. This deficit
increase is caused by the comeback to the normal inflow into retirement. Cohorts born
around 1950 now reach the statutory retirement ages of 60/65 and enter into retirement.
Additionally, the increase in the deficit until 2025 is driven by the so called baby boomer
generations. These sizeable age groups born between 1955 and 1960 retire in the period
2015 till 2025. As a consequence, overall pension expenditures will increase significantly in
these years (which can be observed in the bump in Figure 21).
After 2025 the fiscal situation of the ZUS pension system is easing. Pension expenditures
are expected to shrink significantly as NDC benefit levels are decreasing and as less
sizeable cohorts are entering into retirement. From 2025 to 2075, the old-age ZUS deficit
will gradually shrink. Under our assumptions the ZUS pension fund can expect almost a
match of revenues and expenditures from 2075 onwards. In the year 2075 the transition
process from the pre-1999 single pillar to the mixed NDC/FDC pillar system is almost fully
finalized as most scheme member benefiting from the old pre-1999 retirement rules have
died.

Results
WORKING PAPER No. 145 65
5
61
Figure 21: Annual cash balances – with and without FDC cut
Source: own calculations
5.1.3 Evaluation of the shift in FDC contributions (FDC cut) on cash balances
The shift of FDC contributions to the PAYG system legislated in 2011 shows an immediate
impact on the revenue side. Total contributions increase in our estimations from 3.6% of
GDP in 2010 to 4.6% of GDP in 2012. Also in the long-term revenues are nearly 1
percentage point of GDP higher after the shift of FDC contributions than under the pre-
reform, ’no FDC cut’ scenario. Expenditures are (almost) unaffected by the shift of FDC
contributions until the year 2025. This can be explained by the fact that only a small share
of cohorts retiring before 2025 is participating in the FDC system.53 Therefore, the shift of
FDC contributions affects their pension levels only to a low extent. Younger cohorts, on
the contrary, participate to a higher degree in the FDC system. For them the shift of FDC
contributions to the NDC system translates into an increase in NDC pension entitlements.
As a consequence, the legislated shift of FDC contributions leads to a gradual increase in
pension expenditures after 2025 – compared to the “no FDC cut” scenario. In the long-
53 The birth year specific participation rates in the FDC system are illustrated in Figure 9.
0
1
2
3
4
5
6
7
8
2010
2015
2020
2025
2030
2035
2040
2045
2050
2055
2060
2065
2070
2075
2080
2085
2090
2095
2100
expe
nditu
res
and
reve
nure
s in
perc
ent o
f GDP
year revenues - no FDC cut expenditures - no FDC cutrevenues - with FDC cut expenditures - with FDC cut
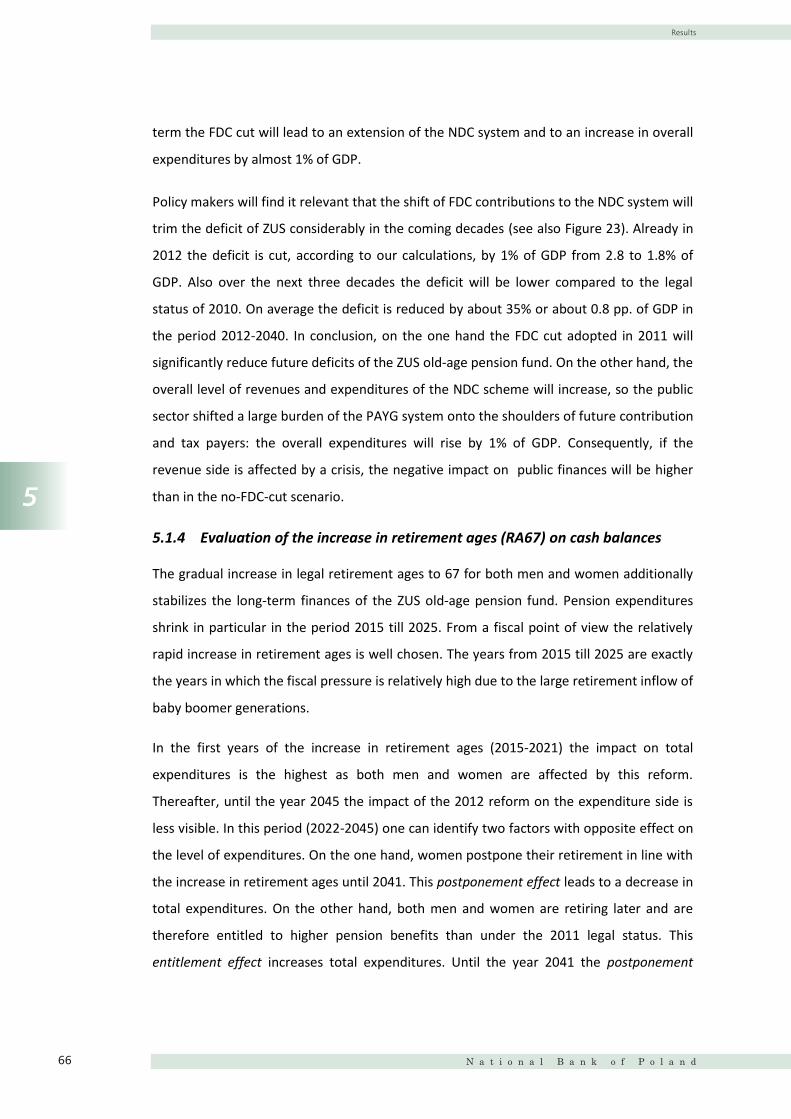
Results
N a t i o n a l B a n k o f P o l a n d66
5
62
term the FDC cut will lead to an extension of the NDC system and to an increase in overall
expenditures by almost 1% of GDP.
Policy makers will find it relevant that the shift of FDC contributions to the NDC system will
trim the deficit of ZUS considerably in the coming decades (see also Figure 23). Already in
2012 the deficit is cut, according to our calculations, by 1% of GDP from 2.8 to 1.8% of
GDP. Also over the next three decades the deficit will be lower compared to the legal
status of 2010. On average the deficit is reduced by about 35% or about 0.8 pp. of GDP in
the period 2012-2040. In conclusion, on the one hand the FDC cut adopted in 2011 will
significantly reduce future deficits of the ZUS old-age pension fund. On the other hand, the
overall level of revenues and expenditures of the NDC scheme will increase, so the public
sector shifted a large burden of the PAYG system onto the shoulders of future contribution
and tax payers: the overall expenditures will rise by 1% of GDP. Consequently, if the
revenue side is affected by a crisis, the negative impact on public finances will be higher
than in the no-FDC-cut scenario.
5.1.4 Evaluation of the increase in retirement ages (RA67) on cash balances
The gradual increase in legal retirement ages to 67 for both men and women additionally
stabilizes the long-term finances of the ZUS old-age pension fund. Pension expenditures
shrink in particular in the period 2015 till 2025. From a fiscal point of view the relatively
rapid increase in retirement ages is well chosen. The years from 2015 till 2025 are exactly
the years in which the fiscal pressure is relatively high due to the large retirement inflow of
baby boomer generations.
In the first years of the increase in retirement ages (2015-2021) the impact on total
expenditures is the highest as both men and women are affected by this reform.
Thereafter, until the year 2045 the impact of the 2012 reform on the expenditure side is
less visible. In this period (2022-2045) one can identify two factors with opposite effect on
the level of expenditures. On the one hand, women postpone their retirement in line with
the increase in retirement ages until 2041. This postponement effect leads to a decrease in
total expenditures. On the other hand, both men and women are retiring later and are
therefore entitled to higher pension benefits than under the 2011 legal status. This
entitlement effect increases total expenditures. Until the year 2041 the postponement
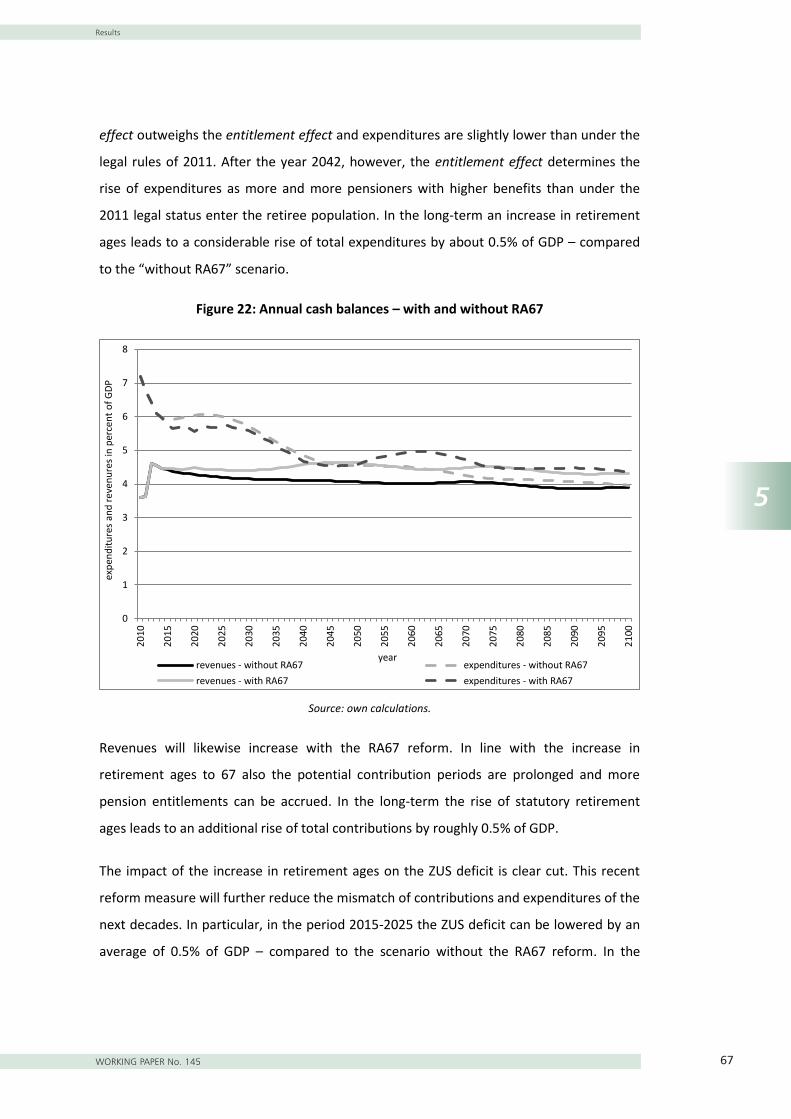
Results
WORKING PAPER No. 145 67
5
63
effect outweighs the entitlement effect and expenditures are slightly lower than under the
legal rules of 2011. After the year 2042, however, the entitlement effect determines the
rise of expenditures as more and more pensioners with higher benefits than under the
2011 legal status enter the retiree population. In the long-term an increase in retirement
ages leads to a considerable rise of total expenditures by about 0.5% of GDP – compared
to the “without RA67” scenario.
Figure 22: Annual cash balances – with and without RA67
Source: own calculations.
Revenues will likewise increase with the RA67 reform. In line with the increase in
retirement ages to 67 also the potential contribution periods are prolonged and more
pension entitlements can be accrued. In the long-term the rise of statutory retirement
ages leads to an additional rise of total contributions by roughly 0.5% of GDP.
The impact of the increase in retirement ages on the ZUS deficit is clear cut. This recent
reform measure will further reduce the mismatch of contributions and expenditures of the
next decades. In particular, in the period 2015-2025 the ZUS deficit can be lowered by an
average of 0.5% of GDP – compared to the scenario without the RA67 reform. In the
0
1
2
3
4
5
6
7
8
2010
2015
2020
2025
2030
2035
2040
2045
2050
2055
2060
2065
2070
2075
2080
2085
2090
2095
2100
expe
nditu
res
and
reve
nure
s in
perc
ent o
f GDP
year revenues - without RA67 expenditures - without RA67revenues - with RA67 expenditures - with RA67

Results
N a t i o n a l B a n k o f P o l a n d68
5
64
longer time horizon of 2010-2060 the deficit is on average reduced by 0.4% of GDP. The
following Figure 23 summarizes the impact of the reforms on the ZUS deficit.
Figure 23: ZUS deficit under different reform scenarios
Source: own calculations.
Our estimations of future cash balances do not take into account the changing proportions
of minimum pension beneficiaries. As outlined in section 5.3, a large number of future
beneficiaries may expect pension levels below the threshold of the minimum pension.
This is especially the case in a reform scenario without the increase in retirement ages to
67. In our aggregate projections we do not consider that this cut of future pension benefits
may be limited in the case of an increasing share of scheme members by the minimum
pension threshold. Consequently, we may overestimate the decline of future pension
expenditures.
5.1.5 The sustainability gap of the ZUS old-age pension fund
Annual cash balances, shown above, provide valuable information about the timing effect
of reforms. Moreover, these flow figures have the advantage to be easily understandable
-0,5
0
0,5
1
1,5
2
2,5
3
3,5
4
2010 2020 2030 2040 2050 2060 2070 2080 2090 2100
Defic
it of
the
ZUS
old
age
pens
ion
fund
in p
erce
nt o
f GDP
year
before FDC cut after FDC cut after FDC cut & RA67

Results
WORKING PAPER No. 145 69
5
65
by the public. Annual cash balances can provide an indication of the mid- and long-term
stability of a fiscal system. An indicator which is more often applied in academic circles is
the sustainability gap. It reflects not only the fiscal situation in one year (like flow figures)
but sums up (in one stock figure) the stability of a fiscal system over an infinite horizon. In
our computation, the sustainability gap reflects the accumulated and discounted future
deficits in terms of the GDP of 2010. In can be interpreted as the PLN amount which needs
to be set aside today in order to finance all future deficits of the ZUS old-age pension fund.
The sustainability gap is shown to outline the overall impact of recent reforms and to
illustrate the relative gap caused by the general old age pension system and by the miners’
pension system. In fact this gap will be most likely bridged by tax inflows, as observed in
recent years – and by an increase in the general government debt.
Before the FDC cut the sustainability gap of the ZUS pension fund amounted to 86.3% of
GDP. This figure includes the sustainability gap of the general old-age pension system
(66,4 % of GDP) and of the miners’ pension system (19.9 % of GDP). The sustainability gap
has been significantly reduced by 27.6 pp. with the partial shift of FDC contributions to the
NDC system. A slightly lower, but still considerable, decrease in the sustainability gap of
17.4% of GDP has been achieved with the increase in statutory retirement age to 67. After
this reform the sum of all future deficits in ZUS pension fund amounts to 41.2% of GDP in
2010. In conclusion, the sustainability gap of the ZUS pension fund has been more than
halved with the two recent reforms. Roughly half of the current sustainability gap (19.9%
of GDP) is caused by the miners’ pension system.

Results
N a t i o n a l B a n k o f P o l a n d70
5
66
Figure 24: Sustainability gaps of the public pension scheme after the recent reforms
Source: own calculations.
5.2 Intergenerational redistribution effects of past reforms
The aim of the following section is to assess the intergenerational redistribution effects of
the Polish public pension system after the two recent reforms, the FDC cut and the RA67.
For this analysis we will rely on the method of generational accounting, a method widely
used in the public finance literature and initially developed by Auerbach, Gokhale and
Kotlikoff (1991, 1992 and 1994).
5.2.1 Intergenerational redistribution effects of the FDC cut and RA67
Generational accounts (GAs) can answer the question which cohorts bear the highest
burden and are the most affected by fiscal reforms. They are set up in a purely forward-
looking manner and reflect the discounted sum of contributions paid minus transfers
received in or after the base-year. As a consequence, GAs cannot, generally, be compared
across living generations as they incorporate effects of differential lifetime. While for
younger cohorts born in or after the base year the entire lifecycle is reflected in GAs, this is
not the case for older age groups which can look back on a number of past years not
considered in GAs. One may, however, compare GAs for different reform scenarios to
19,9 19,9 19,9
66,4
38,8
21,4
86,3
58,7
41,2
0
10
20
30
40
50
60
70
80
90
100
pre-reform scenario with FDC cut with FDC cut & RA67
sust
aina
bilit
y ga
p in
per
cent
of G
DP
201
0
only miners only general old age pension

Results
WORKING PAPER No. 145 71
5
67
outline to which extent different cohorts are affected by legal changes over their
remaining lifecycle.
The intergenerational redistribution impact of the two recent pension reforms is
illustrated in Figure 25. It can be observed by comparing the GAs of a given age for the
three legal statuses (i.e. comparing the orange, red and green bar). A glance at Figure 25
reveals that the level of GAs is almost unchanged in all three legal frameworks. Cohorts
older than 60 are not affected at all by the two reforms. The net-lifecycle payments, i.e.
GAs, of younger age groups are slightly increased by the cut of FDC contributions and the
RA67. This implies that both reforms, the shift of contribution rates (FDC cut) and the
increase in retirement ages (RA67) do not lead to significant intergenerational
redistribution effects. In other words, the net-lifecycle payments of each cohort remain
constant in both reform scenarios.54
One may ask why the recent pension reforms did not have considerable intergenerational
redistribution effects? An answer is provided by the notion of equivalence which is
strongly embedded in the NDC pension system. Any rise of contributions to the NDC
system, whether caused by the shift of FDC contributions or by the increase in retirement
ages, is translated proportionally via the benefit formula into higher pension benefits. As a
consequence, the net-lifecycle payments, i.e. GAs, are unaffected by reforms leading to an
increase in contributions.
54 A slight increase in GAs can be observed for younger cohorts aged 30 and younger. This rise is mainly caused by higher discounts of pension benefits received later.

Results
N a t i o n a l B a n k o f P o l a n d72
5
68
Figure 25: Generational accounts of ZUS-pensions (base year 2010, r=3%, wg=AWG)
Source: own calculations.
5.2.2 Intergenerational redistribution effects for the miners pensions scheme
At last, but not least, we present the generational accounts for the miners’ sub-system, as
depicted on Figure 26. As might be expected all cohorts of miners are regarded from this
perspective as net beneficiaries. In other words, all presently living cohorts will receive
more benefits than they pay contributions over their remaining lifecycle.
-300,0
-250,0
-200,0
-150,0
-100,0
-50,0
0,0
50,0
100,0
0 5 10 15 20 25 30 35 40 45 50 55 60 65 70 75 80 85 90 95 100
gene
ratio
nal a
ccou
nts i
n 10
00 P
LN
age pre-reform scenario with FDC cut with only RA67

Results
WORKING PAPER No. 145 73
5
69
Figure 26: Generational accounts of miners’ pensions (base year 2010, r=3%, wg=AWG)
Source: own calculations.
5.3 Adequacy of future pension benefits
The third perspective used in this study analyses the adequacy between pension levels and
salaries. As stated in chapter 3, the adequacy ratio (AR) in this study compares the gross
pension level in relation to the average gross salary in the economy. For the purposes of
the analyses we apply the forecasts based on the 1% sample data, which is much more
detailed than average per cohort data. Further to the assumptions taken in the chapter
devoted to the input data, the adequacy will be analysed for employees and self-employed
persons who participate in the FDC system.55
The profound reforms introduced in years 2011-2012 have had an influence on the gender
specific adequacy, but also on particular relations in the adequacy ratios between cohorts
– since the forecast covers a period of phase-out of the old system and the gradual
changeover into the new one. The picture turns to be even more complex if we add the
division into employment type: self-employed or hired. To introduce some predictable
order we will proceed with the description of the results as follows:
1. Status quo scenario (and FDC reform)
55 Non-FDC employees and self-employed are analyzed separately in Annex 1.
-14,0
-12,0
-10,0
-8,0
-6,0
-4,0
-2,0
0,0
0 5 10 15 20 25 30 35 40 45 50 55 60 65 70 75 80 85 90 95 100
in 1
000
PLN
Age

Results
N a t i o n a l B a n k o f P o l a n d74
5
70
a. gender specific outlook (by employees and the self-employed).
b. comparison of employees and self-employed adequacies (by gender).
2. Increased retirement age scenario.
a. gender specific outlook (breakdown into employees and the self-
employed).
b. comparison of employees and self-employed adequacies (by gender).
3. reference to the minimum pension levels
a. gender specific outlook (breakdown into employees, the self-employed
and miners).
The figures and related explanation will refer to the statistical measures introduced in the
computation chapter, i.e. for the contributors who paid in 2010 a median (50% of the
sample) and the third quartile (75% of the sample) contributions.
5.3.1 The status quo scenario
5.3.1.1 Gender specific outlook, for employees and the self-employed
Figure 27 shows a comparison between the adequacy ratios for employees, participating
in the FDC scheme by gender under the legal framework of years 1999-2011 (before the
FDC cut). A significant spread between gender specific adequacy ratios of the initial
pension level upon retirement is explained by the difference in the legal retirement age:
60 for women and 65 for men. 5 more years of work translates into significantly higher
adequacy ratios for men. On average, they are higher by over one third.56 Both analysed
statistical measures: median (current minimum salary contributors) and the 3rd quartile
(current average salary contributors) drop significantly with time, but their percentage
relation stays stable. Nevertheless, the divergence between the average salary and the
initial old-age pension in the future may be disappointing for many individuals who pay
the median contributions: adequacy ratios amount to approx. 60% for men and 40% for
women around 2015, dropping steadily over time to 17% for men and 13% for women in
2045. The cushioning effect of the minimum pension is not considered here – but
addressed later (section 5.3.4).
56 Male higher adequacy ratios can be mainly explained by a higher retirement age but also by longer contribution careers.

Results
WORKING PAPER No. 145 75
5
71
Our contribution analyses show that the median contribution path across birth years, for
men as well as for women, moved between two ‘levels of resistance’57: the minimum
salary (lower bound) and the 60% of the average salary in the economy. These salary levels
are currently highly representative for the baby-boomers born after 1980. Despite the fact
that these cohorts follow the promotion path observed in the base year 2010, their initial
pension would correspond to 15% adequacy levels upon retirement around 2045. The
adequacy rates are visibly higher for older cohorts, who retire around 2030. The
explanation consists of mainly three impact factors: relatively generous estimation of
initial capital of older cohorts, decreasing real wage growth and extending life expectancy.
For more analysis, see the chapter devoted to sensitivity analyses.
The adequacy ratio for the 3rd quartile (average salary level in the base year) shows a very
deep decrease: the initial level of around 85% for men and 63% for women in 2015
decreasing with years to 35% and 25% respectively in 2045.
An FDC member, employee, who was paid salaries around statistical outliers (97.5% of the
sample and over) in the base year, may expect a pension of 100% of the average salary in
case of men and over 70% in the case of women (not presented on the charts).
Concurrently, contributors who reach the upper salary ceilings (250% of monthly average
salary) are very rare, so they appear around the statistical error margin. Therefore a 100%
adequacy ratio for this group may be regarded as a potential maximum achievable in the
new system in the status quo scenario (no FDC cut & without increase in retirement age).
57 For details see Figure 5
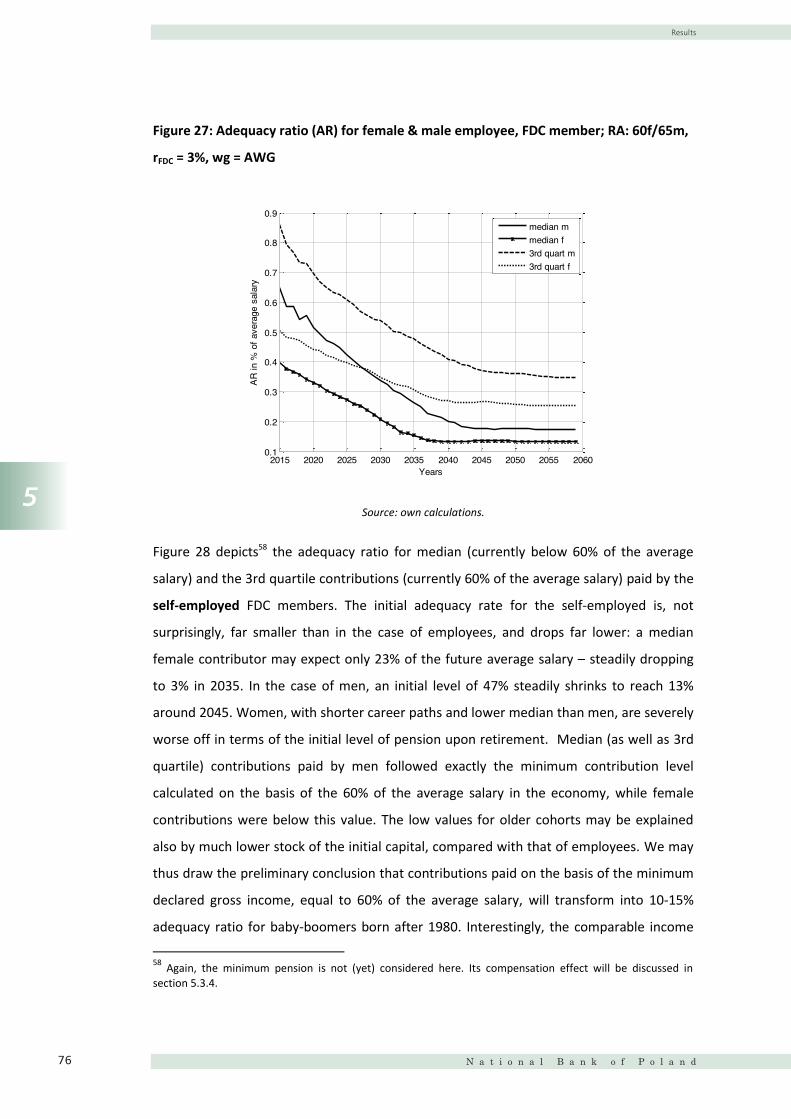
Results
N a t i o n a l B a n k o f P o l a n d76
5
72
Figure 27: Adequacy ratio (AR) for female & male employee, FDC member; RA: 60f/65m,
rFDC = 3%, wg = AWG
Source: own calculations.
Figure 28 depicts58 the adequacy ratio for median (currently below 60% of the average
salary) and the 3rd quartile contributions (currently 60% of the average salary) paid by the
self-employed FDC members. The initial adequacy rate for the self-employed is, not
surprisingly, far smaller than in the case of employees, and drops far lower: a median
female contributor may expect only 23% of the future average salary – steadily dropping
to 3% in 2035. In the case of men, an initial level of 47% steadily shrinks to reach 13%
around 2045. Women, with shorter career paths and lower median than men, are severely
worse off in terms of the initial level of pension upon retirement. Median (as well as 3rd
quartile) contributions paid by men followed exactly the minimum contribution level
calculated on the basis of the 60% of the average salary in the economy, while female
contributions were below this value. The low values for older cohorts may be explained
also by much lower stock of the initial capital, compared with that of employees. We may
thus draw the preliminary conclusion that contributions paid on the basis of the minimum
declared gross income, equal to 60% of the average salary, will transform into 10-15%
adequacy ratio for baby-boomers born after 1980. Interestingly, the comparable income
58 Again, the minimum pension is not (yet) considered here. Its compensation effect will be discussed in section 5.3.4.
2015 2020 2025 2030 2035 2040 2045 2050 2055 20600.1
0.2
0.3
0.4
0.5
0.6
0.7
0.8
0.9
Years
AR in
% o
f ave
rage
sal
ary
median mmedian f3rd quart m3rd quart f

Results
WORKING PAPER No. 145 77
5
73
level recorded in 1999-2010 for employees (the above-mentioned median for cohorts of
1955-1975) translates into higher adequacy ratios: this might be due to twice as high stock
of the initial capital recorded for employees in comparison with the self-employed.59
Figure 28: Adequacy ratio (AR) for female & male self-employed, FDC member; RA:
60f/65m, rFDC = 3%, wg = AWG
Source: own calculations.
5.3.1.2 Comparison between employees and the self-employed for each gender
The next two figures: Figure 29 and Figure 30 may serve as a visualization of the already
described interrelations between adequacy ratios of the employed and self-employed men
and, respectively, women, both FDC members. The retirement age is comparable on each
of the charts: 65 for men and 60 for women. Figure 29 shows a difference between
minimum salary earners (median male employees) and those self-employed who declare
60% of the average salary: the initial level of the benefit is lower by 10 pp for the self-
employed, which may be explained by the lower initial capital in the case of older cohorts,
and a discontinuous career path in the case of younger self-employed, observed in the
data for 1999-2010. Since the self-employed seem to maximize their disposable income,
59 Our grouping method, based on predominant type of labor activity (employee or self-employed) in 1999-2010 shows comparable IC/contributions ratio.
2015 2020 2025 2030 2035 2040 2045 2050 2055 20600
0.1
0.2
0.3
0.4
0.5
0.6
0.7
Years
AR in
% o
f ave
rage
sal
ary
median mmedian f3rd quart m3rd quart f
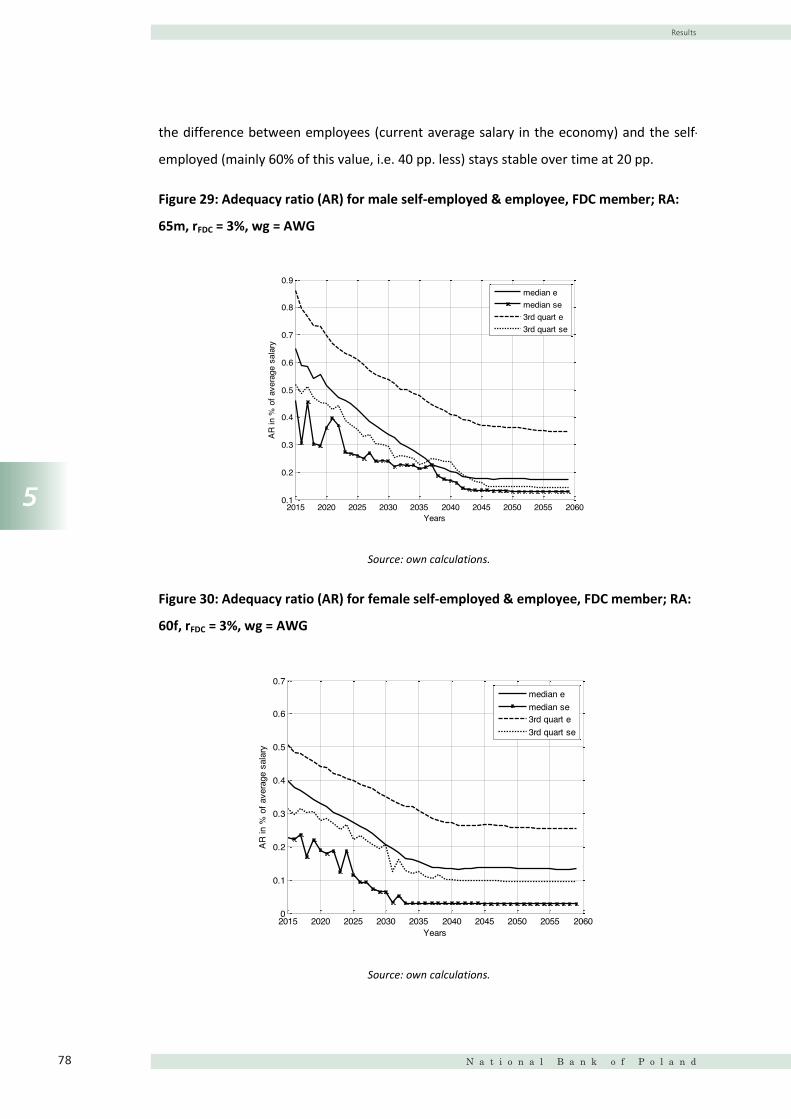
Results
N a t i o n a l B a n k o f P o l a n d78
5
74
the difference between employees (current average salary in the economy) and the self-
employed (mainly 60% of this value, i.e. 40 pp. less) stays stable over time at 20 pp.
Figure 29: Adequacy ratio (AR) for male self-employed & employee, FDC member; RA:
65m, rFDC = 3%, wg = AWG
Source: own calculations.
Figure 30: Adequacy ratio (AR) for female self-employed & employee, FDC member; RA:
60f, rFDC = 3%, wg = AWG
Source: own calculations.
2015 2020 2025 2030 2035 2040 2045 2050 2055 20600.1
0.2
0.3
0.4
0.5
0.6
0.7
0.8
0.9
Years
AR in
% o
f ave
rage
sal
ary
median emedian se3rd quart e3rd quart se
2015 2020 2025 2030 2035 2040 2045 2050 2055 20600
0.1
0.2
0.3
0.4
0.5
0.6
0.7
Years
AR in
% o
f ave
rage
sal
ary
median emedian se3rd quart e3rd quart se

Results
WORKING PAPER No. 145 79
5
75
5.3.1.3 The main drivers for the drop of adequacy ratios
In the previous sections we observed that adequacy ratios can be expected to drop
significantly in the period from 2015-2060 for all groups assessed. Generally, we can
expect a shrinking of adequacy ratios by about 50-75 %. For the lower income quartiles
and the group of self-employed the reduction is more considerable than for higher
earnings groups and employees. An important question is thus which factors determine
this drop of adequacy ratios in future decades?
We can identify three main drivers of the reduction of adequacy levels, namely:
1) the increase in life expectancy,
2) the low future indexation of pension entitlements,
3) changing contribution histories.
The first two factors are directly related to the benefit formula. An increase in the unisex
life expectancy at the age of retirement directly translates into a decrease in the initial
pension levels. In our estimations the unisex life expectancy at retirement is assumed to
increase by about 4 years until 2060. This first factor alone will lead to a drop of pension
benefits by about 20%. For illustration we show in the appendix a scenario of the
adequacy ratios with a constant unisex life expectancy of the base year over time.
The second factor represents the low future indexation of pension entitlements. According
to the benefit formula pension rights accrued on NDC accounts are indexed each year in
line with the wage bill growth. The latter indexation factor sums up the wage and the
employment growth. As the Polish working population will shrink in future decades (see
section 4.1 Population projection), the employment growth is expected to turn negative
from 2015 onwards. Consequently, the wage bill growth will be lower than the wage
growth (see also Figure 7). This growth differential has a clear cut impact on future
adequacy ratios: The level of pension entitlements accrued on NDC accounts will grow
slower (only with wage bill growth) than the average earnings in the economy (which grow
with wage growth). According to our calculations this comparably low indexation of
pension entitlements will lead to a reduction of adequacy ratios up to 10%60 over time. To
60 3rd quartile male employees (average salary in the economy in 2010).

Results
N a t i o n a l B a n k o f P o l a n d80
5
76
outline this impact we show a scenario with an indexation of NDC pension rights with the
wage growth, instead of the wage bill growth, in the appendix.
The third factor represents changing contribution histories. During the communist era
Poland experienced almost full officially registered employment61. After the fall of the iron
curtain, however, unemployment was rising considerably, especially among the younger
cohorts62. As a consequence older cohorts, who accrued pension rights during the
communist era, have fewer breaks in their contribution history than younger age groups.
They accrued relatively high pension entitlements until 1990 (reflected in the initial
capital) which was indexed with high internal rates of return (see valorisation factor in
Table 3). Younger cohorts, on the contrary, show more breaks in their contribution history
which are only partially or not at all credited for in the new NDC pension benefit formula.
Besides more frequent career breaks younger cohorts also declare rather low earnings as a
contribution basis. As outlined in section 4.1.1.2 about 50% of contributors (of the group
of employees) declare only between zero and the minimum salary as contribution basis.
Consequently, their future pension levels will be rather low. All together these changing
contribution careers translate into significantly lower pension levels for younger cohorts.
We assume that about half of the future drop of adequacy ratios is driven by the factor of
changing contribution careers. For self-employed and lower earnings groups the
contribution history explains even more than 50% of their reduction of adequacy levels
until 2060 as their declared income for the contribution calculation is extremely low. In
other words, we assume that the drop of adequacy ratio which cannot be explained by the
former two factors (increasing life expectancy and low indexation of pension rights) is
attributed to changes of the contribution history.
In conclusion, three factors determine the future drop of adequacy ratios until 2060. Half
of the reduction can be explained by the automatic adjustment of the NDC benefit formula
to demographic changes. Namely 1) the expected increase in the life expectancy and 2)
the shrinking of the working population will lead via the benefit formula to pension benefit
reductions. The other half of the drop of future pension benefits can be traced back to 3)
changes of the contribution history. Increasing unemployed periods and very low declared
earnings translate into rather low pension levels in the future. This result is rather
61 Dach, Z. 1993. 62 Ibidem.

Results
WORKING PAPER No. 145 81
5
77
important upon discussion on the measures to increase future adequacy ratios. A focus
should lie on initiatives, which increase the employment rate and the declared
contribution basis.
5.3.2 The FDC cut reform
The FDC cut reform has not changed the pension contribution overall rate of 19.52% - it
changed only the ratios between the NDC and the FDC part. The FDC cut reform shows a
relatively small effect on adequacy ratios, compared to the increase in retirement ages.63
The difference between the status quo and FDC cut scenarios become more visible in
adequacy ratios after 2040. According to our findings, the FDC cut results roughly in a 10%
decrease in pension benefit for employees retiring after 2050, as depicted in Figure 31
and Figure 32. This observation may be explained by several factors:
The rate of return on FDC accounts is higher for most of the projection horizon. It
is fixed at a 3% level in real terms until the end of the forecast. In the projection
period 2010-2060 it is roughly twice as high as the NDC rate of return.
Younger cohorts retiring after 2030 are more affected by the FDC cut, as a longer
stretch of their contribution career is affected by this cut. Older cohorts retiring in
the coming 10 years are almost unaffected by the FDC cut. The age specific impact
can be explained as follows: First, older cohorts often do not participate in the FDC
system. Second, if they participate in FDC, they spent only a small part of their
contribution career in the FDC system (only periods after 1998). Third, the
differential between FDC and NDC rates of return is not very considerable for
1999-2015.64 Only after 2015 both rates of return will diverge as the NDC rates of
return shrink considerably via the link to the ageing population.
In general the impact of FDC cut is relatively small since FDC contributions
represent 37% of the entire old-age pension contributions. With the FDC cut this
proportion is halved to a level of 18% (after 2017).
63 Sensitivity analysis for different macroeconomic assumptions will be tackled in the chapter devoted to sensitivity analyses. 64 See also Table 3 and Figure 7.

Results
N a t i o n a l B a n k o f P o l a n d82
5
78
Figure 31: Adequacy ratio (AR) without FDC cut, for male employee, FDC member; RA:
65m, rFDC = 3%, wg = AWG
Source: own calculations.
Figure 32: Adequacy ratio (AR) without FDC cut, for female employee, FDC member;
RA: 60f, rFDC = 3%, wg = AWG
Source: own calculations.
2015 2020 2025 2030 2035 2040 2045 2050 2055 20600.1
0.2
0.3
0.4
0.5
0.6
0.7
0.8
0.9
Years
AR in
% o
f ave
rage
sal
ary
median mmedian m noFDCcut3rd quart m3rd quart m noFDCcut
2015 2020 2025 2030 2035 2040 2045 2050 2055 20600.1
0.15
0.2
0.25
0.3
0.35
0.4
0.45
0.5
0.55
0.6
Years
AR in
% o
f ave
rage
sal
ary
median fmedian f noFDCcut3rd quart f3rd quart f noFDCcut

Results
WORKING PAPER No. 145 83
5
79
5.3.3 The 67 retirement age reform
In 2012 a new reform was introduced, which raises gradually the retirement age for both
men and women. For men the extension period of the shift from the retirement age of 65
to 67 will be spread between 2016 and 2020, while for women the increase in retirement
ages from 60 to 67 will be carried out between 2016 and 2040, 1 full year of extra work for
every 4 years in time. We will inspect the change in adequacy ratios for each gender,
broken down into employees and the self-employed.
5.3.3.1 Gender specific outlook for employees and the self-employed.
Extended retirement age for female employees participating in the FDC system is clearly
the furthest reaching consequence of the recent reform: as depicted in Figure 33, the
median female contributor born after 1980 who currently earns a minimum salary would
have the adequacy ratio of her pension raised from around 13% to 20%. A third quartile
employed FDC female being currently paid approximately the average salary in the
economy, at the new retirement age reaches around 37% adequacy, compared with 25% if
she retired at the age of 60. Interestingly, it seems that the raised retirement age for
employed women does not guarantee stable relation of the initial pension to the average
salary: a drop from the current 50% to 37%, with the career extended by 7 years may be
somewhat disappointing.

Results
N a t i o n a l B a n k o f P o l a n d84
5
80
Figure 33: Adequacy ratio (AR) for female employee, FDC member; RA: 60f/67f, rFDC =
3%, wg = AWG
Source: own calculations.
Self-employed women with extra 7 years added to their careers would have adequacy
raised by around 5 pp. for all cohorts, if the current declared income amounts to 60% of
the average salary – see Figure 34. The modest adequacy before (around 20%) and after
the reform (15%) should be a point for consideration. These women who declare median
values (either 60% or less, due to long non-contributory periods, see Figure 6) are actually
left with almost ‘starvation’ adequacy ratios, which are below any minimum pension
measure we consider (see Figure 40).
2015 2020 2025 2030 2035 2040 2045 2050 2055 20600.1
0.15
0.2
0.25
0.3
0.35
0.4
0.45
0.5
0.55
0.6
Years
AR in
% o
f ave
rage
sal
ary
median 67median 603rd quart 673rd quart 60
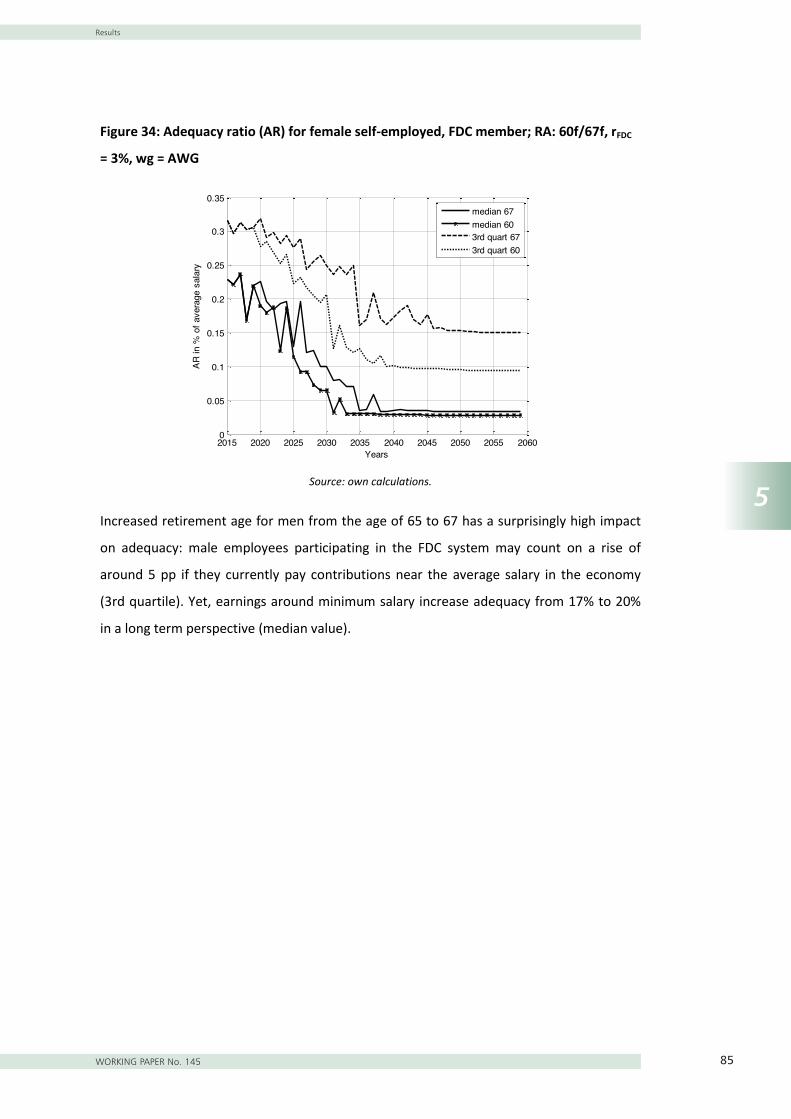
Results
WORKING PAPER No. 145 85
5
81
Figure 34: Adequacy ratio (AR) for female self-employed, FDC member; RA: 60f/67f, rFDC
= 3%, wg = AWG
Source: own calculations.
Increased retirement age for men from the age of 65 to 67 has a surprisingly high impact
on adequacy: male employees participating in the FDC system may count on a rise of
around 5 pp if they currently pay contributions near the average salary in the economy
(3rd quartile). Yet, earnings around minimum salary increase adequacy from 17% to 20%
in a long term perspective (median value).
2015 2020 2025 2030 2035 2040 2045 2050 2055 20600
0.05
0.1
0.15
0.2
0.25
0.3
0.35
Years
AR in
% o
f ave
rage
sal
ary
median 67median 603rd quart 673rd quart 60

Results
N a t i o n a l B a n k o f P o l a n d86
5
82
Figure 35: Adequacy ratio (AR) for male employee, FDC member; RA: 65m/67m, rFDC =
3%, wg = AWG
Source: own calculations.
The analysis of the self-employed men participating in the FDC system shows significantly
weaker impact of the 2 additional years on the labour market: those who declare 60% of
the average salary raise the initial adequacy ratio by barely 2pp to 15% in the case of
cohorts born after 1980. The cohorts born earlier may count on 45-55% of the average
salary in the economy of their initial pension. This can be explained by the fact that they
cumulate relatively small earnings during their contribution life-cycle (which are
subsequently added to the substantial initial capital level). As a consequence, the
extension of the contribution time-span does not add considerably to future pension
levels.
2015 2020 2025 2030 2035 2040 2045 2050 2055 20600.1
0.2
0.3
0.4
0.5
0.6
0.7
0.8
0.9
1
Years
AR in
% o
f ave
rage
sal
ary
median 67median 653rd quart 673rd quart 65

Results
WORKING PAPER No. 145 87
5
83
Figure 36: Adequacy ratio (AR) for male self-employed, FDC member; RA: 65m/67m, rFDC
= 3%, wg = AWG
Source: own calculations.
5.3.3.2 Comparison between men and women
Cross-gender comparison reveals apparent differences in the adequacy ratios in the
transition period, visible especially between 2020 and 2030, when men may retire at age
67 and women at 62 to 64. Although the distance between retirement ages is equal to the
status quo, the remaining retirement period for men is smaller – the NDC and FDC
accounts at retirement are therefore divided by a smaller number of expected years until
death. As a consequence, Figure 37 (FDC members), which compare male and female
employees, show an adequacy gender gap of 20 to even 25 pp. in 2020. As might have
been expected, after the unification of the retirement ages, the pension levels for both
genders show no difference for the median (minimum salary paid in the base year). In the
case of earnings around average salary in the economy (3rd quartile), the gap between
men and women adequacy ratios can be explained by higher men’s initial capital and
salaries, and continuous career path.
2015 2020 2025 2030 2035 2040 2045 2050 2055 20600.1
0.15
0.2
0.25
0.3
0.35
0.4
0.45
0.5
0.55
0.6
Years
AR in
% o
f ave
rage
sal
ary
median 67median 653rd quart 673rd quart 65

Results
N a t i o n a l B a n k o f P o l a n d88
5
84
Figure 37: Adequacy ratio (AR) for male & female employee, FDC member; RA: 67m/67f,
rFDC = 3%, wg = AWG
Source: own calculations.
The difference between genders is not that apparent in the case of self-employed FDC
members, as shown in Figure 38 below. The gap between gender specific adequacy
peaking around year 2020 is visible for the 3rd quartile, where women may count on 30%
and men on a 50% adequacy ratio, though after the unification of retirement ages after
2040, the initial level of the pension drops to 15% of the then average salary. We may
conclude that despite the introduction of higher retirement ages for both genders,
adequacy benefits are not obvious, especially in the case of self-employed women who
pay the lowest possible contributions allowed (currently 60% of the average salary). They
may merely count on a pension reaching approx. 15% of this amount upon retirement,
which is far below the safety net purpose.
2015 2020 2025 2030 2035 2040 2045 2050 2055 20600.1
0.2
0.3
0.4
0.5
0.6
0.7
0.8
0.9
1
Years
AR in
% o
f ave
rage
sal
ary
median mmedian f3rd quart m3rd quart f

Results
WORKING PAPER No. 145 89
5
85
Figure 38: Adequacy ratio (AR) for male & female self-employed, FDC member; RA:
67m/67f, rFDC = 3%, wg = AWG
Source: own calculations
5.3.4 The impact of minimum pensions
The issue of the minimum pension as a sub-issue of adequacy is complex and deserves a
separate sub-chapter. The complexity of the minimum pension is related to the rules of
indexation, which are often prone to externalities: social tensions or the political context,
e.g. an approaching election campaign. The legal rule which assumes that the indexation
of the social benefits amounts to 20% of the average salary growth observed in the
economy (in our model 20% of the wage growth) was replaced in 2012 by the rule of a
lump sum indexation, equal for all ZUS pensioners, irrespectively of amounts received. The
new rule results in higher percentage growth of the lowest pensions than of the highest
ones. However, the lump sum is not precisely set in relation to any predictable or
quantifiable variable, like GDP growth, long-term government bond interest or the
inflation rate. To cope somehow with this difficulty, we make the assumption that the
indexation of future minimum pensions will be limited by two extremes: the current rule
of 20% indexation and full (100%) indexation in relation to the real wage growth (wg).
2015 2020 2025 2030 2035 2040 2045 2050 2055 20600
0.1
0.2
0.3
0.4
0.5
0.6
0.7
Years
AR in
% o
f ave
rage
sal
ary
median mmedian f3rd quart m3rd quart f

Results
N a t i o n a l B a n k o f P o l a n d90
5
86
5.3.4.1 Comparison between men and women
Figure 39 and Figure 40 again show adequacy ratios (similarly to Figure 37 and Figure 38),
comparing males and females, both employed and participating in the FDC scheme, in a
scenario of extended retirement ages and the FDC cut. What is new is the dotted lines
representing minimum pension brackets: the lower dotted line marks a 20% indexation
and the upper dotted line - full indexation. A third quartile employee & FDC contributor
(paid currently at the average salary level) is clearly above the minimum threshold line
(20% indexation). However, the compensating payment made by the state and capped at
the minimum level is minimised if the full indexation of the pension were to be introduced
right after the base year.
Figure 39: Adequacy ratio (AR) for male & female employee, FDC member; RA: 67m/67f,
rFDC = 3%, in relation to minimum pension (idx = 20%wgAWG; idx = wgAWG)
Source: own estimation based on AWG growth (wg) forecasts
In the case of the self-employed, only a male contributor who declares 60% of the average
salary in the base year would not receive anything above the minimum pension.
Interestingly, the level of compensation for women and median contributors of both
genders is higher than the comparable margin for employees. Yet again, this might be
2015 2020 2025 2030 2035 2040 2045 2050 2055 20600
0.1
0.2
0.3
0.4
0.5
0.6
0.7
0.8
0.9
1
Years
AR in
% o
f ave
rage
sal
ary
median mmedian f3rd quart m3rd quart fminpen

Results
WORKING PAPER No. 145 91
5
87
explained by higher initial capital stocks and more consistent contribution history of
employees.
Figure 40: Adequacy ratio (AR) for male & female self-employed, FDC member; RA:
67m/67f, rFDC = 3%, in relation to minimum pension (idx = 20%gAWG; idx = wgAWG)
Source: own estimation based on AWG growth (wg) forecasts
In both analysed cases it seems that women, who are paid currently the lowest possible
salary, being employees or self-employed, may not have a motivation to pursue the longer
required working period. In the context of the partial old-age pension (POAP65) they might
be more motivated to apply for this form of early retirement compensation, since upon
statutory retirement age they would be compensated to the level of the minimum
pension. The possibility to get POAP+TCOAP is conditioned by the documented working
experience (sufficient number of contributory and non-contributory years) but not by the
amount of collected notional capital. Therefore, the lower the notional capital and the FDC
stock would be, the stronger the motivation might be to apply for the POAP&TCOAP
without reduction of the final old-age pension, compensated by the state to the minimum
level.
65 See Legal framework
2015 2020 2025 2030 2035 2040 2045 2050 2055 20600
0.1
0.2
0.3
0.4
0.5
0.6
0.7
Years
AR in
% o
f ave
rage
sal
ary
median mmedian f3rd quart m3rd quart fminpen

Results
N a t i o n a l B a n k o f P o l a n d92
5
88
The full wage growth indexation of pensions would keep the minimum guaranteed
pension at the same adequacy ratio level of around 22% (upon and after retirement).
However, a full wage indexation of the minimum pension may act in a quite demotivating
way on certain groups due to the generosity trap effect. For instance, if the minimum
possible income level declared by self-employed or employees is insufficient to guarantee
a pension level above the minimum pension level, then the motivation to declare any
extra income shrinks. According to our findings, the compensation to the minimum level
range from 20% (minimum salary employees)66 to even 40% (self-employed, who declare
60% of the average salary). Such scenario would move the equilibrium point closer to the
individual pensioner perspective, but may put some pressure on public finances.67 The
perspective of public finance managers would be to minimize the compensation to the
minimum pension level. Preferably, the stock of the NDC and FDC accounts upon
retirement should be exactly sufficient for the minimum pension level. So far, our study
may conclude that such condition is not met by the legal rules for the self-employed
contributors, if the indexation of 100% is applied.
5.3.4.2 Comparison with the adequacy of the miners’ pension scheme
Finally, we follow with Figure 41 which depicts a relation of the employees adequacy ratio
in reference to the minimum pension levels, but additionally enriched by the reference to
the expected miners’ adequacy ratio assuming a full wage growth indexation of their
pensions. The over 90% adequacy ratio, observed currently would be responsible for the
significant sustainability gap of 19%, showed in Figure 24. This is not a surprise, since in
our scenario we prolong the existing rules for miners, and continue to project their current
retirement behaviours: retirement at age of 45-50 and - compared with employees - very
high adequacy ratio. An ordinary employee, who retires at the age of 67 earning the
average salary may count on 35% of this amount, while a miner would be entitled to over
90% of this amount, but paid upon retirement at the age of e.g. 47 (median). There are
employees who work in relatively comparable harsh conditions, but if they aim at 90%
66 Computed as a ratio between the amounts actually recorded in NDC&FDC scheme (18% for employees and 13-15% for the self-employed) and the 22% replacement rate of the minimum pension. 67 In this study we are not estimating the impact of an increasing number of minimum pensioners on aggregate expenditures. This analysis should be carried out in future surveys.
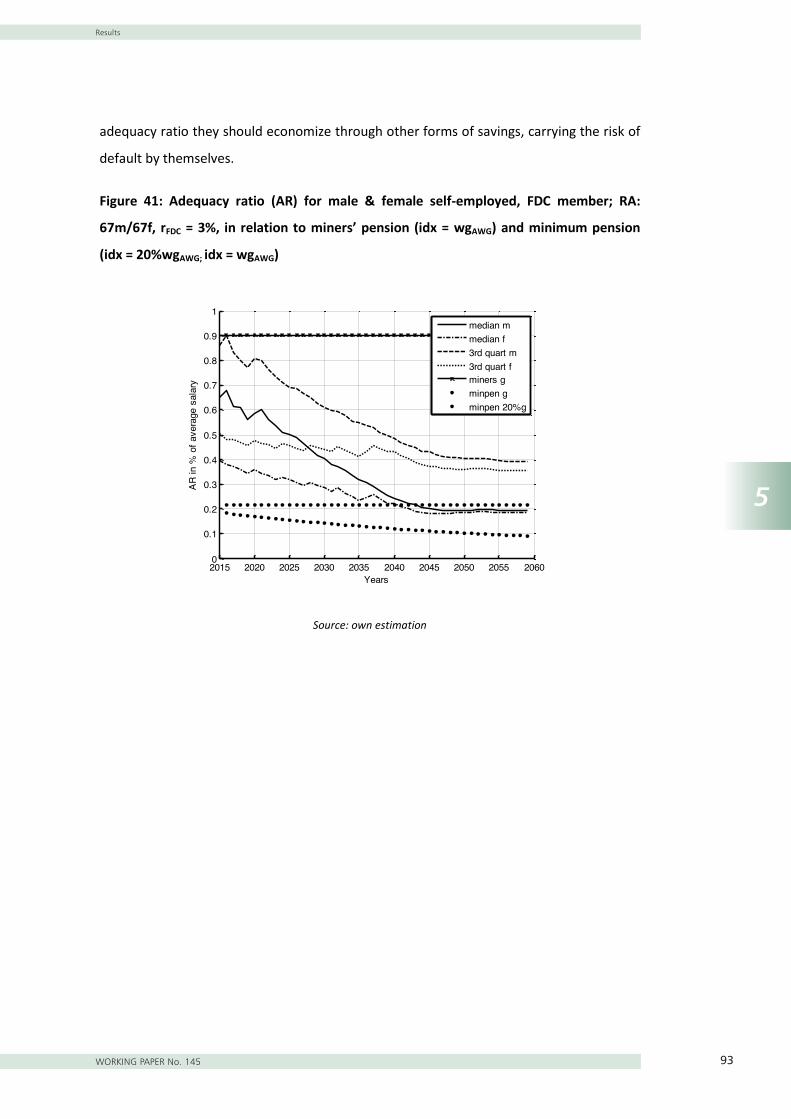
Results
WORKING PAPER No. 145 93
5
89
adequacy ratio they should economize through other forms of savings, carrying the risk of
default by themselves.
Figure 41: Adequacy ratio (AR) for male & female self-employed, FDC member; RA:
67m/67f, rFDC = 3%, in relation to miners’ pension (idx = wgAWG) and minimum pension
(idx = 20%wgAWG; idx = wgAWG)
Source: own estimation
2015 2020 2025 2030 2035 2040 2045 2050 2055 20600
0.1
0.2
0.3
0.4
0.5
0.6
0.7
0.8
0.9
1
Years
AR in
% o
f ave
rage
sal
ary
median mmedian f3rd quart m3rd quart fminers gminpen gminpen 20%g

Conclusions and outlook
N a t i o n a l B a n k o f P o l a n d94
6
90
6 Conclusions and outlook
Until 2060 Poland faces one of the most rapid population ageing process in the entire EU.
In light of this development the Polish government adopted a profound reform of the
public pension landscape and introduced a new two pillar system in 1999: a mandatory
funded pension pillar (FDC) and an unfunded pension pillar (NDC), both based on a
(notional) defined contribution formula. After a decade of only minor pension reforms,
two significant changes of the public pension system were adopted in the last two years:
1) a cut of contributions paid to FDC, called here the FDC cut reform and 2) a gradual
increase in the statutory retirement age to 67 for both men and women, referred here
briefly as 67RA. The aim of this paper was to evaluate these recent changes of the Polish
public pension system from three perspectives: 1) fiscal long-term stability, 2)
intergenerational redistribution and 3) adequacy of future pension benefits. The main
conclusions are as follows:
Fiscal long-term stability: In 2010 the ZUS old-age fund runs a deficit of about 3.6% of
GDP. Without the consideration of the FDC cut and the increase in retirement ages this
mismatch would have remained considerable over the next decades.
Both the cut in FDC contributions as well as the increase in retirement ages considerably
reduce the deficit of the ZUS old-age fund in the next decades. The most considerable
impact on cash balances can be observed in the period from 2012 to 2040. In these years
the deficit will be on average 1.3% of GDP lower than in a scenario without these two
reforms. From a fiscal perspective, the timing of the reforms is well chosen. They take
effect in a period with relatively high fiscal pressure as large cohorts born around 1960 will
enter into retirement.
Besides cash balance figures also the indicator of the sustainability gap shows an
improvement of the fiscal long-term stability of the ZUS pension fund via the two recent
pension reforms. The sustainability gap, representing the discounted sum of future
deficits, shrinks considerably from a level of 86.3 to 41.2% of GDP. About half of the
remaining sustainability gap is caused by the relatively generous design of the miners’
pension system – which has been so far untouched by recent reforms.

Conclusions and outlook
WORKING PAPER No. 145 95
6
91
Intergenerational redistribution: The cut of FDC contributions as well as the increase in
retirement ages show no major intergenerational redistribution effects. In other words,
the burden of the recently legislated reforms is shared equally across generations. The
NDC pension system is based on the notion of equivalence. Accordingly, a rise of
contributions to the NDC system, whether caused by the shift of FDC contributions or by
the increase in retirement ages, is translated proportionally into higher pension benefits.
As a consequence, the net-lifecycle payments (i.e. generational accounts), are almost
unaffected by the two recently adopted reforms.
Adequacy: For the analysis of adequacy we applied the so called adequacy ratios which
reflect the initial pension level relative to the average wage in the economy. We showed
that adequacy ratio will considerably drop in future decades. Without the two recent
reforms an employee earning the average salary68 in the economy may count on an
adequacy ratio of around 85% for men and 63% for women in 2015. This ratio would
gradually decrease to a level of 35% and 25% respectively in 2040. Employees, who
declare a minimum salary can expect an adequacy ratio of around 60% for men and 40%
for women in 2015, dropping steadily to 13% for women and 17% for men until 2040.
Nearly 75% of self-employed persons declare currently an income amounting up to 60% of
the average salary (the lowest allowed by law for the self-employed). This rather low
contribution basis translates into adequacy ratios of 10-13% for baby-boomers born after
1980 (retiring around 2040).
Three factors determine the future drop of adequacy ratios over the next decades. Half of
the reduction can be explained by the automatic adjustment of the NDC benefit formula to
demographic changes. Namely 1) the expected increase in the life expectancy and 2) the
shrinking of the working population will lead via the benefit formula to pension
reductions. The other half of the drop of future pension benefits can be traced back to 3)
changes of the contribution history. Increasing unemployment periods and very low
declared earnings translate into rather low pension levels in the future. This result is
important than discussing measures to increase future adequacy ratios.
68 3rd quartile of contributions paid by employees, see Figure 5.

Conclusions and outlook
N a t i o n a l B a n k o f P o l a n d96
6
92
The shift of contributions from the FDC to the NDC does not affect individuals who
participate only in the NDC system. Participants of the FDC systems can, however, expect a
slight decrease in the adequacy ratios. The reason lies in the internal rate of return, which
will most likely be lower in the NDC than in the FDC system since the NDC rate of return
will decrease in line with the ageing population.
The increase in retirement ages to 67 for both men and women considerably raises
adequacy ratios. Male employees, participating in the FDC system and retiring in 2040 e.g.
may count on an increase from 35% to 40% if they currently pay contributions based on
the average salary in the economy. Male minimum salary earners can expect an increase
in adequacy ratios from 17% to 20%. For women the retirement age will be increased from
60 to 67. Consequently, the rise of adequacy ratios is more considerable than for men.
Average salary female earners may count on an increase from 25% to around 37% of the
future average salary in 2040. Self-employed men, who declared the lowest possible
income may count on extra 2 pp (from 13 to 15%) after having worked longer by 2 years
(from 65 to 67). Self-employed women, with extra 7 years added to their careers, would
have the adequacy raised by around 5 pp. to 15 % for all cohorts, if they declare an income
of around 60% of the average salary in the base year. The modest adequacy ratio of self-
employed – even after the increase of retirement ages should be a point for consideration
for decision makers, pensioners and academics.
In 2010 1% of new old-age ZUS pensioners fell below the minimum pension threshold. If
the current distribution of contributions (salaries) continues, between 25% and 50% of all
future pensioners will receive only a minimum pension in 2060. The increase in retirement
ages to 67 is reflected in this calculation. The proportion of future minimum pensioners
depends greatly on the indexation of the minimum pension. In this study we took two
margins for indexation: 20% and 100% of the average salary growth. With the latter
indexation the minimum pension would remain at the level of around 22% of average
wages in the economy. By contrast, an indexation of 20% would lead to a steady decrease
in the minimum pension level from 22% to 9% of the average wage until 2060. According
to our findings, all individuals, who declare less than 60% of the average salary in the
economy will be paid a minimum pension, if it is indexed with full wage growth.
Additionally, in this high-end scenario, the bill incurred by the public sector paying out

Conclusions and outlook
WORKING PAPER No. 145 97
6
93
compensation up to the level of the minimum pension will be relatively high: almost all the
self-employed and all minimum-salary employees would be entitled to get the
compensation. If the lowest possible indexation was applied (20% of the real wage
growth), 75% of the self-employed would be entitled only to the minimum pension,
without a significant compensation.
Our study showed that the main challenge ahead lies in the adequacy of future pension
benefits. In particular, the group of the self-employed can expect very low benefits in the
future. Different key issues can be identified in order to mitigate the rise of old age
poverty without triggering a major negative effect on our three perspectives:
- We identified that about half of the future drop of benefit levels is due to changed
contribution/employment histories. Against this background, policy makers should
focus on labour market and education measures to decrease long-term
unemployment and enhance employment, in particular at younger and older ages.
Such measures can considerably increase future pension benefit levels.
- The lowest possible income declared by self-employed (60% of average salary) should
be raised for higher earning groups. For example, self-employed who earn above 100%
of the average monthly salary should declare higher earnings as the contribution basis.
This measure would reduce future minimum pension compensations.
- A continuation of the 20% indexation of the minimum old-age pension until 2060
seems unrealistic. This would lead to a steady decrease in the minimum pension level
from 22% to 9% of the average wage until 2060. Policy makers should therefore
consider a change of the indexation rules and evaluate possible consequences (higher
compensations, lower contribution incentives, etc.).
- Current contributors should be broadly informed about their future expected pension
benefit levels. Similar to the German statutory pension system such pension
information should be provided on a regular basis. Individuals may then accumulate
early enough additional private savings to finance adequate retirement.
Finally, we draw attention to the gap in adequacy ratios between the miners’ pension
scheme and the NDC/FDC pension system. An ordinary employee, who retires at the age
of 67, and has been earning an average salary in the economy may count on 35% of this
amount, while a miner would be entitled to 90% of this amount, but paid upon retirement

Sensitivity Analysis
N a t i o n a l B a n k o f P o l a n d98 94
at the age of e.g. 47 (median). Whether miners’ harsh working conditions provide a
sufficient argument for this large pension gap is questionable.
95
Sensitivity Analysis
In Figure 42 and Figure 43 a constant interest rate for NDC1 and NDC2 is applied,
amounting to its initial value from the base year. Comparing to Figure 33 and Figure 35 the
AR steadily grows, which, not surprising, may serve as evidence for the positive effect of a
longer career path on the AR, if the high interest rate was applied. Growing AR at the end
of the forecast can be explained by the significant difference between the growth rate at
that time and much higher interest rate from the base year.
Figure 42: Adequacy ratio (AR) for female employee, FDC member; RA: 60f/67f, rFDC =
3%, wg = AWG (constant overtime from a base year)
Source: own estimation
2015 2020 2025 2030 2035 2040 2045 2050 2055 20600.1
0.15
0.2
0.25
0.3
0.35
0.4
0.45
0.5
Years
AR in
% o
f ave
rage
sal
ary
median 67median 603rd quart 673rd quart 60

Sensitivity Analysis
WORKING PAPER No. 145 9996
Figure 43: Adequacy ratio (AR) for male employee, FDC member; RA: 65m/67m, rFDC =
3%, wg = AWG (constant overtime from a base year)
Source: own estimation
Consequently, we follow with sensitivity analysis for life expectancy (LE), which, in Figure
44 and Figure 45, show a scenario of constant LE taken from the base year. Especially in
the case of women such a scenario, coupled with the 67RA condition would guarantee an
almost unchanged AR for female employees who declare average salaries in the economy
(3rd quartile).
2015 2020 2025 2030 2035 2040 2045 2050 2055 20600.1
0.2
0.3
0.4
0.5
0.6
0.7
0.8
0.9
Years
AR in
% o
f ave
rage
sal
ary
median 67median 653rd quart 673rd quart 65

Sensitivity Analysis
N a t i o n a l B a n k o f P o l a n d100 97
Figure 44: Adequacy ratio (AR) for female employee, FDC member; RA: 60f/67f, rFDC =
3%, wg = AWG (LE constant overtime from a base year)
Source: own estimation Figure 45: Adequacy ratio (AR) for male employee, FDC member; RA: 65m/67m, rFDC =
3%, wg = AWG (LE constant overtime from a base year)
Source: own estimation
2015 2020 2025 2030 2035 2040 2045 2050 2055 2060
0.2
0.25
0.3
0.35
0.4
0.45
0.5
0.55
0.6
0.65
Years
AR in
% o
f ave
rage
sal
ary
median 67median 603rd quart 673rd quart 60
2015 2020 2025 2030 2035 2040 2045 2050 2055 20600.2
0.3
0.4
0.5
0.6
0.7
0.8
0.9
1
Years
AR in
% o
f ave
rage
sal
ary
median 67median 653rd quart 673rd quart 65

References
WORKING PAPER No. 145 10198
References
Auerbach, Alan A., Jagadish Gokhale und Laurence J. Kotlikoff (1994): Generational
Accounts: a meaningful way to evaluate fiscal policy. Journal of Economic Perspectives. 8,
73–94.
Auerbach, Alan A., Jagadish Gokhale, und Laurence J. Kotlikoff (1992): Generational
Accounting: A New Approach to Understand the Effects of Fiscal Policy on Saving.
Scandinavian Journal of Economics. 94, 303–318.
Auerbach, Alan A., Jagadish Gokhale und Laurence J. Kotlikoff (1991): Generational
Accounts: a meaningful alternative to deficit accounting. Tax policy and the economy. 5,
55–110.
Benz, U. and S. Fetzer (2006), Indicators for Measuring Fiscal sustainability: A Comparison
of the OECD Method and Generational Accounting, FinanzArchiv, 62 (3), 367-391.
Bielecki, J.K. (2011), “Pension system reforms in CEE – example of Poland”, presentation at
the workshop “Pension systems in emerging Europe: Reform in the age of austerity”
organised by the EBRD, 1 April,
http://www.ebrd.com/downloads/research/news/Session_I_Bielecki.pdf
Chlon-Dominczak, A. and Góra, M. (2006), The NDC System in Poland: Assessment after
five years; in: Holzmann, Robert and Palmer, Edward, Pension Reform – Issues and
Prospects for Non-Financial Defined Contribution (NDC) Schemes; p. 425– 447, World
Bank, Washington.
CSO - Central Statistical Office (2007), Structure of wages and salaries by occupations in
October 2006, Warsaw.
Dach Z., Bezrobocie w okresie przemian systemowych gospodarki polskiej, Ossolineum,
Wrocław, Kraków 1993.
Fetzer, S. (2006), Zur nachhaltigen Finanzierung des gesetzlichen Gesundheitssystems,
Frankfurt.
EC - European Commission (2007), Pension Schemes and Projection Models in EU-25
Member States; in: European Economy Occasional Papers, 35.

References
N a t i o n a l B a n k o f P o l a n d102 99
EC - European Commission and Economic Policy Committee (2011), The 2012 Ageing
Report: Underlying Assumptions and Projection Methodologies, European Economy 4,
Brussels.
EC - European Commission and Economic Policy Committee (2012), The 2012 Ageing
Report: Economic and budgetary projections for the EU27 Member States (2010-2060),
European Economy, Brussels.
Egert, B. (2012), The Impact of Changes in Second Pension Pillars on Public Finances in
central and Eastern Europe, CESifo Working Paper No. 3801.
Hagist, C. (2008), Demography and Social Health Insurance: An International Comparison
Using Generational Accounting, Baden-Baden: Nomos.
ISG - Indicator Sub-Group of the Social Protection Committee (2009), Updates of Current
and Prospective Theoretical Pension Replacement Rates 2006-2046.
Jablonowski, J, Müller, C. and Bernd Raffelhüschen (2011), A fiscal outlook for Poland using
Generational Accounts, National Bank of Poland Working Papers, 85, Warsaw.
Jablonowski, J, Müller, C. and Bernd Raffelhüschen (2012), A long term-term evaluation of
the Polish disability system and its possible reform, Report developed under the Better
Government Programme for Ernst and Young, forthcoming.
Kempa, M. (2010), “Wpływ OFE na saldo Funduszu Emerytalnego”, Ministry of Finance in
Poland Working Paper Series, No. 07-2010, November.
Raffelhüschen, B. (1999), Generational Accounting: Method, Data, and Limitations,
European Economy, Reports and Studies, 6, 17-28.
ZUS (2012), Waloryzacja składki i kapitału początkowego:
http://www.zus.pl/default.asp?p=1&id=3416, 16.08.2012.
Annexes
WORKING PAPER No. 145 103100
Annex 1
This part is devoted to the remaining two groups of persons insured in ZUS, also divided by
gender and by type of job contract: but not participating in the FDC system. As stated in
the chapter on legal framework persons born between 1949 and 1969 could make a
choice whether to keep their all pension contributions in the NDC system (or to have them
split between NDC and FDC schemes). Further to the order set in the main part of the
description devoted to FDC members, we bring here first the analyses of the adequacy of
employees and the self-employed in gender specific division. Then we compare employees
and the self-employed for the same gender. Next we follow with a similar breakdown of
results in the scenario of the retirement age raised gradually to 67 years.
Adequacy for non-FDC members: status quo
Employees
Since non-FDC members, employed or self-employed, were born between 1949 and 1969,
so the forecast is limited to year 2035, when the last 65 year old male, born in 1969,
retires. The median non-FDC employed woman may count on around 20% while a
respective male representative on 25% of the then average gross salary in the economy,
gradually dropping to 4% in 2027 (women) and 6% in 2030 (men).69 This is clearly 5 pp. less
than for an FDC member. Also 3rd quartile figures are slightly lower: 40% for men and 32%
for women. The spread of adequacy between genders is smaller than in the case of FDC
members, which may be explained by higher initial capital figures and higher contributions
paid by women than by men among non-FDC employees.
69 The far right values might be misleading due to the fact that the sample for 1964-1969 birth year cohorts for non-FDC members was very small and had a high share of unemployed persons.

Annexes
N a t i o n a l B a n k o f P o l a n d104 101
Figure 46: Adequacy ratio (AR) for female & male employee, non FDC member; RA:
60f/65m, rFDC = 3%, wg = AWG
Source: own calculations.
Self-employed
To get an almost complete picture we will check the already presented observations and
references for the projection regarding self-employed non-FDC contributors – highly
biased by unemployed persons. Figure 47 shows that the median is almost unobserved,
and the 3rd quartile contributors may look forward to adequacy ratios of around 12%,
comparable to those of self-employed FDC members who declared 60% of the average
salary. The level of pension adequacy for this group drops sharply, which stems from the
high pollution of this group by individuals with short careers abounding with long
registered unemployment periods.
2015 2020 2025 2030 20350
0.1
0.2
0.3
0.4
0.5
0.6
0.7
0.8
Years
AR in
% o
f ave
rage
sal
ary
median mmedian f3rd quart m3rd quart f

Annexes
WORKING PAPER No. 145 105102
Figure 47: Adequacy ratio (AR) for female & male self-employed, non FDC member; RA:
60f/65m, rFDC = 3%, wg = AWG
Source: own calculations.
Adequacy for non-FDC members: 67RA
Non-FDC employees, women
The rise in the retirement age influences to a slightly lesser extent non-FDC female
employees. However, the impact is still positive for the third quartile (earnings between 60
and 100% of the average salary), as shown in the Figure 48 below. The highest values
(around 35%) seem more representative, as cohorts born between 1966 and 1968 were
less representative and abounding in short employment paths and unemployed
individuals.
2015 2020 2025 2030 20350
0.05
0.1
0.15
0.2
0.25
0.3
0.35
0.4
0.45
Years
AR in
% o
f ave
rage
sal
ary
median mmedian f3rd quart m3rd quart f

Annexes
N a t i o n a l B a n k o f P o l a n d106 103
Figure 48: Adequacy ratio (AR) for female employee, non FDC member; RA: 60f/67f, rFDC
= 3%, wg = AWG
Source: own calculations.
Non-FDC employees, men Figure 49, for non-FDC male employees confirms even more
visibly the above-mentioned findings: both analysed measures increase by 5 pp.
Figure 49: Adequacy ratio (AR) for male employee, non FDC member; RA: 65m/67m, rFDC
= 3%, wg = AWG
Source: own calculations.
2015 2020 2025 2030 20350.05
0.1
0.15
0.2
0.25
0.3
0.35
0.4
0.45
0.5
Years
AR in
% o
f ave
rage
sal
ary
median 67median 603rd quart 673rd quart 60
2014 2016 2018 2020 2022 2024 2026 2028 2030 2032 20340
0.1
0.2
0.3
0.4
0.5
0.6
0.7
0.8
0.9
Years
AR in
% o
f ave
rage
sal
ary
median 67median 653rd quart 673rd quart 65

Annexes
WORKING PAPER No. 145 107104
Figure 50: Adequacy ratio (AR) for male & female employee, non FDC member; RA:
67m/67f, rFDC = 3%, in relation to minimum pension (idx = 20%gAWG; idx = gAWG)
Source: own calculations
2015 2020 2025 2030 20350
0.1
0.2
0.3
0.4
0.5
0.6
0.7
0.8
Years
AR in
% o
f ave
rage
sal
ary
median mmedian f3rd quart m3rd quart fminpen

Annexes
N a t i o n a l B a n k o f P o l a n d108 105
Annex 2
Input data
Annex 2 provides further insight into the input data used in the study to compute results
for all three perspectives. In this study we analyse the forecasts based on two datasets
provided by the ZUS:
1) The cohort covered averages (e.g. pension contributions or benefits) for single
year cohorts, age and gender specific for average contributions or benefits.
2) The raw 1% sample from the ZUS database, dated January 2011 consisting of 250
thousand men and women who are registered in the ZUS database. The original
dataset provides a full description of the records reported to the ZUS, including
the age, gender, full monthly career paths from 1999 until 2011, the initial capital,
gross declared incomes, NDC and FDC contributions, code of the professional
occupation, regional coordinates, NACE category of the employer and also
information on e.g. benefits paid by the ZUS to a given individual.
The most detailed description refers to the data used for the first time: the 1% ‘raw’
sample from the ZUS database. It was used mainly in the part devoted to adequacy
measures. We believe that good source data description may be valuable to better
understand the outcomes presented in the Results chapter.
Filter for the 1% sample: removing empty accounts
The original database covered monthly figures of pension contributions’ history in years
1999-2011, but also net income and healthcare contributions data – and for both types of
data unidentifiable IDs were earmarked. In Poland actually all citizens are insured in the
healthcare system, so the number of IDs significantly exceeded the number of non-zero
pension accounts. Obviously, the IDs used in the 1% sample were created also for the
purposes of pension contribution collection and for healthcare system registration (ZUS
intermediates in the transfer of healthcare contributions from the tax payers to the
National Healthcare Fund). In consequence, the list of IDs provided in the 1% sample
covered also IDs of persons who do not contribute to the ZUS pension fund, because they
are e.g. farmers insured in another pension system. For such persons the only variable

Annexes
WORKING PAPER No. 145 109106
available in the sample was their ID. Therefore, the inclusion of these empty IDs would
have heavily increased the error margin. In certain cohorts these empty IDs amount to
40%, with almost 70% in very young and very old cohorts. In these extreme cases there
might have been many other causes of the high number of empty IDs: the period of
studies, emigration, death and retirement. The actual input data was therefore selected
from the available original data source using a filter whose aim was to eliminate empty IDs
that corresponded to records with no positive entries throughout entire professional
career paths between 1999 and 2011 and registered no initial capital.
Division of the micro data into 4 groups
The 1% filtered sample was divided into 4 groups:
Employees, members of the FDC,
Self-employed, members of the FDC,
Employees, not participating in the FDC,
Self-employed, not participating in the FDC,
The division between the employees and the self-employed was based on the
predominant type of job contract (‘code of the insurance entitlement’), observed through
the entire career path between 1999 and 2011. This approach varies from the approach
taken in the Labour Force Survey (LFS), where the predominant source of income in the
last year prevails. In consequence, the gradual migration from employment towards self-
employment, aiming at the reduction of the individual tax & contribution burden,
observed in recent years, may not be apparent in the distribution of our input data.
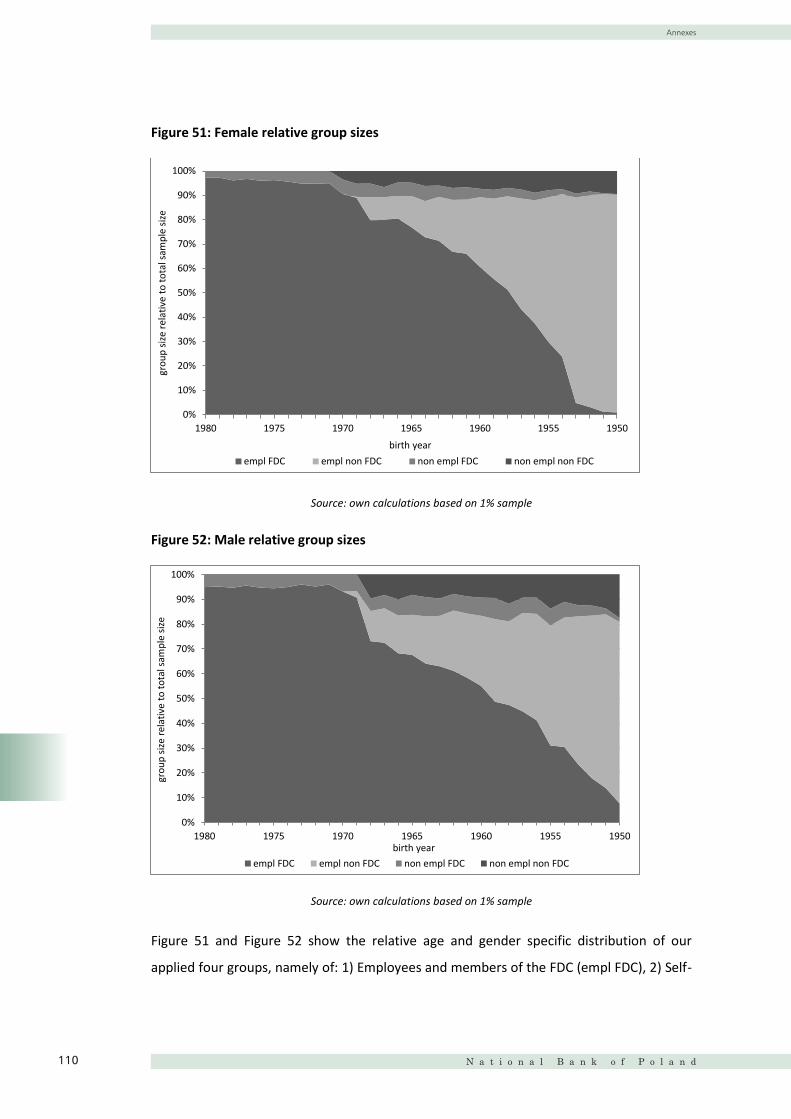
Annexes
N a t i o n a l B a n k o f P o l a n d110 107
Figure 51: Female relative group sizes
Source: own calculations based on 1% sample
Figure 52: Male relative group sizes
Source: own calculations based on 1% sample
Figure 51 and Figure 52 show the relative age and gender specific distribution of our
applied four groups, namely of: 1) Employees and members of the FDC (empl FDC), 2) Self-
0%
10%
20%
30%
40%
50%
60%
70%
80%
90%
100%
1980 1975 1970 1965 1960 1955 1950
grou
p siz
e re
lativ
e to
tota
l sam
ple
size
birth year empl FDC empl non FDC non empl FDC non empl non FDC
0%
10%
20%
30%
40%
50%
60%
70%
80%
90%
100%
1980 1975 1970 1965 1960 1955 1950
grou
p siz
e re
lativ
e to
tota
l sam
ple
size
birth year empl FDC empl non FDC non empl FDC non empl non FDC

Annexes
WORKING PAPER No. 145 111108
employed and members of the FDC (non empl non FDC), 3) Employees not participating in
the FDC (empl non FDC) and 4) the self-employed not participating in the FDC (non empl
non FDC). The following 4 graphs below show the number of representatives in each group
type, after filtering away the empty IDs. As expected, the most numerous group are
employees participating in the FDC system. The second largest group represents the
employed not participating in the FDC scheme, followed by groups of the self-employed
participating in the FDC and self-employed persons who decided not to participate in the
FDC scheme.
Figure 53: employees FDC Figure 54: self-employees FDC
Figure 55: employees non FDC Figure 56: self-employees non FDC
Source: own calculations based on 1% sample
Statistical distribution of the initial capital and pension contributions
Figure 57 below shows a very typical distribution of the initial capital for all individuals in
the base year 2010, in this case male employees born in 1961. The skyscraper bar on the
0
200
400
600
800
1000
1200
1400
1600
1800
1949
1951
1953
1955
1957
1959
1961
1963
1965
1967
1969
1971
1973
1975
1977
1979
1981
1983
1985
1987
1989
Num
ber o
f rep
rese
ntat
ives
Birth year
after filter f after filter m
0
20
40
60
80
100
120
140N
umbe
r of r
epre
sent
ativ
es
Birth year
after filter f after filter m
0
200
400
600
800
1000
1200
1400
1949
1950
1951
1952
1953
1954
1955
1956
1957
1958
1959
1960
1961
1962
1963
1964
1965
1966
1967
1968
1969
Num
ber o
f rep
rese
ntat
ives
Birth year after filter f after filter m
0
50
100
150
200
250
1949
1950
1951
1952
1953
1954
1955
1956
1957
1958
1959
1960
1961
1962
1963
1964
1965
1966
1967
1968
Num
ber o
f rep
rese
ntat
ives
Birth year
after filter f after filter m

Annexes
N a t i o n a l B a n k o f P o l a n d112 109
left represents those individuals, who have not had their IC computed, though they
registered some income within the 1999 - 2011 period. For older cohorts the zeros might
represent cases of death or retirement. For younger cohorts, born after 1980, the large
proportion of persons yet inactive on the labour market, e.g. students, may explain some
of the zeros. The graph shows a very good fit of the distribution of the initial capital to the
normal distribution, when the empty accounts from the base year are removed. The
explanation may lie in the initial capital computation formula (see (7)), very similar to the
‘old’ formula of the pension benefit. Not surprisingly, the older the analysed cohort is, the
better the fit becomes. There are a few factors that explain that fit: 1) the IC formula,
which limits the p (6) factor to 100% and takes into account the BCR based on the unified
BA (1999); 2) work experience time span, which is limited by the starting point (18 by
default), the actual age (persons born from 1949 to 1969) and the retirement age (60/65);
3) individual BCR, strongly dependent on the average salary in the economy, and finally 4)
one-for-all interest rate applied after 1999 (see Table 3).
Figure 57: Distribution of the initial capital of employed males born in 1961, fit to
normal distribution in case if empty records are removed, stock for January 2011
Source: own calculations
The 35% filter for the initial capital
The initial capital was filled in with empty records but actual data will certainly be filled in
when the missing individuals apply for the calculation of that value e.g. upon retirement.
Data provided by ZUS show that 8.7mln persons applied so far for initial capital
0 2 4 6 8 10 12 14 16
x 104
0
0.2
0.4
0.6
0.8
1
1.2
1.4
1.6
1.8
2x 10⁻⁵
Data
Dens
ity
IC 1961 m empl FDCnormal, no zeros

Annexes
WORKING PAPER No. 145 113110
computation. When we compare this value with potential70 overall number of ZUS
contributors born between 1949 and 1982, i.e. 11mln, we potentially get 34.5% of missing
data. For the purpose of this study we removed the lower 35% of initial capital for all
cohorts. In consequence, the filtered data show positive values for all analyzed quartiles in
older cohorts and some empty records in younger cohorts. As depicted in Figure 3 (initial
capital for employees), the values of the initial capital remaining in the filtered sample are
very similar for the 1st, 2nd and 3rd quartile. The consequences of application of the 35%
filter are described in details in chapter devoted to adequacy ratios.
The statistical distribution of the 1% sample data for pension contributions paid in the
base year 2010, after being filtered for empty accounts in all years as described above , fit
poorly the normal distribution, showing a very significant skewness (see Figure 58), caused
by a still very high number of zeros recorded in the gross income, pension contributions or
initial capital in 2010.
Figure 58: Distribution of the pension contributions of employed females born in 1971,
fitting to normal and lognormal distribution in case if empty records are removed, 2010
Source: own calculations
If the zero entries for pension contributions in the base year are removed (a ‘no zeros’
filter), the skewness is still apparent, especially for self-employed persons (see Figure 59),
for whom the median often represents the minimum amount of monthly contributions
70 Yet another method might have been applied to deal with the missing initial capital applicants, e.g. removal of all empty values. However, in this case the initial capital would have been by 20% higher for women than for men, and additionally, we would have assumed the same probability to work before 1999 for cohorts born in 1950 and in 1980, which seemed far too risky.
0 500 1000 1500 2000 2500 3000 3500 40000
0.5
1
1.5
2
2.5
x 10-3
Data
Dens
ity
av_pens_contr(12,:) datanormal, no zeroslognormal, no zeros

Annexes
N a t i o n a l B a n k o f P o l a n d114 111
allowed by legal regulations (for details see chapter 4.2.1.2 on pension contributions). The
distribution of pension contributions (NDC/FDC) and the gross income is quite similar for
all the remaining groups, irrespective of age, gender or the type of the job contract. A
larger number of zeros is visible in these cases, when the individuals entered the labour
market apparently late and at the same time have chosen self-employment – in these
cases, very typical for high-end ID numbers,71 in many cases the given persons was
unemployed during the entire span of his or her career in 1999-2011 without obtaining
entitlement to the unemployment benefit. The data selection filter, based on the above
described code of insurance entitlement, was the only criterion for data division. Analyses
revealed that the last of the four analysed groups (self-employed, non-FDC participants)
displays the highest share of structurally unemployed persons. For instance, compared
with the other three analysed groups, the share of persons who have less than two years
of working experience recorded in the 1999-2010 period reached 50% in some cohorts.
Figure 59: Distribution of the pension contributions of self-employed females born in
1967, fitting to normal and lognormal distributions, in case if empty records are
removed, 2010
Source: own calculations based on the 1% sample provided by ZUS
71 It seems like the high end IDs were created if an individual entered a labour market (or rather became officially insured) at a relatively old age, e.g. when 40+ years old.
0 500 1000 1500 20000
0.5
1
1.5
2
2.5
x 10-3
Data
Dens
ity
av_pens_contr(12,:) datanormal, no zeroslognormal, no zeros

Annexes
WORKING PAPER No. 145 115112
At this point the question arose around which variables does concentrate the majority of
contributions. The answer was quite simple, but it requires some initial background
explanation. In Poland the self-employed persons are allowed by law to declare only a part
of their actual income to pension contribution purposes. In principle, the lower monthly
bound (floor) is set at the level of 60% of the average salary in the economy, while
employees declare all their income for contribution purposes. The upper ceiling is
common for both groups and amounts to 250% (monthly) of the average monthly salary in
the economy. In other words, once a contributor reaches a gross annual income of 30
average salaries, the contributions are not collected from the remaining income.
In the group of employees special interest is shown in those employees who are paid the
administratively set lowest possible salary presented in the table below:
Table 4: development of the minimum salary levels
year min salary
minimum salary
pension contributions
2003 800 156
2004 824 161
2005 849 166
2006 899 176
2007 936 183
2008 1 126 220
2009 1 276 249
2010 1 317 257
2011 1 386 271
2012 1 500 293
Source: ZUS website and own calculations
In the group of the self-employed, special focus is given to those earning 60% of the average salary in the economy. For detailed exact amounts in a given particular year see Table 5 below:

Annexes
N a t i o n a l B a n k o f P o l a n d116 113
Table 5: Development of the contribution ceiling and a minimum possible basis for the
pension contribution purposes for self-employed
year
30 times average salary in the
economy: the amount of the
annual limit of the basis for the
pension contribution calculation
in PLN
average salary in the
economy
60% of the
average salary
in the
economy
self-employed
monthly pension
contribution limit,
floor
1999 50 375 1 679 1 008 197
2000 54 780 1 826 1 096 214
2001 62 940 2 098 1 259 246
2002 64 620 2 154 1 292 252
2003 65 850 2 195 1 317 257
2004 68 700 2 290 1 374 268
2005 72 690 2 423 1 454 284
2006 73 560 2 452 1 471 287
2007 78 480 2 616 1 570 306
2008 85 290 2 843 1 706 333
2009 95 790 3 193 1 916 374
2010 94 380 3 146 1 888 368
2011 100 770 3 359 2 015 393
2012 105 780 3 526 2 116 413
Source: ZUS website and own calculations
If employees, especially the young ones, born after 1980, pay PLN 257 of monthly
contributions, it means that they are hired for the minimum salary. Consequently, if the
self-employed individuals declare the lowest possible income for pension contribution
purposes, then the amount of PLN 368 will be very prominent in the data for self-
employed persons. Indeed, both amounts are highly representative in the 1% sample data,
as depicted in Figure 5 and Figure 6.
* * *
We may conclude this part as follows:
1. The IC computation formula (7) relies partly on individualised variables, and partly on
administratively fixed parameters. With comparable input data inserted into the IC

Annexes
WORKING PAPER No. 145 117114
formula regarding individual career paths (in terms of length and salary level), women
get higher theoretical IC values until p reaches the 100% margin. This is due to a lower
denominator in the social part of the p coefficient, resulting from administratively
fixed indicators that are less demanding for women: lower (60w/65m), and
smaller required number of contributory and non-contributory periods
(20w/25m). And last, but not least, actual higher women’s LE is lowered by the unisex
life expectancy.
2. The IC formula, in terms of individual career path variables, is more fragile to the
number of (especially) contributory and non-contributory periods rather than the
relation of annual salaries to the average salary in the economy (IBCR). The
comparable percentage increase/decrease in these input variables, checked
separately, results in higher changes of the IC due to the number of contributory
periods.
3. The actual IC data suggest that the privileged formula does not eliminate the
difference between genders in terms of labour activity before the 1999 reform. As
depicted in e.g. Figure 3, men’s ICs are higher than those of women, for all cohorts
born up to 1970. Our findings confirm the observation present in the literature that at
these times men earned more than women or stayed longer on the labour market.
4. After the gradual liberalisation of the economic activity implemented after 1999,
much larger variety of possibilities to limit the declared income was put in place. It
allowed to lower the direct fiscal burden imposed by the state on the gross income.
Apparently, with time, more and more individuals declare the lowest allowed declared
income to increase the disposable one.
5. It is uncertain if a large number of individuals who did not declare any income in the
base year but paid some contributions in the previous years (see high number of zeros
in Figure 58 & Figure 59), is due to the fact that the source data may be of poor quality
or these persons were actually inactive on the labour market or were insured through
other types of insurance (e.g. farmers, uniformed services).
Computation data for non-FDC members (employees and the self-employed)
In this part we take a look at non-FDC members, employed and self-employed. The
representatives of these groups were born between 1949 and 1969 and had the choice to

Annexes
N a t i o n a l B a n k o f P o l a n d118
116
Figure 60: non FDC employees initial capital, January 2011, PLN
Source: 1% sample provided by the ZUS
As depicted in the Figure 3 & Figure 5 compared with Figure 60 and Figure 62, there is no
significant difference in the career paths between employees being FDC or non-FDC
members before 1999. Regarding gender analyses, the 3rd quartile shows higher values
than FDC participants throughout the entire analysed age span for women. Also the
outliers (2 standard deviations distance from the average) are higher for women than for
men. Additionally, women born after 1961 who do not participate in the FDC system
record increasingly higher average initial capital values than men. The presented figures
for the initial capital were trimmed by a filter which removed the lower 35% of (empty)
data. Nevertheless, one must also bear in mind that there is a some significant number of
individuals who have not had their IC computed yet.
0
100 000
200 000
300 000
400 000
500 000
600 000
700 000
1949 1950 1951 1952 1953 1954 1955 1956 1957 1958 1959 1960 1961 1962 1963 1964 1965 1966 1967 1968
Initi
al c
apita
l in
PLN
Birth years
median f median m 3rd quartile f 3rd quartile m 97.5% f 97.5% m
115
have their old-age contributions split between NDC and FDC or recorded entirely only on
the NDC account. In principle, both analysed groups as well as both genders who decided
to stay outside the FDC scheme registered comparable, though slightly lower, amounts of
the initial capital and pension contributions when compared with the respective FDC
members.
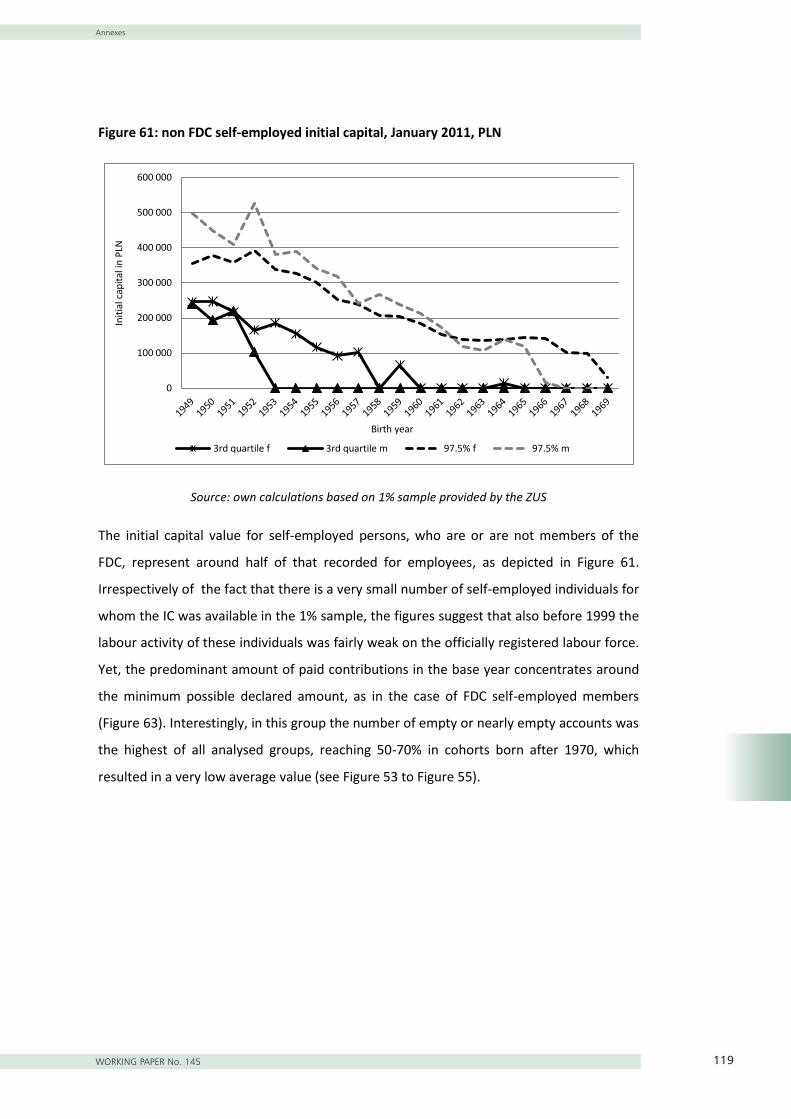
Annexes
WORKING PAPER No. 145 119117
Figure 61: non FDC self-employed initial capital, January 2011, PLN
Source: own calculations based on 1% sample provided by the ZUS
The initial capital value for self-employed persons, who are or are not members of the
FDC, represent around half of that recorded for employees, as depicted in Figure 61.
Irrespectively of the fact that there is a very small number of self-employed individuals for
whom the IC was available in the 1% sample, the figures suggest that also before 1999 the
labour activity of these individuals was fairly weak on the officially registered labour force.
Yet, the predominant amount of paid contributions in the base year concentrates around
the minimum possible declared amount, as in the case of FDC self-employed members
(Figure 63). Interestingly, in this group the number of empty or nearly empty accounts was
the highest of all analysed groups, reaching 50-70% in cohorts born after 1970, which
resulted in a very low average value (see Figure 53 to Figure 55).
0
100 000
200 000
300 000
400 000
500 000
600 000
Initi
al c
apita
l in
PLN
Birth year
3rd quartile f 3rd quartile m 97.5% f 97.5% m

Annexes
N a t i o n a l B a n k o f P o l a n d120 118
Figure 62: employees non FDC members, pension contributions in 2010, PLN
Source: own calculations based on 1% sample provided by the ZUS
Figure 63: non employees non FDC members, pension contributions (NDC only), 2010,
PLN
Source: own calculations based on 1% sample provided by the ZUS
0
500
1000
1500
2000
2500
1949 1950 1951 1952 1953 1954 1955 1956 1957 1958 1959 1960 1961 1962 1963 1964 1965 1966 1967 1968 1969 1970
Mon
thly
pen
sion
cont
ribut
ions
in P
LN
Birth year
av f av m min salary 60% floor median fmedian m 3rd quartile f 3rd quartile m 97.5% f 97.5% m
0
100
200
300
400
500
600
700
800
mon
thly
pen
sion
cont
ribut
ions
, PLN
Birth year av f av m 60% floor 97.5% f 97.5% m

Annexes
WORKING PAPER No. 145 121119
Annex 3
Table 6: Birth date, age required to retire, and expected earliest date of retirement72 for
women
birthdate from to age in years/months retirement
date from To
31-12-1953 60 0 01-01-2013
01-01-1953 31-03-1953 60 1 01-02-2013 30-04-2013
01-04-1953 30-06-1953 60 2 01-06-2013 31-08-2013
01-07-1953 30-09-1953 60 3 01-10-2013 31-12-2013
01-10-1953 31-12-1953 60 4 01-02-2014 30-04-2014
01-01-1954 31-03-1954 60 5 01-06-2014 31-08-2014
01-04-1954 30-06-1954 60 6 01-10-2014 31-12-2014
01-07-1954 30-09-1954 60 7 01-02-2015 30-04-2015
01-10-1954 31-12-1954 60 8 01-06-2015 31-08-2015
01-01-1955 31-03-1955 60 9 01-10-2015 31-12-2015
01-04-1955 30-06-1955 60 10 01-02-2016 30-04-2016
01-07-1955 30-09-1955 60 11 01-06-2016 31-08-2016
01-10-1955 31-12-1955 61 0 01-10-2016 31-12-2016
01-01-1956 31-03-1956 61 1 01-02-2017 30-04-2017
01-04-1956 30-06-1956 61 2 01-06-2017 31-08-2017
01-07-1956 30-09-1956 61 3 01-10-2017 31-12-2017
01-10-1956 31-12-1956 61 4 01-02-2018 30-04-2018
01-01-1957 31-03-1957 61 5 01-06-2018 31-08-2018
01-04-1957 30-06-1957 61 6 01-10-2018 31-12-2018
01-07-1957 30-09-1957 61 7 01-02-2019 30-04-2019
01-10-1957 31-12-1957 61 8 01-06-2019 31-08-2019
01-01-1958 31-03-1958 61 9 01-10-2019 31-12-2019
01-04-1958 30-06-1958 61 10 01-02-2020 30-04-2020
01-07-1958 30-09-1958 61 11 01-06-2020 31-08-2020
01-10-1958 31-12-1958 62 0 01-10-2020 31-12-2020
72 Dark grey cells refer to female cohorts which may apply for the partial old-age pension (POAP)

Annexes
N a t i o n a l B a n k o f P o l a n d122 120
01-01-1959 31-03-1959 62 1 01-02-2021 30-04-2021
01-04-1959 30-06-1959 62 2 01-06-2021 31-08-2021
01-07-1959 30-09-1959 62 3 01-10-2021 31-12-2021
01-10-1959 31-12-1959 62 4 01-02-2022 30-04-2022
01-01-1960 31-03-1960 62 5 01-06-2022 31-08-2022
01-04-1960 30-06-1960 62 6 01-10-2022 31-12-2022
01-07-1960 30-09-1960 62 7 01-02-2023 30-04-2023
01-10-1960 31-12-1960 62 8 01-06-2023 31-08-2023
01-01-1961 31-03-1961 62 9 01-10-2023 31-12-2023
01-04-1961 30-06-1961 62 10 01-02-2024 30-04-2024
01-07-1961 30-09-1961 62 11 01-06-2024 31-08-2024
01-10-1961 31-12-1961 63 0 01-10-2024 31-12-2024
01-01-1962 31-03-1962 63 1 01-02-2025 30-04-2025
01-04-1962 30-06-1962 63 2 01-06-2025 31-08-2025
01-07-1962 30-09-1962 63 3 01-10-2025 31-12-2025
01-10-1962 31-12-1962 63 4 01-02-2026 30-04-2026
01-01-1963 31-03-1963 63 5 01-06-2026 31-08-2026
01-04-1963 30-06-1963 63 6 01-10-2026 31-12-2026
01-07-1963 30-09-1963 63 7 01-02-2027 30-04-2027
01-10-1963 31-12-1963 63 8 01-06-2027 31-08-2027
01-01-1964 31-03-1964 63 9 01-10-2027 31-12-2027
01-04-1964 30-06-1964 63 10 01-02-2028 30-04-2028
01-07-1964 30-09-1964 63 11 01-06-2028 31-08-2028
01-10-1964 31-12-1964 64 0 01-10-2028 31-12-2028
01-01-1965 31-03-1965 64 1 01-02-2029 30-04-2029
01-04-1965 30-06-1965 64 2 01-06-2029 31-08-2029
01-07-1965 30-09-1965 64 3 01-10-2029 31-12-2029
01-10-1965 31-12-1965 64 4 01-02-2030 30-04-2030
01-01-1966 31-03-1966 64 5 01-06-2030 31-08-2030
01-04-1966 30-06-1966 64 6 01-10-2030 31-12-2030
01-07-1966 30-09-1966 64 7 01-02-2031 30-04-2031
01-10-1966 31-12-1966 64 8 01-06-2031 31-08-2031
01-01-1967 31-03-1967 64 9 01-10-2031 31-12-2031
01-04-1967 30-06-1967 64 10 01-02-2032 30-04-2032

Annexes
WORKING PAPER No. 145 123121
01-07-1967 30-09-1967 64 11 01-06-2032 31-08-2032
01-10-1967 31-12-1967 65 0 01-10-2032 31-12-2032
01-01-1968 31-03-1968 65 1 01-02-2033 30-04-2033
01-04-1968 30-06-1968 65 2 01-06-2033 31-08-2033
01-07-1968 30-09-1968 65 3 01-10-2033 31-12-2033
01-10-1968 31-12-1968 65 4 01-02-2034 30-04-2034
01-01-1969 31-03-1969 65 5 01-06-2034 31-08-2034
01-04-1969 30-06-1969 65 6 01-10-2034 31-12-2034
01-07-1969 30-09-1969 65 7 01-02-2035 30-04-2035
01-10-1969 31-12-1969 65 8 01-06-2035 31-08-2035
01-01-1970 31-03-1970 65 9 01-10-2035 31-12-2035
01-04-1970 30-06-1970 65 10 01-02-2036 30-04-2036
01-07-1970 30-09-1970 65 11 01-06-2036 31-08-2036
01-10-1970 31-12-1970 66 0 01-10-2036 31-12-2036
01-01-1971 31-03-1971 66 1 01-02-2037 30-04-2037
01-04-1971 30-06-1971 66 2 01-06-2037 31-08-2037
01-07-1971 30-09-1971 66 3 01-10-2037 31-12-2037
01-10-1971 31-12-1971 66 4 01-02-2038 30-04-2038
01-01-1972 31-03-1972 66 5 01-06-2038 31-08-2038
01-04-1972 30-06-1972 66 6 01-10-2038 31-12-2038
01-07-1972 30-09-1972 66 7 01-02-2039 30-04-2039
01-10-1972 31-12-1972 66 8 01-06-2039 31-08-2039
01-01-1973 31-03-1973 66 9 01-10-2039 31-12-2039
01-04-1973 30-06-1973 66 10 01-02-2040 30-04-2040
01-07-1973 30-09-1973 66 11 01-06-2040 31-08-2040
01-10-1973 31-12-1973 67 0 01-10-2040 31-12-2040
Source: own calculations based on official legal act

Annexes
N a t i o n a l B a n k o f P o l a n d124 122
Table 7: Birth date, age required to retire, and expected earliest date of the retirement for
men (all male cohorts are entitled to POAP)
birthdate
from to age in years/months retirement
date from To
31-12-1947 65 0 01-01-2013
01-01-1948 31-03-1948 65 1 01-02-2013 30-04-2013
01-04-1948 30-06-1948 65 2 01-06-2013 31-08-2013
01-07-1948 30-09-1948 65 3 01-10-2013 31-12-2013
01-10-1948 31-12-1948 65 4 01-02-2014 30-04-2014
01-01-1949 31-03-1949 65 5 01-06-2014 31-08-2014
01-04-1949 30-06-1949 65 6 01-10-2014 31-12-2014
01-07-1949 30-09-1949 65 7 01-02-2015 30-04-2015
01-10-1949 31-12-1949 65 8 01-06-2015 31-08-2015
01-01-1950 31-03-1950 65 9 01-10-2015 31-12-2015
01-04-1950 30-06-1950 65 10 01-02-2016 30-04-2016
01-07-1950 30-09-1950 65 11 01-06-2016 31-08-2016
01-10-1950 31-12-1950 66 0 01-10-2016 31-12-2016
01-01-1951 31-03-1951 66 1 01-02-2017 30-04-2017
01-04-1951 30-06-1951 66 2 01-06-2017 31-08-2017
01-07-1951 30-09-1951 66 3 01-10-2017 31-12-2017
01-10-1951 31-12-1951 66 4 01-02-2018 30-04-2018
01-01-1952 31-03-1952 66 5 01-06-2018 31-08-2018
01-04-1952 30-06-1952 66 6 01-10-2018 31-12-2018
01-07-1952 30-09-1952 66 7 01-02-2019 30-04-2019
01-10-1952 31-12-1952 66 8 01-06-2019 31-08-2019
01-01-1953 31-03-1953 66 9 01-10-2019 31-12-2019
01-04-1953 30-06-1953 66 10 01-02-2020 30-04-2020
01-07-1953 30-09-1953 66 11 01-06-2020 31-08-2020
01-10-1953 67 0 01-10-2020 31-12-2020
Source: own calculations based on official legal act