national and regional economic update · * the views expressed today are my own and not necessarily...
TRANSCRIPT

* The views expressed today are my own and not necessarily those of the Federal Reserve Bank of Philadelphia or the Federal Reserve System.
Gary A. Wagner, Ph.D.*
National and Regional Economic Update
Greater Northeast Philadelphia Chamber of Commerce
July 12, 2016
FEDERAL RESERVE BANK OF PHILADELPHIA

• GDP and the near-term outlook (3 slides)
• Regional employment conditions (8 slides)
• Regional housing conditions (4 slides)
• Monetary policy & interest rates (2 slides)
PRESENTATION OUTLINE
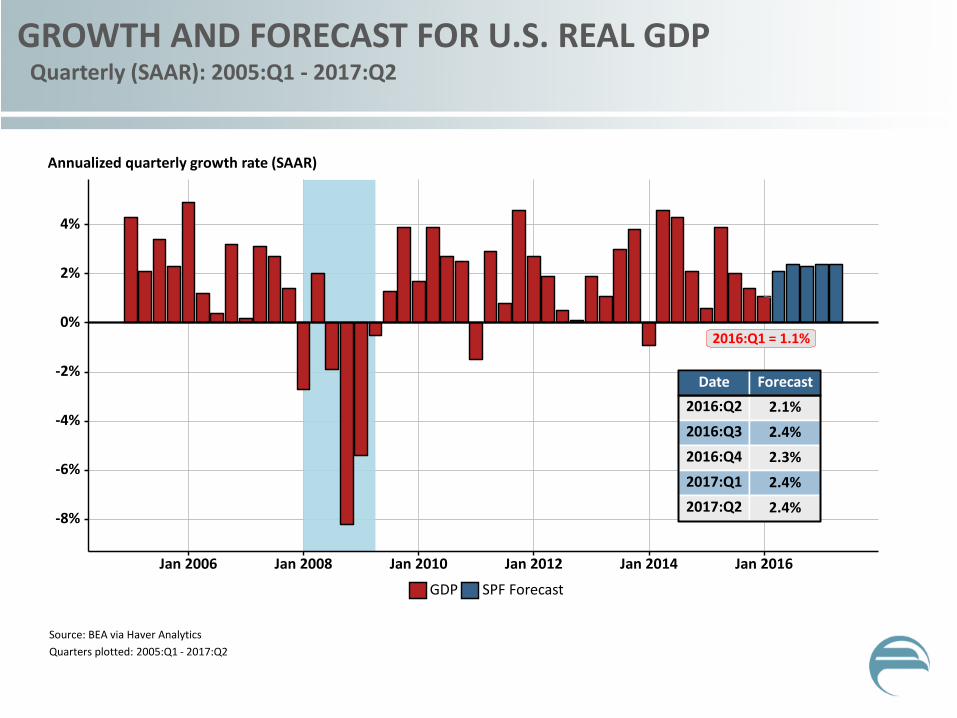
2016:Q1 = 1.1%
Date
2016:Q2
Forecast
2016:Q3
2016:Q4
2017:Q1
2017:Q2
2.1%
2.4%
2.3%
2.4%
2.4% -8%
-6%
-4%
-2%
0%
2%
4%
Jan 2006 Jan 2008 Jan 2010 Jan 2012 Jan 2014 Jan 2016
GDP SPF Forecast
Annualized quarterly growth rate (SAAR)
GROWTH AND FORECAST FOR U.S. REAL GDP Quarterly (SAAR): 2005:Q1 - 2017:Q2
Source: BEA via Haver Analytics
Quarters plotted: 2005:Q1 - 2017:Q2

2.6% 2.9%
4.1%
5.4%
5.9%
1.7%
-2%
0%
2%
4%
6%
Real GDP Consumption Investment Exports Imports Government
Annualized quarterly growth (SAAR)
GDP GROWTH BY SECTOR OVER LAST 4 QUARTERS Black lines indicate historical averages from 1980:Q1 to 2016:Q1
Source: BEA via Haver Analytics Last quarter included: 2016:Q1 Black lines indicate sector averages from 1980:Q1 to 2016:Q1

4.1% 4.0%
0.9%
5.1% 6.2%
2.4%
-10%
-5%
0%
5%
10%
15%
Investment Non- Residential
Structures Equipment Intellectual Property
Residential
Annualized quarterly growth (SAAR)
INVESTMENT GROWTH OVER LAST 4 QUARTERS Black lines indicate historical averages from 1980:Q1 to 2016:Q1
Source: BEA via Haver Analytics Last quarter included: 2016:Q1 Black lines indicate sector averages from 1980:Q1 to 2016:Q1

Employment conditions

173.9 179.1 192.6
251.2
228.7
171.5
Jun 2016: 287K Revision for Apr 2016: 21000 jobs
Revision for May 2016: -27000 jobs
0
50
100
150
200
250
300
350
Jan 2011 Jan 2012 Jan 2013 Jan 2014 Jan 2015 Jan 2016
Change in payroll employment (thousands, SA)
CHANGE IN MONTHLY U.S. PAYROLL EMPLOYMENT Black lines indicate annual averages (in thousands)
Source: BLS via Haver Analytics Months plotted: Jan 2011 - Jun 2016 Black lines indicate annual averages.
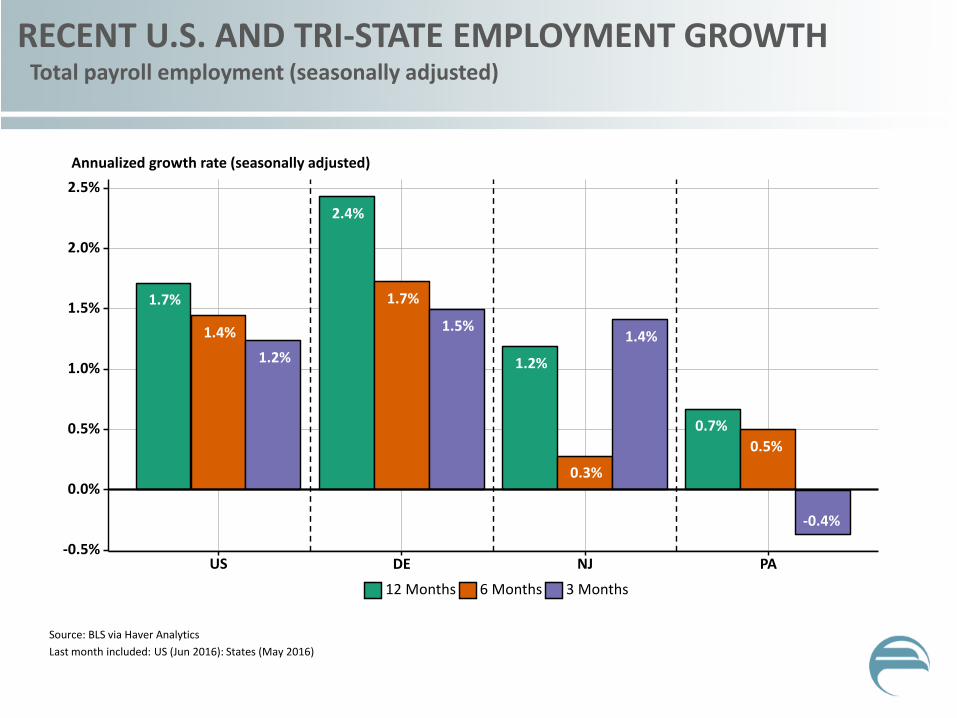
1.7%
1.4%
1.2%
2.4%
1.7%
1.5%
1.2%
0.3%
1.4%
0.7%
0.5%
-0.4%
-0.5%
0.0%
0.5%
1.0%
1.5%
2.0%
2.5%
US DE NJ PA
12 Months 6 Months 3 Months
Annualized growth rate (seasonally adjusted)
RECENT U.S. AND TRI-STATE EMPLOYMENT GROWTH Total payroll employment (seasonally adjusted)
Source: BLS via Haver Analytics
Last month included: US (Jun 2016): States (May 2016)

Government
Leisure & Hospitality
Education & Health Services
Prof & Bus Services
Financial
Information
Trade, Trans & Utilities
Manufacturing
Construction
Total Private
Total
-4% -2% 0% 2% 4%
US PA
ANNUAL EMPLOYMENT GROWTH BY SECTOR U.S. and Pennsylvania (excludes mining & logging)
Source: Calculations from BLS via Haver Analytics.
Last month included: US (Jun 2016); PA (May 2016)

TRI-STATE METRO AREA EMPLOYMENT GROWTH Year-over-year percentage change (3-month moving average)
Source: Calculations from BLS data via Haver Analytics.
A = Allentown-Bethlehem-Easton MSA B = Altoona MSA C = Atlantic City-Hammonton MSA D = Bloomsburg-Berwick MSA E = Camden Metro Division F = Chambersburg-Waynesboro MSA G = Dover MSA H = East Stroudsburg MSA I = Erie MSA J = Gettysburg MSA K = Harrisburg-Carlisle MSA L = Johnstown MSA M = Lancaster MSA N = Lebanon MSA O = Montgomery-Bucks-Chester County MD P = Newark Metro Division Q* = New York-New Jersey-White Plains MD R = Ocean City MSA S = Philadelphia-Delaware County MD T = Pittsburgh MSA U = Reading MSA V* = Salisbury MSA W = Scranton-Wilkes-Barre-Hazelton MSA X = State College MSA Y = Trenton MSA Z = Vineland-Bridgeton MSA AA = Williamsport MSA AB* = Wilmington Metro Division AC = York-Hanover MSA AD* = Youngstown-Warren MSA * Also includes counties not shown on map.
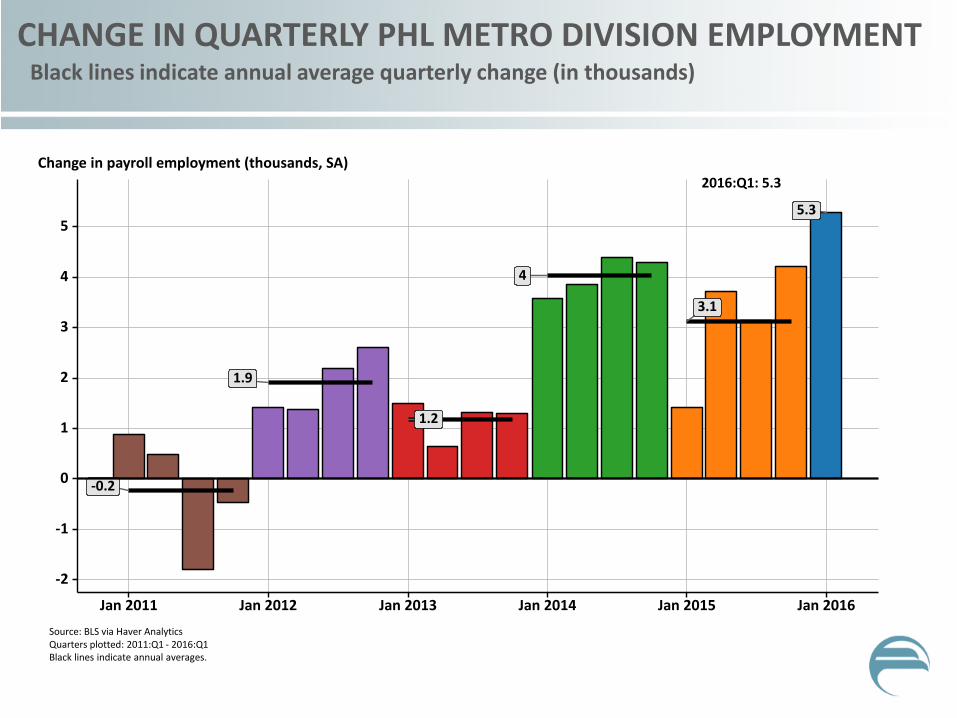
-0.2
1.9
1.2
4
3.1
5.3
2016:Q1: 5.3
-2
-1
0
1
2
3
4
5
Jan 2011 Jan 2012 Jan 2013 Jan 2014 Jan 2015 Jan 2016
Change in payroll employment (thousands, SA)
CHANGE IN QUARTERLY PHL METRO DIVISION EMPLOYMENT Black lines indicate annual average quarterly change (in thousands)
Source: BLS via Haver Analytics Quarters plotted: 2011:Q1 - 2016:Q1 Black lines indicate annual averages.

Government
Leisure & Hospitality
Education & Health Services
Prof & Bus Services
Financial
Information
Trade, Trans & Utilities
Manufacturing
Mining, Logging & Construction
Total Private
Total
-4% -2% 0% 2% 4% 6%
US Philadelphia MSA
YOY EMPLOYMENT GROWTH BY SECTOR U.S. and Philadelphia MSA
Source: Calculations from BLS via Haver Analytics.
Last month included: US (Jun 2016); Phil MSA (May 2016)

TRI-STATE AREA MANUFACTURING CONCENTRATION Share of area's total employment relative to U.S. (> 1 more concentrated)
Source: Calculations from BLS data via Haver Analytics
Calculations are the mean of figures over past 12 months.
A = Allentown-Bethlehem-Easton MSA B = Altoona MSA C = Atlantic City-Hammonton MSA D = Bloomsburg-Berwick MSA E = Camden Metro Division F = Chambersburg-Waynesboro MSA G = Dover MSA H = East Stroudsburg MSA I = Erie MSA J = Gettysburg MSA K = Harrisburg-Carlisle MSA L = Johnstown MSA M = Lancaster MSA N = Lebanon MSA O = Montgomery-Bucks-Chester County MD P = Newark Metro Division Q* = New York-New Jersey-White Plains MD R = Ocean City MSA S = Philadelphia-Delaware County MD T = Pittsburgh MSA U = Reading MSA V* = Salisbury MSA W = Scranton-Wilkes-Barre-Hazelton MSA X = State College MSA Y = Trenton MSA Z = Vineland-Bridgeton MSA AA = Williamsport MSA AB* = Wilmington Metro Division AC = York-Hanover MSA AD* = Youngstown-Warren MSA * Also includes counties not shown on map.

38.9
29.8
8.1 4.7
-40
-30
-20
-10
0
10
20
30
40
50
60
Jan 2000 Jan 2005 Jan 2010 Jan 2015
Future Activity Current Activity
Diffusion index (% reporting increase less % reporting decrease)
THIRD DISTRICT MANUFACTURING BUSINESS OUTLOOK Current and last year's values are labeled
Source: FRB Philadelphia via Haver Analytics
Months plotted: Jan 2000 - Jun 2016

Regional housing conditions

YEAR-OVER-YEAR STATE HOME PRICE GROWTH Core Logic Index, 3-month moving average (nominal)
Source: Calculations from Core Logic
Last month included: Apr 2016

TRI-STATE AREA HOME PRICE GROWTH Year-over-year, Core Logic index (3-month moving average)
Source: Calculations from Core Logic data.
Last month included: Apr 2016
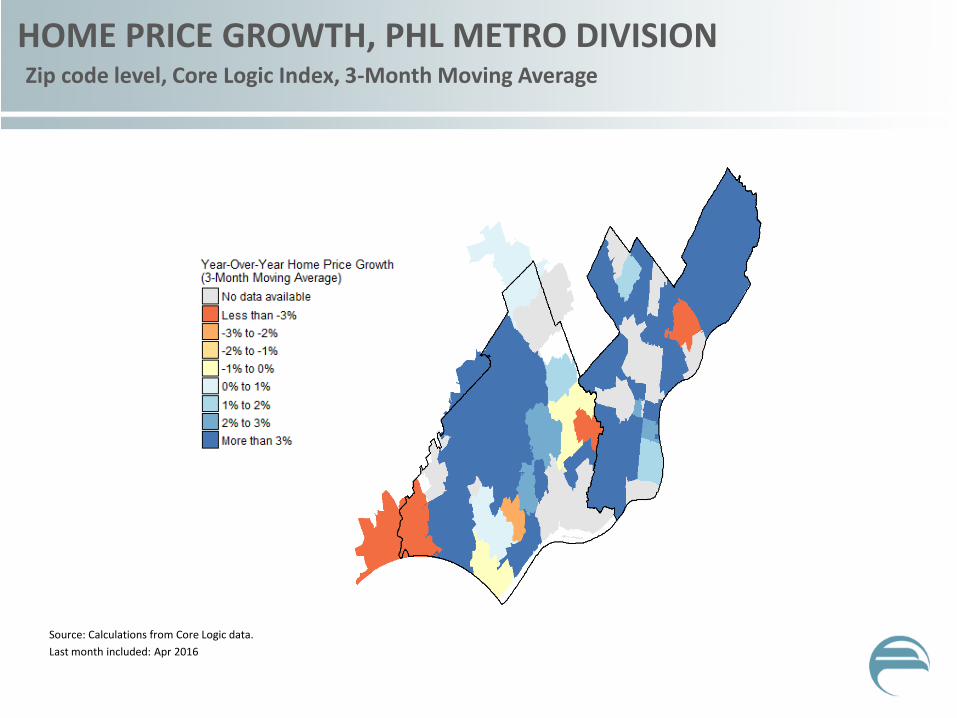
HOME PRICE GROWTH, PHL METRO DIVISION Zip code level, Core Logic Index, 3-Month Moving Average
Source: Calculations from Core Logic data.
Last month included: Apr 2016
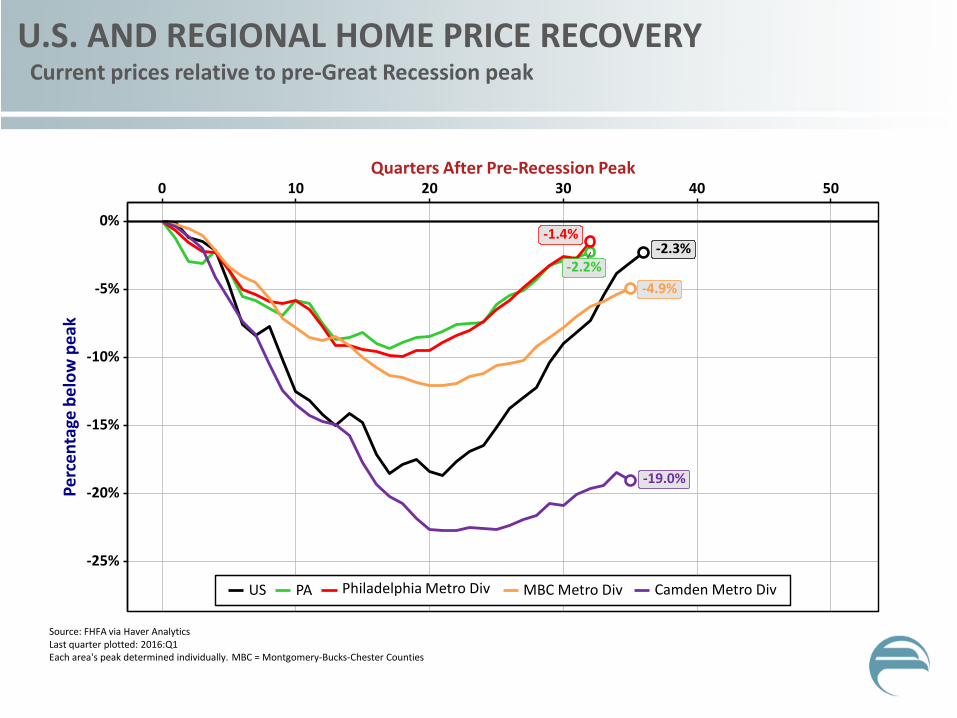
-2.3% -2.2%
-1.4%
-4.9%
-19.0%
-25%
-20%
-15%
-10%
-5%
0%
Pe
rce
nta
ge b
elo
w p
eak
US PA Philadelphia Metro Div MBC Metro Div Camden Metro Div
Quarters After Pre-Recession Peak 0 10 20 30 40 50
U.S. AND REGIONAL HOME PRICE RECOVERY Current prices relative to pre-Great Recession peak
Source: FHFA via Haver Analytics Last quarter plotted: 2016:Q1 Each area's peak determined individually. MBC = Montgomery-Bucks-Chester Counties

Monetary policy & interest rates

0
1
2
3
4
5
2016 2017
Mar 2016 Projections Jun 2016 Projections
Percent
DOT PLOT COMPARISON March 2016 vs June 2016
Source: FOMC Projections, March 2016 and June 2016
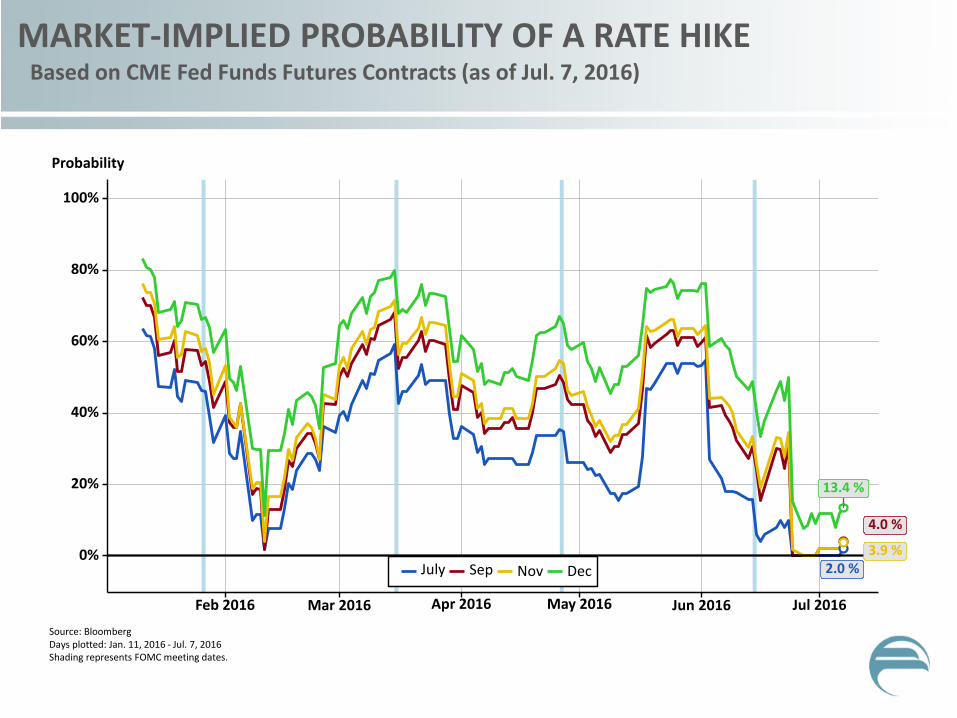
2.0 %
4.0 %
3.9 %
13.4 %
0%
20%
40%
60%
80%
100%
Feb 2016 Mar 2016 Apr 2016 May 2016 Jun 2016 Jul 2016
July Sep Nov Dec
Probability
MARKET-IMPLIED PROBABILITY OF A RATE HIKE Based on CME Fed Funds Futures Contracts (as of Jul. 7, 2016)
Source: Bloomberg Days plotted: Jan. 11, 2016 - Jul. 7, 2016 Shading represents FOMC meeting dates.
SUMMARY
Overall, national outlook remains positive • Consumer spending has slowed but remains steady
• Oil price “boost” is projected to continue until mid-to-late 2017
Nationally and regionally, we are seeing some slowdowns in energy, manufacturing, and construction sectors
Inflation and global economic conditions remain the key for future interest rate decisions

Gary A. Wagner, Ph.D. [email protected]
Request a Fed Speaker: http://philadelphiafed.org/sbform
Questions?
Follow us on Twitter
@philadelphiafed @philfedresearch
Like us on Facebook

EMPLOYMENT EFFECTS OF AN OIL PRICE DROP FRB Dallas, Economic Letter, April 2015 (vol. 10, no. 3)
Source: Originally referenced from: “The Shale Gas and Tight Oil Boom: U.S. States’ Economic Gains and Vulnerabilities,” by Stephen P.A. Brown and Mine K. Yücel, Council on Foreign Relations, Energy Brief, October 2013.
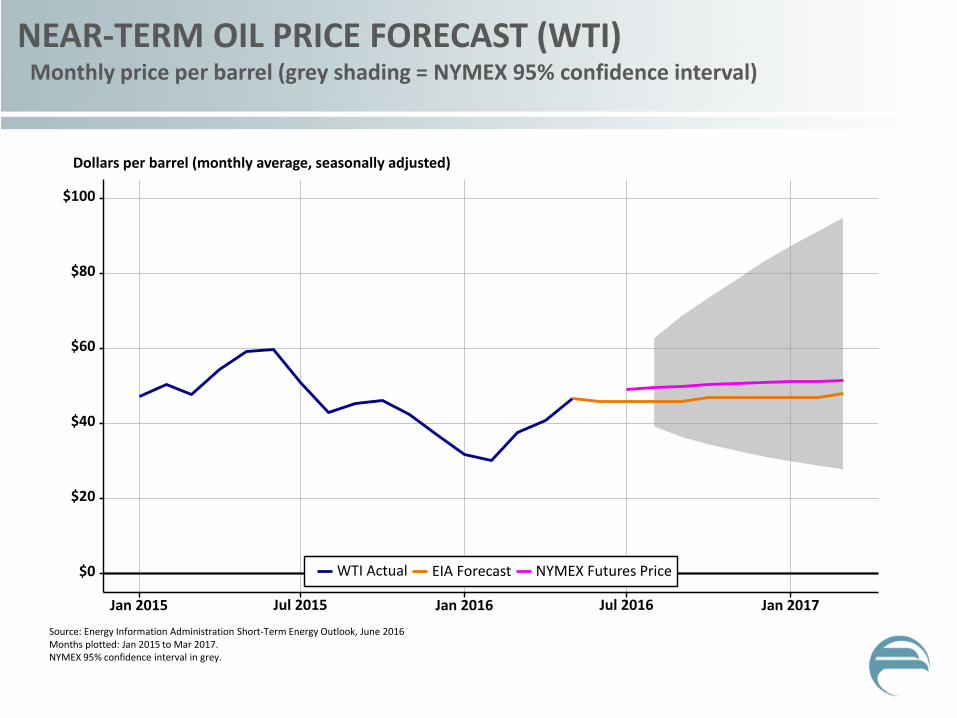
$0
$20
$40
$60
$80
$100
Jan 2015 Jul 2015 Jan 2016 Jul 2016 Jan 2017
WTI Actual EIA Forecast NYMEX Futures Price
Dollars per barrel (monthly average, seasonally adjusted)
NEAR-TERM OIL PRICE FORECAST (WTI) Monthly price per barrel (grey shading = NYMEX 95% confidence interval)
Source: Energy Information Administration Short-Term Energy Outlook, June 2016 Months plotted: Jan 2015 to Mar 2017. NYMEX 95% confidence interval in grey.