national aeronautics and space administration uas$integra ...uas$integra,on$into$the$nas:$...
TRANSCRIPT

UAS Integra,on into the NAS: iHITL: DAA Display Evalua,on
Preliminary Results
National Aeronautics and Space Administration
Lisa Fern ([email protected]) The Ohio State University
Conrad Rorie ([email protected]) San Jose State University Jay Shively ([email protected]) NASA Ames Research Center
Presented To: RTCA SC-‐228 18 NOV 2014
https://ntrs.nasa.gov/search.jsp?R=20160002936 2020-02-17T16:01:48+00:00Z

Overview • Goals:
1. Leverage the lessons learned from PT4 to con<nue the evalua<on of candidate Sense and Avoid (SAA) with respect to pilot performance of the self-‐separa<on func<on
• What are the individual contribu<ons of the various PT4 advanced display features to pilots’ response <mes and ability to maintain well clear?
2. Introduce non-‐coopera<ve intruders to examine effect of different sensor ranges on pilots ability to maintain well clear
• Ra<onale – PT4 compared a ‘Basic’ display configura<on to a suite of ‘Advanced’
features • iHitL design will allow us to measure any differences between specific display
features and determine the implica<ons of their presence or absence in the GCS
– Non-‐coopera<ve traffic are a major considera<on in the development of SAA systems
• The presence of non-‐coopera<ve aircraV provides a more realis<c environment • Limited surveillance range and field of regard may have significant impact on
pilot performance and behavior

Experimental Design • One-‐Way Repeated Measures Factorial: Display Informa<on Level (4 Level;
Within Subjects) – D1: Advanced Display with Informa<on Only – D2: Advanced Display with Informa<on + Vector Planner – D3: Advanced Display with Informa<on + Auto Resolu<ons – D4: Advanced Display with Informa<on + Vector Planner + Auto Resolu<ons
• Roughly same as ‘Advanced’ suite in PT4
• Embedded Variable – Track Type (manipulated within each scenario; not counterbalanced)
1. Coopera<ve Traffic (ADS-‐B-‐equipped) – Range = 80nm & +/-‐ 5000V
2. Non-‐Coopera<ve Traffic – Range = 6nm
– Azimuth = +/-‐ 110deg (from nose)
– Eleva<on = +/-‐ 20deg (from horizontal)

Aler<ng Criteria
4
07
15
02
00 0.8nm
1.2nm
2nm
25
10
“Self Separa,on” Threshold “Preven,ve Alert” Threshold
“Well Clear” Threshold Time un,l CPA
40s 110 s
Ver,cal Separa,on • Well-‐clear: 400 feet • Self Separa<on: 900 feet • Preven<ve: 900 feet
00

5
D1 D2
D3 D4
Display Condi<ons

D1 Encounter
6

D2 Encounter
7

D3 Encounter
8

D4 Encounter
9

Par<cipants • Par<cipants:
– 4 MQ-‐1 Predator/MQ-‐9 Reaper Pilots (avg. 46 years old) • All received Undergraduate Pilot Training
– 5 RQ-‐4 Global Hawk Pilots (avg. 33 years old) • 3 received Undergraduate Pilot Training • 1 received RQ-‐4 Basic Training (AF Specialty Code 18X) • 1 received cross training
– All 9 pilots had military UAS experience • Military Combat & Non-‐Combat Experience = avg. 1182 hours • Civilian Airspace = avg. 153 hours
– 5 pilots had less than 50 hours of experience flying in civilian airspace
– 1 re<red Air Traffic Controller with experience in Oakland Center airspace (confederate)

Procedure • UAS Scenario (38min)
– UAS: Predator B – Airspace: ZOA 40/41
• Class A & E with mixed IFR/VFR traffic • Manned traffic modeled using real traffic data
• Primary Tasks: 1. Fly HAWK21 along pre-‐filed path (Fire Line)
• Only responsible for naviga<ng the aircraV • Requires interac<on with the GCS and coordina<on ATC
2. Comply with ATC clearances and traffic display alerts to maintain safety of flight
• Secondary tasks: – ‘Chat’ directed
• “Mission” Radio Frequency changes • Radial and Distance check • Nominal informa<on requests (e.g., fuel level remaining)
– System Alerts • Generator Failure (checklist) • Tanker Header Overpressure (checklist) • Annunciator checks
11
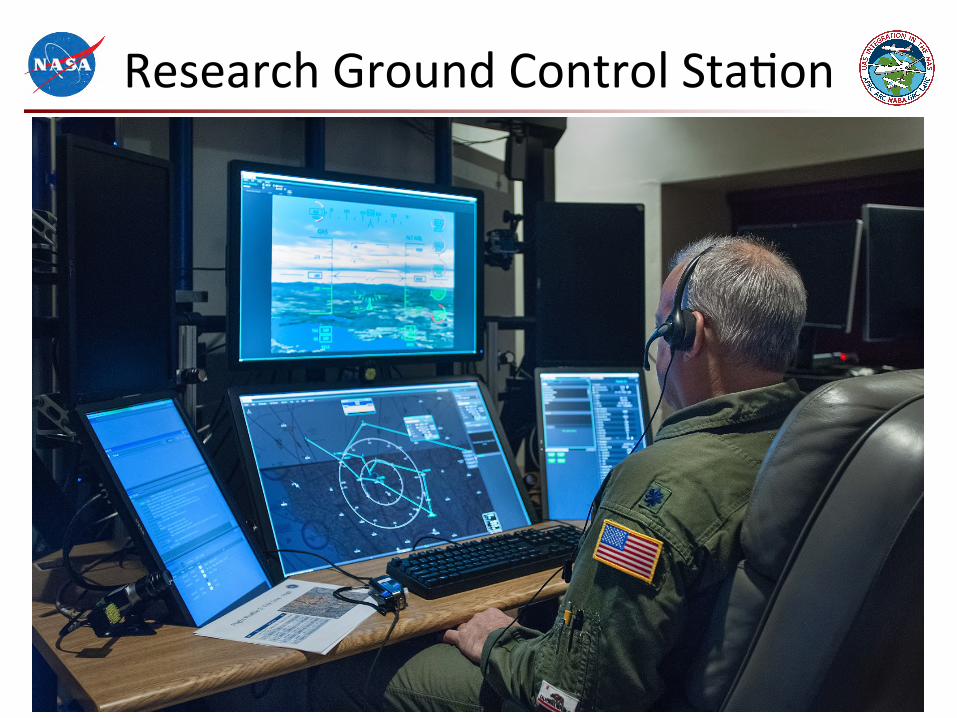
Research Ground Control Sta<on

Simula<on Architecture
DFRC LVC LAB
LVC Gateway
Voice Comm
Gateway Data Logger
SAA Proc
AutoResolver/CA
ADRS Toolbox
MACS Sim Manager
Traffic Generator
ADRS
HLA -‐ High Level Architecture
ARC CVSRF – Pilot Lab
DFRC RGCS LAB
LVC GW Toolbox
ARC DSRL
Voice Comm
Voice Comm
Voice Comm
ARC CVSRF – ATC Lab
MACS Pseudo Pilot
MACS Pseudo Pilot
MACS Pseudo Pilot Ghost Controller
Ghost Pilot
Controller Sta<on
Eye Tracker
Pilot Cmds Pilot Control Sta<on
Vigilant Spirit Control Sta,on (VSCS SIM)
VSCS Traffic Display
DIS Voice Tunneler
IT&E Components
LVC Par<cipants & Displays
RUMS Server
Internet
RUMS Internet Brouser
RUMS InternetBrouser
CSD Observer
MACS Observer

Ini<al Research Ques<on • What was the effect of the DAA guidance tools on pilots’
performance in response to self separa<on alerts? – Same measured response metrics as those captured in PT4
• Measured Response data were analyzed u<lizing 5 separate One-‐Way Analyses of Variance (ANOVAs) I. Independent Variable: Display
1) D1: Advanced Display with Informa<on Only 2) D2: Advanced Display with Informa<on + Vector Planner 3) D3: Advanced Display with Informa<on + Auto Resolu<ons 4) D4: Advanced Display with Informa<on + Vector Planner + Auto Resolu<ons
II. Analyses for: Alert Type and Intruder Type 1) All self separa<on (SS) alerts 2) Predic<ve SS alerts (yellow with red outline; collapsed across Intruder Type) 3) Non-‐Predic<ve SS alerts (yellow; collapsed across Intruder Type) 4) Coopera<ve SS alerts (collapsed across Alert Type) 5) Non-‐Coopera<ve SS alerts (collapsed across Alert Type)

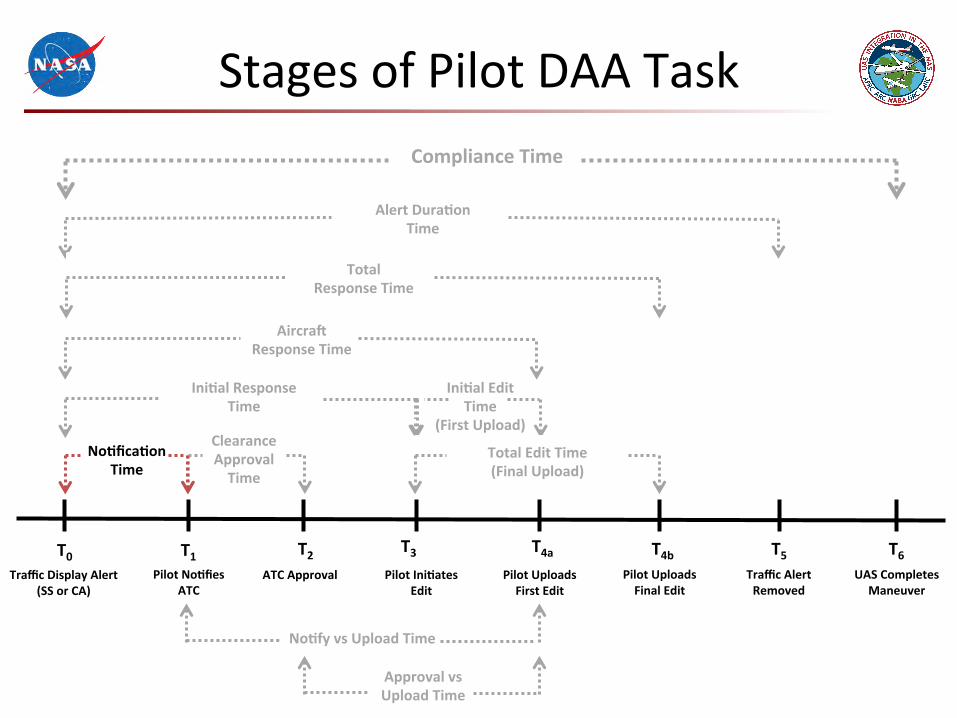
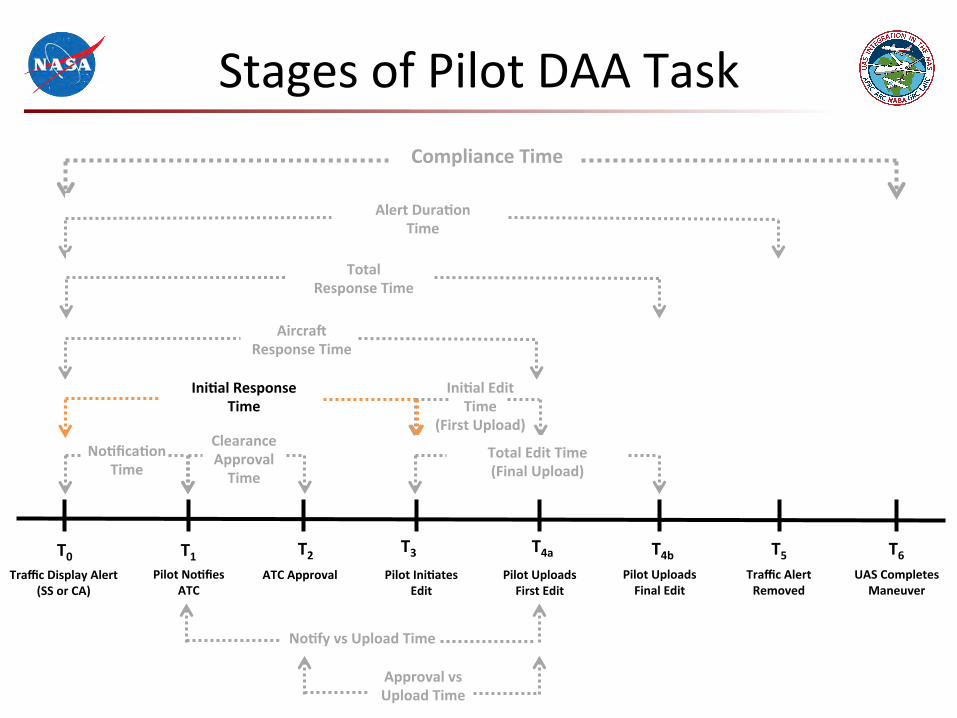
Stages of Pilot DAA Task
Traffic Display Alert (SS or CA)
Pilot No,fies ATC
ATC Approval Pilot Ini,ates Edit
Pilot Uploads Final Edit
Pilot Uploads First Edit
Traffic Alert Removed
T0 T1 T2 T3 T4b T4a T5 T6 UAS Completes
Maneuver
No,fica,on Time
Ini,al Edit Time
(First Upload)
Ini,al Response Time
Compliance Time
Total Edit Time (Final Upload)
Aircra^ Response Time
Alert Dura,on Time
Total Response Time
Approval vs Upload Time
No,fy vs Upload Time
Clearance Approval Time

Self-‐Separa<on Timeline
16
Time un,l CPA
Well Clear Threshold
Aircra^ Maneuver Time
35 sec 110 sec
TOTAL RESPONSE TIME: Detect Intruders
Pilots Determine Resolu,on Nego,ate Clearance with ATC and uplink
maneuver to aircra^
? sec

Encounter Sta<s<cs • Total Number of Encounters:
– Alert Type: • 134 Predic<ve SS Alerts • 115 Non-‐Predic<ve SS Alerts
– Intruder Type: • 92 Coopera<ve • 157 Non-‐Coopera<ve
• Pilots responded to a total of 196 Self Separa<on Alerts – Alert Type:
• 122 Predic<ve SS Alerts (91% of total) • 74 Non-‐Predic<ve SS Alerts (64% of total)
– Intruder Type: • 61 Coopera<ve (66% of total) • 135 Non-‐Coopera<ve (86% of total)
– Alert Type X Intruder Type: • 25 Coopera<ve/Predic<ve • 36 Coopera<ve/Non-‐Predic<ve • 97 Non-‐Coopera<ve/Predic<ve • 38 Non-‐Coopera<ve/Non-‐Predic<ve

Data Slides Organiza<on
Ø Slides organized by metric • Analysis of Variance (ANOVA) results for All SS Alerts
– Was there an effect of Display on the dependent variable?
• ANOVA by Alert Type • ANOVA by Intruder Type • Means of the Alert/Intruder Type by Display • Means of Display by Alert/Intruder Type • Comparison of display means for PT4 and iHITL

iHITL Results
Summary of Results PT4 Grand Mean
iHITL Grand Mean All SS Predic<ve Non-‐
Predic<ve Coopera<ve Non-‐Coopera<ve
No<fica<on Time 29.07s 14.03s X X X X X
Clearance Approval Time 5.08s 5.54s X X X X X
ATC No<fica<on vs Upload Time 3.51s 0.18s p = .075 X p < .05 p = .-‐55 X
ATC Approval vs Upload Time -‐1.52s -‐6.46s p = .092 X p < .05 p = .070 X
Ini<al Response Time 19.32s 8.52s X X X X X
Ini<al Edit Time 11.77s 6.29s p < .01 p < .05 p < .05 p < .01 p = .056
Total Edit Time 17.65s 9.83s X p < .05 X X p = .064
AircraV Response Time 32.19s 14.54s p = .069 p = .059 p < .05 p < .01 X
Total Response Time 37.87s 18.08s X p = .056 X X X
Alert Dura<on Time 48.61s 33.58s X X X X X
Compliance Time 71.43s 37.53s p < .05 p < .05 X X X
Only 6 significant differences between display condi<ons

Some Results: Total Edit Time
Total Response Time

Stages of Pilot DAA Task
Traffic Display Alert (SS or CA)
Pilot No,fies ATC
ATC Approval Pilot Ini,ates Edit
Pilot Uploads Final Edit
Pilot Uploads First Edit
Traffic Alert Removed
T0 T1 T2 T3 T4b T4a T5 T6 UAS Completes
Maneuver
No,fica,on Time
Ini,al Edit Time
(First Upload)
Ini,al Response Time
Compliance Time
Total Edit Time (Final Upload)
Aircra^ Response Time
Alert Dura,on Time
Total Response Time
Approval vs Upload Time
No,fy vs Upload Time
Clearance Approval Time

49.80 48.30 43.50 33.60
0.00
10.00
20.00
30.00
40.00
50.00
60.00
70.00
D1 D2 D3 D4
Total Edit Time
• There was a not significant effect of Display on Total Edit Time for all SS alerts, p > .05
• Pilots took an average of 9.83 seconds to complete their final edit in response to SS alerts

10.63 11.80 12.91 16.12
0.00
5.00
10.00
15.00
20.00
25.00
D1 D2 D3 D4
Non-‐Predic,ve SS Alerts
13.62 11.44 3.68
6.55
0.00
5.00
10.00
15.00
20.00
25.00
D1 D2 D3 D4
Predic,ve SS Alerts
Total Edit Time
• There was a significant effect of Display on Total Edit Time for Predic<ve alerts, p < .05
– D3 was significantly faster than D2, but no different than the other two displays
• Pilots took an average of 8.83 seconds to complete their final edit in response to Predic<ve SS alerts
• There was no significant main effect of Display on Total Edit Time for Non-‐Predic<ve alerts, p > .05
• Pilots took an average of 12.862 seconds to complete their final edit in response to Non-‐Predic<ve SS alerts

11.43 10.38 5.66 5.77
0.00
5.00
10.00
15.00
20.00
25.00
D1 D2 D3 D4
Non-‐Coopera,ve SS Alerts
16.38 12.46
7.50 12.00
0.00
5.00
10.00
15.00
20.00
25.00
D1 D2 D3 D4
Coopera,ve SS Alerts
Total Edit Time
• There was no significant effect of Display on Total Edit Time for Coopera<ve SS alerts, p > .05
• Pilots took an average of 12.08 seconds to complete their final edit in response to Coopera<ve SS alerts
• There was a near significant effect of Display on Total Edit Time for Non-‐Coopera<ve SS alerts, p = .064
• Pilots took an average of 8.31 seconds to complete their final edit in response to Non-‐Coopera<ve alerts

D1 D2 D3 D4 Coopera<ve/Predic<ve 16.33 12.64 14.00 12.17
Coopera<ve/Non-‐Predic<ve 16.40 12.63 2.50 13.64
Non-‐Coopera<ve/Predic<ve 13.26 10.50 2.64 4.54
Non-‐Coopera<e/Non-‐Predic<ve 8.21 10.86 13.17 9.40
0.00
5.00
10.00
15.00
20.00
25.00
30.00
Total Edit Time

Coopera<ve/Predic<ve Coopera<ve/Non-‐Predic<ve Non-‐Coopera<ve/Predic<ve Non-‐Coopera<ve/Non-‐Predic<ve D1 16.33 16.40 13.26 8.21
D2 12.64 12.63 10.50 10.86
D3 14.00 2.50 2.64 13.17
D4 12.17 13.64 4.54 9.40
-‐5.00
0.00
5.00
10.00
15.00
20.00
25.00
30.00
Total Edit Time

Stages of Pilot DAA Task
Traffic Display Alert (SS or CA)
Pilot No,fies ATC
ATC Approval Pilot Ini,ates Edit
Pilot Uploads Final Edit
Pilot Uploads First Edit
Traffic Alert Removed
T0 T1 T2 T3 T4b T4a T5 T6 UAS Completes
Maneuver
No,fica,on Time
Ini,al Edit Time
(First Upload)
Ini,al Response Time
Compliance Time
Total Edit Time (Final Upload)
Aircra^ Response Time
Alert Dura,on Time
Total Response Time
Approval vs Upload Time
No,fy vs Upload Time
Clearance Approval Time

49.80 48.30 43.50 33.60
0.00
10.00
20.00
30.00
40.00
50.00
60.00
70.00
D1 D2 D3 D4
• There was not a significant effect of Informa<on on Total Response Time for all SS alerts, p > .05
• Pilots took an average of 18.08 seconds to complete their final edit in response to SS alerts (from first alert appearance)
Total Response Time

22.54 21.49 21.87 25.55
0.00
5.00
10.00
15.00
20.00
25.00
30.00
35.00
40.00
D1 D2 D3 D4
Non-‐Predic,ve SS Alerts
19.08 20.52 12.17 13.13
0.00
5.00
10.00
15.00
20.00
25.00
30.00
35.00
40.00
D1 D2 D3 D4
Predic,ve SS Alerts
Total Response Time
• There was a near significant effect of Display on Total Response Time for Predic<ve SS alerts, p = .056
• Pilots took an average of 16.22 seconds to complete their final edit in response to Predic<ve SS alerts (from first alert appearance)
• There was no significant effect of Display on Total Response Time, p > .05
• Pilots took an average of 22.86 seconds to complete their final edit in response to Non-‐Predic<ve SS alerts (from first alert appearance)

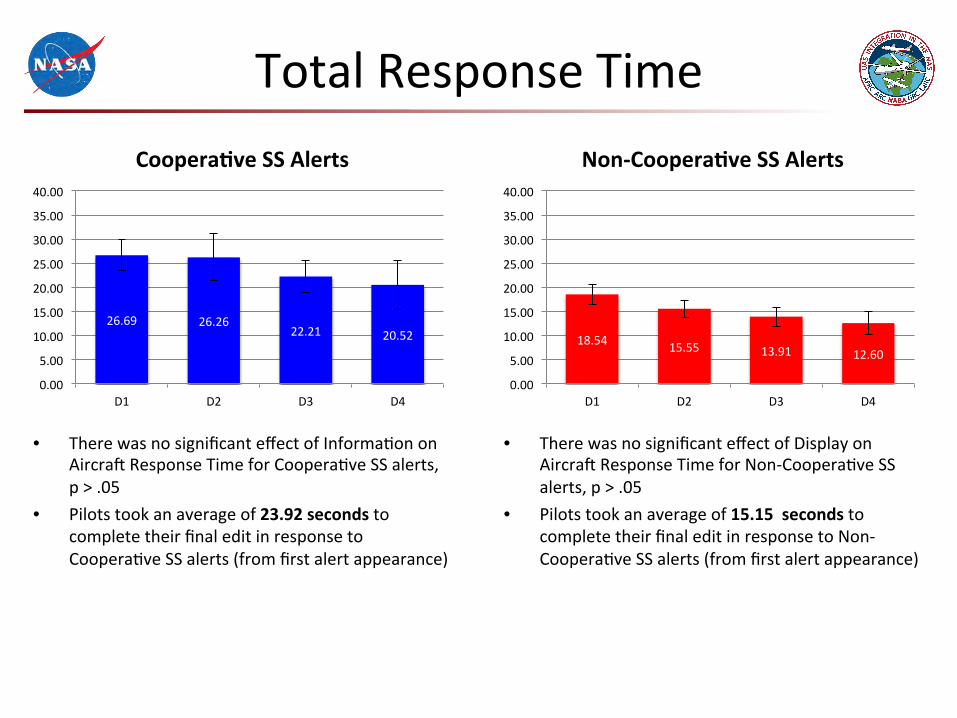
18.54 15.55 13.91 12.60
0.00
5.00
10.00
15.00
20.00
25.00
30.00
35.00
40.00
D1 D2 D3 D4
Non-‐Coopera,ve SS Alerts
26.69 26.26 22.21 20.52
0.00
5.00
10.00
15.00
20.00
25.00
30.00
35.00
40.00
D1 D2 D3 D4
Coopera,ve SS Alerts
Total Response Time
• There was no significant effect of Informa<on on AircraV Response Time for Coopera<ve SS alerts, p > .05
• Pilots took an average of 23.92 seconds to complete their final edit in response to Coopera<ve SS alerts (from first alert appearance)
• There was no significant effect of Display on AircraV Response Time for Non-‐Coopera<ve SS alerts, p > .05
• Pilots took an average of 15.15 seconds to complete their final edit in response to Non-‐Coopera<ve SS alerts (from first alert appearance)

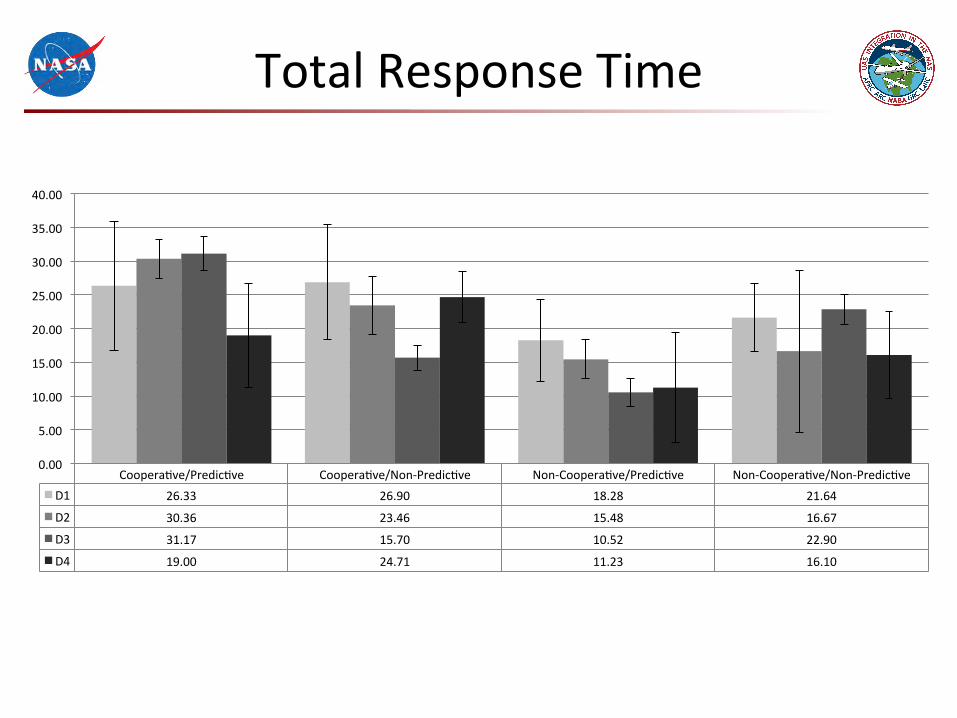
D1 D2 D3 D4 Coopera<ve/Predic<ve 26.33 30.36 31.17 19.00
Coopera<ve/Non-‐Predic<ve 26.90 23.46 15.70 24.71
Non-‐Coopera<ve/Predic<ve 18.28 15.48 10.52 11.23
Non-‐Coopera<e/Non-‐Predic<ve 21.64 16.67 22.90 16.10
0.00
5.00
10.00
15.00
20.00
25.00
30.00
35.00
40.00
45.00
Total Response Time

Coopera<ve/Predic<ve Coopera<ve/Non-‐Predic<ve Non-‐Coopera<ve/Predic<ve Non-‐Coopera<ve/Non-‐Predic<ve D1 26.33 26.90 18.28 21.64
D2 30.36 23.46 15.48 16.67
D3 31.17 15.70 10.52 22.90
D4 19.00 24.71 11.23 16.10
0.00
5.00
10.00
15.00
20.00
25.00
30.00
35.00
40.00
Total Response Time

iHITL Results Summary
• Few Meaningful Significant Results – Except for one, all for edit <mes where D3, and some<mes D4, are
significantly faster – Does not translate to significant difference in total response <me
• No more than 8.5s difference between fastest and slowest <mes from Non-‐Coopera<ve/Predic<ve
• Some overall Trends: – Predic<ve alerts tended to have faster response <mes than Non-‐Predic<ve
alerts – Non-‐Coopera<ve alerts tended to have faster response <mes than
Coopera<ve alerts – Except for Edit Times, appears to be less variability across Intruder/Alert
(especially Non-‐Coopera<ve/Predic<ve) type than Display type

iHITL Results Summary • Ini<al Response Time:
– Non-‐Coopera<ve on average 5 seconds faster than Coopera<ve – Intruder/alert type appears more predic<ve of response <me with low variability between D1 – D4 – Non-‐Coopera<ve/Predic<ve fastest overall
• Ini<al Edit Time: – D3 consistently significantly fastest – D1 consistently significantly slowest – Lower variability for D3 and D2, higher variability for D1 and D4 across Intruder type
• Total Edit Time: – D3 significantly faster than D2 for Predic<ve SS alerts only (about 8 seconds faster) – Non-‐Coopera<ve on average 4 seconds faster than Coopera<ve – Least variability in D2 across Intruder/Alert Type
• AircraV Response Time – D4 significantly faster than D1 and D2 (10-‐20 seconds) – Lowest and least variability in response <mes for Non-‐Coopera<ve/Predic<ve – Least variability in D4
• Total Response Time – No significant results – Predic<ve on average 5.5 seconds faster than Non-‐Predic<ve – Non-‐Coopera<ve on average 9 seconds faster than coopera<ve – Non-‐Coopera<ve/Predic<ve appears faster overall

iHITL and PT4 Results • iHITL Response Times faster than PT4 Response Times • Closest comparisons:
– PT4 Basic_Integrated (Basic) vs. iHITL D1 • D1 added informa<on: predic<ve alert level, well clear ring, intruder CPA loca<on
– PT4 Advanced_Integrated (Advanced) vs. iHITL D4 • D4 removed informa<on: ver<cal situa<on display, ownship CPA, <me to CPA
• Ini<al Response Time, about 11 seconds faster overall (19.32s vs. 8.52s) • Total Edit Time, about 8 seconds faster overall (17.65s vs. 9.82s) • Total Response Time, about 8 seconds faster overall (37.87s vs. 18.08s)
Measure PT4 Basic iHITL D1 PT4 Advanced iHITL D4
Ini<al Response Time 22 8 22 7
Total Edit Time 23 13 10 9
Total Response Time 45 21 32 16

7.89 8.28 9.60 7.24
21.62 22.09
15.26 18.30
0.00
5.00
10.00
15.00
20.00
25.00
30.00
D1 D2 D3 D4 Int_Basic Int_Advanced SA_Basic SA_Advanced
IHITL and PT4 Display Comparison
Ini<al Response Time

12.65 11.43
6.74 8.51
22.65
10.08
21.60
16.28
0.00
5.00
10.00
15.00
20.00
25.00
30.00
D1 D2 D3 D4 Int_Basic Int_Advanced SA_Basic SA_Advanced
IHITL and PT4 Display Comparison
Total Edit Time

20.54 19.71 16.34 15.74
44.86
32.35 38.68
35.60
0.00
10.00
20.00
30.00
40.00
50.00
60.00
D1 D2 D3 D4 Int_Basic Int_Advanced SA_Basic SA_Advanced
IHITL and PT4 Display Comparison
Total Response Time

Self-‐Separa<on Timeline
39
Time un,l CPA
Well Clear Threshold
Aircra^ Maneuver Time
35 sec 110 sec
TOTAL RESPONSE TIME: Detect Intruders
Pilots Determine Resolu,on Nego,ate Clearance with ATC and uplink
maneuver to aircra^
? sec

Self-‐Separa<on Timeline
40
Time un,l CPA
Well Clear Threshold
Aircra^ Maneuvers
40 sec 55 sec
Basic Standalone (39s)
94 sec
Basic Integrated (45s)
100 sec
Advanced Standalone (36s)
91 sec
Advanced Integrated (32s)
87 sec
Latest SS aler<ng <me that allows pilot to upload final maneuver
by display

Self-‐Separa<on Timeline
41
Time un,l CPA
Well Clear Threshold
Aircra^ Maneuver Time
35 sec 110 sec ? sec
Basic Standalone (39s)
Basic Integrated (45s)
Advanced Standalone (36s)
Advanced Integrated (32s)
30 sec
36 sec
39 sec
43 sec

Self-‐Separa<on Timeline
42
Time un,l CPA
Well Clear Threshold
Aircra^ Maneuver Time
35 sec 110 sec ? sec
D2 (20s)
D1 (21s)
D3 (16s)
D4 (16s)
54 sec
55 sec
59 sec
59 sec

DAA Task • What does the DAA Task add to pilot response <mes?
– A number of subtasks: • Detect • Determine • Execute
• Can compare to pilot response <mes when responding to ATC clearances in same naviga<on mode (AutoPilot; full mission simula<on)
– Assump<on that ATC response is near immediate – Auto resolu<on condi<ons (D3 and D4) actually reduce edit <mes
Measure FM AP Mean iHITL Grand Mean Difference
Ini<al RT 1.23s 8.25s +7.02s
Ini<al Edit Time 9.11s 6.29s -‐2.82s
Total Edit Time 9.25s 9.83s +0.58s
AircraV RT 10.43s 14.54s +4.11s
HSI Follow on Research • Part Task Simula<on 5
– Goal: Con<nue examining DAA display concepts • Revisit a minimum informa<on display condi<on – PT4 Basic with predic<ve alert level • Evaluate sugges<ve and informa<ve displays • Evaluate effect of nominal uncertainty on displays and pilot performance
– Data Collec<on March 2014

All Results Slides
Stages of Pilot DAA Task
Traffic Display Alert (SS or CA)
Pilot No,fies ATC
ATC Approval Pilot Ini,ates Edit
Pilot Uploads Final Edit
Pilot Uploads First Edit
Traffic Alert Removed
T0 T1 T2 T3 T4b T4a T5 T6 UAS Completes
Maneuver
Ini,al Edit Time
(First Upload)
Ini,al Response Time
Compliance Time
Total Edit Time (Final Upload)
Aircra^ Response Time
Alert Dura,on Time
Total Response Time
Approval vs Upload Time
No,fy vs Upload Time
Clearance Approval Time
No,fica,on Time
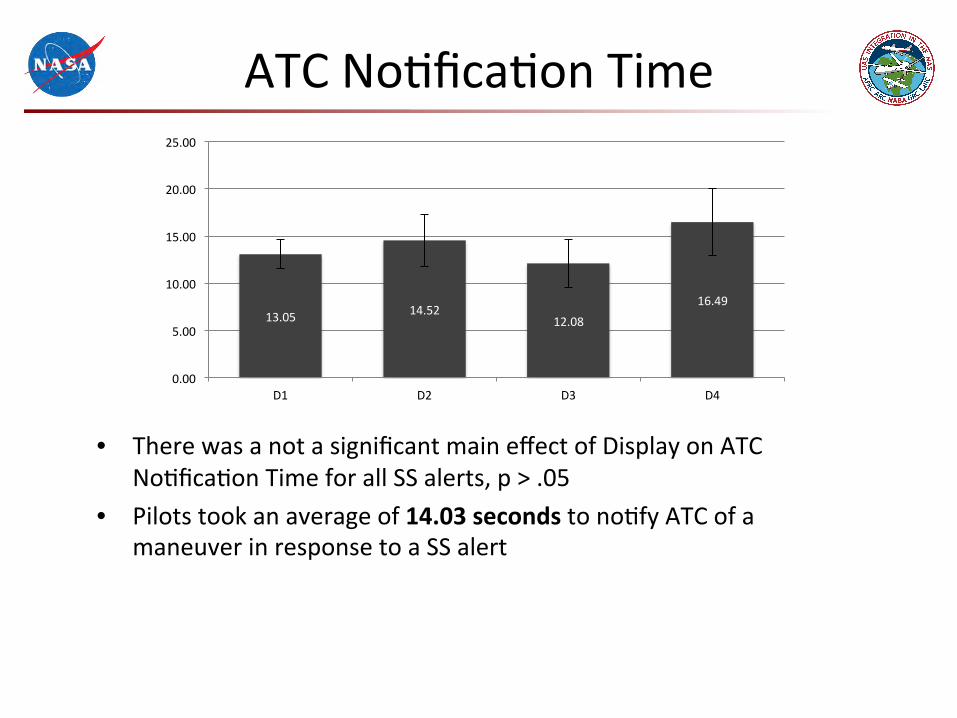
13.05 14.52 12.08
16.49
0.00
5.00
10.00
15.00
20.00
25.00
D1 D2 D3 D4
ATC No<fica<on Time
• There was a not a significant main effect of Display on ATC No<fica<on Time for all SS alerts, p > .05
• Pilots took an average of 14.03 seconds to no<fy ATC of a maneuver in response to a SS alert

15.07 15.11 10.07
17.83
0.00
5.00
10.00
15.00
20.00
25.00
D1 D2 D3 D4
Non-‐Predic,ve SS Alerts
12.36 16.06
13.24 14.55
0.00
5.00
10.00
15.00
20.00
25.00
D1 D2 D3 D4
Predic,ve SS Alerts
ATC No<fica<on Time
• There was no significant effect of Display on ATC No<fica<on Time for Predic<ve SS alerts, p > .05
• Pilots took an average of 14.05 seconds to no<fy ATC of a maneuver in response to a Predic<ve SS alert
• There was no significant effect of Display on ATC No<fica<on Time for Non-‐Predic<ve SS alerts, p > .05
• Pilots took an average of 14.52 to no<fy ATC of a maneuver in response to a Non-‐Predic<ve SS alert

11.76 12.65 11.64 16.55
0.00
5.00
10.00
15.00
20.00
25.00
D1 D2 D3 D4
Non-‐Coopera,ve SS Alerts
17.50 17.04 14.00
17.06
0.00
5.00
10.00
15.00
20.00
25.00
D1 D2 D3 D4
Coopera,ve SS Alerts
ATC No<fica<on Time
• There was no significant effect of Display on ATC No<fica<on Time for Coopera<ve SS alerts, p > .05
• Pilots took an average of 16.40 seconds to no<fy ATC of a maneuver in response to a Coopera<ve SS alert
• There was no significant effect of Display on ATC No<fica<on Time for Non-‐Coopera<ve SS alerts, p > .05
• Pilots took an average of 13.15 seconds to no<fy ATC of a maneuver in response to a Non-‐Coopera<ve SS alert

ATC No<fica<on Time
D1 D2 D3 D4 Coopera<ve/Predic<ve 15.67 23.21 15.67 7.33
Coopera<ve/Non-‐Predic<ve 18.88 15.14 12.40 20.72
Non-‐Coopera<ve/Predic<ve 11.49 14.50 13.28 15.94
Non-‐Coopera<e/Non-‐Predic<ve 14.83 14.08 8.43 22.75
0.00
5.00
10.00
15.00
20.00
25.00
30.00
35.00

Coopera<ve/Predic<ve Coopera<ve/Non-‐Predic<ve Non-‐Coopera<ve/Predic<ve Non-‐Coopera<ve/Non-‐Predic<ve D1 15.67 18.88 11.49 14.83
D2 23.21 15.14 14.50 14.08
D3 15.67 12.40 13.28 8.43
D4 7.33 20.72 15.94 22.75
0.00
5.00
10.00
15.00
20.00
25.00
30.00
ATC No<fica<on Time

13.05 14.52 12.08
16.49
32.40
26.76 31.91
25.22
0.00
5.00
10.00
15.00
20.00
25.00
30.00
35.00
40.00
45.00
D1 D2 D3 D4 Int_Basic Int_Advanced SA_Basic SA_Advanced
IHITL and PT4 Display Comparison
ATC No<fica<on Time

Stages of Pilot DAA Task
Traffic Display Alert (SS or CA)
Pilot No,fies ATC
ATC Approval Pilot Ini,ates Edit
Pilot Uploads Final Edit
Pilot Uploads First Edit
Traffic Alert Removed
T0 T1 T2 T3 T4b T4a T5 T6 UAS Completes
Maneuver
No,fica,on Time
Ini,al Edit Time
(First Upload)
Ini,al Response Time
Compliance Time
Total Edit Time (Final Upload)
Aircra^ Response Time
Alert Dura,on Time
Total Response Time
Approval vs Upload Time
No,fy vs Upload Time
Clearance Approval Time

5.50 5.62 5.66 5.39
0.00
1.00
2.00
3.00
4.00
5.00
6.00
7.00
D1 D2 D3 D4
Clearance Approval Time
• There was no significant main effect of Informa<on on Clearance Approval Time, p > .05
• It took an average of 5.54 seconds for pilots to receive and an ATC approval for a maneuver in response to a SS alert

5.25 6.07 5.73
6.79
0.00
1.00
2.00
3.00
4.00
5.00
6.00
7.00
8.00
D1 D2 D3 D4
Non-‐Predic,ve SS Alerts
5.21 5.93 5.72 5.13
0.00
1.00
2.00
3.00
4.00
5.00
6.00
7.00
8.00
D1 D2 D3 D4
Predic,ve SS Alerts
Clearance Approval Time
• There was no significant main effect of Informa<on on Clearance Approval Time, p > .05
• It took an average of 5.50 seconds for pilots to receive and an ATC approval for a maneuver in response to a Predic<ve SS alert
• There was no significant main effect of Display on Clearance Approval Time, p > .05
• It took an average of 5.96 seconds for pilots to receive and an ATC approval for a maneuver in response to a Non-‐Predic<ve SS alert

5.54 5.42 5.72 5.21
0.00
1.00
2.00
3.00
4.00
5.00
6.00
7.00
8.00
D1 D2 D3 D4
Non-‐Coopera,ve SS Alerts
5.14 6.17 5.57 6.00
0.00
1.00
2.00
3.00
4.00
5.00
6.00
7.00
8.00
D1 D2 D3 D4
Coopera,ve SS Alerts
Clearance Approval Time
• There was not a significant effect of Display on Clearance Approval Time for Coopera<ve SS alerts, p > .05
• It took an average of 5.72 seconds for pilots to receive and an ATC a Coopera<ve SS alert
• There was no significant effect of Display on Clearance Approval Time for Non-‐Coopera<ve SS alerts, p > .05
• It took an average of 5.47 seconds for pilots to receive and an ATC approval for a maneuver in response to a Non-‐Coopera<ve SS alert

D1 D2 D3 D4 Coopera<ve/Predic<ve 4.50 5.93 6.00 4.58
Coopera<ve/Non-‐Predic<ve 5.62 6.38 5.60 6.86
Non-‐Coopera<ve/Predic<ve 5.36 5.43 5.57 5.21
Non-‐Coopera<e/Non-‐Predic<ve 5.25 5.47 6.14 6.25
0.00
1.00
2.00
3.00
4.00
5.00
6.00
7.00
8.00
9.00
Clearance Approval Time

Coopera<ve/Predic<ve Coopera<ve/Non-‐Predic<ve Non-‐Coopera<ve/Predic<ve Non-‐Coopera<ve/Non-‐Predic<ve D1 4.50 5.62 5.36 5.25
D2 5.93 6.38 5.43 5.47
D3 6.00 5.60 5.57 6.14
D4 4.58 6.86 5.21 6.25
0.00
1.00
2.00
3.00
4.00
5.00
6.00
7.00
8.00
9.00
Clearance Approval Time

5.50 5.62 5.66 5.39 4.85 5.20 5.40
4.89
0.00
1.00
2.00
3.00
4.00
5.00
6.00
7.00
D1 D2 D3 D4 Int_Basic Int_Advanced SA_Basic SA_Advanced
IHITL and PT4 Display Comparison
Clearance Approval Time

Stages of Pilot DAA Task
Traffic Display Alert (SS or CA)
Pilot No,fies ATC
ATC Approval Pilot Ini,ates Edit
Pilot Uploads Final Edit
Pilot Uploads First Edit
Traffic Alert Removed
T0 T1 T2 T3 T4b T4a T5 T6 UAS Completes
Maneuver
No,fica,on Time
Ini,al Edit Time
(First Upload)
Ini,al Response Time
Compliance Time
Total Edit Time (Final Upload)
Aircra^ Response Time
Alert Dura,on Time
Total Response Time
Approval vs Upload Time
No,fy vs Upload Time
Clearance Approval Time

ATC No<fica<on vs Upload Time
• Across all maneuvers, pilots requested a clearance 93.4% of the <me
• On average, pilots who requested an ATC clearance did so prior to maneuvering in response to SS alerts 57.2% of the <me (65.1% overall)
– D1 = 71.3% – D2 = 56.0% – D3 = 49.8% – D4 = 51.8%
71.30 56.00 49.80 51.80
0.00
10.00
20.00
30.00
40.00
50.00
60.00
70.00
80.00
90.00
100.00
D1 D2 D3 D4

2.83 2.41
-‐0.48
-‐4.04 -‐10.00
-‐5.00
0.00
5.00
10.00
15.00
D1 D2 D3 D4
ATC No<fica<on vs Upload Time
• There was a near significant effect of Display on ATC No<fica<on vs Upload Time for all SS alerts, p = .075
• On average, pilots requested an ATC clearance 0.18 seconds prior to uploading a maneuver in response to a Predic<ve SS alert

7.43 4.72
0.23
-‐3.41
-‐15.00
-‐10.00
-‐5.00
0.00
5.00
10.00
15.00
D1 D2 D3 D4
Non-‐Predic,ve SS Alerts
0.21 1.82
-‐2.57 -‐3.52
-‐15.00
-‐10.00
-‐5.00
0.00
5.00
10.00
15.00
D1 D2 D3 D4
Predic,ve SS Alerts
ATC No<fica<on vs Upload Time
• There was no significant effect of Display on ATC No<fica<on vs Upload Time for Predic<ve SS alerts, p > .05
• On average, pilots requested an ATC clearance 1.01 sec a^er uploading a maneuver in response to a Predic<ve SS alert
• There was a significant effect of Display on ATC No<fica<on vs Upload Time for Non-‐Predic<ve SS alerts, p < .05
– No differences between displays were significant
• On average, pilots requested an ATC clearance 2.24 seconds prior to uploading a maneuver in response to a Non-‐Predic<ve SS alert

5.71
6.37
3.29
-‐5.79 -‐15.00
-‐10.00
-‐5.00
0.00
5.00
10.00
15.00
D1 D2 D3 D4
Coopera,ve SS Alerts
2.22 0.70
-‐1.96 -‐4.02
-‐15.00
-‐10.00
-‐5.00
0.00
5.00
10.00
15.00
D1 D2 D3 D4
Non-‐Coopera,ve SS Alerts
ATC No<fica<on vs Upload Time
• There was a near significant effect of Informa<on on ATC No<fica<on vs Upload Time for Coopera<ve SS alerts, p = .055
• On average, pilots requested an ATC clearance 2.40 seconds prior to uploading a maneuver in response to a Coopera<ve SS alert
• There was no significant effect of Display on ATC No<fica<on vs Upload Time for Non-‐Coopera<ve SS alerts, p > .05
• On average, pilots requested an ATC clearance 0.76 seconds a^er uploading a maneuver in response to a Non-‐Coopera<ve alert

D1 D2 D3 D4 Coopera<ve/Predic<ve 2.50 4.86 6.00 4.08
Coopera<ve/Non-‐Predic<ve 8.13 4.67 2.10 -‐7.29
Non-‐Coopera<ve/Predic<ve 0.69 -‐1.66 -‐3.43 -‐4.79
Non-‐Coopera<e/Non-‐Predic<ve 6.92 2.58 -‐0.21 -‐4.38
-‐20.00
-‐15.00
-‐10.00
-‐5.00
0.00
5.00
10.00
15.00
ATC No<fica<on vs Upload Time

Coopera<ve/Predic<ve Coopera<ve/Non-‐Predic<ve Non-‐Coopera<ve/Predic<ve Non-‐Coopera<ve/Non-‐Predic<ve D1 2.50 8.13 0.69 6.92
D2 4.86 4.67 -‐1.66 2.58
D3 6.00 2.10 -‐3.43 -‐0.21
D4 4.08 -‐7.29 -‐4.79 -‐4.38
-‐15.00
-‐10.00
-‐5.00
0.00
5.00
10.00
15.00
ATC No<fica<on vs Upload Time

2.83 2.41
-‐0.48 -‐4.04
6.57
0.23 2.40 4.85
-‐10.00
-‐8.00
-‐6.00
-‐4.00
-‐2.00
0.00
2.00
4.00
6.00
8.00
10.00
12.00
D1 D2 D3 D4 Int_Basic Int_Advanced SA_Basic SA_Advanced
IHITL and PT4 Display Comparison
ATC No<fica<on vs Upload Time

Stages of Pilot DAA Task
Traffic Display Alert (SS or CA)
Pilot No,fies ATC
ATC Approval Pilot Ini,ates Edit
Pilot Uploads Final Edit
Pilot Uploads First Edit
Traffic Alert Removed
T0 T1 T2 T3 T4b T4a T5 T6 UAS Completes
Maneuver
No,fica,on Time
Ini,al Edit Time
(First Upload)
Ini,al Response Time
Compliance Time
Total Edit Time (Final Upload)
Aircra^ Response Time
Alert Dura,on Time
Total Response Time
Approval vs Upload Time
No,fy vs Upload Time
Clearance Approval Time

49.80 48.30 43.50 33.60
0.00
10.00
20.00
30.00
40.00
50.00
60.00
70.00
D1 D2 D3 D4
ATC Approval vs Upload Time
• Across all maneuvers, pilots received a clearance 92.9% of the <me • On average, pilots who received an ATC clearance, did so prior to
maneuvering in response to SS alerts 56.2% of the <me (62.8% overall)
– D1 = 49.8% – D2 = 48.3% – D3 = 43.5% – D4 = 33.6%

-‐2.57 -‐3.21
-‐6.14
-‐9.43
-‐20.00
-‐15.00
-‐10.00
-‐5.00
0.00
5.00
D1 D2 D3 D4
ATC Approval vs Upload Time
• There was a near significant effect of Display on ATC Approval vs Upload Time for all SS alerts, p = .092
• On average, pilots received an ATC clearance 6.46 seconds a^er uploading a maneuver in response to a Predic<ve SS alert

2.18
-‐1.35
-‐5.50
-‐10.19
-‐20.00
-‐15.00
-‐10.00
-‐5.00
0.00
5.00
D1 D2 D3 D4
Non-‐Predic,ve SS Alerts
-‐4.79 -‐4.11
-‐8.28 -‐8.65
-‐20.00
-‐15.00
-‐10.00
-‐5.00
0.00
5.00
D1 D2 D3 D4
Predic,ve SS Alerts
ATC Approval vs Upload Time
• There was no significant effect of Display on ATC Approval vs Upload Time for Predic<ve SS alerts, p >.05
• On average, pilots received an ATC clearance 6.46 seconds a^er uploading a maneuver in response to a Predic<ve SS alert
• There was a significant effect of Display on ATC Approval vs Upload Time for Non-‐Predic<ve SS alerts, p < .05
– No differences between displays were significant
• On average, pilots received an ATC clearance 3.71 seconds a^er uploading a maneuver in response to a Non-‐Predic<ve SS alert

0.57 0.20
-‐2.29
-‐11.79 -‐20.00
-‐15.00
-‐10.00
-‐5.00
0.00
5.00
D1 D2 D3 D4
Coopera,ve SS Alerts
-‐3.20 -‐4.71
-‐7.67
-‐9.23
-‐20.00
-‐15.00
-‐10.00
-‐5.00
0.00
5.00
D1 D2 D3 D4
Non-‐Coopera,ve SS Alerts
ATC Approval vs Upload Time
• There was a near significant effect of Display on ATC Approval vs Upload Time for Coopera<ve SS alerts, p = .070
• On average, pilots received an ATC clearance 3.33 seconds a^er uploading a maneuver in response to a Coopera<ve SS alert
• There was no significant effect of Display on ATC Approval vs Upload Time for Non-‐Coopera<ve SS alerts, p > .05
• On average, pilots received an ATC clearance 6.20 seconds a^er uploading a maneuver in response to a Non-‐Coopera<ve SS alert

D1 D2 D3 D4 Coopera<ve/Predic<ve -‐2.00 -‐1.07 0.00 -‐0.50
Coopera<ve/Non-‐Predic<ve 2.50 -‐1.71 -‐3.50 -‐14.14
Non-‐Coopera<ve/Predic<ve -‐4.47 -‐7.08 -‐9.00 -‐10.00
Non-‐Coopera<e/Non-‐Predic<ve 1.67 -‐2.89 -‐6.36 -‐10.63
-‐25.00
-‐20.00
-‐15.00
-‐10.00
-‐5.00
0.00
5.00
10.00
ATC Approval vs Upload Time

Coopera<ve/Predic<ve Coopera<ve/Non-‐Predic<ve Non-‐Coopera<ve/Predic<ve Non-‐Coopera<ve/Non-‐Predic<ve D1 -‐2.00 2.50 -‐4.47 1.67
D2 -‐1.07 -‐1.71 -‐7.08 -‐2.89
D3 0.00 -‐3.50 -‐9.00 -‐6.36
D4 -‐0.50 -‐14.14 -‐10.00 -‐10.63
-‐20.00
-‐15.00
-‐10.00
-‐5.00
0.00
5.00
10.00
ATC Approval vs Upload Time

-‐2.57 -‐3.21
-‐6.14
-‐9.43
1.70
-‐4.97 -‐2.79 -‐0.03
-‐16.00
-‐14.00
-‐12.00
-‐10.00
-‐8.00
-‐6.00
-‐4.00
-‐2.00
0.00
2.00
4.00
6.00
D1 D2 D3 D4 Int_Basic Int_Advanced SA_Basic SA_Advanced
IHITL and PT4 Display Comparison
ATC Approval vs Upload Time
Stages of Pilot DAA Task
Traffic Display Alert (SS or CA)
Pilot No,fies ATC
ATC Approval Pilot Ini,ates Edit
Pilot Uploads Final Edit
Pilot Uploads First Edit
Traffic Alert Removed
T0 T1 T2 T3 T4b T4a T5 T6 UAS Completes
Maneuver
No,fica,on Time
Ini,al Edit Time
(First Upload)
Ini,al Response Time
Compliance Time
Total Edit Time (Final Upload)
Aircra^ Response Time
Alert Dura,on Time
Total Response Time
Approval vs Upload Time
No,fy vs Upload Time
Clearance Approval Time

7.89 8.28 9.60
7.24
0.00
2.00
4.00
6.00
8.00
10.00
12.00
14.00
D1 D2 D3 D4
Ini<al Response Time
• There was no significant effect of Display on Ini<al Response Time for all SS alerts, p > .05
• Pilots took an average of 8.25 seconds to ini<ate an edit in response to a Predic<ve SS alert

11.92 9.69 8.96 9.43
0.00
5.00
10.00
15.00
20.00
D1 D2 D3 D4
Non-‐Predic,ve SS Alerts
5.46 9.07 8.49
6.57
0.00
5.00
10.00
15.00
20.00
D1 D2 D3 D4
Predic,ve SS Alerts
Ini<al Response Time
• There was no significant effect of Display on Ini<al Response Time for Predic<ve SS alerts, p > .05
• Pilots took an average of 7.40 seconds to ini<ate an edit in response to a Predic<ve SS alert
• There was no significant effect of Display on Ini<al Response Time for Non-‐Predic<ve SS alerts, p > .05
• Pilots took an average of 10.00 seconds to ini<ate an edit in response to a Non-‐Predic<ve SS alert

7.11 5.17
8.25 6.83
0.00
5.00
10.00
15.00
20.00
D1 D2 D3 D4
Non-‐Coopera,ve SS Alerts
10.31 13.80 14.71
8.52
0.00
5.00
10.00
15.00
20.00
D1 D2 D3 D4
Coopera,ve SS Alerts
Ini<al Response Time
• There was no significant effect of Display on Ini<al Response Time for Coopera<ve SS alerts, p > .05
• Pilots took an average of 11.84 seconds to ini<ate an edit in response to a Coopera<ve SS alert
• There was no significant effect of Display on Ini<al Response Time for Non-‐Coopera<ve SS alerts, p > .05
• Pilots took an average of 6.84 seconds to ini<ate an edit in response to a Non-‐Coopera<ve SS alert

D1 D2 D3 D4 Coopera<ve/Predic<ve 10.00 17.71 17.17 6.83
Coopera<ve/Non-‐Predic<ve 10.50 10.83 13.20 11.07
Non-‐Coopera<ve/Predic<ve 5.02 4.98 7.88 6.69
Non-‐Coopera<e/Non-‐Predic<ve 13.43 5.81 9.73 6.70
0.00
5.00
10.00
15.00
20.00
25.00
30.00
Ini<al Response Time

Coopera<ve/Predic<ve Coopera<ve/Non-‐Predic<ve Non-‐Coopera<ve/Predic<ve Non-‐Coopera<ve/Non-‐Predic<ve D1 10.00 10.50 5.02 13.43
D2 17.71 10.83 4.98 5.81
D3 17.17 13.20 7.88 9.73
D4 6.83 11.07 6.69 6.70
-‐5.00
0.00
5.00
10.00
15.00
20.00
25.00
Ini<al Response Time

7.89 8.28 9.60 7.24
21.62 22.09
15.26 18.30
0.00
5.00
10.00
15.00
20.00
25.00
30.00
D1 D2 D3 D4 Int_Basic Int_Advanced SA_Basic SA_Advanced
IHITL and PT4 Display Comparison
Ini<al Response Time

Stages of Pilot DAA Task
Traffic Display Alert (SS or CA)
Pilot No,fies ATC
ATC Approval Pilot Ini,ates Edit
Pilot Uploads Final Edit
Pilot Uploads First Edit
Traffic Alert Removed
T0 T1 T2 T3 T4b T4a T5 T6 UAS Completes
Maneuver
No,fica,on Time
Ini,al Response Time
Compliance Time
Total Edit Time (Final Upload)
Aircra^ Response Time
Alert Dura,on Time
Total Response Time
Approval vs Upload Time
No,fy vs Upload Time
Ini,al Edit Time
(First Upload) Clearance Approval Time

8.33 8.93
2.66
5.24
0.00
2.00
4.00
6.00
8.00
10.00
12.00
D1 D2 D3 D4
Ini<al Edit Time
• There was a significant effect of Display on Ini<al Edit Time for all SS alerts, p < .01 – D3 was significantly faster than D1 and D2
• Pilots took an average of 6.29 seconds to complete their first edit in response to SS alerts

9.02 10.84
2.41 5.17
0.00
2.00
4.00
6.00
8.00
10.00
12.00
14.00
16.00
D1 D2 D3 D4
Non-‐Predic,ve SS Alerts
7.14 8.81
2.18 4.53
0.00
2.00
4.00
6.00
8.00
10.00
12.00
14.00
16.00
D1 D2 D3 D4
Predic,ve SS Alerts
Ini<al Edit Time
• There was a significant effect of Display on Ini<al Edit Time for Predic<ve SS alerts, p < .05
– D3 was significantly faster than D1
• Pilots took an average of 5.67 seconds to complete their first edit in response to Predic<ve SS alerts
• There was a significant effect of Display on Ini<al Edit Time for Non-‐Predic<ve SS alerts, p < .05
– D3 was significantly faster than D1 and D2
• Pilots took an average of 6.86 seconds to complete their first edit in response to Non-‐Predic<ve SS alert

6.84 8.19
2.56 5.77
0.00
2.00
4.00
6.00
8.00
10.00
12.00
14.00
16.00
D1 D2 D3 D4
Non-‐Coopera,ve SS Alerts
12.31 10.30
2.57 2.96 0.00
2.00
4.00
6.00
8.00
10.00
12.00
14.00
16.00
D1 D2 D3 D4
Coopera,ve SS Alerts
Ini<al Edit Time
• There was a significant effect of Display on Ini<al Edit Time for Coopera<ve SS alerts, p < .01
– D3 and D4 were both significantly faster than D1 and D2
– No difference between D1 and D2 – No difference between D3 and D4
• Pilots took an average of 7.04 seconds to complete their first edit in response to Coopera<ve SS alerts
• There was a near significant effect of Display on Ini<al Edit Time for Non-‐Coopera<ve Alerts, p = .056
• Pilots took an average of 5.84 seconds to complete their first edit in response to Non-‐Coopera<ve alerts
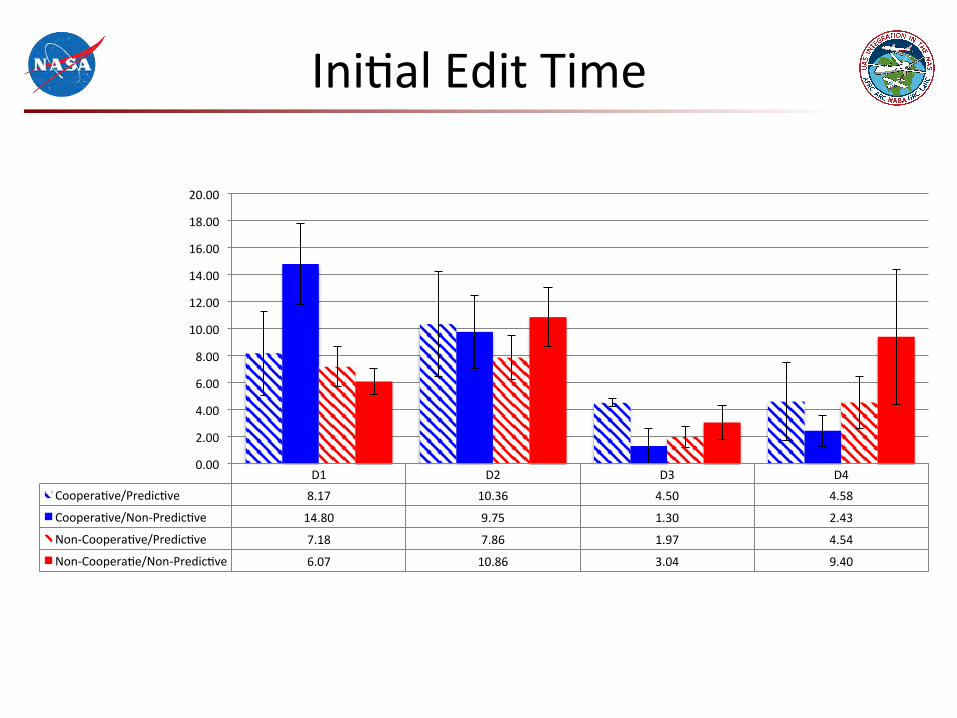
D1 D2 D3 D4 Coopera<ve/Predic<ve 8.17 10.36 4.50 4.58
Coopera<ve/Non-‐Predic<ve 14.80 9.75 1.30 2.43
Non-‐Coopera<ve/Predic<ve 7.18 7.86 1.97 4.54
Non-‐Coopera<e/Non-‐Predic<ve 6.07 10.86 3.04 9.40
0.00
2.00
4.00
6.00
8.00
10.00
12.00
14.00
16.00
18.00
20.00
Ini<al Edit Time

Coopera<ve/Predic<ve Coopera<ve/Non-‐Predic<ve Non-‐Coopera<ve/Predic<ve Non-‐Coopera<ve/Non-‐Predic<ve D1 8.17 14.80 7.18 6.07
D2 10.36 9.75 7.86 10.86
D3 4.50 1.30 1.97 3.04
D4 4.58 2.43 4.54 9.40
-‐5.00
0.00
5.00
10.00
15.00
20.00
Ini<al Edit Time

8.33 8.93
2.66 5.24
17.11
5.51
13.02 11.43
0.00
5.00
10.00
15.00
20.00
25.00
D1 D2 D3 D4 Basic_Int Advanced_Int Basic_SA Advanced_SA
IHITL and PT4 Display Comparison
Ini<al Edit Time

Stages of Pilot DAA Task
Traffic Display Alert (SS or CA)
Pilot No,fies ATC
ATC Approval Pilot Ini,ates Edit
Pilot Uploads Final Edit
Pilot Uploads First Edit
Traffic Alert Removed
T0 T1 T2 T3 T4b T4a T5 T6 UAS Completes
Maneuver
No,fica,on Time
Ini,al Edit Time
(First Upload)
Ini,al Response Time
Compliance Time
Total Edit Time (Final Upload)
Aircra^ Response Time
Alert Dura,on Time
Total Response Time
Approval vs Upload Time
No,fy vs Upload Time
Clearance Approval Time

Total Edit Time
49.80 48.30 43.50 33.60
0.00
10.00
20.00
30.00
40.00
50.00
60.00
70.00
D1 D2 D3 D4
• There was a not significant effect of Display on Total Edit Time for all SS alerts, p > .05
• Pilots took an average of 9.83 seconds to complete their final edit in response to SS alerts

10.63 11.80 12.91 16.12
0.00
5.00
10.00
15.00
20.00
25.00
D1 D2 D3 D4
Non-‐Predic,ve SS Alerts
13.62 11.44 3.68
6.55
0.00
5.00
10.00
15.00
20.00
25.00
D1 D2 D3 D4
Predic,ve SS Alerts
Total Edit Time
• There was a significant effect of Display on Total Edit Time for Predic<ve alerts, p < .05
– D3 was significantly faster than D2, but no different than the other two displays
• Pilots took an average of 8.83 seconds to complete their final edit in response to Predic<ve SS alerts
• There was no significant main effect of Display on Total Edit Time for Non-‐Predic<ve alerts, p > .05
• Pilots took an average of 12.862 seconds to complete their final edit in response to Non-‐Predic<ve SS alerts

11.43 10.38 5.66 5.77
0.00
5.00
10.00
15.00
20.00
25.00
D1 D2 D3 D4
Non-‐Coopera,ve SS Alerts
16.38 12.46
7.50 12.00
0.00
5.00
10.00
15.00
20.00
25.00
D1 D2 D3 D4
Coopera,ve SS Alerts
Total Edit Time
• There was no significant effect of Display on Total Edit Time for Coopera<ve SS alerts, p > .05
• Pilots took an average of 12.08 seconds to complete their final edit in response to Coopera<ve SS alerts
• There was a near significant effect of Display on Total Edit Time for Non-‐Coopera<ve SS alerts, p = .064
• Pilots took an average of 8.31 seconds to complete their final edit in response to Non-‐Coopera<ve alerts

D1 D2 D3 D4 Coopera<ve/Predic<ve 16.33 12.64 14.00 12.17
Coopera<ve/Non-‐Predic<ve 16.40 12.63 2.50 13.64
Non-‐Coopera<ve/Predic<ve 13.26 10.50 2.64 4.54
Non-‐Coopera<e/Non-‐Predic<ve 8.21 10.86 13.17 9.40
0.00
5.00
10.00
15.00
20.00
25.00
30.00
Total Edit Time

Coopera<ve/Predic<ve Coopera<ve/Non-‐Predic<ve Non-‐Coopera<ve/Predic<ve Non-‐Coopera<ve/Non-‐Predic<ve D1 16.33 16.40 13.26 8.21
D2 12.64 12.63 10.50 10.86
D3 14.00 2.50 2.64 13.17
D4 12.17 13.64 4.54 9.40
-‐5.00
0.00
5.00
10.00
15.00
20.00
25.00
30.00
Total Edit Time
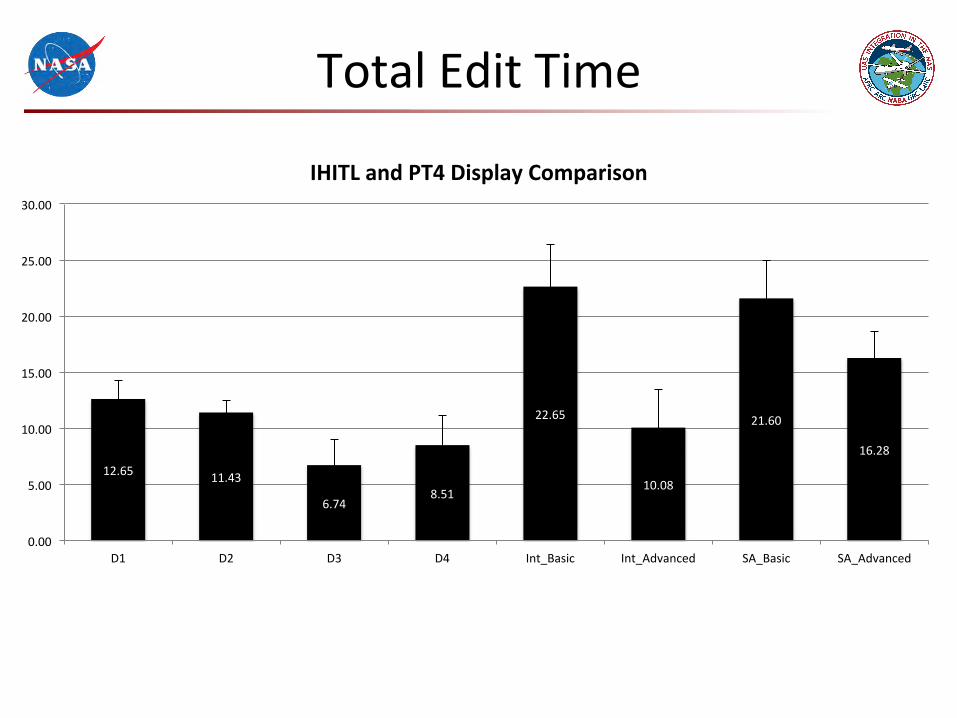
12.65 11.43
6.74 8.51
22.65
10.08
21.60
16.28
0.00
5.00
10.00
15.00
20.00
25.00
30.00
D1 D2 D3 D4 Int_Basic Int_Advanced SA_Basic SA_Advanced
IHITL and PT4 Display Comparison
Total Edit Time

Stages of Pilot DAA Task
Traffic Display Alert (SS or CA)
Pilot No,fies ATC
ATC Approval Pilot Ini,ates Edit
Pilot Uploads Final Edit
Pilot Uploads First Edit
Traffic Alert Removed
T0 T1 T2 T3 T4b T4a T5 T6 UAS Completes
Maneuver
No,fica,on Time
Ini,al Edit Time
(First Upload)
Ini,al Response Time
Compliance Time
Total Edit Time (Final Upload)
Aircra^ Response Time
Alert Dura,on Time
Total Response Time
Approval vs Upload Time
No,fy vs Upload Time
Clearance Approval Time

16.22 17.20
12.26 12.47
0.00
2.00
4.00
6.00
8.00
10.00
12.00
14.00
16.00
18.00
20.00
D1 D2 D3 D4
AircraV Response Time
• There was a near significant effect of Display on AircraV Response Time for all SS alerts, p = .069
• Pilots took an average of 14.54 seconds to upload their first maneuver in response to SS alerts (from first alert appearance)

20.94 20.53
11.37 14.60
0.00
5.00
10.00
15.00
20.00
25.00
30.00
D1 D2 D3 D4
Non-‐Predic,ve SS Alerts
12.59 17.88
10.67 11.11
0.00
5.00
10.00
15.00
20.00
25.00
30.00
D1 D2 D3 D4
Predic,ve SS Alerts
AircraV Response Time
• There was a near significant effect of Display on AircraV Response Time for Predic<ve SS alerts, p = .059
• Pilots took an average of 13.06 seconds to upload their first maneuver in response to Predic<ve SS alerts (from first alert appearance)
• There was a significant effect of Display on AircraV Response Time for Non-‐Predic<ve SS alerts, p < .05
– No differences between displays were significant
• Pilots took an average of 16.86 seconds to upload their first maneuver in response to Non-‐Predic<ve SS alerts (from first alert appearance)

22.63 24.09
17.29 11.48
0.00
5.00
10.00
15.00
20.00
25.00
30.00
D1 D2 D3 D4
Coopera,ve SS Alerts
13.95 13.35 10.81 12.60
0.00
5.00
10.00
15.00
20.00
25.00
30.00
D1 D2 D3 D4
Non-‐Coopera,ve SS Alerts
AircraV Response Time
• There was a significant effect of Display on AircraV Response Time for Coopera<ve SS alerts, p < .01
– D4 was significantly faster than D1 and D2
• Pilots took an average of 18.87 seconds to upload their first maneuver in response to Coopera<ve SS alerts (from first alert appearance)
• There was no significant effect of Display on AircraV Response Time for Non-‐Coopera<ve SS alerts, p > .05
• Pilots took an average of 12.68 seconds to upload their first maneuver in response to Non-‐Coopera<ve SS alerts (from first alert appearance)

D1 D2 D3 D4 Coopera<ve/Predic<ve 18.17 28.07 31.67 11.42
Coopera<ve/Non-‐Predic<ve 25.30 20.58 14.50 13.50
Non-‐Coopera<ve/Predic<ve 12.20 12.84 9.85 11.23
Non-‐Coopera<e/Non-‐Predic<ve 19.50 16.67 12.77 16.10
0.00
5.00
10.00
15.00
20.00
25.00
30.00
35.00
40.00
45.00
AircraV Response Time

Coopera<ve/Predic<ve Coopera<ve/Non-‐Predic<ve Non-‐Coopera<ve/Predic<ve Non-‐Coopera<ve/Non-‐Predic<ve D1 18.17 25.30 12.20 19.50
D2 28.07 20.58 12.84 16.67
D3 31.67 14.50 9.85 12.77
D4 11.42 13.50 11.23 16.10
0.00
5.00
10.00
15.00
20.00
25.00
30.00
35.00
40.00
AircraV Response Time

16.22 17.20 12.26 12.47
38.66
27.50 32.96
29.64
0.00
5.00
10.00
15.00
20.00
25.00
30.00
35.00
40.00
45.00
D1 D2 D3 D4 Int_Basic Int_Advanced SA_Basic SA_Advanced
IHITL and PT4 Display Comparison
AircraV Response Time

Stages of Pilot DAA Task
Traffic Display Alert (SS or CA)
Pilot No,fies ATC
ATC Approval Pilot Ini,ates Edit
Pilot Uploads Final Edit
Pilot Uploads First Edit
Traffic Alert Removed
T0 T1 T2 T3 T4b T4a T5 T6 UAS Completes
Maneuver
No,fica,on Time
Ini,al Edit Time
(First Upload)
Ini,al Response Time
Compliance Time
Total Edit Time (Final Upload)
Aircra^ Response Time
Alert Dura,on Time
Total Response Time
Approval vs Upload Time
No,fy vs Upload Time
Clearance Approval Time
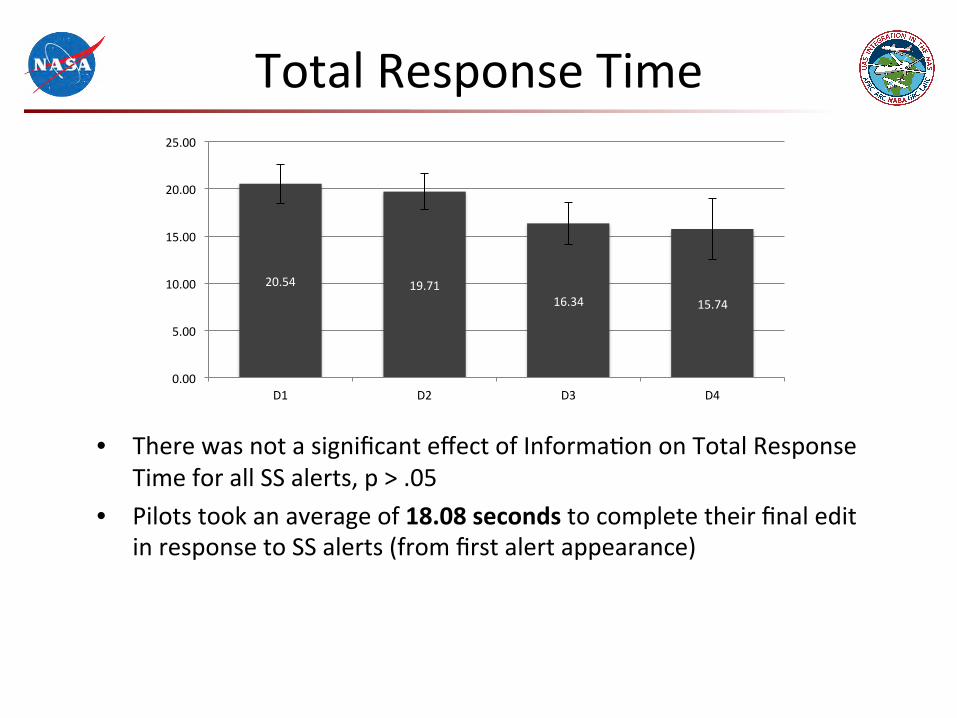
20.54 19.71 16.34 15.74
0.00
5.00
10.00
15.00
20.00
25.00
D1 D2 D3 D4
Total Response Time
• There was not a significant effect of Informa<on on Total Response Time for all SS alerts, p > .05
• Pilots took an average of 18.08 seconds to complete their final edit in response to SS alerts (from first alert appearance)

22.54 21.49 21.87 25.55
0.00
5.00
10.00
15.00
20.00
25.00
30.00
35.00
40.00
D1 D2 D3 D4
Non-‐Predic,ve SS Alerts
19.08 20.52 12.17 13.13
0.00
5.00
10.00
15.00
20.00
25.00
30.00
35.00
40.00
D1 D2 D3 D4
Predic,ve SS Alerts
Total Response Time
• There was a near significant effect of Display on Total Response Time for Predic<ve SS alerts, p = .056
• Pilots took an average of 16.22 seconds to complete their final edit in response to Predic<ve SS alerts (from first alert appearance)
• There was no significant effect of Display on Total Response Time, p > .05
• Pilots took an average of 22.86 seconds to complete their final edit in response to Non-‐Predic<ve SS alerts (from first alert appearance)
18.54 15.55 13.91 12.60
0.00
5.00
10.00
15.00
20.00
25.00
30.00
35.00
40.00
D1 D2 D3 D4
Non-‐Coopera,ve SS Alerts
26.69 26.26 22.21 20.52
0.00
5.00
10.00
15.00
20.00
25.00
30.00
35.00
40.00
D1 D2 D3 D4
Coopera,ve SS Alerts
Total Response Time
• There was no significant effect of Informa<on on AircraV Response Time for Coopera<ve SS alerts, p > .05
• Pilots took an average of 23.92 seconds to complete their final edit in response to Coopera<ve SS alerts (from first alert appearance)
• There was no significant effect of Display on AircraV Response Time for Non-‐Coopera<ve SS alerts, p > .05
• Pilots took an average of 15.15 seconds to complete their final edit in response to Non-‐Coopera<ve SS alerts (from first alert appearance)

D1 D2 D3 D4 Coopera<ve/Predic<ve 26.33 30.36 31.17 19.00
Coopera<ve/Non-‐Predic<ve 26.90 23.46 15.70 24.71
Non-‐Coopera<ve/Predic<ve 18.28 15.48 10.52 11.23
Non-‐Coopera<e/Non-‐Predic<ve 21.64 16.67 22.90 16.10
0.00
5.00
10.00
15.00
20.00
25.00
30.00
35.00
40.00
45.00
Total Response Time
Coopera<ve/Predic<ve Coopera<ve/Non-‐Predic<ve Non-‐Coopera<ve/Predic<ve Non-‐Coopera<ve/Non-‐Predic<ve D1 26.33 26.90 18.28 21.64
D2 30.36 23.46 15.48 16.67
D3 31.17 15.70 10.52 22.90
D4 19.00 24.71 11.23 16.10
0.00
5.00
10.00
15.00
20.00
25.00
30.00
35.00
40.00
Total Response Time

20.54 19.71 16.34 15.74
44.86
32.35 38.68
35.60
0.00
10.00
20.00
30.00
40.00
50.00
60.00
D1 D2 D3 D4 Int_Basic Int_Advanced SA_Basic SA_Advanced
IHITL and PT4 Display Comparison
Total Response Time

Stages of Pilot DAA Task
Traffic Display Alert (SS or CA)
Pilot No,fies ATC
ATC Approval Pilot Ini,ates Edit
Pilot Uploads Final Edit
Pilot Uploads First Edit
Traffic Alert Removed
T0 T1 T2 T3 T4b T4a T5 T6 UAS Completes
Maneuver
No,fica,on Time
Ini,al Edit Time
(First Upload)
Ini,al Response Time
Compliance Time
Total Edit Time (Final Upload)
Aircra^ Response Time
Alert Dura,on Time
Total Response Time
Approval vs Upload Time
No,fy vs Upload Time
Clearance Approval Time
33.00 37.08
29.62 34.59
0.00
5.00
10.00
15.00
20.00
25.00
30.00
35.00
40.00
45.00
50.00
D1 D2 D3 D4
Alert Dura<on Time
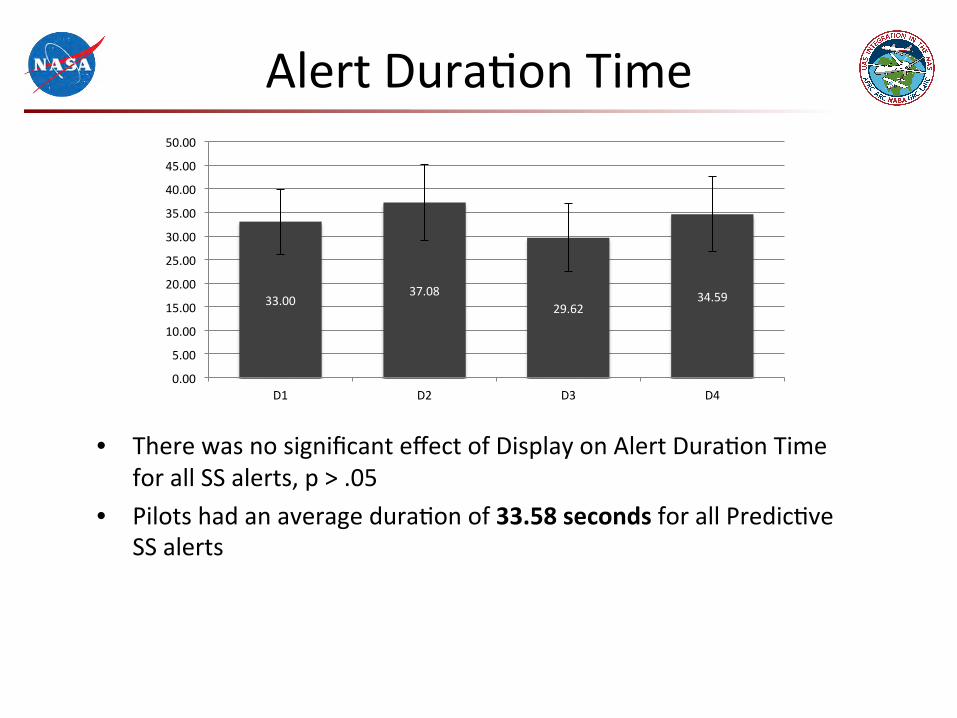
• There was no significant effect of Display on Alert Dura<on Time for all SS alerts, p > .05
• Pilots had an average dura<on of 33.58 seconds for all Predic<ve SS alerts
28.52 33.93 30.10 29.69
0.00 5.00 10.00 15.00 20.00 25.00 30.00 35.00 40.00 45.00 50.00
D1 D2 D3 D4
Non-‐Predic,ve SS Alerts
33.29 36.67 25.81
34.32
0.00 5.00 10.00 15.00 20.00 25.00 30.00 35.00 40.00 45.00 50.00
D1 D2 D3 D4
Predic,ve SS Alerts
Alert Dura<on Time
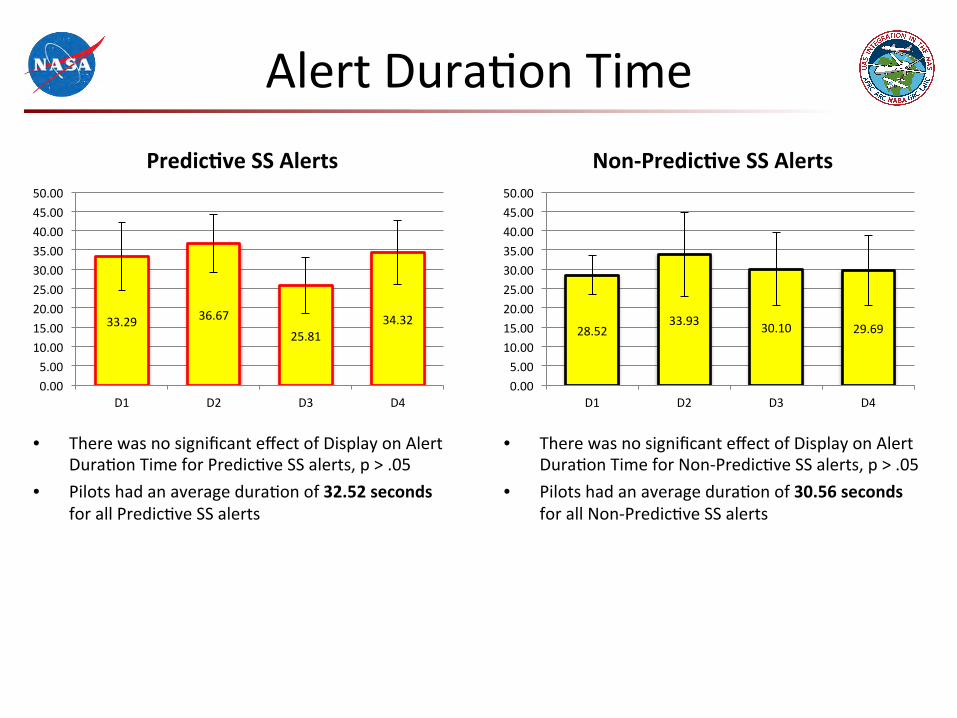
• There was no significant effect of Display on Alert Dura<on Time for Predic<ve SS alerts, p > .05
• Pilots had an average dura<on of 32.52 seconds for all Predic<ve SS alerts
• There was no significant effect of Display on Alert Dura<on Time for Non-‐Predic<ve SS alerts, p > .05
• Pilots had an average dura<on of 30.56 seconds for all Non-‐Predic<ve SS alerts

33.06 33.32 24.46
30.17
0.00
5.00
10.00
15.00
20.00
25.00
30.00
35.00
40.00
45.00
D1 D2 D3 D4
Non-‐Coopera,ve SS Alerts
29.38
43.76 35.14 36.56
0.00
10.00
20.00
30.00
40.00
50.00
60.00
D1 D2 D3 D4
Coopera,ve SS Alerts
Alert Dura<on Time
• There was no significant effect of Display on Alert Dura<on Time for Coopera<ve SS alerts, p > .05
• Pilots had an average dura<on of 36.21 seconds for all Coopera<ve SS alerts
• There was no significant effect of Display on Alert Dura<on Time for Non-‐Coopera<ve SS alerts, p > .05
• Pilots had an average dura<on of 30.25 seconds for all Non-‐Coopera<ve SS alerts

D1 D2 D3 D4 Coopera<ve/Predic<ve 36.67 57.36 55.33 54.08
Coopera<ve/Non-‐Predic<ve 25.00 31.96 19.30 25.07
Non-‐Coopera<ve/Predic<ve 33.87 32.51 21.94 27.79
Non-‐Coopera<e/Non-‐Predic<ve 31.29 22.75 29.52 24.30
0.00
10.00
20.00
30.00
40.00
50.00
60.00
70.00
80.00
Alert Dura<on Time

Coopera<ve/Predic<ve Coopera<ve/Non-‐Predic<ve Non-‐Coopera<ve/Predic<ve Non-‐Coopera<ve/Non-‐Predic<ve D1 36.67 25.00 33.87 31.29
D2 57.36 31.96 32.51 22.75
D3 55.33 19.30 21.94 29.52
D4 54.08 25.07 27.79 24.30
0.00
10.00
20.00
30.00
40.00
50.00
60.00
70.00
Alert Dura<on Time

33.00 37.08
29.62 34.59
57.21
44.91 45.69 46.65
0.00
10.00
20.00
30.00
40.00
50.00
60.00
70.00
D1 D2 D3 D4 Int_Basic Int_Advanced SA_Basic SA_Advanced
IHITL and PT4 Display Comparison
Alert Dura<on Time

Stages of Pilot DAA Task
Traffic Display Alert (SS or CA)
Pilot No,fies ATC
ATC Approval Pilot Ini,ates Edit
Pilot Uploads Final Edit
Pilot Uploads First Edit
Traffic Alert Removed
T0 T1 T2 T3 T4b T4a T5 T6 UAS Completes
Maneuver
No,fica,on Time
Ini,al Edit Time
(First Upload)
Ini,al Response Time
Compliance Time
Total Edit Time (Final Upload)
Aircra^ Response Time
Alert Dura,on Time
Total Response Time
Approval vs Upload Time
No,fy vs Upload Time
Clearance Approval Time

39.63 43.57
33.24 33.67
0.00
5.00
10.00
15.00
20.00
25.00
30.00
35.00
40.00
45.00
50.00
D1 D2 D3 D4
Compliance Time
• There was a significant effect of Display on Compliance Time for all SS alerts, p < .05 – No differences between displays were significant
• Pilots took an average of 37.53 seconds to fully complete a maneuver in response to SS alerts (alert to end of aircraV maneuver)

41.57 43.89 36.25
42.21
0.00
10.00
20.00
30.00
40.00
50.00
60.00
D1 D2 D3 D4
Non-‐Predic,ve SS Alerts
40.36 46.06
32.59 31.37
0.00
10.00
20.00
30.00
40.00
50.00
60.00
D1 D2 D3 D4
Predic,ve SS Alerts
Compliance Time
• There was a significant effect of Display on Compliance Time for all SS alerts, p < .05
– No differences between displays were significant
• Pilots took an average of 37.60 seconds to fully complete a maneuver in response to Predic<ve SS alerts (alert to end of aircraV maneuver)
• There was no significant effect of Display on Compliance Time for Non-‐Predic<ve SS alerts, p > .05
• Pilots took an average of 41.03 seconds to fully complete a maneuver in response to Non-‐Predic<ve SS alerts (alert to end of aircraV maneuver)

40.28 41.42 31.85 32.69
0.00
10.00
20.00
30.00
40.00
50.00
60.00
D1 D2 D3 D4
Non-‐Coopera,ve SS Alerts
39.21 47.96
35.21 34.67
0.00
10.00
20.00
30.00
40.00
50.00
60.00
D1 D2 D3 D4
Coopera,ve SS Alerts
Compliance Time
• There was no significant effect of Display on Compliance Time for Coopera<ve SS alerts, p > .05
• Pilots took an average of 39.27 seconds to fully complete a maneuver in response to Coopera<ve SS alerts (alert to end of aircraV maneuver)
• There was no significant effect of Display on Compliance Times for Non-‐Coopera<ve SS alerts, p > .05
• Pilots took an average of 36.56 seconds to fully complete a maneuver in response to Non-‐Coopera<ve SS alerts (alert to end of aircraV maneuver)

D1 D2 D3 D4 Coopera<ve/Predic<ve 48.50 59.50 37.67 38.25
Coopera<ve/Non-‐Predic<ve 35.50 40.13 33.40 37.64
Non-‐Coopera<ve/Predic<ve 39.91 42.38 31.88 29.80
Non-‐Coopera<e/Non-‐Predic<ve 48.08 44.70 35.48 39.00
0.00
10.00
20.00
30.00
40.00
50.00
60.00
70.00
80.00
Compliance Time

Coopera<ve/Predic<ve Coopera<ve/Non-‐Predic<ve Non-‐Coopera<ve/Predic<ve Non-‐Coopera<ve/Non-‐Predic<ve D1 48.50 35.50 39.91 48.08
D2 59.50 40.13 42.38 44.70
D3 37.67 33.40 31.88 35.48
D4 38.25 37.64 29.80 39.00
0.00
10.00
20.00
30.00
40.00
50.00
60.00
70.00
Compliance Time

39.63 43.57 33.24 33.67
84.79
59.18
73.50 68.25
0.00
10.00
20.00
30.00
40.00
50.00
60.00
70.00
80.00
90.00
100.00
D1 D2 D3 D4 Int_Basic Int_Advanced SA_Basic SA_Advanced
IHITL and PT4 Display Comparison
Compliance Time