national aeronautics and space a … · as the test medium. the test nrocedure consisted of the...
TRANSCRIPT

NATIONAL AERONAUTICS AND SPACE A-DMINISTRATION
DOCUMENT NO. TR-196-005
, ,' DATE June 6,1972
t p '
N"a a a
--
SUMMARY REPORT "
Pneumatic Impact Test
Evaluation of the Behavior of,
Nonmetallic Materials in Hydrogen N
'\
,'
Ii
;":
4
, IOOOOO I
MANNED 'SPACECRAFTUWETER
WHITE SANDS TEST FACILITY LAS CRUCES, NEW MEXICO
::(NS-M--32)PNEUMATIC IMPACT TESTS. N76-72768::.:,EVALUATION O THE BEHAVIOR OF NONETALLIC ,:-ATERIALS IN HYDROGEN Summary Report No. 5
(NASA) 142 p REPRODUCED BY Unclas
.. .. NATIONAL TECHNICAL 0/98. 17230 INFORMATION SERVICE
(JUN U.S. DEPARTMENT OF COMMERCE,2026A 66) - _.M SPRIiGFIELD,-VA. 22161
https://ntrs.nasa.gov/search.jsp?R=19760067727 2018-07-12T22:05:07+00:00Z

N76-72768111lIIIIIIIIIIIIIJIIIIlf 111IIIl
Document No. :TR-196-005
Date : June 6,,1972
SUMMIARY REPORT
Pneumatic Impact Tests
Evaluation of the Behavior of Nonmetallic Materials in Hydrogen
Prepared by: __ _ _ _ _
RD7L.D. Smith _
Test P ograms Office
Approved by: g /R.R. Tillett, Chief
Test Programs Office

1.0 INTRODUCTION
"-)This test report is the fifth in a series of reports describing the results of tests conducted to evaluate the behavior of nonmetallic materials in hydrogen. This report summarizes the results of the pneumatic impact test (Test H) outlined in Test Plan TP-WSTF-196. The pneumatic impact test simulates the conditions resUlting from the sudden release of high pressure on non-metallic materials within and outside pressure systems. The test is based upon MSC-PA-D-67-13 Test Number 10 which is designed to evaluate the reaction sensitivity of a material exposed to a pneumatic shock (step function) in oxygen systems. In this study performed for the NASA Aerospace Safety Reseach and Data Institute (ASRDI) and NASA WSTF, ten nonmetallic materials were evaluated to establish baseline data on the behavior of nonmetallic materials in hydrogen and to characterize, on an initial basis, one mode of material failure considered to be a factor pertinent to the safe use of a material in hydrogen.t
2.0 SUMMARY
During May 1972, ten non-metallic materials were subjected to the pneumatic impact test. The tests were conducted following the procedure outlined in the Test Directive, TD-MIS-006, Revision B, using both GHe (baseline) and GH2 as the test medium. None of the materials were significantly affected by the tests conducted using an impact pressure of 6,000 psia. Cellulose acetate butyrate, nylon, PRC polyurethane and polyethylene all exhibited surface melting as a result of the test. The samples of RTV-90 and polyvinyl chloride exhibited brown outer edges following the tests conducted in both test media. In addition the samples of polyvinyl chloride tested in GH2 were colored a light green. In general the baseline tests conducted using helium produced a greater effect upon the samples than the tests conducted using hydrogen because of the higher temperature generated by the compression of helium.
3.0 TEST MATERIALS
3.1 Test Specimens: The following nonmetallic materials were examined by the pneumatic impact test:
WSTF Identification No. Material
71-2992 FEP Teflon 71-3071 TFE Teflon 713072 15% Glass-Filled TFE Teflon 71-3073 High Density Polyethylene 71-2977 RTV-90 Silicone Rubber 72-3393 71-3070 Viton-A 71-3074 Nylon 6 71-2978 PRC Polyurethane 71-3075 Polyvinyl Chloride 71-3198 Cellulose Acetate Butyrate
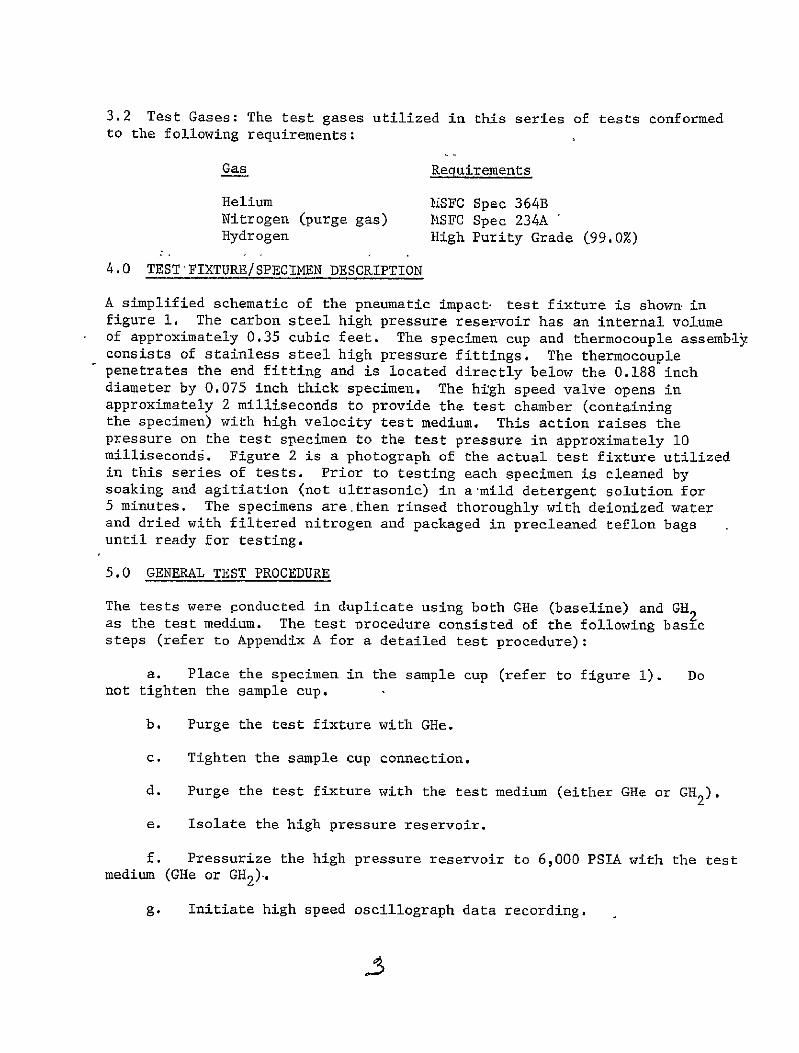
3.2 Test Gases: The test gases utilized in this series of tests conformed
to the following requirements:
Gas Requirements
Helium YSFC Spec 364B Nitrogen (purge gas) MSFC Spec 234A Hydrogen High Purity Grade (99,0%)
4.0 TESTrIXTURE/SPECIMEN DESCRIPTION
A simplified schematic of the pneumatic impact. test fixture is shown in figure 1. The carbon steel high pressure reservoir has an internal volume of approximately 0.35 cubic feet. The specimen cup and thermocouple assembly consists of stainless steel high pressure fittings. The thermocouple penetrates the end fitting and is located directly below the 0.188 inch diameter by 0.075 inch thick specimen. The high speed valve opens in approximately 2 milliseconds to provide the test chamber (containing the specimen) with high velocity test medium. This action raises the pressure on the test specimen to the test pressure in approximately 10 milliseconds. Figure 2 is a photograph of the actual test fixture utilized in this series of tests. Prior to testing each specimen is cleaned by soaking and agitiation (not ultrasonic) in a mild detergent solution for 5 minutes. The specimens are then rinsed thoroughly with deionized water and dried with filtered nitrogen and packaged in precleaned teflon bags until ready for testing.
5.0 GENERAL TEST PROCEDURE
The tests were ponducted in duplicate using both GHe (baseline) and GH2 as the test medium. The test nrocedure consisted of the following basic steps (refer to Appendix A for a detailed test procedure):
a. Place the specimen in the sample cup (refer to figure 1). Do not tighten the sample cup.
b. Purge the test fixture with GHe.
c. Tighten the sample cup connection.
d. Purge the test fixture with the test medium (either GHe or GH2).
e. Isolate the high pressure reservoir.
f. Pressurize the high pressure reservoir to 6,000 PSIA with the test medium (GHe or GH2).
g. Initiate high speed oscillograph data recording.
._s

h. Subject the specimen to five pneumatic impact cycles consistingof the following sequence of events every twelve seconds.
T=O open high speed valve T+2 see close high speed valve T+6 see open vent valve T+i sec close vent valve
i. Terminate oscillograph data recording.
j. Vent high pressure reservoir to ambient pressure.
k. Purge test fixture with GHe.
1. Remove test specimen and examine for evidence of reaction (i.e.odor, discoloration, combustion, etc.)
6.0 TEST RESULTS
Figure three illustrates the data recorded during a typical test. Thefigure shows the sequenced operation of the high pressure isolation valveand the test specimen temperature and pressure during the test. Thefigure shows that the specimen temperature increases with each high pressure impact. Table I lists the initial and maximum temperature and maximum pressure data recorded on an oscillograph for each of the tests.Table I also lists the data from two baseline tests run without a specimen in the test fixture. The data from these tests indicates a temperature rise of approximately 30OF is obtained in either test medium.small temperature rise is not
This a true indication of the temperatue exposedto the test specimen since the thermocouple is shielded and the testfixture surrounding the specimen area acts as a very large heat-sink forthe small quantity (less than 1.2 cubic inches) of hot gas. Dr. R.E.Bruce in a study of the gaseous oxygen pneumatic impact system.contract NAS 9-95390) stated that the gas temperature may be closelyapproximated by the following equation (isentropic compression):
pf y-l
( - t-- ) Y-Tf = To
0
Tf = final gas temperature (OK)
T = initial gas temperature (OK) Pf = final gas pressure (PSIA)
Po = initial gas pressure (PSIA)
y = ratio of speciftc heat at constant pressure to the specific heatat constant volume for each gas (H2 = 1.4; He = 1.7)

Using the above equation the gas temperature at 6,000PSIA should be approximately 2400tF using GH and 5400OF using GHe as the test medium. The temperatures measured do Koiqever, reflect the relative temperatureof the area adjacent to the test specimen and would adequately indicate the "burning" of a specimen if sufficient material were consumed in the reaction.
A review of the temperature data listed in Table I indicates that onlyone material, RTV-90, exhibited a large (greater than 200F) temperatureincrease during the tests. Test numbers 31 and 38 performed usingGH2on specimens of the RTV-90 prepared at WSTP (WSTF material identification number 71-2997) indicated temperature increases up to 290 F.These tests were conducted using RTV-90 that contained a considerable number of bubbles. In order to eliminate the effect of possible entrainedOr trapped gases, tests 44 through 47 were performed on'RTV-90 purchasedfree from bubbles (WSTF material identification number 72-3393). Test numbers 44 through 46 subjected the RTV-90 to the standard sequence.of five impacts while test number 47 subjected the material to 10 impacts.Only two of these four tests, numbers 54 and 47, indicated any appreciabletemperature rise. In both cases the temperature rise was experienced -toward the end of the impact sequence. Post test visual examination ofthe specimens from these two tests under low magnification (approximately15X) showed the edges of the spetimen from test number 47 were dark brown and light brown on the specimen from test number 45. This andother observations prompted visual examination of all the specimensunder low magnification. Table II is a summary of the post test visual observations made on each test specimen. Several of the materials,cellulose acetate butyrate, nylon, PRC polyurethane and polyethyleneexhibited bright melted sujface with the specimens from the helium tests showing the greater change from the original (pre-test) condition. Figures four and five are photographs of the cellulose acetate butyrate and PRC polyurethane specimens. Each photograph clearly showsthe differences among the original mdtrial and the spdcimens from-thehelium and hydrogen tests. The parallel marking on the-specimens are a result of the formation process and are-not a result of the test. Visual examination of the polyvinyl chloride specimen shown in figuresix suggests that-some surface reaction probably occured during
the hydrogen tests as evidenced by the light green colored surface and the brown edges on the specimen. This condition was not observed on thespecimens from the helium tests. The RTV-90 specimens also indicate the higher temperatures experienced during the helium tests by thedark brown edges on the specimens from tests 8 and 12. The intensity'of the brown edges on this specimen subjected to 10 impacts in H2 issimilar to that observed on the specimens from the helium test.

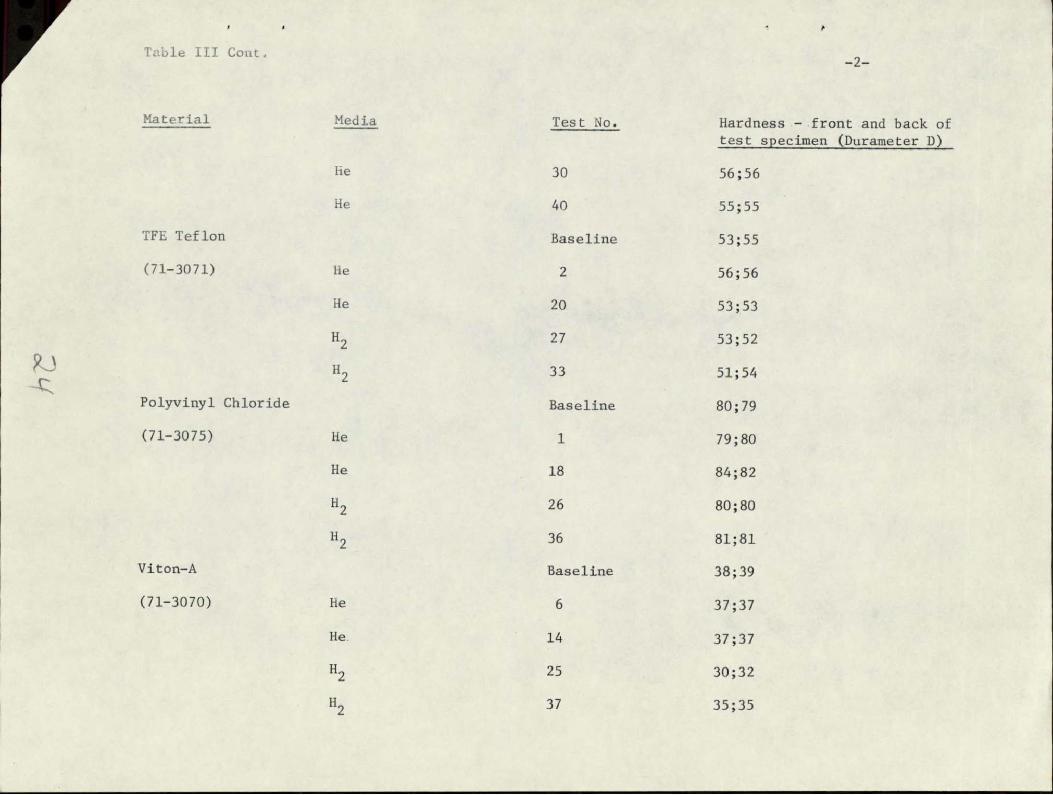
A post test examination of the specimens for a change in hardness was also conducted following the general procedure outlined by ASTM D'1706. The results of the hardness tests are listed in Table III. As a consequenceof the pneumatic impact specimen size the provisions of ASTM D-1706 relative to the size of the hardness specimen could not be met. The hardness data are therefore considered to reflect the relative hardness of the specimenand the original material. A review of the data listed in Table III indicates that only the hardness of the polyethlylene specimens was altered by the test c6nditions. The hai~dness of the polyethlylene specimens was reduced by approximately 20% on the specimens tested in both GHe and GH2.
7.0 CONCLUSIONS'AND RECObMENDATIONS
The pneumatic impact test indicated that none of the ten nonmetallic materials evaluated exhibited severe reactions at 6,000 PSIA impact pressure. Four of the materials, cellulose acetate butyrate, nylon, -PRC polyurethane, and polyethylene, all exhibited surface melting as a. result of the test. The baseline tests conducted using He produced a greater effect upon the damples than the tests conducted using H2. The samples of RTV-90 also exhibited change as a result of the tests by the form of brown outer edges with the specimens from the helium tests showingthe greater effect- The samples of polyvinyl chloride indicated a reaction occured in the hydrogen tests through the formation of a light greensurface color change and the presence of brown edges on the specimens. In summary it is concluded that the tests conducted in helium were more severe than the tests conducted in hydrogen due to the higher temperature generatedby rapid compression of the test media. It is also concluded that the materials examined satisfactorily passed the pneumatic impact test conducted as a parallel to the oxygen pneumatic impact test described by MSC-PA-D-67-13.
It is recommended that further pneumatic impact testing be conducted at higher pressures if warranted by potential use conditions. Because of the unanticipated but predictable test results obtained during the helium tests, consideration should be given to the occurance of pneumatic impact events within helium systems and its possible consequence.
8.0 DISTRIBUTION No of Copies
RA/Manager, WSTF 1 RC/Chief, Engineering Office 2 RD/Chief, Test Programs Office 4 RF/Chief, Laboratories Office 2 NH/Chief, Quality Assurance Office 1 ES5/R.L. Johnston 1 PD9/j. Craig 1 KT/T.P. Larkin 1

NB! C. J. Katsikas 1
Dynalectron
H. Fearing R. Sadler
J. Boykin
Documentation
1 2
2
13
NASA Aerospace Safety Research & Data Institute
10
NASA Lewis Research Center 21000 Brookpark Road Cleveland, Ohio 44135
Attn: I.Irving Pinkel

PRESSURE
RESERVOIR
PURGE VALVE
%/HIGH SPEED VALVE
PURGE GAS 1
STEST
VENT
CHAMBER
VALVE TO VEN
PRESSURE
SENSOR
ZLE CUP
THERMOCOUPLE
PNEUMATIC IMPACT TEST
FIGURE I
FIXTURE SCHEMATIC
A,

i;!%§1
"iiiii~i~ iiiii~iiiiiiiiiiiiiiii " iili~i~~iiiiiiiiiiiiiiiiiiiiii~ ...... i
I i ~iiiiiiiiiiiiiiiiiiiiiiiii
Iil~iiiiiiii i..... Siiiiiii£ R
Siiiiiii ii~~i%
S i iiiS
Siur S
PSD4TCIPCTTS ITR

4FIGURE CELLULOSE ACETATE BUTYRATE POST TESTSPECIMENS (left to right - ORIGINAL -,HELIUH - HYDROGEN)

FIGURE 5 PRC POLYURETHANE POST TEST SPECIMENS(left to right - ORIGINAL - HE'lIU -HYDROGEN)

FIGURE 6 POLYVINYL CHLORIDE POST TEST SPECIMENS (left to right - ORIGINAL - HELIUM -UYPoGlt7

Table I: Pneumatic Impact Test Data
Material Media Test Impact Maximum Initial Maximum AT No. No. Impact Temp. Temp. (Max. - initial)
Empty test fixture
Pressure (PSIA)
(OF) (OF) (OF)
He 13 1 5980 65 104 39 23 4
5930 5860 5860
74 74 74
104109 109
30 35 35
5 5830 82 109 27 23 521 6000 76 100 24
2 5900 80 104 24 3 5900 80 109 29
4 5
5900 ,5,860
80 84
113 113
33 29
Cellulose Acetate
Butyrate (71-3198) He 10 1 6030 67 78 11
2 6030 74 82 8 3 5980 74 82 8 4 5930 74 82 8 5 5930 78 84 6
He 21 1 6000 82 86 4 2 5960 82 88 6 3 5930 82 88 6 4 5930 82 88 6
H 2 22 r 1
5860 5980
88 76
94 84
6 8
2 5900 80 84 4 3 5880 80 84 4 4 5880 80 88 8
H2 34 5 1
5830 5980
84 78
88 82
4 4
2 5980 78 86 8 3 4
5930 5880
82 82
86 90
4 8
5 5830 86 90 4
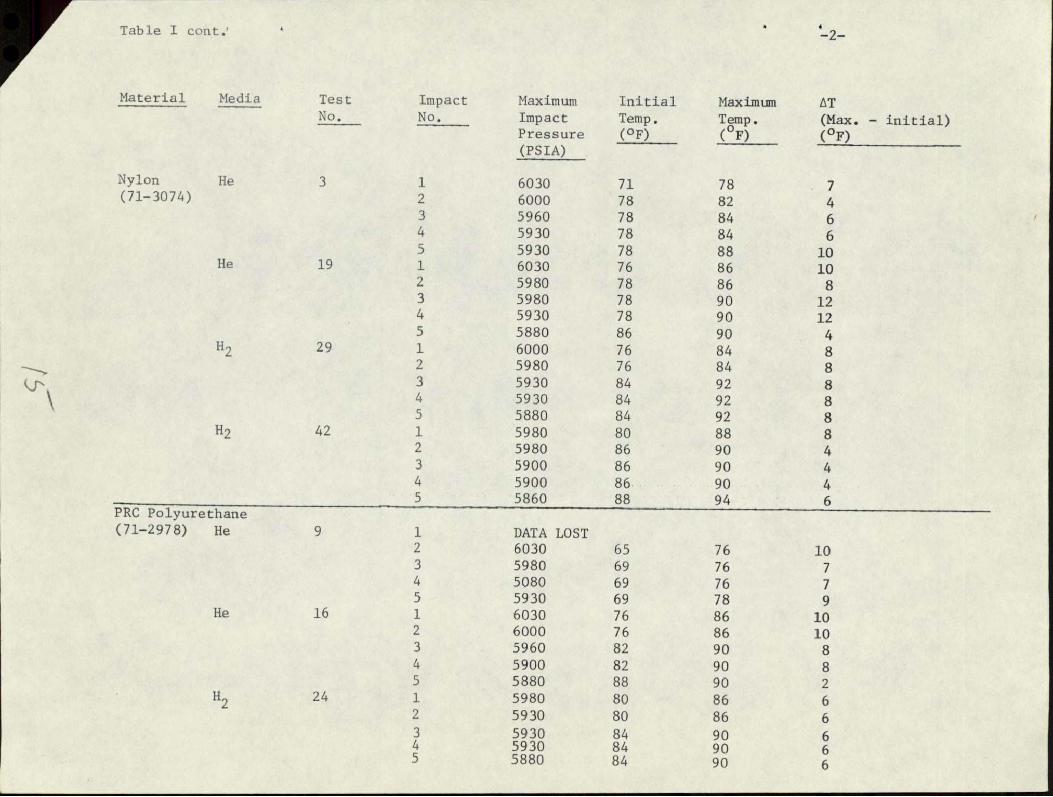
Table I cont. -2T--2--F F
Material Media Test Impact Maximum Initial Maximum AT No. No. Impact Temp. Temp. (Max. - initial)
Pressure (OF) (0F)__!____ (OF)
(PSIA)
Nylon He 3 1 6030 71 78 7 (71-3074) 2 6000 78 82 4
3 5960 78 84 6 4 5930 78 84 6 5 5930 78 88 10
He 19 1 6030 76 86 10 2 5980 78 86 8 3 5980 78 90 12 4 5930 78 90 12 5 5880 86 90 4H2 29 1 6000 76 84 8 2 5980 76 84 8 3 5930 84 92 8 4 5930 84 92 8 5 5880 84 92 8
H2 42 1 5980 80 88 8 2 5980 86 90 4 3 5900 86 90 4 4 5900 86 90 4 5 5860 88 94 6PRC Polyurethane
(71-2978) He 9 1 DATA LOST 2 6030 65 76 10 3 5980 69 76 7 4 5080 69 76 7 5 5930 69 78 9
He 16 1 6030 76 86 10 2 6000 76 86 10 3 5960 82 90 8 4 5900 82 90 8 5 5880 88 90 2
H2 24 1 5980 80 86 6 2 5930 80 86 6 3 5930 84 90 6 4 5930 84 90 65 5880 84 90 6

Table I cont. -3-
Material Media Test Impact Maximum Initial Maximum AT T0. No. Impact Temp. Temp. (Max. - initial)
Pressure (OF) (8F) (OF) (PSIA)
112 35 1 6030 82 88 6 2 5960 82 88 6 3 5960 82 90 8 4 5930 82 90 8 5 5880 82 94 12
Polyethylene He 7 1 6040 69 73 4 (71-3073) 2 6040 69 73 4
3 6040 69 73 4 4 5980 73 82 9 5 5930 73 82 9
He 17 1 5980 61 74 13 2 5980 69 80 11 3 5930 69 80 11 4 5930 69 80 11 5 5880 69 80 11
H2 30 1 6000 78 84 6 2 5980 80 86 6 3 5980 84 86 2 4 5930 84 86 2 5 5930 84 90 6
H2 40 1 6000 69 78 9 2 5980 74 82 8 3 5930 74 86 12 4 5930 78 86 8 5 5880 78 86 8
TFE Teflon He 2 1 6030 69 78 9 (71-3071) 2 6030 74 78 4
3 5960 74 78 4 4 5960 74 84 10 5 5960 78 84 6
He 20 1 6000 76 84 8 2 6000 80 84 4 3 5960 84 88 4 4 5900 84 92 8 5 5860 88 92 4

'able L cont. -4-
Material Media Test Impact Maximum Initial Maximnm T No. No. Impact Temp. Temp. (Max. - initial)
Pressure (OF) (OF) (OF) (PSIA)
H2 27 1 6060 71 80 9 2 6000 71 82 11 3 5960 78 86 8 4 5930 78 90 12 5 5900 78 90 12
H2 33 1 5980 74 76 2 2 5930 74 76 2 3 5930 76 82 6 4 5880 76 82 6 5 5880 76 86 10
Polyvinyl chloride (71-3075) He 1 1 6080 71 80 9
2 5980 71 82 9 3 5930 74 82 8 4 5930 78 86 8 5 5900 76 86 10
He 18 1 6060 67 78 11 2 6000 71 84 13 3 6000 71 84 13 4 5930 73 84 11 5 5930 78 88 10
H2 26 1 6000 65 74 9 2 5960 69 74 5 3 5930 71 78 7 4 5880 80 82 2 5 5860 80 82 2
H2 36 1 5980 82 86 4 2 5980 82 86 4 3 5930 82 92 10 4 5900 86 96 10 5 5960 86 96 10
Viton-A He 6 1 6080 69 80 11 (71-3070) 2 6040 69 80 11
3 6040 69 80 11 4 5950 73 86 13
5 5950 73 86 13
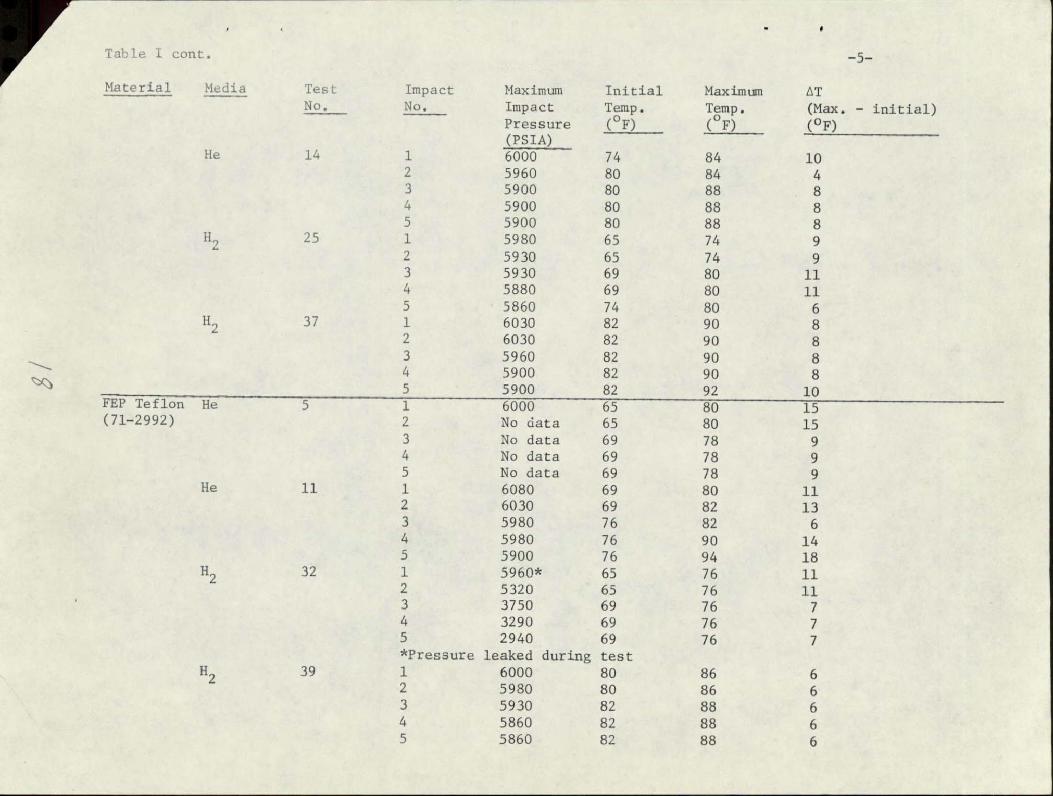
Table I cont.
Material Media Test Impact Maximum Initial Maximum AT No. No. Impact Temp. Temp. (Max. - initial)
Pressure (0F) (OF) (OF) (PSIA)
He 14 1 6000 74 84 10 2 5960 80 84 4 3 5900 80 88 8 4 5900 80 88 8 5 5900 80 88 8
H2 25 1 5980 65 74 9 2 5930 65 74 9 3 5930 69 80 11 4 5880 69 80 11 5 5860 74 80 6
H2 37 1 6030 82 90 8 2 6030 82 90 8 3 5960 82 90 8 4 5900 82 90 8 5 5900 82 92 10
FTP Teflon He 5 1 6000 65 80 15 (71-2992) 2 No data 65 80 15
3 No data 69 78 9 4 No data 69 78 9 5 No data 69 78 9
He 11 1 6080 69 80 11 2 6030 69 82 13 3 5980 76 82 6 4 5980 76 90 14 5 5900 76 94 18
H2 32 1 5960* 65 76 11 2 5320 65 76 11 3 3750 69 76 7 4 3290 69 76 7 5 2940 69 76 7 *Pressure leaked during test
H2 39 1 6000 80 86 6 2 5980 80 86 6 3 5930 82 88 6 4 5860 82 88 6 5 5860 82 88 6

Table I coat. -6-
Material Media Test Impact Maximum Initial Maximum AT No. No. Impact Temp. Temp. (Max. - initial)
Pressure (OF) (OF) (OF) (PSIA)
H2 43 1 6000 82 94 12 2 6000 88 96 8 3 5960 88 96 8 4 5900 88 96 8 5 5860 88 100 12
15% Glass filled TFE Teflon (71-3072) He 4 1 6040 96 8104
2 5920 96 104 8 3 5920 96 104 8 4 5920 102 ill 9 5 5820 102 ill 9
He 15 1 5980 78 90 12 2 5960 78 94 16 3 5900 82 94 12 4 5880 90 94 4 5 5830 90 94 4
H2 28 1 5980 74 84 10 2 5930 74 86 12 3 5930 78 88 10 4 5880 78 90 12 5 5880 84 94 10
H2 41 1 6000 84 94 10 2 5960 84 94 10 3 5930 84 94 10 4 5930 86 94 10 5 5860 86 98 12
RTV-90 He 8 No data No data No data No dataNo data (71-2977) He 12 1 5980 65 76 11
2 5930 69 80 11 3 5880 69 80 11 4 5880 65 82 17 5 5830 74 82 8
H2 31 1 6030 78 88 10 2 5980 82 88 6
5980 82 ill 29 5930 88 115 275 5880 82 111 29
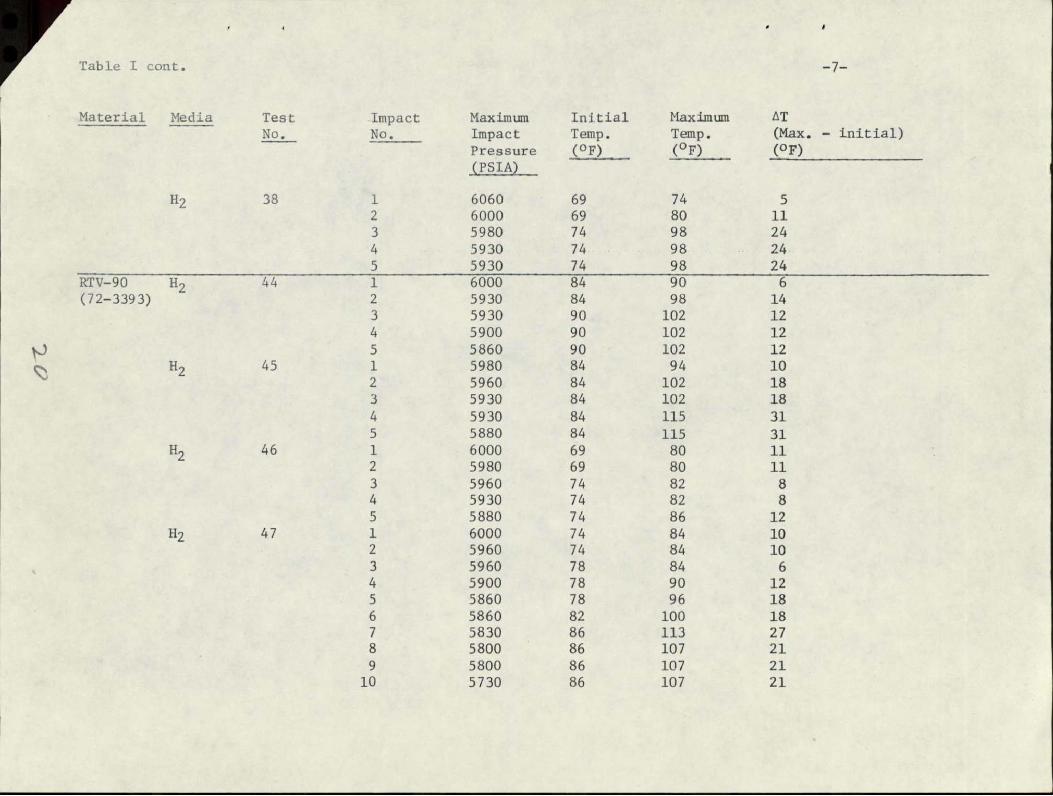
Table I cant.
Material Media
12
RTV-90 (72-3393)
12
H2
H2
H2
Test No.
38
44
45
46
47
Impact No.
1 2 3 4 5 1 2 3 4 5 1 2 3 4 5 1 2 3 4 5 1 2 3 4 5 6 7 8 9
10
Maximum Impact Pressure (PSIA)
6060 6000 5980 5930 5930 6000 5930 5930 5900 5860 5980 5960 5930 5930 5880 6000 5980 5960 5930 5880 6000 5960 5960 5900 5860 5860 5830 5800 5800 5730
Initial Temp. (OF)
69 69 74 74 74 84 84 90 90 90 84 84 84 84 84 69 69 74 74 74 74 74 78 78 78 82 86 86 86 86
Maximum Temp. (OF)
74 80 98 98 98 90 98 102 102 102 94
102 102 115 115 80 80 82 82 86 84 84 84 90 96 100 113 107 107 107
-7-
AT (Max. - initial) (OF)
5 11 24 24 24 6 14 12 12 12 10 18 18 31 31 11 11 8 8 12 10 10 6 12 18 18 27 21 21 21

Table II: Post Test Visual Appearance of Test Specimen
Material
Cellulose Butyrate (71-3198)
Nylon (71-3074)
PRC Polyurethane(71-2978)
Polyethylene (71-3073)
TFE Teflon (71-3071)
Polyvinyl chloride (71-3075)
Viton-A(71-3070)
Media
He He H2 H2 He He H2 H2 He
He
H2
H 2
He
He
H2
H2 He It2 H2 He He H2 H2 HeHe
Test No.
10 21 22 34 3
19 29 42 9
16
24
35
7
17
30
40 2
27 33 1
18 26 36 6
14
Post Test Visual Appearance of specimen compared to orginal condition (15X
magnification)
Melted surface-brown spots Melted surface-brown spots Melted surface Melted surface Melted edges Melted edges Bright melted edges Bright melted edges Specimen light yellow-bright melted surface Specimen light yellow-bright melted surface Specimen light yellow-bright
melted surface Specimen light yellow-bright melted surface
Bright surfaceBright surface
Dull surface
Dull surface No change from pre-test conditions No change from pre-test conditions No change from pre-test conditions Bright surface Bright surface Surface green colored with brown edges Surface green colored with brown edgesNo change from pre-test conditions No change from pre-test conditions

Table II Cont.
Material
FEP Teflon (71-2992)
15% Glass-filled TFE Teflon
(71-3072)
RTV-90 (71-2977)
RTV-90 (72-3393)
*Ten impacts
Media
H2 H2 He He H2 H12 H2
lie
He R2 H2
He He H2 H 2 H2 H2 H 2 H2
Test No.
25 37 5
11 32 39 43
4
15 28 41
8 12 31 38 44 45 46 47*
-2-
Post Test Visual Appearance
of Specimen compared to original condition (15X magnification)
No change from pre-test conditions No change from pre-test conditions No change from pre-test conditions No change from pre-test conditions No change from pre-test conditions No change from pre-test conditions No change from pre-test conditions
No change from pre-test conditions
No change from pre-test conditions No change from pre-test conditions No change from pre-test conditions
Brown edges Brown edges Light brown edges Light brown edges Light brown edges Light brown edges Light brown edges Dark brown edges

V I p
Table III: Post Test Hardness of Test Specimens
Material
Cellulose Acetate Butyrate
(71-3198)
Nylon
(71-3074)
PRC Polyurethane
(71-2978)
Polyethylene
(71-3073)
dia T
Baseline
He 10
He 21
H2 22
H2 34
Baseline
He 3
He 19
H2 29
H2 42
Baseline
He 9
He 16
H2 24
H 2 35
Baseline
He 7
He 17
Hardness - front and back of test specimen (Durameter D
78;78
78;78
79;75
78;78
77;80
82;81
80;81.
81;81
82;81
81;81
30;30
34;32
30;30
30;26
30;28
65;64
55;55
53;51
i t
IITable III Cont-
Material Media Test No. Hardness - front and back of test specimen (Durameter D)
He 30 56;56
He 40 55;55
TE Teflon Baseline 53;55
(71-3071) He 2 56;56
He 20 53;53
112 27 53;52
H2 33 51;54
Polyvinyl Chloride Baseline 80;79
(71-3075) He 1 79;80
He 18 84;82
H2 26 80;80
H2 36 81;81
Viton-A Baseline 38;39
(71-3070) He 6 37;37
He. 14 37;37
H2 25 30;32
H2 37 35;35

Table IlT Cont,
Material
FEF Teflon
(71-2992)
TFE Teflon
15% Glass-filled
(71-3072)
RTV-90
(71-2977)
RTV-90
(72-3393)
Media
He
He
H2
H2
He
He
H2
H2
He
He
H2
H2
Test No.
Baseline
5
11
32
39
Baseline
4
15
28
41
Baseline
8
12
31
38
Baseline
-3-
Hardness - front and back of test specimen (Durameter D
55;55
54;57
55;54
57;57
60;57
52;51
50;53
52;51
50;50
50;50
25;25
27;29
31;31
30;30
35;35
25;25

Table III Cont, 4
Material
*Ten Impacts
Media
H2
i2
H2
H2
Test No.
44
45
46
47*
Hardness - front and back of
test specimen (Durameter D)
24;25
24;26
25;27
21;22

APPENDIX A
Daily Set-up and Shut-down
TEST PROCEDURE
hhL
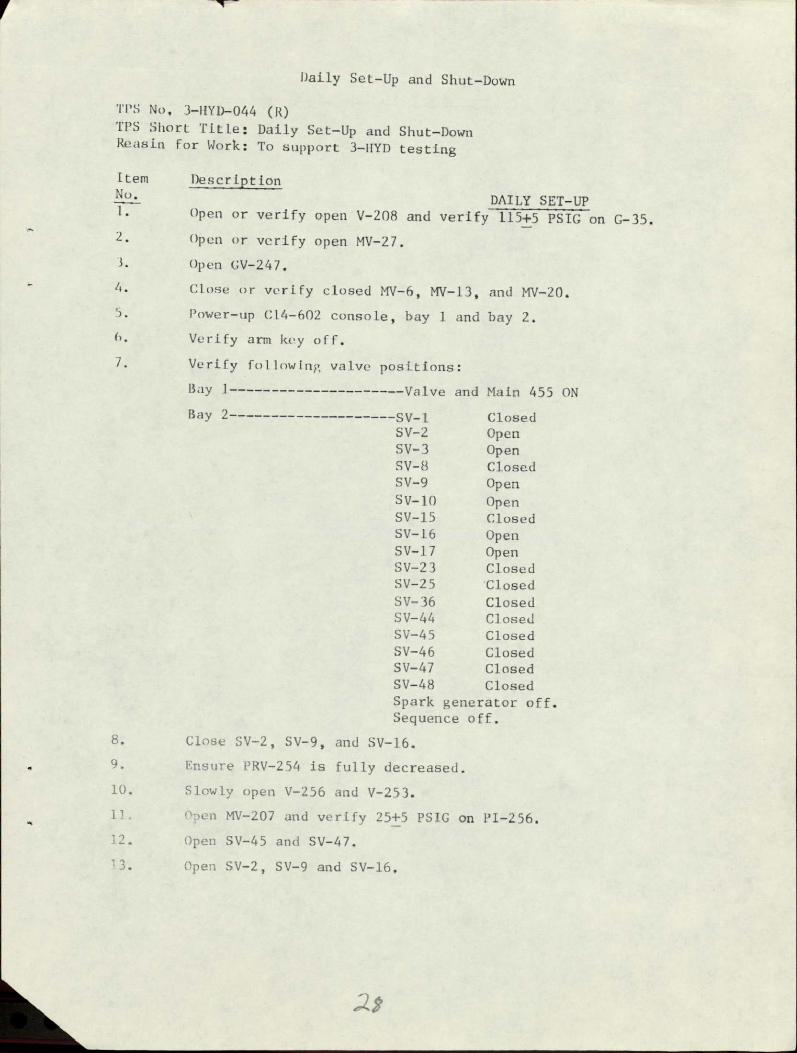
Daily Set-Up and Shut-Down
TI'S No. 3-ItYD-044 (R) TPS Short Title: Daily Set-Up and Shut-Down Reasin for Work: To support 3-1YD testing
Item DescriptionNo. DAILY SET-UP 1. Open or verify open V-208 and verify 115+5 PSIG on G-35. 2. Open or verify open MV-27.
3. Open GV-247.
4. Close or verify closed MV-6, M-13, and MV-20.
5). Power-up C14-602 console, bay 1 and bay 2.
6. Verify arm key off.
7. Verify following valve positions:
Bay I --------------------- Valve and Main 455 ON
Bay 2-------------------- SV-I Closed SV-2 Open SV-3 Open SV-8 Closed SV-9 Open SV-IO Open SV-15 Closed SV-16 Open SV-17 Open SV-23 Closed SV-25 Closed
SV-36 Closed SV-44 Closed SV-45 Closed SV-46 Closed SV-47 Closed SV-48 Closed Spark generator off. Sequence off.
8. Close SV-2, SV-9, and SV-16.
9. Ensure PRV-254 is fully decreased.
10. Slowly open V-256 and V-253.
Ii. tten MV-207 and verify 25+5 PSIG on PI-256.
12. Open SV-45 and SV-47.
13. Open SV-2, SV-9 and SV-16,

Item No. Description
14. Pruge for approximately 1 minute.
15. Close SV-2, SV-9, and SV-16.
16. Open SV-23, and adjust PR-I as required to obtain 100-+10 PSIG on G-34.
17. Open SV-i, SV-8, and SV-15.
18. Purge for approximately 2 minutes, then close SV-I, SV-8 and SV-15.
19. Close SV-23.
(Note: Steps 20 thru 22 for hydrogen gas media only).
20. Open HV-37, MV-39, and adjust PR-40 to obtain purge.
21. Purge for 3 minutes, then close MV-39, PR-40, and MV-37.
22. Open MV-264.
DAILY SHUT-DOWN
23. Close MV-207. (Note: Perform steps 24 thru 26 for hydrogen testing).
24. Open MV-253 and adjust PRV-254 as required to obtain 30+5 PSIG on PI-256.
25. Open MV-39, MV-37, and adjust PR-40 to obtain purge.
26. Purge for 5 minutes, then close MV-39, PR-40 and MV-37.
27. Close GV-247 and GV-264.
28. Close PRV-254.
29. Verify or position the following valves.
SV-i Closed SV-2 Open SV-3 OpenSV-8 Closed SV-9 Open SV-10 Open
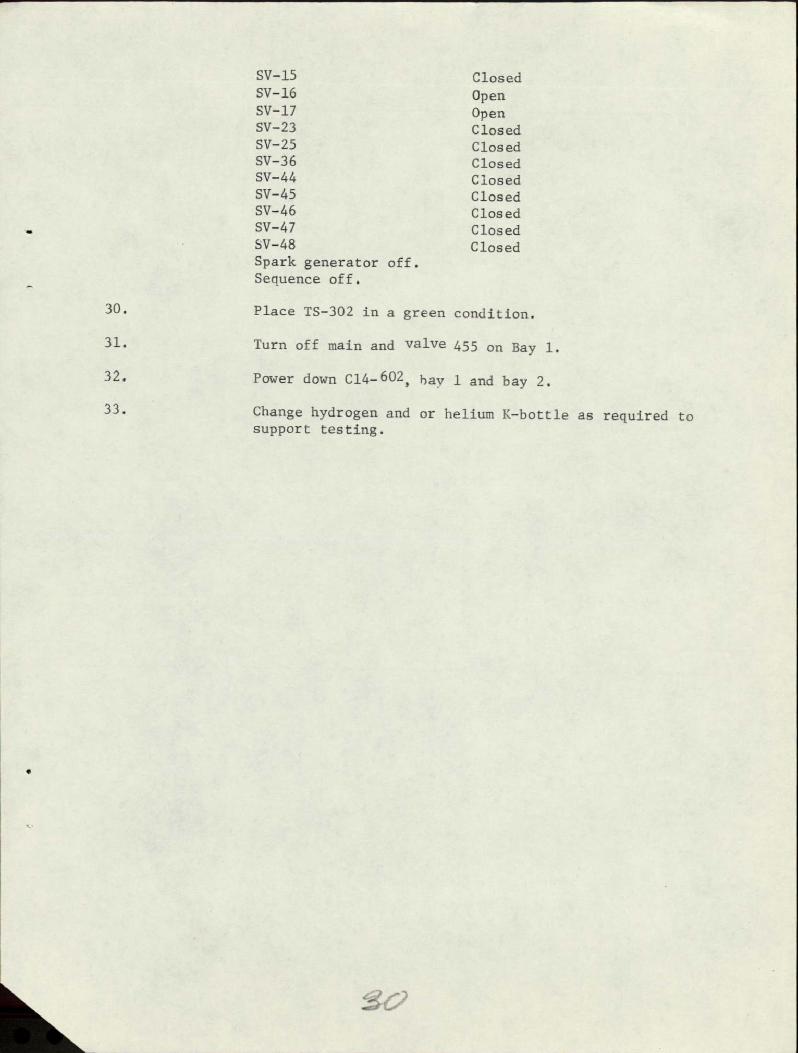
SV-15 Closed SV-16 Open SV-17 OpenSV-23 Closed SV-25 Closed SV-36 Closed SV-44 Closed SV-45 Closed SV-46 Closed SV-47 Closed SV-48 Closed Spark generator off. Sequence off.
30. Place TS-302 in a green condition.
31. Turn off main and valve 455 on Bay 1.
32. Power down C14-602, bay 1 and bay 2.
33. Change hydrogen and or helium K-bottle as required to support testing.

Perfrom Test H (Pneumatic Impact) Tests
TPS No. 3-HYD-lO0 (R) TPS Short Title: Perform Test H (tenumaticImpact) TestsReason for work: To evaluate the behavior of materials subject to Pneumatic
Item No.
1.
2.
3.
4.
5.
6.
7.
8.
8a.
9.
10.
11.
12.
13.
14,
15.
Impact.
DescriptLon
Verify daily set-up per TPS 3-HYD-044 (R) is complete.
Verify camera (TV) set-up is complete and picture is able to TC.
Install sample per steps three thru eight.
Close SV-44, 45, and 47.
Remove sample holder from the test chamber.
Install sample, as designated on the log sheet, in the sample holder.
Install sample holder in test chamber, and leave test chamber loosely attached.
Open SV-47 and SV-9 and purge chamber for approximately I minute.
Close SV-9 and tighten test chamber.
Connect sample thermocouple. (23T).Perfrom the following steps, 9 thru 18, to purge systemwhen changing over to helium gas as the test media. Open SV-23, SV-8 and SV-lO, and adjust PR-l regulator
to indicate 100+10 PSIG on G-34.
Open SV-48.
Close SV-44, SV-47, SV-46, and SV-45.
Pressurize cylinder, then close SV-8.
Open SV-46, vent cylinder, then close SV-46.
Open SV-8.
Repeat steps 12 thru 14 five times.
3,

32
16. Open SV-44, and SV-45 and purge for approximately 1 minute.
17. Close SV-44 and SV-45.
18. Close SV-23.
Perform the following steps, 19 thru 22, to purge systemwhen conducting repetative tests using helium gas as the test media.
19. Open SV-23 and SV-8 and adjust PR-I regulator to indicate 100+10 PSIG on G-34.
20. Open SV-45 and SV-47 and purge for approximately 1 1/2 minutes.
21. Close SV-47.
22. Close SV-23.
Perform the following steps, 23 thru 37, to purge systemwhen changing over to hydrogen gas as the test media.
23. Open H2 "K" bottle outlet valves or source valve.
24. Adjust PR-40 for 100+20 PSIG as indicated on G-42.
25. Close building 328 area and make announcements.
26. Open building 328 and attach grounding straps.
27. Open SV-25, SV-8, and SV-10.
28. Open SV-48.
29. Close SV-44, SV-47, SV-46, and SV-45.
30. Pressurize cylinder, then close SV-8.
31. Open SV-46, vent cylinder, then close SV-46.
Open SV-8.
33. Repeat steps 30 thru 32 five times.
34. Open SV-44 and SV-45 and purge for approximately 1 minute.
35, Close SV-44 and SV-48.

36. Open SV-45 and SV-47, purge for approximately 1 minutes.
37. Close SV-47 and SV-25.
Perform the following steps, 38 thru 44, to purge systemwhen conducting repetative tests using hydrogen gas as the test media.
38. Open H2 "K" bottle outlet valves or source valve.
39. Adjust PR-40 for 100+20 PSIG as indicated on G-42.
40. Close building 328, and make announcements.
41. Open building 328, and attach grounding straps.
42. Open SV-25, SV-8, and SV-l0.
43. Open SV-45 and SV-47, purge for approximately 1 minutes.
44. Close SV-47 and SV-25.
Pressurize cylinder using the following procedures: steps 45 thru 50 when using He gas as test media;steps 51 thru 57 when using H2 gas as test media;
HELIUM TEST
45. Close MV-27, SV-44, SV-45, SV-46,and SV-47.
46. Open SV-8 and SV-48.
47. Close SV-25.
48. Open SV-23, and adjust PR-l regulator to maximum outlet pressure indicated on G-34.
48a. Close building 328 and make announcements. 49. Cycle SV-36 as required to pressurize cylinder to
6,000+50 PSIA as indicated on 4P transducer. 50. Close SV-23 and SV-48.
3

HYDROGEN TEST
51. Close MV-27, SV-44, SV-46, and SV-47.
52. Open SV-8, and SV-10.
53. Close SV-23.
54. Adjust PR-40 for maximum outlet pressure as indicated on G-42.
55. Open SV-25.
56. Cycle SV-36 as required to pressuirze cylinder to 6,000+__50 PSIA as indicated on 4P transducer.
57. Close SV-25 and SV-48.
Perform Pneumatic Impact test per steps 58 thru 60.
58. Open SV-1O.
59. Close SV-44, SV-45, SV-46, SV-47, and Sv-48.
60. Cycle sequence on-sequence off per the following:
T-15 sec. Perform R-cal on oscillograph
T-6 sec. Turn on oscillograph
T+O Depress sequence on
T+11.5 or at completion of SV-45 closed
Depress sequence off
T+12 Depress sequence on
T+23.5 or at completion of SV-45 closed
Depress sequence off
T+24 Depress sequence on
T+35.5 or at completion of SV-45 closed
Depress sequence off
T+36 Depress sequence on

T+47.5 or at completion of SV-45 closed.
Depress sequence off
T+48 Depress sequence on
T+59.5 or at completion of SV-45 closed
Depress sequence offa
T+66 Turn off oscillograph
Perform R-calon oscillograph
Purge system per the following steps:
61. If helium is test media, close PR-I.
62. Close SV-25 and SV-23.
63. Open SV-48 and SV-46.
64. Vent system to ambient, then close SV-48,SV-44, and SV-8.
64a. Open building 328 and make announcements.
65. Close H2 "K" bottle or source valves, if applicable.
66. If H2 is test media, close PR-40, open MV-37 and vent system, then close MV-37.
67. Open SV-45, SV-46, SV-47, and SV-9.
68. Purge for approximately 2 minutes, then close SV-46.
69. Purge for approximately 2 minutes, then close SV-47.
70. Vent system to ambient, then close SV-45 and SV-9.
71. Remove sample holder from test fixture.
72. Remove sample and deliver to TC.
73. Log sample results (visual examination).
74. Clean sample holder, if necessary, with a brush and Freon-TF.

At completion of hydrogen testing or at the test conductors direction, perform the following purge per steps 75 thru 90.
75. Close H2 source valves2/and SV-25. 76. Install sample holder in fixture.
77. Close SV-44, SV-45, SV-46, and SV-47.
78. Open SV-23 anI adjust PR-I regulator for 100+10 PSIG as indicated on G-34.
F
79. Open SV-8, SV-48, and SV-lO.
80. Pressurize cylinder, then close SV-8.
81. Open SV-46, vent cylinder, then close SV-46.
82. Open SV-8.
83. Repeat steps 80 thru 82 ten times.
84. Open SV-44 and SV-45, and purge for approximately 2 minutes.
85. Close SV-44 and SV-48.
86. Open SV-47, purge for approximately 2 minutes.
87. Close SV-47.
88. Open SV-46, purge for approximately 2 minutes.
89. Close PR-I regulator.
90, Vent system to ambient, then close SV-23 and SV-8.
Note: Steps 91, 92, to be performed at completion of daily testing.
91. Perform shut-down per TPS 3-HYD-044 (R).
92. Turn off TV camera and close building 328. ?b