nassos nassos vafeidisvafeidis - geo june/geo... · wl|delft hydraulics, the netherlands ......
TRANSCRIPT

Spatially explicit assessment of coastal Spatially explicit assessment of coastal vulnerability vulnerability –– The DIVAThe DIVA--Med toolMed tool
NassosNassos VafeidisVafeidis
Institute of GeographyInstitute of GeographyChristianChristian--AlbrechtsAlbrechts University KielUniversity Kiel

PlanPlan
Background of the DIVA modelling toolBackground of the DIVA modelling toolCoastal databases and representation of coastal Coastal databases and representation of coastal spacespaceApplication and further development of DIVA Application and further development of DIVA within the CIRCE projectwithin the CIRCE projectMetricsMetricsFuture research needsFuture research needs

DDynamic and ynamic and InInteractive teractive AsAssessment of National, Regional sessment of National, Regional and Global Vulnerability of and Global Vulnerability of CoastCoastal Zones to Climate al Zones to Climate
Change and SeaChange and Sea--Level RiseLevel RiseThe DINASThe DINAS--COAST project (EU / IGBPCOAST project (EU / IGBP--LOICZ)LOICZ)
The ConsortiumPotsdam Institute for Climate Impact Research, Germany (Co-ordinator)Flood Hazard Research Centre, Middlesex University, UKWL|Delft Hydraulics, The NetherlandsThe Centre for Marine and Climate Research, Hamburg University, GermanyThe Free University of Amsterdam, The Netherlands

The Dynamic and Interactive The Dynamic and Interactive Vulnerability Assessment (DIVA) ToolVulnerability Assessment (DIVA) Tool
Main product/deliverable of DINASMain product/deliverable of DINAS--COASTCOASTA dynamic, interactive and flexible assessment A dynamic, interactive and flexible assessment tooltoolA CDA CD--ROM that includes: Models, GUI and ROM that includes: Models, GUI and databasedatabaseIt enables consistent and comparative analyses of It enables consistent and comparative analyses of mitigation and adaptation policies for a range of mitigation and adaptation policies for a range of emission, emission, ss--ee and other scenariosand other scenariosUser friendly, low requirements so that it can be User friendly, low requirements so that it can be used by policy makers everywhere in the worldused by policy makers everywhere in the world

The DIVA ToolThe DIVA Tool
External data
sourcesDINAS-COAST geodatabase
Data pre-processing
DIVA TOOLDatabase, Integrated
modules, GUI
USERUSER
Coastline segmentation
Geo-processing
Publicly Available

Schematic view of the operation Schematic view of the operation of the DIVA toolof the DIVA tool

Limitations for globalLimitations for global--scale vulnerability scale vulnerability analysisanalysis
Lack of consistent evaluations of coastal Lack of consistent evaluations of coastal vulnerability at global scalevulnerability at global scaleLack of tools and data that address the Lack of tools and data that address the information needs for international climate information needs for international climate policypolicyExisting data are not directly accessible by Existing data are not directly accessible by researchers and policy makersresearchers and policy makersLack of a coherent and non-fragmented source of data input at a global scale
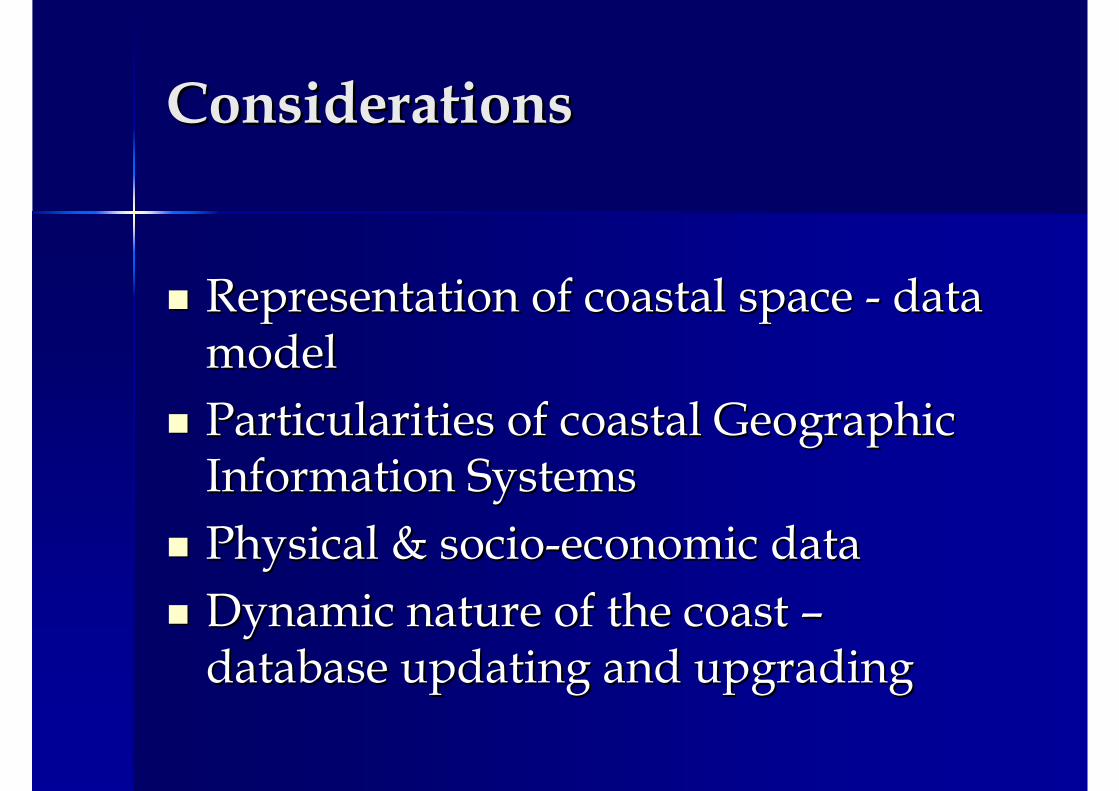
ConsiderationsConsiderations
Representation of coastal space Representation of coastal space -- data data modelmodelParticularities of coastal Geographic Particularities of coastal Geographic Information SystemsInformation SystemsPhysical & socioPhysical & socio--economic dataeconomic dataDynamic nature of the coast Dynamic nature of the coast ––database updating and upgradingdatabase updating and upgrading
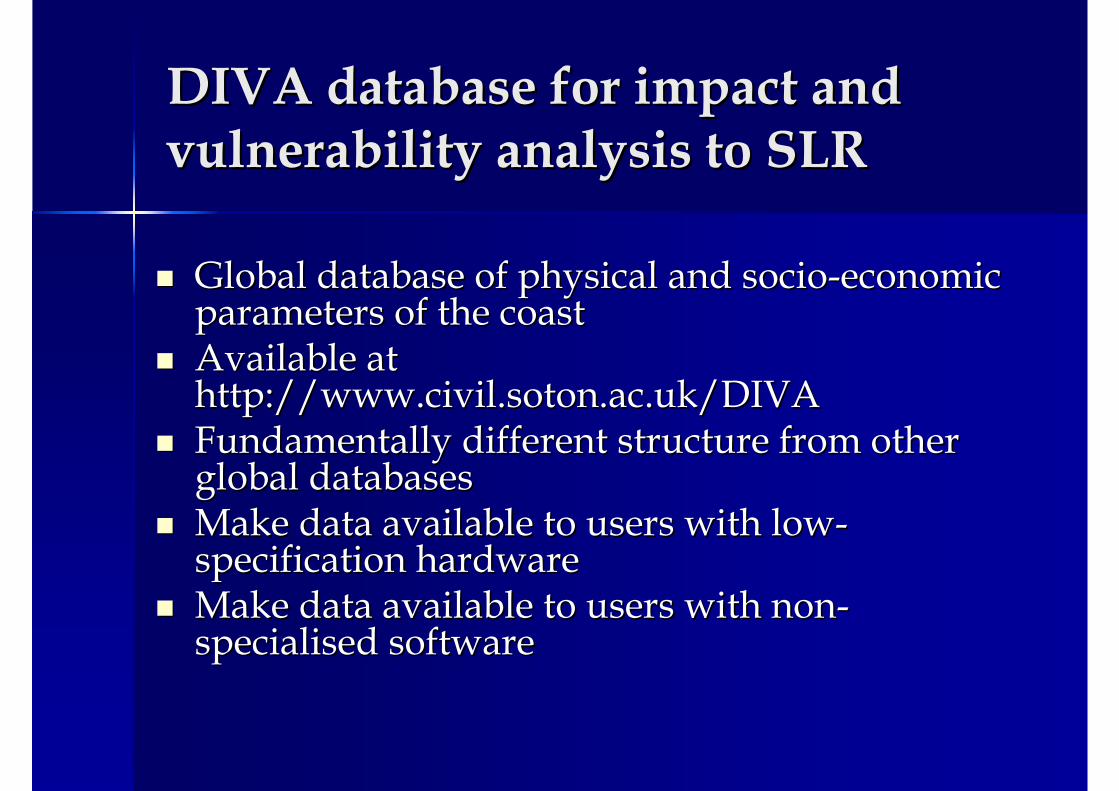
DIVA database for impact and DIVA database for impact and vulnerability analysis to SLRvulnerability analysis to SLR
Global database of physical and socioGlobal database of physical and socio--economic economic parameters of the coastparameters of the coastAvailable at Available at http://http://www.civil.soton.ac.ukwww.civil.soton.ac.uk/DIVA/DIVAFundamentally different structure from other Fundamentally different structure from other global databasesglobal databasesMake data available to users with lowMake data available to users with low--specification hardwarespecification hardwareMake data available to users with nonMake data available to users with non--specialised softwarespecialised software

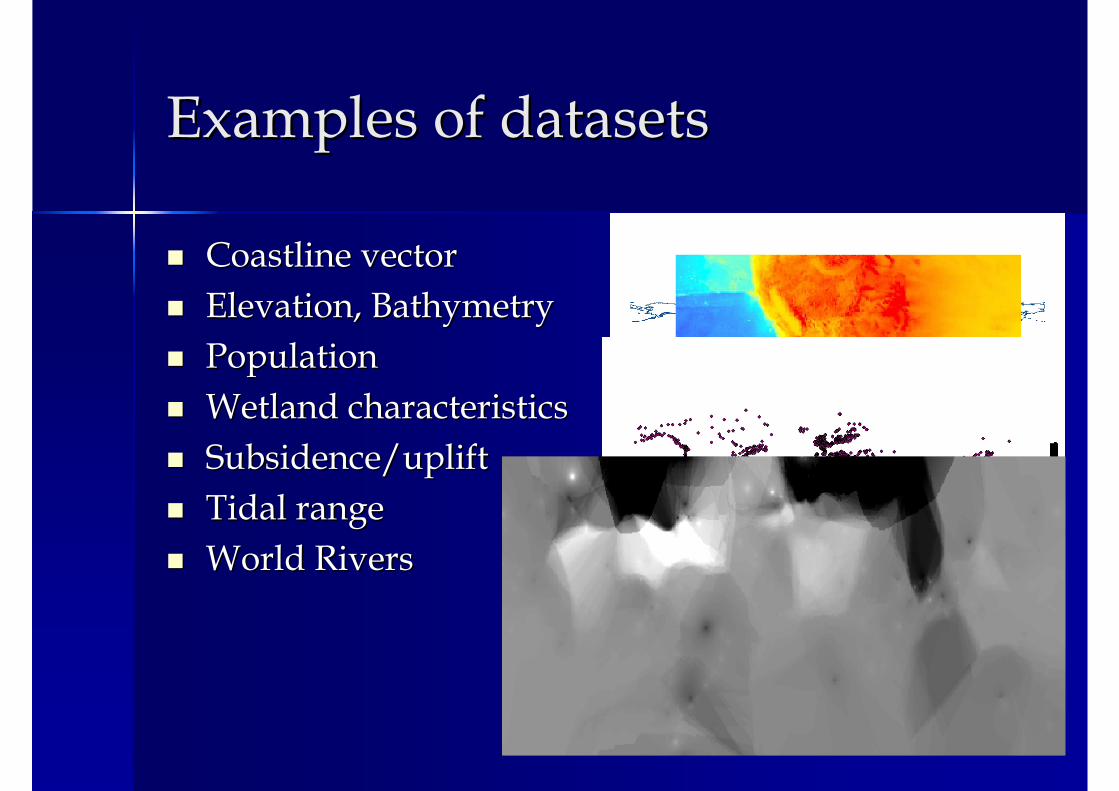
Examples of datasetsExamples of datasets
Coastline vectorCoastline vectorElevation, BathymetryElevation, BathymetryPopulationPopulationWetland characteristicsWetland characteristicsSubsidence/upliftSubsidence/upliftTidal rangeTidal rangeWorld RiversWorld Rivers
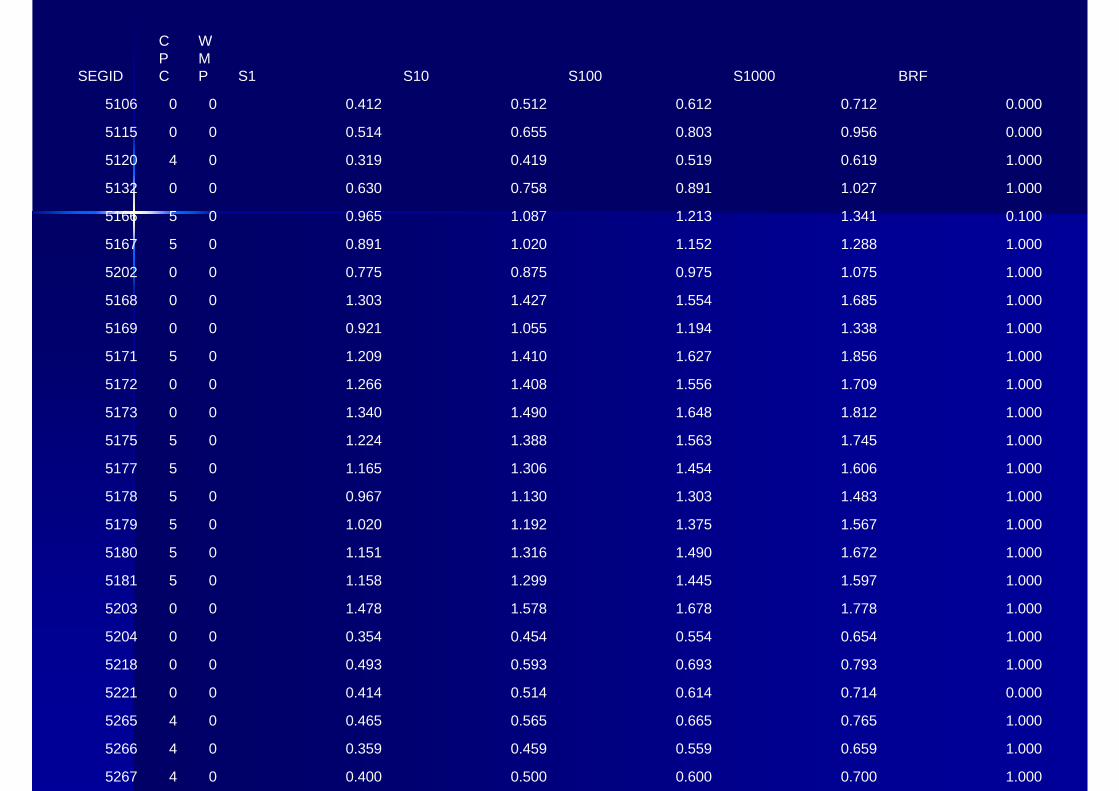
1.0000.7000.6000.5000.400045267
1.0000.6590.5590.4590.359045266
1.0000.7650.6650.5650.465045265
0.0000.7140.6140.5140.414005221
1.0000.7930.6930.5930.493005218
1.0000.6540.5540.4540.354005204
1.0001.7781.6781.5781.478005203
1.0001.5971.4451.2991.158055181
1.0001.6721.4901.3161.151055180
1.0001.5671.3751.1921.020055179
1.0001.4831.3031.1300.967055178
1.0001.6061.4541.3061.165055177
1.0001.7451.5631.3881.224055175
1.0001.8121.6481.4901.340005173
1.0001.7091.5561.4081.266005172
1.0001.8561.6271.4101.209055171
1.0001.3381.1941.0550.921005169
1.0001.6851.5541.4271.303005168
1.0001.0750.9750.8750.775005202
1.0001.2881.1521.0200.891055167
0.1001.3411.2131.0870.965055166
1.0001.0270.8910.7580.630005132
1.0000.6190.5190.4190.319045120
0.0000.9560.8030.6550.514005115
0.0000.7120.6120.5120.412005106
BRFS1000S100S10S1
WMP
CPCSEGID

Estimated People Flooded (per year) by Estimated People Flooded (per year) by surges in 2000surges in 2000


Eastern EuropeEastern Europe
Sand loss totalSand loss total People actually floodedPeople actually flooded
Relative seaRelative sea--level riselevel riseTotal adaptation costTotal adaptation cost

CIRCE CIRCE –– Climate Change and Impact Climate Change and Impact Research: The Mediterranean EnvironmentResearch: The Mediterranean Environment
Integrated Project Integrated Project –– EU FP6EU FP659 Participants59 ParticipantsEconomic Impacts Economic Impacts –– WP10.6, SeaWP10.6, Sea--Level RiseLevel RiseDevelop DIVADevelop DIVA--MedMed–– Updated databaseUpdated database–– Improved algorithmsImproved algorithms
Provide an assessment of SLR impacts in the Provide an assessment of SLR impacts in the Med & input for CGE modelMed & input for CGE model

Mediterranean BasinMediterranean Basin
AlbaniaAlbaniaAlgeriaAlgeriaCyprusCyprusEgyptEgyptFranceFranceGreeceGreeceItalyItalyIsraelIsraelLebanonLebanonMaltaMaltaSpainSpainSyrian And Arab Syrian And Arab RepRepTunisiaTunisiaTurkeyTurkey
MoroccoMoroccoLibyan Arab Libyan Arab JamahiriyaJamahiriyaYugoslaviaYugoslaviaBosnia and Bosnia and HerzegovinaHerzegovinaCroatiaCroatiaSloveniaSloveniaMonacoMonaco
CountriesCountries

Total Adaptation CostsTotal Adaptation Costs(millions US$/year)(millions US$/year)
A1B_High_UniformA1B_High_Uniform
B1_Low_RegionalB1_Low_Regional
20002000

Metrics for exposure analyses and impact Metrics for exposure analyses and impact assessmentassessment
Exposure assessmentExposure assessmentImpact assessmentImpact assessmentApplicationsApplicationsIssues of concernIssues of concern
Nicholls et al., 2006, OECD reportNicholls et al., 2006, OECD report

Assessment methodsAssessment methods
Exposure metrics Exposure metrics –– threatened resources threatened resources assuming no adaptation, GIS analysis (with assuming no adaptation, GIS analysis (with or without scenarios)or without scenarios)Impact metrics Impact metrics –– residual impacts after residual impacts after adaptation responses under relevant adaptation responses under relevant climatic and socioclimatic and socio--economic scenarios and economic scenarios and appropriate decisionappropriate decision--making approaches making approaches (e.g. cost(e.g. cost--benefit)benefit)Threshold metrics Threshold metrics –– (or tipping(or tipping--point point analysis)analysis)

Exposure metrics (for longExposure metrics (for long--term term seasea--level rise)level rise)
Inventory approach (e.g., threatened UNESCO World Heritage sites)
Cultural / Heritage at risk
Inventory approach (e.g., threatened transport corridors)
Infrastructure at risk
Monetary value (absolute: monetary value or relative impact: % GDP)
Economic value at risk
Threatened area of ecosystems (km2)Ecosystems at risk
Number of people (absolute or relative impact: % population)
People at risk
Threatened area (absolute: km2, or relative impact: % available area)
Land area at risk
UnitsMetric

Areas below 10Areas below 10--m elevationm elevation

Land area below various contoursLand area below various contours
(a)
(b)
(c)

The Thames EstuaryThe Thames Estuary

Flooding in the Thames EstuaryFlooding in the Thames Estuary
Land: 257,077 hectaresLand: 257,077 hectaresPopulation: 2,250,000 peoplePopulation: 2,250,000 peopleHousehold places: 1,008,000Household places: 1,008,000Property losses (2001 prices), Mean houseProperty losses (2001 prices), Mean house--price in the affected areas: price in the affected areas: ££183,504183,504Triggered further analysis (Dawson et al., Triggered further analysis (Dawson et al., 2005) and discussions regarding the 2005) and discussions regarding the planning and design of the upgrades for the planning and design of the upgrades for the Thames BarrierThames Barrier


Relative distribution of exposed land within Relative distribution of exposed land within 1010--m of present seam of present sea--levels (Stern regions)levels (Stern regions)
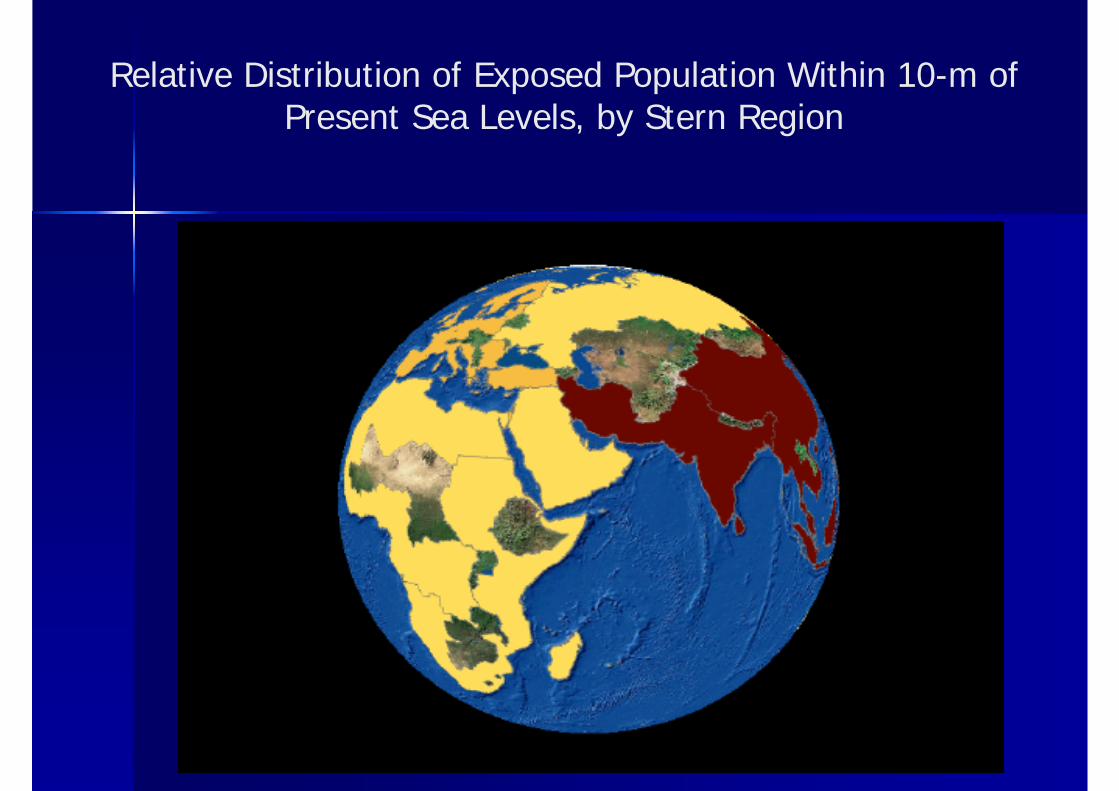
Relative Distribution of Exposed Population Within 10-m of Present Sea Levels, by Stern Region

0
100
200
300
400
500
600
700
0 1 2 3 4 5 6 7 8 9 10
metres above mean high water
mill
ions
of p
eopl
e
0
1
2
3
4
5
6
7
mill
ions
of s
quar
e ki
lom
eter
s,tri
llion
s of d
olla
rs
Population, LandScanPopulation, GPW3AreaGDP, PPPGDP, MER
Observed coastal distributionsObserved coastal distributionsarea, population and GDParea, population and GDP

Impact metricsImpact metrics
Monetary cost (absolute costs in monetary terms or relative costs: % GDP)
Adaptation Costs
Inventory of losses (e.g., list of lost UNESCO World Heritage sites)
Cultural/Heritage loss
Inventory of losses (e.g., list of disrupted transport corridors)
Human infrastructure loss
Monetary loss (absolute costs in monetary terms or relative costs: % GDP)
Economic value loss
Threatened area of ecosystems (km2). Cost of losses/changes (absolute: monetary value or relative impacts: % GDP)
Ecosystems loss/change
Number of people (absolute or relative impact: % population). Cost of displacement (absolute: monetary value or relative impacts: % GDP)
People displacement
Lost area (absolute: km2, or relative impact: % available area)
Land area loss
UnitsMetric

FUND (coastal module) FUND (coastal module) -- Analysis of Analysis of extreme seaextreme sea--level riselevel rise
Tol, 2002; Anthoff et al., 2006
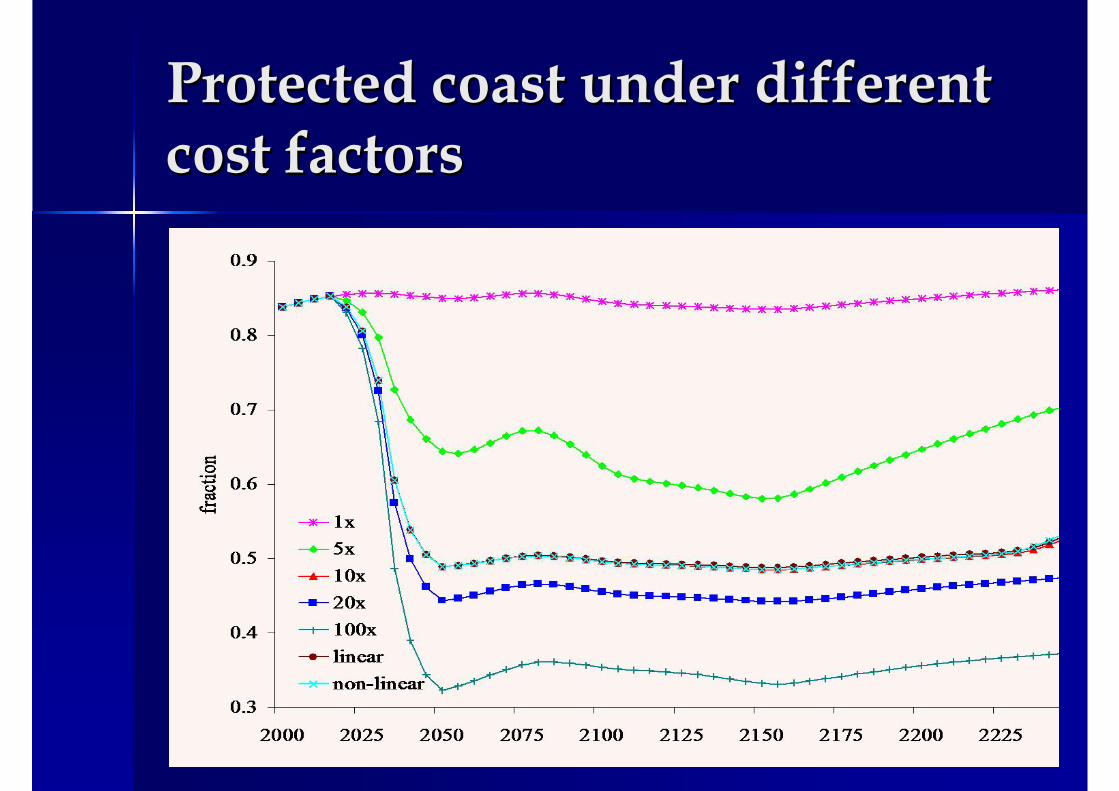
Protected coast under different Protected coast under different cost factorscost factors

Issues of concernIssues of concern
Optimistic socio-economic scenarios –overemphasise our capability to adapt.Benefit-cost implies proactive protection –historical experience shows most protection is reactive.Will more frequent coastal disasters reduce assets at risk (coastal abandonment) – triggering a cycle of decline?This raises the possible role of thresholds in response to sea level rise, but these issues are poorly understood.

Future researchFuture research
Coastal DatabasesCoastal Databases–– Work at larger cartographic scales, nested databases? Work at larger cartographic scales, nested databases?
Deltas, hotspots (nested elements)Deltas, hotspots (nested elements)–– Explore links between scales, identify the processes Explore links between scales, identify the processes
that dominate at different scalesthat dominate at different scalesDevelop novel tools for risk and vulnerability Develop novel tools for risk and vulnerability assessment operating at various scalesassessment operating at various scalesIdentify data and information requirements Identify data and information requirements ––redefine the role of EO for coastal research at all redefine the role of EO for coastal research at all scalesscales

Thank you!Thank you!
NassosNassos VafeidisVafeidisInstitute of GeographyInstitute of Geography
ChristianChristian--AlbrechtsAlbrechts University KielUniversity KielGermanyGermany
[email protected]@geographie.uni--kiel.dekiel.de