nasa technical note e · nasa technical note nasa e.j ... the oxidation products were examined by...
TRANSCRIPT

NASA TECHNICAL NOTE N A S A
e .j
TN D-6414-
OXIDATION OF ALLOYS I N NICKEL-ALUMINUM SYSTEM WITH THIRD-ELEMENT ADDITIONS OF CHROMIUM, SILICON, A N D TITANIUM AT 1100~C
by Gilbert J. Suntoro, Duniel L. Deudmore, und Curl E. Lowell
Lewis Research Center Clevelund, Ohio 44135
NATIONAL AERONAUTICS AND SPACE ADMINISTRATION WASHINGTON, D. C. JULY 1971
https://ntrs.nasa.gov/search.jsp?R=19710021045 2018-06-16T04:41:29+00:00Z

I TECH LIBRARY KAFB, NM
Illllll lllllll111lllllllllIll11IllIll~ -.
I 1. Report No. I 2. Government Accession No. I 3. Recipic;. 0332849 I NASA TN D-6414 I I
SYSTEM WITH THIRD-ELEMENT ADDITIONS OF CHROMIUM, I July 1971
SILICON, AND TITANIUM AT l l O O o C I 6. Performing Organization Code
7. Author(s) 8. Performing Organization Report No.
Gilbert J. Santoro, Daniel L. Deadmore, and Car l E. Lowell E-6225
9. Performing Organization Name and Address
Lewis Research Center National Aeronautics and Space Administration
L. Cleveland, Ohio 44135 12. Sponsoring Agency Name and Address
National Aeronautics and Space Administration Washington, D. C. 20546
15. Supplementary Notes
. _ ~
16. Abstract
The oxidation behavior of 31 compositions in the
10. Work Unit No.
129-03 11. Contract or Grant No.
13. Type of Report and Period Covered
Technical Note 14. Sponsoring Agency Code
y(Ni), y'(Ni3A1), and P(NiA1) phase regions of the Ni-A1 system containing 0, 1, 3, or 10 atom percent Cr, Si, or T i was investigated. Specimens were isothermally and cyclically exposed in air at l l O O o C (2012' F) for 100 hours. Alloy thickness changes and weight changes were measured. The oxidation products were examined by X-ray diffraction and by metallography. Combining all resul ts from these observations, a qualitative comparison is made of the oxidation resistance of a l l compositions studied.
~
17. Key Words (Suggested by Author(s))
Oxidation Nickel-aluminum alloys Nickel-base alloys
19. Security Classif. (of this report)
18. Distribution Statement
Unclassified - unlimited
20. Security Classif. (of this page) I 21. NO. ;;Pages 22. Price"
Unclassified $3.00
For sale by the National Technical Information Service, Springfield, Virginia 22151
I
L

OXIDATION OF ALLOYS IN NICKEL-ALUMINUM SYSTEM WITH
THIRD-ELEMENT ADDITIONS OF CHROMIUM,
SILICON, AND TITANIUM AT ll@ C
by Gilbert J. Santoro, Daniel L, Deadmore, and Carl E. Lowell
Lewis Research Center
SUMMARY
A study was made to determine the individual effect of chromium, silicon, and titanium on the isothermal oxidation rate and cyclic spa11 resistance of single-phase alloys in the nickel-aluminum (Ni-A1) system. Additions of 1, 3, and 10 atom percent of chromium, silicon, o r titanium were substituted for the aluminum in Ni-1OAl (y ) ,
Ni-25A1 ( y ' ) , and Ni-50A1 ( p ) . These 27 alloys, the Ni-A1 binaries, and unalloyed nickel for comparison were isothermally and cyclically oxidized in still air at l l O O o C (2012' F) for up to 100 hours. Alloy thickness changes and weight changes were measured. The oxidation products were examined by X-ray diffraction and by metallography. By combining the information from all the measurements and observations of this study, a qualitative comparison was made of the oxidation resistance of the compositions investigated. None of the y alloys had better oxidation resistance than nickel, particularly under cyclic condition. Some of the y' alloys were more oxidation resistant than nickel, and others were not. The best of the y' alloys were as oxidation resistant as the best of the p alloys. All the 0 alloys were more oxidation resistant than nickel, and, therefore, more oxidation resistant than any of the y alloys.
INTRODUCTION
An experimental survey was made of the oxidation and spalling of alloys in the nickel-aluminum (Ni-A1) system with chromium (Cr), silicon (Si), and titanium (Ti) additions. The Ni-A1 system is fundamental to Ni-base superalloys. The matrix of these alloys consists of Ni-solid solution (y) , the main strengthening phase is Ni3 (Al, Ti) (y ' ) , and the oxidation resistant coating often applied is NiAl (p) . The elements

Cr, Si, and Ti are alloying elements used in commercial superalloys, in addition to being strong oxide formers. An understanding of the oxidation behavior of these three phases (y, y', and 8) and particularly how that behavior is affected by the strong oxide formers present in Ni-base superalloys (Cr, Si, and Ti) could contribute to several areas of superalloy technology. Such information could serve as useful guides in alloy development. It could be helpful in the improvement of protective coatings for such alloys. Finally, it might contribute to an understanding of the oxidation behavior of commercial superalloys.
. A great deal has been reported on the Ni-Cr system (refs. 1to 3), but there is a paucity of data on the Ni-A1 system (refs. 2 and 4) and even less for ternary Ni-A1 base alloys (refs. 1, 5, and 6). A systematic high-temperature (i.e . , >900° C (>1652' F)) investigation on the Ni-A1 system is given in reference 4. Under isothermal conditions, it was found that the scale morphologies and oxidation rates were dependent on A1 content, time, temperature, and oxygen pressure. At l l O O o C (2012' F) and 0.1 torr of oxygen, a binary alloy with about 17 weight percent (31 at. %) or more of Al formed a single external scale of cuA1203. The oxidation kinetics obeyed a parabolic rate law and the rate constant was three orders of magnitude smaller than for pure Ni. Below about 5 weight percent (10 at. %) Al, an internal oxide of A1203 was formed with an external NiO scale and some NiA1204 near the NiO-subscale interface. The kinetics obeyed a parabolic rate law and the rate constant was about an order of magnitude larger than for pure Ni. In reference 7 it was shown that the presence of Cr in the Ni-A1 system would lower the A1 content necessary for the formation of a single external scale of A1203. Thus, at l l O O o C (2012° F), 11.8 atomic percent A1 in the Ni-20Cr-A1 alloy was sufficient to form a single external A1203 scale, that is, about 1/3 the amount required in the binary Ni-A1 alloy. An earlier investigation (ref. 6) in the Ni-Cr-A1 system showed that A1 contents of 2 4 weight percent A1 effected an improved oxidation resistance. In the Ni-Al-Si system only isothermal tests on dilute alloys were reported ( re f . 8). These involve y phase alloys with 5 to 7 weight percent Si plus Al. Between 1000° and 1200' C (1832' and 2152' F), the more resistant alloys were those with the higher Si plus A1 content. With zero A1 content the oxidation resistance increased with up to 7-weight-percent Si. For the binary Ni-Ti alloys between 1000° and 1200' C (1832' and 2192' F), the investigation of reference 9 showed that the oxidation resistance decreased with increasing Ti (0.53 to 16.7 wt %). Thus, in the Ni-A1 binary system the data are predominantly isothermal and for short times (520 hr). Some cyclic tests for over 200 hours were reported, but only net weight changes were measured (ref. 10). Again, in the Ni-Cr-A1 system the data are for short-time isothermal studies.
The present investigation was initiated as an experimental survey intended as a step towards filling the voids in the literature. It consists of oxidation studies of y, y ' , and /3 phase compositions. Cyclic data were obtained where only isothermal informa
2

tion has previously been available, and oxidation times up to 100 hours, substantially longer than most of the existing test data, were obtained. Also a temperature of l l O O o C (2012' F) was chosen for this study. This is in the temperature range where the more advanced Ni-base superalloys have usable strengths. At present these superalloys require protective coatings at this temperature. Thus, data collected at l l O O o C (2012' F) may not only aid the development of alloy coatings but also contribute to the development of greater intrinsic oxidation resistance for these advanced, high-strength superalloys. Furthermore, this high temperature wil l serve as a severe test parameter for the better separation of the oxidation behavior of the compositions investigated. Specifically, the purpose of this investigation was to determine the effect of Cr, Si, and Ti on the isothermal and cyclic oxidation resistance of single-phase alloys in the Ni-A1 system. Thus, 0, 1, 3, and 10 atom percent of Cr, Si, and Ti were substituted for the A1 in the Ni-lOAl, Ni-25A1, and Ni-50A1 alloys. These 30 alloys, together with unalloyed Ni for comparison, were isothermally and cyclically oxidized in air at l l O O o C (2012' F). Alloy thickness changes and weight changes were measured. The oxidation products were examined by X-ray diffraction and metallography.
EXPERIMENTAL PROCEDURES
Sample Preparation
Alloys were prepared by vacuum casting. The chemical analysis of the starting materials is given in table I(a). Nickel was heated to its melting point in an A1203 crucible under a vacuum of 1to 10 micrometers. The other elements were then added to the Ni melt under 50 torr of argon. The melt was poured into a preheated, 870' C (1598' F) zircon mold having a 1.9 centimeter (3/4-in. ) diameter by 10.2 -centimeter (4-in. ) long cylindrical sample section. The pour temperature was between 1425' C (2597' F) and 1675' C (3047' F), depending on the composition of the melt. The castings were annealed 24 hours at 1200' C (2152' F) in sealed quartz tubes that had been evacuated and back filled with argon. The purpose of the annealing treatment was to stabilize the alloy before the l l O O o C (2012' F) oxidation exposure. The castings were then centerless ground to remove surface scale and to provide a surface finish to 32 r m s or better. The cylinders were sliced into 2-millimeter thick disks, and a hole was drilled or electric discharge machined near the edge of each disk so it could be suspended in the furnace. The f l a t surfaces were polished to a 1/2 micrometer finish. Experience at this laboratory indicates that this surface finish results in reproducible oxidation rates. Before oxidation material was provided from each casting for chemical analysis (table I(b)), metallography, and X-ray diffraction (table n).
3
I

Material Purity, Impurities, ppm %
Nickel rod 99.99 Aluminum shot 99.99 Chromium pellets 99.999 Titanium wire 99.97ISilicon ingot 1 (a)-~
aSemiconductor grad.
(b)Cast allo:
iominal composition, II Actual composition at. % at.%
Ni-1OA1 Ni-9A1-1Cr Ni- 7A1- 3C r Ni- 10Cr Ni-9Al-1Si Ni- 7A1-3Si Ni-1OSi Ni-9A1- 1Ti Ni-7A1-3Ti Ni-1OTi
Ni -2 5A1 Ni-24A1-1Cr Ni-22A1-3Cr Ni- 15A1-10Cr Ni-24A1- 1Si Ni- 22A1-3Si Ni-15A1-lOSi Ni-24A1-1Ti Ni-22A1-3Ti Ni-15A1- lOTi
Ni-50A1 Ni-49A1- 1Cr Ni- 47A1-3Cr Ni-40A1- lOCr Ni- 49A1- 1Si Ni- 47A1-3Si Ni-40A1- 1OSi Ni- 49A1- 1Ti Ni- 47A1-3Ti Ni-40Al-1OTi
-
Ni-9.81A1 Ni-8.9A1-1.2Cr Ni-7.1A1-2.8Cr Ni-9.930- Ni-9.50Al-l.lOSi Ni-8. 16A1-3. 43Si Ni-11. OSi Ni-8.24A1-1. OTi Ni-7.1A1-2.5Ti Ni-9.8Ti
Ni-24.9A1 Ni-24.47A1-0.78Cr Ni-22.59Al-2.86Cr Ni-15.73A1-9.98Cr Ni-23.57A1-1.02Si Ni-22.91A1-2.92Si Ni-15.69A1-9.74Si Ni-23.OA1-0.99Ti Ni-22.04Al-3.40Ti Ni-15.51Al-10.03T
Ni-50.5A1 Ni-48. 8A1-1.1Cr Ni-47.6A1-2.6Cr Ni-39.1A1-10.3Cr Ni-48.8A1-1.1Si Ni-46.8A1-2.9Si Ni-39.5A1-9.88Si Ni-49.6Al-l.lOTi Ni-47.6A1-3.1Ti Ni-40.1A1-10.4Ti
(c) Cast nickel impuri t ies
C . . . . . . . . . . . . . . . 46ppm A g . . . . . . . . . . . . . . . Trace A1 . . . . . . . . . . . . Faint t r ace F e . . . . . . . . . . . . . Veryweak
4

- - - -
TABLE u. - X-RAY DIFFRACTION DATA^ (a) Chromium containing alloys, nickel-aluminum (Ni-A1) binary alloys, and nickel
[Composition given in at.%.]
Type of P a r t of sca le ) alloys: 1 y’ alloys: p alloys: Ni-AI binary phases: Ni oxidation X-rayed Ni- (IO-x)Al-xCr Ni- (25-x)Al-xCr Ni- (50-x)Al-xCr
Ni-1OA1 Ni-25Al Ni-5OA1
x - l x = 3 x - 10 x 1 X L 3 x 10 x - l x . 3 x . 1 0
As cast ---. Ni solid solution Ni solid solution Ni solid solution Ni3Al Ni3A1 Ni3Al NiAl NiAl bNiAl Ni solid solution Ni3A1 NiAl Ni (ao :3 .534) ( a o = 3 . 5 3 6 ) (a, - 3 . 5 3 1 ) ( a o - 3 . 5 8 1 ) (ao - 3 . 5 6 8 ) (ao - 9 . 5 6 1 ) ( a o - 2 . 8 9 2 ) ( a o = 2 . 8 7 7 ) ( a o = 2 . 8 7 2 ) (a ,=3.543) ( a o = 3 . 5 7 5 ) ( a o = 2 . 8 8 9 ) ( a o = 3 . 5 2 0 )
Isothermal Retained NiO NiO NiO A1203 NiO Al2O3 Ai203 AI2O3 Al2O3 NiO Al2O3 A1203 NiO NiCr204 NiCr204 NiCr204 NiCr204 NiCr204 N1Al2O4 NiCr204 NiAI2O4 NIA1204 1
NiAI,O, CA1,O1 NiO
A1203 Nospal l NO spa11Spa11 NiO NiO N10 A$03 ;I2O3 A1203 Nospal l Fewi lakes A1203 Nospal l NiCr204 NiCr204 NiCr204 NiAl2O4 NiO NiAlZ04 detected not X-rayed NiO detected
NiO NiO NiAI2O4 detected detected
NiCr204 NiCrZ04
Spall NiO N10 N10 NiO NiO N10 Few flakes Al2O3 Al2O3 NiO ’ NiO Al2O3 No spa11 NiCr204 NiCr204 NiCrZ04 N1A1204 NiAI2O4 NiAI2O4 not X-rayed NiAI2O4 NiAI2O4 NiAI2O4 NiAl2O4 ‘NIO detected
AI2O3 A1203 A$O3 ‘NiO NiO A1203 CCr203

Type of oxidation
As cast
Isothermal
cycl ic
TABLE II. - Continued. X-RAY DIFFRACTION DATAa
Part of scale y alloys: alloys: X-rayed Ni-(10-x)Al-xSi Ni- (25-x)Al-xSi
x = l x = 3 x = 10 x = 1 x = 3 x = 10
-- --- - -- Ni solid Ni solid Ni solid Ni3N Ni3N Ni3A1 solution solution solution (ao = 3. 572) (ao = 3. 558) (ao = 3. 548) (ao= 3.537) (ao = 3.531) (ao = 3.515)
Retained NiO NiO NiO NiO A1203 NiO
Spall No spall NiO NiO 1 A1203 A1203 NiO detected NiA1204 NiO NiA1204 NiA1204
I NiA1204
Retained NiO ‘NiA1204
NiO NiA1204
1 NiO ’
NiO A1203
NiO NiA1204
NiO NiA1204
NiA1204 A1203
Spall NiO ~ NiO NiO NiO NiO NiO NiA1204 I NiA1204 NiA1204 NiA1204 NiA1204
A1203 *l2’3 S i02
~ ~~
p alloys: Ni- (50-x)Al-xSi
x = l x = 3 x = 10
bNiAl NiAl NiAl (a, = 2.92-2.89) (ao = 2.888) (ao= 2.880)
A1203 A1203 A1203
No spal l No spal l Few flakes detected detected not X-rayed
A1203
No spall No spal l Few flakes detected detected Ala03
NiAI2O4
aThe phase with the strongest lines in the X-ray diffraction pattern is listed f i r s t , followed, in order , by phases with weaker lines. bFew extra lines which a r e very weak and were not identified. ‘Suspected phase, indefinite pattern.

A1203
TABLE 11. - Concluded. X-RAY DIFFRACTION DATAa
(c ) Titanium containing alloys
Type of Part of scale 7 alloys: y' alloys: p alloys: oxidation X-rayed Ni- (10-x)Al-sTi Ni- (25-x)Al-sTi I Ni- (50-x)Al-xTi
x - 1 x . 3 s = 10 x . 1 x = 3 x = 10
As cast Ni solid solution Ni solid solutioi Ni solid solution Ni3A1 NiAl NiAl bNiAl (ao = 3.548) (ao = 3 . 5 3 6 ) (ao = 3.565) (a, = 3 .570) (a, = 2.888) (a, = 2.93-2.87
Isothermal Retained NiO NiO NiO NiO NiO NiTi03 A1203 A1203 A1203 NiTi03 NiTi03 A1203 A1203 T i 0 2 t102 NiA1204 T i 0 2 NiA1204 NiA1204 NiA1204 NiA1204
TiOZ NiTiOg
spa11 No spa l l NiO NiO NiO A1203 NiO No spall No spa l l No spa l l detected NiTi03 NiTi03 A1203 NiO NiTi03 detected detected detected
NiA1204 T i 0 2 NiA1204 NiA1204 NiA1203 'Cr2o3
2yclic Retained NiO NiO NiO NiO NiO NiO A1203 A1203 A1203 NiA1204 NiA1204 NiTi03 NiA1204 NiA1204 NiA1204 t102
NiTi03 A1203 NiA1204
Spa11 NiO NiO NiO NiA1204 NiA1204 1 not X-rayed 1 detected detectedNiTi03 NiA1204 NiTi03 NiA1204 I NiTi03 lNiTi03
71Few flakes No spa l l No spa l l
NiA1204 NiTi03
'The phase with the s t rongest lines in the X-ray diffraction pattern is listed f i r s t , followed, in o rde r , by phases with weaker lines. 'Few ex t r a lines which a r e ve ry weak and were not identified. -Suspected phase, indefinite pattern.

Table I(b) shows that the actual composition in every case is close to the nominal composition. Each composition represents one casting from which came all the oxidation specimens and material for analysis. The nominal compositions are used throughout this paper. All compositions are given in atom percent. Figure 1is a plot in triangular coordinates of the nominal compositions of the alloys used in this investigation. Although it was desired to have all single-phase samples, the X-ray diffraction data (table II) and metallography revealed that three of the p alloys were not single phase, namely, the Ni-4OA1- lOCr, Ni-49A1- lSi, and Ni-4OA1- lOTi alloys. The composition of
10 20 30 40 50 Chromium, silicon, o r t i tanium content,
a t %
Figure 1. - Nominal compositions of alloys i n t h i s investigation.
the chromium alloy is in the region of a known phase diagram (ref. ll), and according to that diagram Ni-40A1-lOCr should be a p phase alloy. Apparently, this alloy suffered segregation, and equilibrium was not established.
Unalloyed Ni was also cast, machined, and subsequently oxidized in similar fashion to provide a baseline for comparison. An analysis of the casting from which the Ni specimens were made is given in table I.
Testing Proced u re
Measurements. - Thickness measurements before oxidation testing were taken at eight positions along the diameter of each specimen with a bench micrometer. After oxidation, the specimens were cross sectioned along the diameter of the previous measurement, polished, and etched. The thickness of the unaffected alloy (excluding internal
8

oxides and/or depletion zones when present) was measured using a filar eye piece at approximately the same eight positions. The average of the differences in thickness before and after oxidation is taken as the alloy recession. The accuracy of the thickness measurement, under the best of circumstances, was 0.005 millimeter. Where the reacted alloy - unaffected alloy interface was highly irregular, the accuracy decreased by as much as an order of magnitude.
Isothermal oxidation test. - Isothermal oxidation was carried out at l l O O o C (2012' F)in still air for 100 hours. As shown schematically in figure 2 a continuously recording electrobalance was used for measuring the weight change. The accuracy of the apparatus was *O. 1milligram. The specimens were suspended by a thin quartz rod into the furnace's hot zone and by platinum wire above the hot zone to the balance.
Cyclic oxidation test. - Cyclic oxidation was carried out at l l O O o C (2012' F)in still air for a total time at temperature of 100 hours. Each cycle consisted of 1hour at
1temperature followed by 45 minutes in ambient air. It took 13minutes for the specimens to reach temperature when inserted in the furnace. When withdrawn from the furnace, the specimens cooled to 550' C (1022' F) in 1minute and reached room temperature in
IIL C Balance Analytical -, controls balance
I -1
Graphic weight recorder
Furnace controls
L
Figure 2. - Continuous weight-gain apparatus.
9

Pneumatic cycl inder,-Pneumatic cyl inder
rSolenoid valve
/
L c o u n t e r
Timers4 Am
/
Count1
r P n e u m a f i c cyl inder
r Furnace tube
(a) Cooling position. (b) Heating position.
Figure 3. - Automatic cycl ing and spall collecting apparatus.
7 minutes. As shown schematically in figure 3, the samples were automatically cycled in and out of the furnace by a pneumatic cylinder controlled by t imers operating solenoid valves. The apparatus was equipped with a spall collector that was automatically positioned under the sample during the cooling portion of each cycle. Thus, spalls could be collected and analyzed. The specimens were periodically weighed between cycles. After oxidation, the specimens were analyzed by X-ray diffraction. The retained scales were X-rayed in situ on the diffractometer; the spalls in the Debye-Scherrer camera. The cross section of each specimen was examined metallographically. The etchant in each case consisted of 92 parts hydrochloric acid, five parts sulphuric acid, and three parts nitric acid.
RESULTS
In the next sections the major results of this study are presented. Alloy recession data, the most direct measure of the amount of alloy consumed by oxidation, is pre
10

sented first. Weight change data as a function of time are presented as the only kinetic measurements. Information regarding scale identity and microstructures is also given.
Alloy Recession
The amount of recession of all compositions after 100 hours of isothermal and cyclic oxidation is given in figures 4 to 6. The magnitudes of these thickness changes are generally within experimental error . The accuracy of some of the measurements was less than that of others because of nonuniform interfaces. It is interesting to note that some data points indicate an alloy expansion. Although these positive changes a re within experimental error , there is the possibility of an actual net expansion due to changes within the alloy. For example, the alloy near the scale-alloy interface may be depleted of A1 during oxidation. This change in composition could shift the lattice parameters toward higher values, increasing the volume of the specimen. One of the difficulties of alloy recession determinations is locating the actual boundary of the unaf
r 0 _ _ ,,-Ni (isothermal and cycl ic) --'rNi-1OAl ( isothermal)
, //'-Ni-lOAI (cyclic)_ _
E E
-.8t - L o t
J 0 1 3I 10I 1
a t 70chromium a t % si l icon
(a) Nickel, Ni-lOAI, and y ( b ) y alloys wi th silicon. alloys wi th chromium.
Isothermal data taken after 100 hr
Cyclic data taken after 100 cycles
0 1 3 10 a t 70 t i tan ium
(c )y alloys wi th t i tanium.
Figure 4. - Recession of nickel and y-phase alloys. Temperature, ll@C; air. (Range-of-value bars are shown on ly when range exceeds 0.025 mm. )
11

c
u
0 -
u
.08 - $ Isothermal data taken after 100 h r
r Ni-25AI (isothermal $ Cyclic data taken F I i c ) after 100 cycles
0 E E
.-0 9.1.VI -.08 rN i (iso- 1. a, thermal 1 7 % L
and cycl ic) -Q -.16
-_22 I L I I (27 cycles) 40 1 3 10 0 1 3 10 0 1 3
at. %chromium a t %s i l i con a t %t i t an ium
(a) Nickel, Ni-25AI, and y' (b) y' alloys wi th silicon. ( c l y ' alloys wi th t i tanium. alloys wi th chromium.
Figure 5. - Recession of y'-phase alloys tested at llOOoC in air. (Range-of-value bars are shown only when range exceeds 0.025 mm. 1
3 Isothermal data taken after 100 hr
$ Cyclic data taken after 100 cycles (1hr at temperature per cycle)
rN i -50A I (cyclic) r r E E
Ni-50AI (isothermal) N i I t
a,
L As-cast material rIAs-cast material 0
t -.22
0 1 3 10 at. % chromium a t %s i l i con a t %t i t an ium
(a) Nickel, Ni-50A1, and p (b) p alloys wi th silicon. (c) p alloys wi th titanium. alloys wi th chromium.
not single phase I not single phase As-cast material ta -.16 not single phase
Figure6. - Recession of p phase alloys tested at llO@C in air. (Range-of-value bars are shown only when range exceeds 0.025 mm. )
12
10

fected alloy. Of the y alloys (fig. 4) under isothermal conditions, the 1-, 3-, and 10atomic-percent Si and the l-atomic-percent Ti recessed to a lesser extent than Ni-1OA1. Unalloyed Ni recessed the least of any of the y phase materials except Ni-1OSi. However, under cyclic oxidation, the Ni-1OSi recessed more than Ni. The recession of Ni was identical under isothermal and cyclic conditions. The y alloys that recessed less than Ni-1OAl after cyclic oxidation are 1, 3, and 10 atomic percent Si. After either isothermal or cyclic oxidation no y' alloys recessed less than Ni-25A1 (fig. 5) and no p alloy recessed less than Ni-5OA1 (fig. 6).
Kinet ic Data (Isothermal)
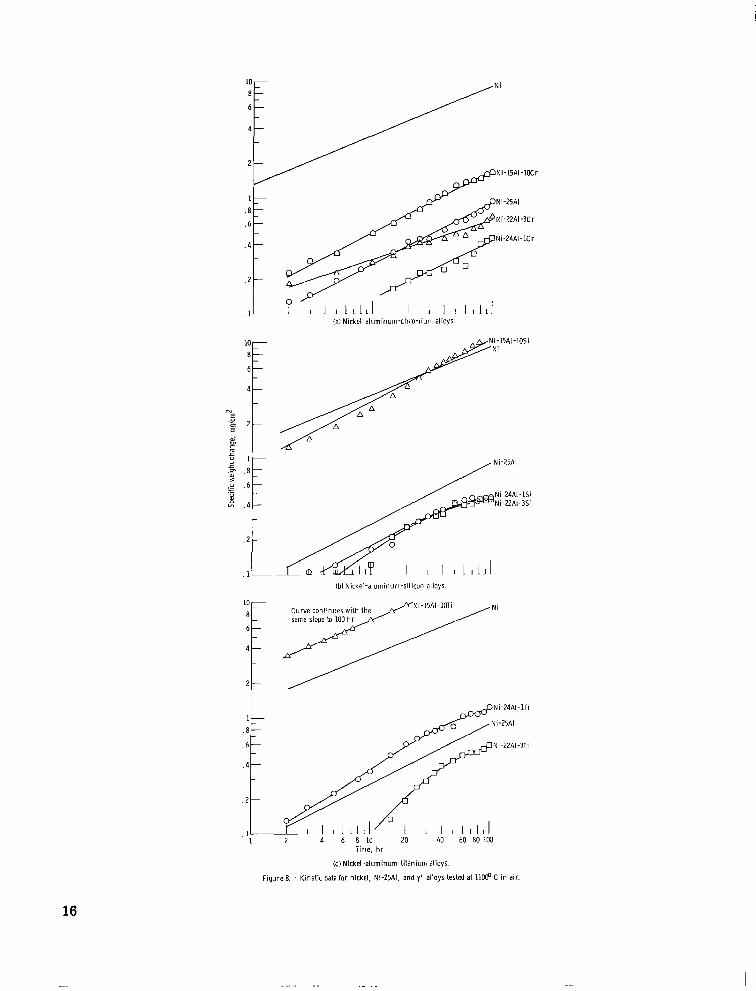
Graphs of the square of the specific weight change as a function of time were constructed for each composition. Where the curves were linear, parabolic rate constants were calculated and listed in table III. The oxidation mechanisms for most of these alloys are complex, so the rate constants represent an overall process that proceeds more or less parabolically. Figures 7 to 9 are logarithmic plots of the specific weight changes as functions of time for the alloys studied. The slopes were determined in those cases where a linear relation existed and are listed in table III.
Among the y alloys (fig. 7), the 1-, 3-, and 10-atomic-percent Si and the 1atomic-percent Ti gained less weight than Ni-10A1. The weight gain of 10-atomicpercent Si was even less than that of Ni, but its slope is greater than that for Ni (or for Ni-1OAl). With the y' alloys (fig. 8), the 1- and 3-atomic-percent Cr, the 1- and 3atomic-percent Si, and the 3-atomic-percent Ti gained less weight than Ni-25A1. The 10-atomic-percent Si gained weight at roughly the same rate as Ni, and the 10-atomicpercent Ti gained weight at a greater rate. Among the p alloys (fig. 9), the l-atomicpercent Si was the only alloy to gain less weight than Ni-50A1. The 3-atomic-percent Si and the l-atomic-percent Ti gained roughly as much weight in 100 hours at Ni-5OA1, but the slopes of their curves are greater.
Cyclic Oxidation
Figures 10 to 12 show the net specific weight changes during cyclic oxidation. These weight differences are the net effect of weight gain by oxidation and weight loss by spalling. For the y alloys (fig. 10)only the l-atomic-percent Si had a net specific weight change less than Ni-1OAl after 100 hours at temperature. The Ni-lOAl had no detectible spalling for the first three cycles, but thereafter spalled a great deal. Unalloyed Ni did not spall, its cyclic oxidation curve being identical to its isothermal
13

TABLE III. - OXIDATION RATES
~ O O C, air]hr, 1100~ .. .~
Composi t ion Parabol ic r a t e constant, Slope of log-log graph (mg/cm2I2 /k (see figs. 7 - 15)
Ni 0 .76 0 .41 Ni-1OA1 NPa .42 Ni -9A1- 1C r N P V a r i e s Ni-7A1-3Cr 8. 7 . 5 3 Ni-1OCr N P . 4 4 Ni- 9A1- 1Si N P V a r i e s Ni-7A1- 3Si N P V a r i e s Ni- 1OSi N P . 7 Ni-9Al-1Ti N P Var i e s Ni-7A1-3Ti 9 . 8 . 5 3 Ni-1OTi N P V a r i e s
Ni-25A1 0.0077 0 .46 Ni-2 4A1- 1 C r .0019 . 4 8 Ni- 22A1-3 C r N P . 3 5 Ni- 15A1-1OCr .027 . 5 0 Ni-24A1-1Si N P V a r i e s Ni-22A1-3Si N P V a r i e s Ni- 15A1- 1OSi 1 . 2 1 . 5 5 Ni-24A1-1Ti N P Var i e s Ni- 22A1- 3T i N P Var i e s Ni- 15A1-1OTi 3 . 9 . 4 6
Ni-50A1 0 .0021 0 .52 Ni-49A1- 1 C r .0046 . 5 0 Ni- 47A1-3 C r . 016 . 5 0 Ni-40A1-10Crb . 3 1 . 5 0 Ni-49Al-lSib N P Var i e s Ni-47A1-3Si (c ) 1 . 0 Ni-40A1- lOSi N P V a r i e s Ni-49Al-1Ti .0017 . 5 8 Ni- 47A1-3Ti N P Var i e s Ni-40A1- 10Tib . 049 . 4 8
-__ 'Overall reac t ion r a t e is not parabol ic . 'As c a s t m a t e r i a l not single phase . -Linear r a t e .
14

40
1 I I I I I I I I l l A (a) Nickel-aluminum-chromium alloys.
Ib) Nickel-aluminum-silicon alloys.
I I I I I L U l1 2 4 6 8 1 0 20 40 60 80 1W
Time, hr
(c) Nickel-aluminum-titanium alloys.
Figure 7. - Kinetic data for nickel, Ni-IOAI, and y alloys tested at ll& C in air.
15
!a1 Nickel-aluminum-chromium alloys.
Ni-25A I
Ni-24AI - l S i Ni -22AI -35i
!bl Nickel-aluminum-si l icon alloys
N i - 15AI- l O T iCurve continues wi th the
Time, h r
I c I Nickel-aluminum-ti tanium alloys.
Figure 8. - Kinetic data for nickel, Ni-25AI. and y' alloys tested at l l O @ C i n a i r
16
~ _... .~ ... . _

.1
. 2 . I not single pharel
. I
la1 Nickel -a luminum-chromium alloys.
10
. 8
i-47AI-3Si
Ln .l- Ni-50Ai
-Ni-49AI - l S i
~. 2 - (As-cast material not single pharel
ibl Nickel -a luminum-s i l icon alloys.
10
ANiNi-4OAI -101i (As-cast material not single phare l
. 8
. 6
.4
. 2:d
IC) Nickel-aluminum -t i tanium alloys.
A Ni-49AI -1Ti
F igure 9. - Kinetic data fo r nickel. Ni-50AI. and P alloys tested a t llC@C in a i r
17

*O r 0
-20
-40
-60
Ni-10Cr -235 mglcm' after 15 cycles
r
, Ni-7AI-3SiJ.1\yi-lmi r Ni-7AI-3Ti
I I 1 0 20 40 60 80 100
Accumulated t ime at temperature, hr
(a) Nickel-aluminum-chromium alloys. (b) Nickel -al u m in u m-si1 icon and nickela luminum-t i tanium alloys.
Figure 10. - Cyclic oxidation data fo r nickel, Ni-lOAI, and y alloys. Cycle: 1h o u r at temperatureCIper cycle; in air.(1108
2
0
-2
-4
0
-2
-4
15AI- 10si
Ni-22AI -3Si Ni-24AI-1Si
Ni-25AI
I (b) Nickel-aluminum -si1 icon alloys.
Ni-24AI - lT i Ni-22AI -3Ti
i-25AI
1 I n 20 40 60 80 100 0 20 40 60 80 100
Accumulated t ime at temperature, hr
(a) Nickel-alum in u m -chromium alloys. (c ) Nickel-aluminum-titanium alloys.
Figure 11. - Cyclic oxidation data fo r nickel, Ni-25A1, and y' alloys. Cycle: l h o u r at temperature (1108 C) per cycle; in air.
18

Ni-4OAI -1OSi 2
1 Ni-49AI -1Si (As-cast material
(As-cast material 0 Ni-47AI-3Si
-1 (b) Nickel-a1 uminum-si1 icon alloys.
3
2
1
0 20 40 60 80 100 0 20 40 60 80 100 Accumulated time at temperature, hr
(a) Nickel -a luminum -ch rom ium alloys. (c) Nickel -al um inum -t i tan ium alloys.
Figure 12. - Cyclic oxidation data for nickel, Ni-50AI, and p alloys. Cycle: 1hour at temperature CllO@ C) per cycle; in air.
curve. Among the y' alloys (fig. 11)the 1-, 3-, and 10-atomic-percent Si and the 1and 3-atomic-percent Ti had slightly less net specific weight change than Ni-25A1. For Ni-25A1 no spalling was detected for the first 24 cycles, and the sample spalled only slightly thereafter. With the p alloys (fig. 12) the 1- and 10-atomic-percent Si and the 10-atomic-percent Ti had cyclic oxidation curves identical to their respective isothermal curves. Spalls from the 10-atomic-percent Si specimen were barely detected and were undetected for the 1-atomic-percent Si and the 10-atomic-percent Ti. The 3-atomicpercent Si and the 3-atomic-percent Ti samples had no detectible spalling, but their respective cyclic and isothermal curves were not identical. It must therefore be assumed that the samples spalled during the cyclic oxidation tests and that the spalls were blown out of the spall collector. The loss of spalls in this manner is possible since the specimens were not completely enclosed by the spall collector (fig. 3). For Ni-5OA1no spalls were detected during the first 24 cycles and only slight spalling occurred thereafter.
Post-Ox idation Exa mi nat ion
Table II lists the oxide phases detected by X-ray diffraction. The predominant phase in all the y alloys was NiO, although strong spinel lines were observed in many
19

cases. In some 7' alloys, NiO was the predominant phase, and in others, A1203 was predominant. All the 7' alloys had spinel phases. In 6 alloys A1203 was the predominant oxide and most often was the only oxide. Table IV lists compositions which formed internal oxides or depletion zones when oxidized. The term depletion zone is used here to mean the loss during oxidation of elements from the alloy near the scale-alloy interface. It includes the situation where, in a single-phase alloy, the next lower phase is stabilized near the interface and the situation where, in a multiphase alloy, one of the phases is no longer stable near the interface. No depletion zones were observed in any of the y
alloys. No internal oxide was observed in any of the /3 alloys. The y alloys with internal oxides had morphologies similar to Ni-lOAl (fig. 13). Those without an internal oxide appear as in figure 14. In the particular case illustrated in figure 14, the oxide scale was not very adherent. All y' alloys had complex scales of various thicknesses.
TABLE IV. - O X D I Z E D ALLOYS WITH AN INTERNAL OXIDE
OR A DEPLETION ZONE
~ I O O OC, airJ
'has t In te rna l oxide Depletion zone
I so therm a1 (100 h r )
Ni-1OA1 Ni-9Al-1Cr Ni- 7A1-3 C r
Ni-1OCr Ni -7A1- 3Si Ni-7A1-3Ti Ni-1OTi
3' '
-P
a15 cyc les .
Cyclic I so the rma l cyc l i c (100, 1-hr cyc les ) (100 hr) (100, 1-hr cycles
Ni-1OAI Ni-9A1- l C r a Ni-7A1- 3Cra
Ni- 7A1-3Si Ni- 7A1- 3Tia
Ni -2 5A1 Ni-25A1 - _ _ - _ _ _ - - _ _ _Ni-24A1-1Cr - _ _ _ _ _ _ - - _ - -Ni-22A1-3Cr Ni- 15A1- 1OCr Ni-15Al-1OCr Ni- 15A1-1OSi Ni-15Al-1OSi _ - - _ _ _ _ - - _ _ _Ni-24A1-1Ti Ni- 22A1- 3Ti Ni-22A1-3Ti Ni-15A1-1OTi Ni- 15A1-10TiC
. . - -
Ni-40Al-10Tie Ni-40A1- 10Tie
bNo y a l loys had a depletion zone. '27 cyc les . dNo a l loys had a n in t e rna l oxide. eAs-cas t m a t e r i a l not single phase.
20

p rJm *_is
- 1 C - 7 1 - 3 Z
(a) Isothermally oxidized and etched. (b) Cyclically oxidized and etched.
Figure 13. - Ni-1OAI oxidized in a i r at 1100' C for 100 hours at temperature. Note presence of in ternal oxide.
. i i
/
* 100 pnu
C-71-1435
(a) Isothermally oxidized and etched. (b) Cyclically oxidized and etched.
Figure 14. - Ni-9Al-1Si oxidized in a i r at 1100" C for 100 hours at temperature. Note absence of in ternal oxide.
Figure 15 shows a typical y' alloy with a complex scale and a depletion zone. The sharp boundary of this zone suggests that a new phase, in this case y, was formed. All the y' alloys that had depletion zones were of this type, showing surface stabilization of y. The thickness of the zone varied with the original composition of the alloy. Of the p alloys, the 1-atomic-percent Cr, and the 1- and 3-atomic-percent Si, and the 1- and 3-atomic-percent Ti had thin, single-layer scales as shown in figure 16 for Ni-5OA1. Figure 16 is typical of these alloys. The 3- and 10-atomic-percent Cr, the 10-atomic-percent Si, and the 10-atomic-percent Ti had complex scales, as seen, for

C-71-1436
Figure 15. - Ni-15Al-1OSi isothermally oxidized in a i r at 1100" C for 100 h o u r s and etched. Note depletion zone with sharp boundaries beneath a complex scale.
22

I
(a) Isothermally oxidized and etched.
Ibl Cyclically oxidized and etched.
Figure 16. - Ni-%AI oxidized i n a i r at 1100- C for 100 hours at temperature. Note a single layer scale of Al2O3.
23

(a) Isothermally oxidized and etched. (b) Cyclically oxidized and etched.
Figure 17. - Ni-KIAl-lOTi oxidized in a i r at 1100" C for 100 h o u r s at temperature. Note complex scale. (The as-cast material was not single phase.)
f i g u r e 18. - Ni-40Al-1OCr cyclically oxidized in a i r at 1100" C for 100 hours at temperature and e t c h d . Massive grain boundary attack shown occurred at only a few points along the alloy scale interface. (The as-cast material was not single phase.)
24
. ..

example, in figure 17 for the 10-atomic-percent Ti alloy. The 10-atomic-percent Cr displayed massive grain boundary attack at a few points along the alloy-scale interface as well as a complex scale (fig. 18). Electron microprobe scans showed Cr to be the predominant element in these oxidized grain boundaries.
DISCUS S I ON
Erroneous conclusions regarding the comparative oxidation resistance of a group of materials a re possible if judgment is based solely on one criterion. For example, the net specific weight change for Ni-15Al-1OSi is less than that for Ni-25A1 (fig. l l(c)) . Based on this observation it could be concluded that Ni-15A1-lOSi is more oxidation resistant than Ni-25A1. However, i f all the data given here a re considered, then clearly Ni-25A1 is more oxidation resistant. In this case the parabolic rate constant for Ni15A1-1OSi (which forms an internal oxide and a depletion zone) is two orders of magnitude greater than for Ni-25A1 (table III). Thus, Ni-15A1-lOSi may spa11 less but the amount of alloy consumed is greater. That this is the case is also evident from the recession data (fig. 5) . Even isothermal weight changes by themselves may be misleading because of, for example, the vaporization of reaction products. Chromium, vanadium, molybdenum, and tungsten bearing alloys are known to form volatile oxides (ref. 12). From an engineering point of view the most meaningful oxidation parameter (or corrosion parameter in general) is the amount of alloy recession. Recession rates can help the designer to calculate the loss in load bearing capacity, assuming that an alloy of specified thickness will behave mechanically the same as a corroded alloy of the same thickness of unaffected alloy. There are difficulties, however, in the determination of alloy recession by thickness measurements. It is a destructive test and requires numerous specimens if it is used for following the rate of oxidation. Nonuniform interfaces, which are frequently encountered in oxidation, greatly diminish the accuracy of the measurement. Finally, the actual boundary of the unaffected alloy may be mistaken because dissolved or depleted elements may not be revealed by an optical observation.
In this study four criteria were used to determine those compositions with oxidation resistance better than their respective Ni-A1 binary alloy. The criteria are (1)alloy recession (isothermal), (2) alloy recession (cyclic), (3) kinetic data (log-log curves), and (4) net specific weight change during cyclic oxidation. Those compositions found to be better than their respective binary alloy in at least one criterion and as good as in the remaining criteria were judged more oxidation resistant than their respective binary alloy.
Among the y alloys Ni-9A1-1Si was the only one more oxidation resistant than Ni-10A1. None of the y alloys were better than Ni. Among the y' alloys Ni-24A1-1Si
25
.. .. .

and Ni-22A1-3Si were more oxidation resistant than Ni-25A1. The y' alloys with 0, 1, and 3 atomic percent of Cr, Si or Ti were more oxidation resistant than Ni. Of the p alloys, the only composition more oxidation resistant than Ni-50Al was Ni-49A1- 1Si. However, the as-cast material was not single phase. All the alloys were more oxidation resistant than Ni.
The better oxidation resistant alloys cited above had the following in common: all contained Si, none had an internal oxide nor a depletion zone, and none had an overall parabolic oxidation rate. The isothermal log-log curves for these alloys had varying slopes which decreased with time.
Based on these four criteria, the poorest oxidation resistant y alloys were judged to be those with 10-atomic-percent Cr or Ti and the poorest y' alloys were those with 10-atomic-percent Cr, Si, o r Ti. The poorest P alloys were also those with 10-atomicpercent Cr, Si, o r Ti.
SUMMARY OF RESULTS
Isothermal and cyclic oxidation of y, y', and phase alloys of the nickel-aluminum (Ni-A1) system were performed at l l O O o C (2012' F) for up to 100 hours at temperature. The cast alloys contained 0, 1, 3, and 10 atomic percents of chromium (Cr), silicon (Si), o r titanium (Ti) substituted for the A1 in Ni-1OA1 ( y ) , Ni-25A1 (y ' ) , and Ni-50Al (0). Alloy thickness changes and weight changes were measured, and the oxidation products examined by X-ray diffraction and by metallography. Combining the information from all measurements and observations, a qualitative judgment of the oxidation resistance of each composition was made. Each composition was compared with the behavior of unalloyed nickel and the appropriate binary y, y', or alloy. These comparison may be summarized as follows:
1. All y alloys had poorer oxidation resistance than Ni. Only the 1-atomicpercent Si alloy was more oxidation resistant than Ni-1OAl. The compositions with 10-atomic-percent Cr or Ti had the least oxidation resistance of the y alloys.
2. The y' alloys with 0-, 1-, and 3-atomic-percent Cr, Si, or Ti were more oxidation resistant than Ni. Those with 1- and 3-atomic-percent Si were more resistant than Ni-25A1 and as resistant as the best of the P alloys. The compositions with 10atomic-percent Cr, Si, or Ti had the least oxidation resistance of the y' alloys.
3. All the p alloys were more oxidation resistant than Ni, but those with 10atomic-percent Cr, Si, or Ti were less oxidation resistant than the other p alloys. The 1-atomic-percent Si was more oxidation resistant than Ni-5OA1, but the as-cast material was not single phase.
26

4. The better oxidation resistant alloys cited had the following in common: all contained Si, none had an internal oxide nor a depletion zone, and none had an overall parabolic oxidation rate. The isothermal log-log curves for these alloys had varying slopes which decreased with time.
Lewis Research Center, National Aeronautics and Space Administration,
Cleveland, Ohio, April 6, 1971, 129-03.
REFERENCES
1. Ignatov, D. V. ; and Shamgunova, R. D. : Mechanism of the Oxidation of Nickel and Chromium Alloys. NASA TT-F-59, 1961.
2. Rentz, W. A.; and Donachie, M. J . , Jr. : Oxidation and Sulfidation Corrosion of Nickel-Base Superalloys. Paper C6-18.5, ASM, Oct. 1966.
3. Giggins, C. S. ; and Pettit, F. S. : Oxidation of Ni-Cr Alloys Between 800' and 12OO0C. Trans. AIME, vol. 245, no. 12, Dec. 1969, pp. 2495-2507.
4. Pettit, F. S. : Oxidation Mechanisms for Nickel-Aluminum Alloys at Temperatures Between 900Oand 1300' C. Trans. AIME, vol. 239, no. 9, Sept. 1967, pp. 12961305.
5. Richmond, Joseph C. ; and Thornton, H. Richard: Oxidation of Experimental Alloys. Part 1. National Bureau of Standards (WADC-TR-58-164, pt. l), June 1958.
6. Tumarev, A. S.; and Panyushin, L. A. : Scale Resistance of Alloys in the Ternary System Ni-Al-Cr. NASA TT F-13221, 1970.
7. Kosak, R., Jr. : The Oxidation Mechanism of the Ni-Cr-A1 Alloys. Ph.D. Thesis, Ohio State Univ., 1969.
8. Gil'dengorn, I. S. ; and Rogelberg, I. L. : High-Temperature Oxidation of Nickel-Silicon-Aluminum Alloys. Phys. Metals Metallog., vol. 20, no. 2, 1965, pp. 6064.
9. Guts, A. V.; and Tumarev, A. : Kinetics and Mechanism of Oxidation of Binary Alloys of Nickel with Titanium. FTD-HT-67-265, Foreign Technology Div., Air Force Systems Command, Sept. 1967. (Available from DDC! as AD-672339. )
10. Wachtell, Richard L. : An Investigation of Various Properties of NiA1. American Electro Metal Corp. (WADC-TR-52-291), Sept. 1952.
27

11. Taylor, A.; and Floyd, R. W. : The Constitution of Nickel-Rich Alloys of the Nickel-Chromium-Aluminum System. J. Inst. Metals, vol. 81, pt. 9, May 1953, pp. 451-464.
12. Kofstad, Per: High-Temperabe Oxidation of Metals. John Wiley & Sons, Inc., 1966.
28 NASA-Langley, 1971 -17 E-6225
I

/ , . /
< .
NATIONAL ANDAERONAUTICS WASHINGTON, D. c. 20$&.f
OFFICIAL BUSINESS ' ? '{ , , ' FIRST CLASS MAIL
PENALTY FOR PRIVATE USE
POSTAGE A N D FEES PAID NATIONAL AERONAUTICS ANI)
,' ". .-.. . .-. . . SPACE ADMINISTRATION *,
, ' , 005 001 C1 U 17 ?I0716 S00903DS DEPT flF THE A,ER FORCE M e A PP.NS ,d& A R OR A TORY / L4 L OF /
E. A ~ T N ~LOU B O W M A N , C H I E F T E C H LIBRARY-',1 1 , KIKftANDc: A F R N M 87117
' 1
POSTMASTER: If Undeliverable (Section 158 Postal Manual) Do Not Return
"The aeronautical and space activities of the United Stntes shall be condzicted so as to contribute , . . t o the expansioia of human knowledge of phenomena in the atmosp.here and space. T h e Administration shall provide for the widest practicable and appropriate dissemination of inforiiratjon concerning its actizdies and the restilts thereof."
-NATIONALAERONAUTICS AND SPACE ACT OF 1958
NASA SCIENTIFIC AND' TECHNICAL PUBLICATIONS
TECHNICAL REPORTS: Scientific and technical information considered important, ..'
complete, and a lasting contribution to existing, knowledge.
TECHNKCAL NOTES: Information less broad in scope but nevertheless of importance as a contribution to existing knowledge.
TECHNICAL MEMORANDUMS: Information receiving limited distribution because of preliminary data, security classification, or other reasons.
CONTRACTOR REPORTS: Scientific and technical information generated under a NASA contract or grant and considered an important contribution to existing knowledge.
TECHNICAL TRANSLATIONS: Information published in a foreign language considered to merit NASA distribution in English.
SPECIAL PUBLICATIONS: Infohation derived from or of value to NASA activicies. Publications include conference proceedings, monographs, data compilations, handbooks, sourcebooks, and special bibliographies.
TECHNOLOGY UTILIZATION PUBLICATIONS: Information on technology used by NASA that may be of particular interest in commercial and other non-aerospace applications. Publications include Tech Briefs, Technology Utilization Reports and Technology Surveys.
Details on the availability of ihese publications may be obtained from:
SCIENTIFIC AND TECHNICAL INFORMATION OFFICE
NATIONAL AERONAUTICS AND SPACE ADMINISTRATION Washington, D.C. PO546