nasa technical nasa tm t memorandum technical nasa tm x-52179 t memorandum i ... the surface...
TRANSCRIPT

N A S A T E C H N I C A L NASA TM X-52179 t M E M O R A N D U M
I
E c
N 6 6 - 1 7 5 7 5 e v)
z ITHRU)
a IACCESSIQW NUMBER) -
r r (PAGES) '
z (NASA f M / i - . 5 2 / 7 4 CR OR TMX OR AD NUMBER)
0,
(CATEQORYI
INCIPIENCE, GROWTH, AND DETACHMENT OF BOILING
BUBBLES IN SATURATED WATER FROM ARTIFICIAL
NUCLEATION SITES OF KNOWN GEOMETRY AND SIZE
by John R. Howell and Robert Siege1 Lewis Research Center Cleveland, Ohio
GPO PRICE $
CFSTl PRICE(S) $
I Hard copy (HC) z * @ a TECHNICAL PAPER proposed for presentation at Microfiche (MF) c 37 Third International Heat Transfer Conference
ff 663 July 65
Chicago, Illinois, August 8-12, 1966
NATIONAL AERONAUTICS AND SPACE ADMINISTRATION WASHINGTON, D.C. 1966
https://ntrs.nasa.gov/search.jsp?R=19660008286 2018-05-31T10:51:29+00:00Z

INCIPIENCE, GROWTH, AND DETACHMENT OF BOILING BUBBLES
IN SATURATED WATER FROM ARTIFICIAL NUCLEATION
SITES OF KNOWN GEOMETRY AND SIZE
by John R. Howell and Robert Siege1
Lewis Research Center Cleveland, Ohio
TECHNICAL PAPER proposed for presentation at
Third International Heat Transfer Conference Chicago, Illinois, August 8- 12, 1966
NATIONAL AERONAUTICS AND SPACE ADMINISTRATION
AIChE

INCIPIENCE, G R O W , AND DETACHMENT OF BOILING BUBBLES I N SATURATED WATER FROM ARTIFICIAL NUCLEATION SITES OF KNOWN GEOMETRY AND SI=
by John R. Howell and Robert Siege1
Lewis Research Center National Aeronautics and Space Administration
Cleveland, Ohio
ABSTRACT
A r t i f i c i a l nucleation s i t e s were d r i l l e d i n a polished metal surface. The formation of bo i l ing bub- b les was studied by e l e c t r i c a l l y heating the surface in saturated d i s t i l l e d water and obtaining surface temperature, heat f lux , and photographic data. The surface temperature e leva t ion above sa tura t ion required t o produce ebu l l i t i on is given as a function of s i t e radius and compared with three ava i lab le analyses. Data giving bubble growth as a func t ion of s i t e radius and surface temperature e leva t ion i s provided and compared with theo re t i ca l growth re la t ions . a r e found t o be i n good agreement.
A t bubble detachment the buoyancy and surface tension forces
AUSZU:
An Hand von i n eine po l i e r t e Metal1 Oberfllche gebohrten Lb’chern von bekannter Geometrie und Grb’sse w r d e die Formierung von Dampfblasen s tud ie r t . d i s t i l l i e r t e n Wasser wurden Temperatur- und Wgrmeflussverhkhtnisse sa r i e Photographien e rha l ten . Aufwallung erforderliche Oberflgchentemperaturanstieg G‘ber den Siittigungspunkt hinaus wird i n Abhzngigkeit vom Lochradius Die Ergebnisse fiir Blasenentwick- lung i n Abhbgigkeit von Lochradius und Oberflgchentemperaturanstieg werden mi3 theoretischen Entwick- lungsbeziehungen verglichen. Auftrieb und Oberfl&henspannung gefunden.
h r c h e lek t r i sches Heizen der Oberfl&be i n gesgttigtem Der zur
und i m Vergleich m i t d r e i vorhandenen Analysen gegeben.
I m Moment des Loslb’sens der Blasen wurde eine gute Ubereinstimmung zwischen
INTRODUCTION
The boi l ing phenomena has been the subject of numerous research e f fo r t s , a s surveyed f o r example i n [l]’ and [ a ] . These inves t iga t ions have re- vealed t h a t many f ac to r s a f f ec t boil ing, and a t present there i s no simple cor re la t ion t h a t s a t i s - f a c t o r i l y accounts fo r a l l t he parameters involved. A s a consequence, some recent research has taken t h e view t h a t a quant i ta t ive understanding of t h e bo i l ing problem w i l l only be achieved by a re turn t o very bas ic s tud ies of t he boi l ing process, s t a r t i n g with the formation of individual bubbles and t h e i r growth and departure. under which bubbles w i l l be produced from a speci- f i e d cavi ty i s t he pr inc ipa l subject of t he present
Analytical predictions of t he c r i t e r i a f o r the
The conditions
study.
i n i t i a t i o n of bubble growth have been made [ 3 t o 51, but only l imi ted experimental da ta a re
‘Numbers i n brackets denote references. A. I .Ch .E.
available [ 5 t o 81 r e l a t ing bubble formation t o a known s i t e s ize and geometry, so t h a t a sa t i s fac- t o ry ve r i f i ca t ion of these analyses has not been possible. The analyses of bubble incipience c r i - t e r i a by Hsu [ 31 and Han and G r i f f i t h [ 41 a r e qui te similar. Both are based on the assumption t h a t a surface cavity has a hemispherical vapor cap over it tha t serves a s a bubble nucleus, and both assume t h a t t h i s nucleus w i l l begin t o grow only when the thermal layer of superheated l i qu id adjacent t o the surface i s of a su f f i c i en t thickness. The chief difference i n the two analyses l i e s i n the assump- t i o n of the thermal layer thickness required t o produce growth f o r a vapor nucleus of a given height. With an assumed re l a t ion between t h e thermal layer thickness and the bubble nucleus s i ze a t incipience, a r e l a t ion between ac t ive cavity s ize and surface temperature elevation i s derived. The t r ans i en t conduction equation i s used t o pro- vide the temperature d i s t r ibu t ion i n the thermal layer, and the required temperature difference f o r bubble growth i s found from the Clausius-Clapeyron equation. For sa tura t ion conditions, Han and Gr i f f i t h [41 f ind the maximum and minimum cavity

2
m Q) rl M I 3
s i zes t h a t can be act ive under a constant temperature t o be given by
surface
(1)
Hsu [3 ] gives the r e l a t i o n
where t h e constants C 1 and C 3 a r e functions of t he bubble-surface contact angle and the angle be- tween t h e surface and the tangent t o the cavity mouth. Hsu a l so presents an equation fo r t he s i ze range of act ive nucleation s i t e s f o r the case of constant heat f l ux a t t h e wall.
G r i f f i t h and Wallis [SI, among others, use the Clausius-Clapeyron equation and the Gaussian ex- pression which r e l a t e s surface tension and r a d i i of curvature t o the pressure difference across the bubble interface t o determine the act ive cavity radius. This r e s u l t s i n the expression
( 3 )
I n contrast with Equations (1) and (2 ) , t h i s r e l a - t i o n does not indicate a maximum cavi ty s i z e and p red ic t s t h a t only small (AT)i quired t o i n i t i a t e bubbles from l a rge cavi t ies . ac tua l t r end of (AT)i with R, has not been com- p l e t e ly resolved experimentally.
vapor nucleus i s present, they apply only t o a range of cavi ty s i zes i n which vapor (o r gas) i s entrapped. The m a x i m u m s i ze should thus be l imited t o the maxi- mum cavi ty s i ze which w i l l not allow replacement of vapor within the cavi ty by t h e surrounding l iquid. Bankoff [ 9 ] presents a method by which t h i s s i ze may be establ ished f o r ce r t a in systems.
The present study was undertaken t o experimen- t a l l y determine t h e temperature conditions required f o r a cavi ty t o become active. Because of the many parameters t h a t could a f f ec t the system, a simple configuration was chosen, and saturat ion conditions were establ ished f o r a l l t e s t s . Yatabe and Westwater [ E ] noted t h a t cavi ty shape appears t o have l i t t l e e f f ec t on nucleating character is t ics , SO
t h a t t h e only cavi ty parameter varied systemaiicaiiy was t h e diameter. The only system parameter varied was surface temperature (and therefore, of course, surface heat f l u x ) . I n addition t o cavi ty act iva- t i o n data, high-speed motion pictures were taken at and near incipience of bubble formation t o study the nature of both t h e vapor nucleus and the bubble growth and departure cha rac t e r i s t i c s from s i t e s of known s i ze and geometry.
values would be re- The
Since t h e nucleation theories postulate t h a t a
Heated Test Sections
The t e s t specimens were made from number 410 s t a i n l e s s s t e e l s t r i p s , 4 inches long, 1/2 inch wide, and 1/16 inch thick. The magnetic properties of t h i s a l loy allowed f i n e polishing on avai lable equipment t h a t u t i l i z e d magnetic clamps. The s t r ip s were polished on a l l edges and on one f ace t o a roughness l e s s than 4 microinch rms. A 20-gage Chromel-Alumel thermocouple was then spotwelded t o t h e cen te r of t h e unfinished face of t h e specimen.
The thermocouple leads were run p a r a l l e l t o t he s t r i p t o reduce conduction losses . The s t r i p was then placed i n a mold which l e f t only t h e f inished face exposed, and epoxy r e s i n was cast around the remaining s ides providing a block of thermal insu-
l a t i o n 4 x 1 x 7 1 inches. The a r t i f i c i a l nucleation s i t e s were.dr i l led i n t o the polished face, and t h e e n t i r e specimen was cleaned ul t rasonical ly i n alco- hol, and f i n a l l y i n d i s t i l l e d water.
A r t i f i c i a l S i t e s
Two types of a r t i f i c a l s i t e s were studied. The f irst type was d r i l l e d by electron-beam dis in- t eg ra t ion i n t h e hope of producing extremely small diameters. However, t he smallest s i t e diameter a t - t a ined by t h i s method was 0.0025 inch. t h e dis integrat ion tended t o leave a cratered area outside the ac tua l hole diameter. This l e f t some doubt a s t o the exact geometry of the cavity. A photograph of such a cavi ty i s shown i n Figure l ( a ) .
The second type of a r t i f i c i a l s i t e was pro- duced by a mechanical drill. t h a t was qui te round at the surface and with no c ra t e r ing evident, (Fig. l ( b ) ) . Diameters near a minimum of 0.003 inch were a t t a ined by t h i s method using d r i l l s of 0.002-inch nominal diameter.
same nominal diameter were d r i l l e d about 1 inch apart . Three s t r i p s were t e s t e d where e i t h e r 4 o r 6 holes of various diameters were d r i l l e d about 314 inch apart i n a staggered pat tern i n t o the same s t r ip , so t h a t t he e f f e c t of s i t e diameter could be observed while all t h e s i t e s were under iden t i ca l conditions.
The s i t e diameters were measured using a metallograph with a cal ibrated eyepiece, and the accuracy was estimated a s *0.0002 inch f o r mechan- i c a l l y d r i l l e d s i t e s . accuracy was about *0.0005 inch because of the un- ce r t a in ty introduced by the cratering.
A depth gage on the precis ion drill press provided t h i s measurement f o r t he mechanically d r i l l e d cavi- t i e s , and typ ica l values a re given i n Table I. The expended energy and time of dis integrat ion were used t o estimate the hole depths obtained by electron-beam dis integrat ion. The depth-diameter r a t i o ranged from about 112 t o 3 and had no e f f e c t on bubble act ivat ion.
I n addition,
This produced a hole
I n most of the t e s t s t r i p s , two s i t e s of t he
For the electron beam s i t e s ,
Cavity depths were measured during d r i l l i ng .
Pool Boi ler
The b o i l e r consisted of a cy l ind r i ca l s ta in- less s t e e l tank 1 4 inches i n diameter and 30 inches high. Two 8-inch-diameter quartz windows were pro- vided f o r viewing o r photography. Four 1000-watt heaters near t h e bottom of the tank provided aux- i l i a r y heat t o assure saturat ion conditions within t h e boi ler . Two Chromel-Alumel thermocouples were immersed i n t h e boi l ing water t o monitor t he bulk temperature. e lectrodes extending down through the water. The t e s t specimen was clamped t o t h e electrodes with t h e t e s t surface horizontal . The outer surface of t h e bo i l e r , including the bottom, was wrapped with 2 inches of f e l t insulat ion.
Power was provided through copper

3
Auxiliary Equipment RESULTS FOR BUBBLE INCIPIENCE
Power was supplied from a motor-controlled Defini t ion of Incipience Point var iable output ac power transformer. The a l t e r - nating current provided t o t h e t e s t specimen pro- duced no problems i n t h e temperature measuring sys- tem. showed t h a t the s t r i p geometry and physical proper- t i e s were such t h a t temperature f luctuat ions from the 60-cycle current were negligible.
A Fastax camera with associated timing equip- ment and l i gh t ing w a s avai lable f o r photographing individual s i t e s . Lenses and extension tubes were arranged so t h a t the individual bubbles were magni- f i e d t o p rac t i ca l ly f i l l t he frame of the fi lm.
Calculations based on the analysis of [lo]
Instrumentation
Test sect ion voltage drop and current were read with 1/4-percent ac meters. The bulk water temperature and t h e t e s t specimen thermocouple vol- tages were read with a laboratory-type potentio- meter. The thermocouples were referenced t o a 150°-+0. 85' F commercial thermocouple reference oven.
PROCEDURE
The bo i l e r tank was drained and cleaned a f t e r every second day of experimentation. An ult rasoni- ca l ly cleaned t e s t specimen was clamped t o the electrodes, and the b o i l e r was charged with dis- t i l l e d water. The auxi l iary heaters were act ivated u n t i l s a tu ra t ion was reached. To reduce t h e con- vective eddies i n t h e tank, t h e power t o t h e auxil- i a r y heaters was decreased t o a l eve l j u s t suffi- c i en t t o maintain saturation.
Power a t a low l eve l was then applied t o t h e specimen, and t h e bulk temperature, t h e specimen current, voltage, and thermocouple EMF readings were taken. Note w a s made a s t o the l eve l of bub- b l e production a t t h e a r t i f i c a l s i t e or s i t e s (none, sporadic, intermit tent , steady, e tc . ). The power was then increased several percent and new readings obtained. This process was continued un- til t h e a r t i f i c i a l s i t e s were producing bubbles continuously (except f o r a few cases where water evident ly f i l l e d a s i t e and no nucleation occurred1 The power l eve l was then reduced i n s teps of sever- 21 percent each s11(? readincs taken u n t i l a l l act iv- i t y ceased.
Photographs were taken when desired, a s t h e t e s t s were too numerous t o permit photographs of every t e s t condition.
which a c t i v i t y became steady, intermit tent , o r ceased with increasing o r decreasing power was de- termined. from the specimen thermocouple readings. The readings, which were taken on t h e back (insu- l a t e d ) s ide of t he s t r ip , were extrapolated t o the b o i l i n g surface by assuming a one-dimensional heat conduction process through the specimen thickness. For a p l a t e of thickness a, insulated on one s ide and having uniform in t e rna l heat generation, t h e temperature difference between the two s ides i s given by
The surface temperature of t he specimen a t
T S - TO = L E 2k ( 4 )
where To f o r t h e present experiments corresponds t o t h e value provided by the specimen thermocouple.
The word incipience has been defined i n a num- b e r of ways when applied t o boiling. One common de f in i t i on i s t h a t incipience corresponds t o the surface-to-bulk temperature difference a t which the @T! versus heat f l ux curve begins t o deviate from t h e f r e e convection curve. Such a def ini t ion has l i t t l e value i n studying t h e a c t i v i t y of individual s i t e s . Incipience can a l so be defined a s t h e con- d i t i o n when the waiting time between departure and i n i t i a t i n g a new bubble i s not i n f i n i t e l y long. For t h e present experiments, however, t h i s a l so has l i t t l e meaning a s each departing bubble l e f t a va- por nucleus behind, and hence, t he waiting time was always zero. Han and Gr i f f i t h [4] and Hsu [ 3 ] i n t h e i r analyses consider incipience a s t h a t temper- a ture difference a t which a given bubble nucleus begins t o grow. This i s a more useful c r i t e r i o n f o r t he experiments reported here, but it s t i l l has some inherent d i f f i c u l t i e s . As t h e t e s t sect ion surface temperature was increased, a point was reached where a bubble would grow a t t he nucleation s i t e and then remain attached t o t h e surface. This vapor nucleus i s incipient i n a sense, but t he con- d i t i o n s t i l l does not appear t o be inc ip i en t bo i l - ing a s a succession of bubbles i s not being formed. A t a s l i g h t l y higher temperature level , t he bubble would detach and a new bubble begin t o grow, but t h i s bubble might l i nge r a t t he surface f o r many seconds before detaching. When t h e surface temper- a tu re was r a i sed a l i t t l e more, t h e production of bubbles became more regular. Finally, a t a s t i l l l a rge r temperature difference, a steady stream of bubbles appeared from the cavity. which of these conditions establ ishes incipience?
Because the i r r e g u l a r i t i e s i n the nucleation phenomena may well be due t o the s t a t i s t i c a l f luc- tuat ions inherent i n the thermal boundary l aye r thickness, it seems t h a t steady, or regular, act iv- i t y could only occur when the thermal boundary lay- e r thickness reached a mean value g rea t e r than t h a t used i n the incipience c r i t e r i a of [ 3 ] and [ 4 ] . Fluctuations around the "incipience" or smaller thermal layer thicknesses might produce i r r egu la r a c t i v i t y if the AT value i s below t h e "incipience" AT.
I n the present study, it was decided t o exam- ine the incipience point with regard t o two defin- i t i ons . it was t h a t incipience corresponds t o t h e AT a t which regular bubble production occurred from a given s i t e . It i s obvious t h a t such a de f in i t i on involves possible e r ro r s i n the juagment of t he ob- server and may produce (AT)i t heo re t i ca l predictions. It a l so involves t h e ex- perimental d i f f i c u l t y of defining "regular" pro- duction from s i t e s of d i f f e r ing size. and a small s i t e a r e compared i n the region of in- cipience, t he frequency of bubble emission i s lower f o r t h e l a rge r s i t e a s t h i s s i t e i s producing l a rge r bubbles; however, t h e percentage var ia t ions around a given mean bubble frequency seemed smaller f o r large s i t e s . Thus, a small s i t e could be pro- ducing a f a i r number of bubbles but not be incip- i e n t according t o t h i s de f in i t i on because of a lack of bubble regular i ty , while a l a rge s i t e producing a t a lower frequency with bubble r egu la r i ty would meet t h i s incipience cr i ter ion.
The second de f in i t i on of incipience was t h a t it corresponds t o t h e minimum EL' a t which bubbles grow and detach from the surface. Below t h i s ,V, a bubble might be present a t a s i t e , bu t it would
The question i s ,
One de f in i t i on t h a t provided an upper l i m -
values above t h e
If a l a rge

4
continue t o remain attached t o t h e surface. This c r i t e r i o n would be expected t o correspond more closely with a theory based on t h e assumption t h a t incipience i s achieved when a nucleus w i l l grow bu t with no consideration a s t o whether a stream of bubbles i s produced. For t h i s def ini t ion of incip- ience, t he thermal boundary l aye r thickness w i l l occasionally reach t h e required thickness f o r bub- b l e growth and detachment.
Incipience of Nucleation
The data f o r t he surface-to-bulk temperature difference a t which steady emission occurred ac- cording t o t h e f i rs t de f in i t i on of incipience a r e p lo t t ed a s a function of s i t e radius R, i n Fig- ure 2 (a ) . The (m) i from t h e second de f in i t i on a r e given i n Figure 2(b) . 2 (a ) a r e those ( m ) i peared t o be steady, but f o r which t h e next s tep decrease of about 10 percent i n heat f l u x caused ext inct ion o r extreme decrease of t he s i t e act iv- i t y . I n Figure 2(b), t h e (AT) i were taken when a very few bubbles were being produced. range i s shown about a data point, t h e lower l i m i t extends t o where bubble detachment ceases, while t h e upper l i m i t provided a few bur s t s of bubbles. The incipience temperatures obtained with increas- ing hea t f l ux general ly were higher f o r a given s i t e radius, and had more sca t t e r . These values a re not shown. The f l u i d bulk was always main- t a ined a t t h e saturat ion temperature.
i n t h e emission behavior would be expected as i s cha rac t e r i s t i c of bo i l i ng processes. As shown i n Figure 2, t h e s c a t t e r was on the order of several degrees, A t each s i t e radius, t he minimum (aT) i may be regarded a s corresponding t o thermal l aye r conditions most favorable t o bubble growth. When making comparisons with theory, the envelope through the minimum ( m ) i points should be kept i n mind, since it del ineates the boundary between the inac t ive region and the region of possible act ivi ty .
The points i n Figure values a t which emission ap-
Where a
For an individual s i t e , a s t a t i s t i c a l s c a t t e r
Comparison with Analyses of Incipience
Equations (1) t o ( 3 ) each predict a (m) i versus cavi ty radius r e l a t ion t h a t defines a s i ze rag? fcr zc t ive cav i t i e s . The most simple of these, (Equation (3)) ,has the possible shortcoming of predict ing no maximum act ive cavi ty s ize . A p l o t of t h i s equation i n Figures 2 ( a ) and (b ) shows t h a t it does l i e t o the l e f t of a l l the data, but t h e ( m ) i values a r e smaller than those observed. A t l a rge s i t e r ad i i , t he deviation increases as the da t a tend toward l a r g e r ( m ) i ure 2 (a ) , or remain f a i r l y constant i n Figure Z(b). These t rends a r e i n opposit ion t o Equation ( 3 ) , where (AT)? decreases with increasing Re.
The r e l a t i o n of Han and G r i f f i t h [4 ] as given i n Equation (l), requires a knowledge of the ther- mal l a y e r thickness. Marcus and Dropkin [ l l ] , who provide a correlation between thermal l a y e r thickness and heat t r ans fe r coe f f i c i en t . For values of heat t r a n s f e r coeff i - c i e n t i n t h e range of t he present experiments (ZX103 t o 4x10³ Btu/(hr)(ft ' )(%)), an average thermal l aye r thickness i s S i~ 0.006 inch. Using t h i s 6, Equation (1) has been plot ted i n Fig- ure Z(a), and it does not bound most of t he data. Since the m a x i m u m value of Equation (l), which i s found a s + m, i s = 2 6 / 3 = 0.004 inch,
values i n Fig-
This has been measured by
t h e r e l a t i o n cannot account f o r t h e l a r g e r d r i l l e d s i t e s employed here unless t he 6 value were made much larger .
I n addi t ion t o requir ing a value of S, Equa- t i o n ( 2 ) of Hsu [3] has coeff ic ients C 1 and C 3 t h a t depend on t h e cavi ty geometry. I f t he values of C 1 and C 3 used i n [3] a r e assumed here, a curve s imilar t o t h a t from Equation (1) i s obtained. If t h e mouth of t he cavi ty i s assumed t o have a pe r fec t ly square edge a s an idea l i za t ion of t he machine-drilled s i t e s , then C 1 and C 3 a r e equal t o unity. With these values Equation ( 2 ) was eval- uated and i s shown i n Figure 2(a) . which s t r i c t l y should be compared only with the machine-drilled data because of t he choice of con- s tants , encompasses a l i t t l e more of t h e experimen- t a l values than the Han and Gr i f f i t h re la t ion, but it s t i l l does not extend t o a su f f i c i en t ly large range of ac t ive s i t e s .
The incipience theo r i e s were founded on the assumption t h a t f o r a bubble t o begin t o grow, t h e temperature i n the thermal layer a t a character is- t i c posit ion, f o r example, a t t he top of t he bub- b l e nucleus, must reach the temperature of t he va- por inside t h e nucleus. This type of assumption c l ea r ly cannot apply t o some of t he r e s u l t s ob- t a ined here for l a rge cavi t ies . For example, with a cavi ty radius of 0.020 inch the nucleus l e f t by a departing bubble would be i n the range of 0.010 t o 0.020 inch i n height, which i s subs t an t i a l ly l a rge r than the thermal l aye r thickness. Hence, t he as- sumptions i n t h e theory would ru l e out t h e observed a c t i v i t y a t t h e l a rge s i t e s tes ted.
One question i s whether t he thermal l aye r thickness of 0.006 inch used here i s r e a l l y correct. This i s an "extrapolated" thickness obtained i n [ l l ] by extending t h e l i n e a r par t of t he tempera- t u r e p ro f i l e near t h e heated surface u n t i l t he bulk temperature i s reached a t t he distance 6. Hence, t h i s layer does not include the region where t h e f l u i d temperature gradually decreases t o t he bulk value. In t h i s region, there could be s ign i f i can t heat addition t o the vapor nucleus.
appears t o come from the large cav i t i e s i s occur- r i n g a t smaller nucleation s i t e s contained within the l a rge r s i t e s . However, Bankoff [ 9 ] shows t h a t rectangular grooves up t o a width of 0.07 cm (0.028 i n . ) w i l l r e t a i n any vapor o r ig ina l ly trapped within them when immersed. He fu r the r s t a t e s t h a t cy l ind r i ca l cav i t i e s of t h i s (Re = 0.014 in. j or pernaps sl ig 'ntiy iar8:t.r i-adlus should a l so r e t a i n entrapped vapor. coupled with the high-speed motion p i c tu re s dis- cussed i n succeeding sections, which showed no l i q - uid enter ing the cav i t i e s between bubbles (and, i n fact , showed a vapor cap l e f t over t h e s i t e by the departing bubbles), makes t h i s "s i te-within-a-s i te" explanation doubtful f o r t h e da t a presented here. It appears t h a t some modification of t h e thermal- layer bubble-nucleus mechanism advanced i n [3] and [ 41 i s needed t o account f o r t h e observed nuclea- t i o n from large s i t e s i n saturated l iquid.
The curve,
It could be argued t h a t t he nucleation t h a t
This fact ,
Minimum Incipience Temperature
The theory i n [3] predicts reasonably wel l both the minimum (AT)i which it w i l l occur f o r t he regular a c t i v i t y incip- ience data of Figure 2(a). t h a t Equation ( 2 ) can adequately predict t h e mini- mum ( m ) i range e x i s t s and where t h e thermal l aye r thickness
and the s i t e radius a t
This tends t o confirm
i n a system where a large s i t e s i ze

5
The minimum incipience temperature difference, a s given by Equation (a), corresponds t o 1 / 2 t h e value predicted by Hsu i n Equation ( l e a ) of [3] . This difference i s due t o Hsu's assumption, which r e l a t e s thermal l aye r thickness a t incipience t o cavi ty size. The minimum (M!)i predicted by Equa- t i o n (8 ) agrees c losely with the data f o r i n i t i a l bubble growth shown i n Figure Z(b).
An analysis s imilar t o the above, except t h a t it i s based on t h e surface heat f l u x r a the r than t h e surface temperature, has been given by Grace ~ 1 4 1 .
The analysis presented here can be extended t o include t h e e f f ec t of subcooling on t h e ac t iva t ion of individual s i t e s , and t h i s work w i l l be pre- sented i n a fu tu re publication. w
i s known. This was ve r i f i ed experimentally by Bergles and Rohsenow [12] f o r a flowing system where the thermal l aye r thickness i s known, by using the e a r l i e r incipience analysis of Hsu and Graham [13].
Modified Incipience C r i t e r i a
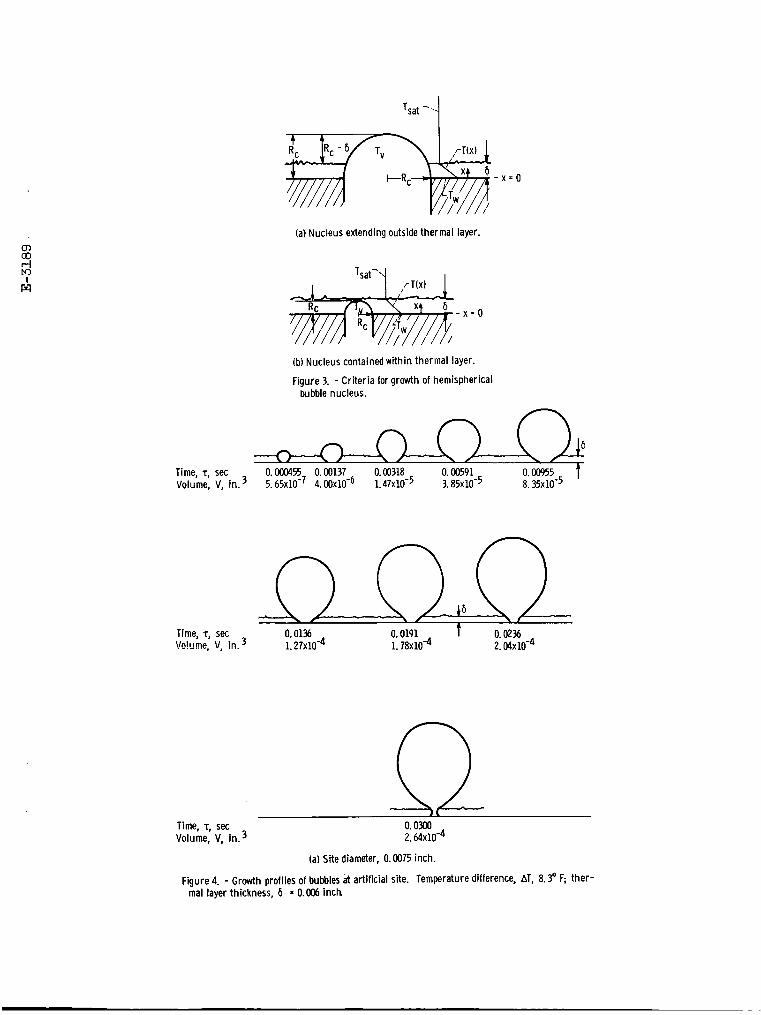
For s i t e s of such a s i ze t h a t t h e i r attached nuclei extend through t h e thermal layer, Re > 6, t h e model shown i n Figure 3( a ) can be analyzed. Heat w i l l be added t o the nucleus through t h a t por- t i o n of t h e nucleus surface within the thermal lay- er, while condensation w i l l occur over the remain- der of t h e nucleus area. With the bulk temperature of t he l i qu id a t saturation, t he temperature pro- f i l e within the thermal layer can be approximated by the l i n e a r r e l a t ion
If the vapor temperature within the nucleus i s as- sumed constant and given by
t h e net heat added t o the nucleus i s given by
CWLRACTERISTICS OF BUBBLES AT DRILLED SITES
Growth of Bubbles While Attached t o Surface
By having mechanically d r i l l e d s i t e s i n a pol- ished surface and by using low heat f luxes near in- cipience, it was possible t o grow i so l a t ed bubbles t h a t were not disturbed by adjacent bubble forma- t i on . The high-speed motion pictures showed the
The quan t i t i e s he and hc a re the evaporating and condensing heat t r a n s f e r coeff ic ients f o r heat t r ans fe r t o the nucleus and have been assumed con- s t an t . This assumption may be open t o question, a s t he coe f f i c i en t s probably depend on the thermal h i s to ry of the nucleus.
than zero, leading t o the c r i t e r ion For the nucleus t o grow, Q must be greater
where the heat t r a n s f e r coeff ic ient h, has been taken equal t o he.
thermal l aye r (Fig. 3 (b ) ) , t he heat added t o t h e nucleus i s given by
If the nucleus i s contained whoiiy w?th;n *>e
which, f o r Q = 0, gives
A p lo t of Equations (8) and (10) i s given i n Figure Z(b), using 6 = 0.006 inch, and the theory agrees more closely with the data than do the other analyses. No maximum s i t e s ize i s indicated by t h i s analysis. This indicates t h a t heat t ransfer may not be t h e l imi t ing process for bubble incip- ience from l a rge s i t e s , and t h a t perhaps vapor re- placement i n t h e cav i t i e s provides the upper limit t o ac t ive cavi ty size.
bubble p ro f i l e s t o be symmetric about t he s i t e axis, and the bubbles had l i t t l e dis tor t ion.
Figure 4 shows a s e t of t racings f o r t he growth of two bubbles, one f o r each of t he mechani- ca l ly d r i l l e d s i t e diameters 0.0075 and 0.0413 inch. These s i t e s , along with two others, were d r i l l e d i n t o the same heated s t r ip , and photographs were taken at t h e four s i t e s i n rapid succession without changing t h e experimental conditions, so t h a t t he heat f l u x and surface temperature were held con- s tant . Hence, the pictures presumably compare t h e growth of bubbles under the same condition of t h e thc7z - l lzyjlpr GI? the .siirface. However, t h e random convective c i r cu la t ion currents i n t h e b o i l e r caused some f luctuat ions i n the thermal l aye r thickness. This resul ted i n some of t h e bubbles a t a given s i t e having lower growth r a t e s than others, even though the time average conditions remained fixed. This s t a t i s t i c a l var ia t ion w a s a l so noted ir, [7]. To make comparisons of bubbles taken at d i f f e ren t s i t e s , t h e s t a t i s t i c a l randomness was re- moved as much a s possible. This was done by se- l ec t ing the bubble a t each s i t e t h a t had t h e most rapid growth r a t e and increased i n volume continu- ously t o detach i n the shortest growth period. This should correspond most c losely t o t h e condi- t i ons f o r which t h e theo re t i ca l growth equations apply. These are the bubbles shown f o r two s i t e s i n Figure 4 and are presumed t o be growing under thermal conditions a s consistent with each other a s possible.
symmetric about t h e s i t e axis and t h e i r volumes were computed from the prof i les . For some of t h e bubbles near detachment, where they were not close t o spherical , t he width of t he bubble was measured
The bubbles were assumed t o be ro t a t iona l ly

6
a t 15 pos i t ions along the bubble height, and the volume was computed by numerical integration. For the remainder of t he bubbles, the shape could be approximated within a few percent e r r o r by a sphere or a spher ica l segment, and the volume was computed ana ly t ica l ly .
The volumes are given a s a function of time i n Figure 5 f o r the growth period. graphs were taken a t a f i lm speed of approximately 2000 frames per second, there i s a time lapse of somewhat l e s s than l/20Ml second between frames, since recording the image on the f i l m requi res a portion of the time. Hence, t he f i r s t data point can be a maximum of a few t e n thousandths of a sec- ond a f t e r t he detachment of t he previous bubble. I f t he da ta could be extrapolated t o zero time, the i n i t i a l bubble volume would not be zero, because there was always a vapor nucleus l e f t behind by the previous bubble. The l a s t few p ic tures i n each s e t of p ro f i l e s i n Figure 4 i l l u s t r a t e how the bubble neck narrows and then breaks off, leaving a vapor nucleus behind.
s i t e were studied by Wei and Freckshot [15] who photographed bubbles leaving a shor t section of g l a s s cap i l l a ry t h a t had been cemented t o a g lass s l i d e placed on a heated copper block. I n t h i s case (where the cavity i t s e l f w a s not within the heated surface), a f t e r a bubble detached, there was a small vapor pocket l e f t a t t he bottom of the cav- i t y , and t h e remainder of the cavity f i l l e d with l iqu id . The small vapor pocket grew t o form the next bubble. I n the present experiment, the cavity was within the heated surface and, e i t h e r because of t h i s o r the cavity shape or material, t he vapor nucleus was much l a rge r than t h a t i n [15]. por nucleus was always observed t o protrude well above the cavity opening. For t h i s reason, it i s thought t h a t the walls within the cavity were a l - ways d r y without any l i qu id microlayer inside. Within the very short time a f t e r bubble departure and before the next frame showing the new bubble, t he surface tension formed the nucleus i n t o the shape of a spherical surface. For a small s i t e (Fig. 4 ( a ) ) the nucleus was almost i n the shape of a complete sphere, while f o r a l a rge r s i t e (Fig. 4 (b ) ) it was a short spherical segment.
bubble depends on the heat addi t ion from the ther - m a l l aye r surrounding the bubble base. Hence, t he bubble growth depends on how much bubble surface a rea i s within the thermal layer. it has been as- sumed i n analyses such a s those by Zuber [16] and Han and G r i f f i t h [4] t h a t t he growing bubble nucle- us pushes the thermal l aye r outward, so t h a t t he bubble i s surrounded by the layer. As discussed previously, t he thermal layer thickness f o r the hea t f luxes encountered here was about 0.006 inch. This thickness, shown i n Figure 4, i s about l/Z the he ight of the vapor nucleus l e f t by the departing bubble. Hence, f o r t he present cases, it i s possi- b l e t h a t t he heat t r a n s f e r t o a bubble was only through the a rea near the base i n contact with the thermal layer (a rea A i n Fig. 6 ) . The growth of t h e bubble then depends on the time var ia t ion of A. A s a very simple i l l u s t r a t i o n , assume tha t the hea t t r a n s f e r coef f ic ien t a t the bubble base and t h e average temperature within the thermal layer remain constant throughout bubble growth.
Since the photo-
Some aspects of bubble departure from a known
The va-
It i s postulated here t h a t the growth of t he
Then
The time va r i a t ion of A must be considered i n or- der t o in tegra te f o r V. From the p ro f i l e s i n Fig- ure 4, a f t e r about 0.001 second the bubbles are qui te close t o spher ica l segments and are of t he successive configurations shown i n Figure 6(b). Area A of the spher ica l zone within the thermal layer i s A = nDS. If the volume of the bubble i s
.D3 6V 1/3 approximated by v = -, 6 then A = C(T) 6, sub-
s t i t u t i n g i n t o Equation (11) and assuming t h a t the thermal layer temperature and thickness remain con- s t an t during bubble growth give the func t iona l form
In the l a t e r stages of growth when the bubble begins t o elongate and espec ia l ly when a neck be- g ins t o form, a rea A tends t o become constant (Fig. 6 ( c ) ) . Then, from Equation (11) dV/d.r i s a constant. This gives
V a T (13)
This f i r s t power behavior was a l s o observed i n [17]. The trend of decreasing slope during growth of t he curves i n Figure 5 might thewbe a t t r i bu ted i n pa r t t o the changing configuration near t he bubble base. The f a c t t h a t t he temperature i n the thermal l aye r Ttz ac tua l ly decreases during growth [ E and 191 and t h a t the thermal layer thickness S may a l so decrease during growth [ 131 contributes fu r the r t o a reduction i n growth rate .
ural nucleation s i t e , t he base does not s t ay a t - tached t o the s i t e but r a the r expands rap id ly out- ward a t f i r s t and then remains r e l a t ive ly constant u n t i l detachment begins (e. g., base measurements i n [17]) . The rap id growth i n the base diameter produces a rap id increase i n the bubble a rea with- i n the thermal layer, which could account f o r the f a c t t h a t i n the expression
When a bubble i s formed at a very small nat-
D T” (14)
values have been a s la rge a s unity near the the n beginning of bubble growth [ Z O ] .
To see how the present da ta compare with some of the commonly quoted simple models f o r bubble growth, two expressions have been p lo t ted i n Fig- ure 5; the Fritz-Ende [21] expression
and the Plessett-Zwick [22] expression
For the pa r t of t h e da ta where Fritz-Ende r e s u l t provides a reasonable prediction. This was a l so found i n [17].
I n Figure 7(a), growth curves f o r D, = 0.0075 inch a re shown f o r th ree AT values. m e curves were again se lec ted as having the most rapid growth. Comparison i s made with the Fritz-Ende equation, and although t h e experimental da ta do not f a l l on the ana ly t i ca l l i nes , agreement i s good regarding trends with
I n Figure 7(b), growth curves for bubbles a t a l a rge r s i t e , D, = 0.0413 inch, a r e shown. Correla-
V a T ~ / ~ the
and slopes with time.
7
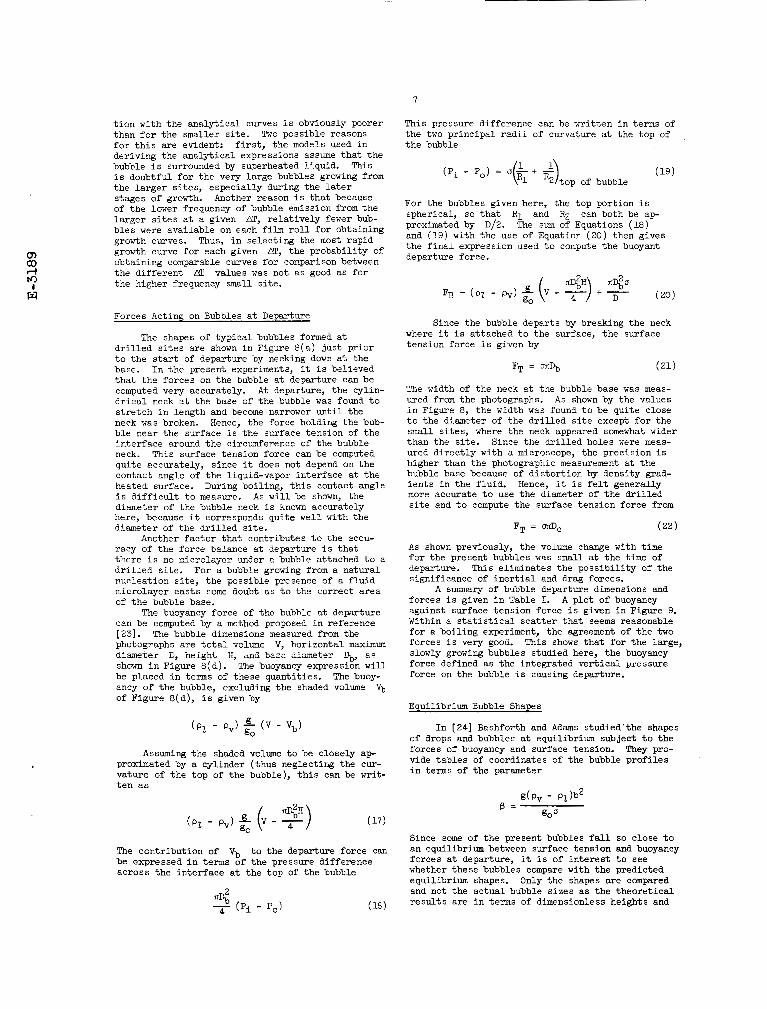
t i o n with the ana ly t ica l curves i s obviously poorer than f o r the smaller s i t e . Two possible reasons f o r t h i s are evident: f i r s t , the models used i n deriving the ana ly t ica l expressions assume t h a t t h e bubble i s surrounded by superheated l iquid. i s doubtful f o r the very la rge bubbles growing from the l a rge r s i t e s , espec ia l ly during the l a t e r stages of growth. Another reason i s t h a t because of the lower frequency of bubble emission from the l a rge r s i t e s a t a given AT, r e l a t ive ly fewer bub- b les were ava i lab le on each f i lm roll f o r obtaining growth curves. Thus, i n se lec t ing the most rapid growth curve f o r each given AT, the probabi l i ty of obtaining comparable curves f o r comparison between the d i f f e ren t AT values was not as good a s f o r t he higher frequency small s i t e .
This
Forces Acting on Bubbles a t Departure
The shapes of t yp ica l bubbles formed a t d r i l l e d s i t e s are shown i n Figure 8 ( a ) just p r io r t o the s t a r t of departure by necking down a t the base. I n the present experiments, it i s believed t h a t t he forces on the bubble a t departure can be computed very accurately. A t departure, t he cylin- d r i c a l neck a t the base of the bubble was found t o s t r e t ch i n length and become narrower u n t i l the neck was broken. Hence, the force holding the bub- b l e near the surface i s t he surface tension of t h e in te r face around the circumference of the bubble neck. This surface tension force can be computed qui te accurately, since it does not depend on t h e contact angle of t he liquid-vapor in te r face a t t h e heated surface. During boiling, t h i s contact angle i s d i f f i c u l t t o measure. As w i l l be shown, the diameter of the bubble neck i s known accurately here, because it corresponds qui te well with the diameter of the d r i l l e d s i t e .
Another f ac to r t h a t contributes t o the accu- racy of the force balance a t departure i s t ha t there i s no microlayer under a bubble attached t o a d r i l l e d s i t e . For a bubble growing from a na tura l nucleation s i t e , t he possible presence of a f l u i d microlayer cas t s some doubt a s t o the correct a rea of t he bubble base.
The buoyancy force of the bubble a t departure can be computed by a method proposed i n reference [ 231. The bubble dimensions measured from the photographs are t o t a l volume V, horizontal maximum dlameter fi, ‘neighi E, ai& “Yaae dizze ter DD, P S sham i n Figure 8 (d ) . The buoyancy expression w i l l be placed i n terms of these quant i t ies . ancy of t he bubble, excluding the shaded volume vb of Figure 8(d) , i s given by
The buoy-
Assuming proximated by vature of t he t e n as
the shaded volume t o be closely ap- a cylinder ( thus neglecting the cur- top of the bubble), t h i s can be w r i t -
The contribution of Vb t o the departure force can be expressed i n terms of t he pressure d i f fe rence across the in te r face a t t he top of the bubble
This pressure difference can be wr i t t en i n terms of the two pr inc ipa l r a d i i of curvature a t the top of t he bubble
For the bubbles given here, the top portion i s spherical , so t h a t R 1 and Rg can both be ap- proximated by D/Z. The sum of Equations (18) and (19 ) with the use of Equation ( 2 0 ) then gives the f i n a l expression used t o compute the buoyant departure force.
Since the bubble departs by breaking the neck where it i s attached t o the surface, t he surface tens ion force i s given by
FT = ( 2 1 )
The width of the neck a t the bubble base was meas- ured from the photographs. A s shown by the values i n Figure 8, the width was found t o be qui te close t o the diameter of the d r i l l e d s i t e except f o r the small s i t e s , where the neck appeared somewhat wider than the s i t e . Since the d r i l l e d holes were meas- ured d i r ec t ly with a microscope, the precision i s higher than the photographic measurement a t the bubble base because of d i s to r t ion by density grad- i e n t s i n the f luid. Hence, it i s f e l t generally more accurate t o use the diameter of t he d r i l l e d s i t e and t o compute the surface tension force from
FT = O C D ~ ( 2 2 )
A s shown previously, the volume change with time fo r the present bubbles was small a t t he time of departure. significance of i n e r t i a l and drag forces.
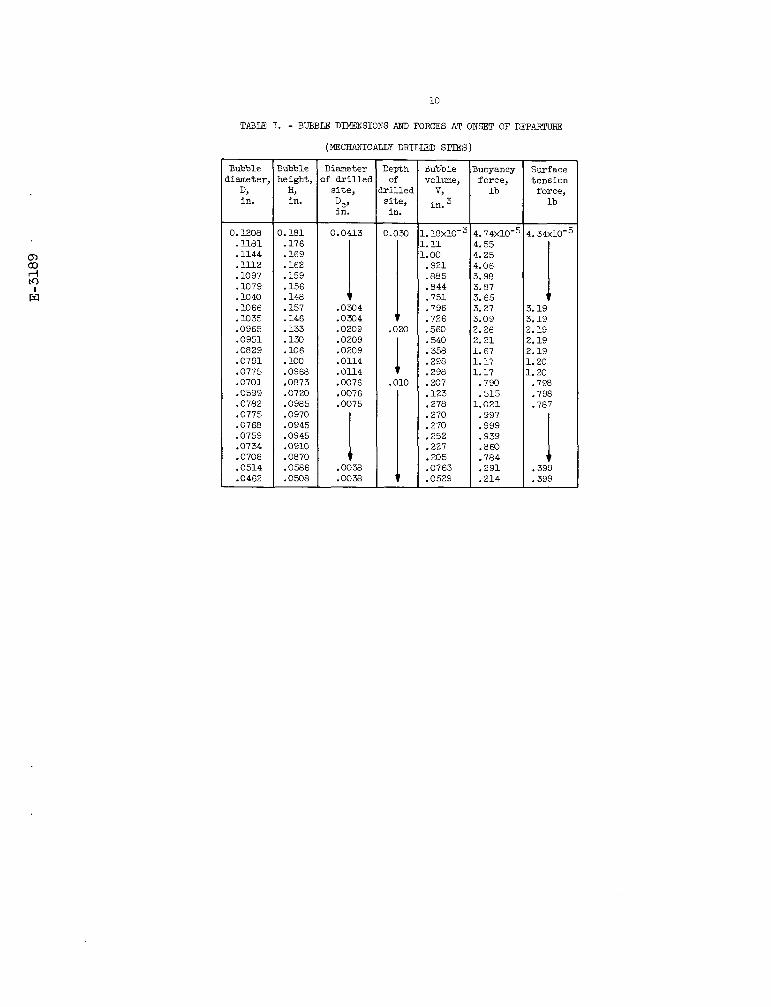
forces i s given i n Table I. against surface tension force i s given i n Figure 9. Within a s t a t i s t i c a l s ca t t e r t h a t seems reasonable f o r a bo i l ing experiment, the agreement of t he two forces i s very good. slowly growing bubbles studied here, t he buoyancy force defined as the in tegra ted v e r t i c a i yre:ss~-e force on the bubble i s causing departure.
This eliminates the poss ib i l i t y of t he
A summary of bubble departure dimensions and A p lo t of buoyancy
This shows t h a t f o r t he large,
Equilibrium Bubble Shapes
I n [24 ] Bashforth and Adams s tudied’ the shapes of drops and bubbles at equilibrium subject t o the forces of buoyancy and surface tension. They pro- vide t ab le s of coordinates of the bubble p ro f i l e s i n terms of the parameter
Since some of t he present bubbles f a l l so close t o an equilibrium between surface tension and buoyancy forces a t departure, it i s of i n t e r e s t t o see whether these bubbles compare with t h e predicted equilibrium shapes. Only the shapes are compared and not the ac tua l bubble s i zes as t he theo re t i ca l r e su l t s are i n terms of dimensionless heights and

cn OD rl n I w
r a d i i which involve a scale f ac to r of the radius of curvature b a t the top of t he bubble. Multiply- ing by the dimension b t o place the curves i n dimensional form would not change the r e l a t ive shapes a t a f ixed P. The two typ ica l bubbles shown i n Figure 10 have values of P of -0.24 and -0.35 and grew, respectively, at mechanically d r i l l e d s i t e diameters of 0.0209 and 0.0413 inch. The t ab le s of bubble coordinates i n [24] a re some- what incomplete i n the range of P and the theo re t i ca l curves were supplemented with values given i n [25].
The comparisons i n Figure 10 reveal t h a t t h e upper portions of the experimental bubbles are very close t o spher ica l and agree well with the theory. Near the base of the bubbles, the experimental pro- f i l e s deviate from theory probably because of t h e cons t ra in t imposed by the attachment of t he bubble base t o the d r i l l e d s i t e . The theory on the o ther hand would allow the bubble base t o spread f r ee ly over the surface. These considerations reveal 811 addi t iona l factor , other than dynamic forces, pres- en t f o r rap id ly growing bubbles, which would ac- count f o r why the F r i t z equation does not always co r rec t ly pred ic t the s ize of bubbles a t departure. The F r i t z equation i s based on theory assuming t h a t t he base of the bubble i s not constrained, while, depending on the site diameter and geometry, the base of some ac tua l bo i l ing bubbles can remain a t - tached t o the s i t e .
of -0.1 t o -0.3,
CONCLUSIONS
1. Bubble "incipience" i s a vague concept. It can be defined i n terms of the surface superheat required t o make a bubble nucleus grow although the bubble may not detach. Incipience can a l s o be de- .fined a s a steady formation of bubbles, thus imply- ing t h a t t he bubble must not only begin t o grow, but must a l s o be able t o reach a s i z e su f f i c i en t t o cause detachment.
reasonable fo r the minimum AT t o produce incip- ience based on regular bubble production when a range of cavity s i zes i s present. The present ex- perimental r e s u l t s show t h a t l a rge r cav i t i e s can be ac t ive than those ind ica ted by Hsu's model, r e l a t - ing t h e cavi ty s ize and the thermal layer thickness at incipience. The upper l i m i t of ac t ive s i t e size i s probably due i n pa r t t o the a b i l i t y of l i qu id t o f i l l the s i t e .
ble nucle i contained e n t i r e l y within t h e thermal l aye r or extending out of the thermal layer. theory provided a reasonable lower l i m i t f o r the experimental AT values obtained when bubbles f i r s t begin t o detach from the surface.
bubble volume i s proportional t o T ~ / ~ and i s fa i r - l y wel l predictable by the Fritz-Ende equation. Later i n the growth period, the volume increases in Proportion t o T implying tha t vapor addi t ion t o t he bubble may take place through a constant area around the bubble neck.
growth r a t e increases approximately a s (AT)3 d ica ted by many of the growth equations. For a l a rge s i t e t he functional r e l a t ion i s not clear, bu t t h e growth r a t e does increase with
6. For slowly growing bubbles, t he buoyancy and surface tens ion forces a t detachment a re i n balance. sure force d e f i c i t caused by the missing bubble a rea i n the contact region a t t he bubble base.
2. The ana ly t i ca l prediction by Hsu [ 31 appears
3. An incipience c r i t e r ion was derived f o r bub-
The
4. I n the i n i t i a l period of bubble growth, the
5. For a given smal l s i t e , t he volumetric as in-
iSl'.
The buoyancy force must include t h e pres-
0
7. The bubbles detach from the a r t i f i c i a l s i t e s studied here by forming a neck which i s rup- tured some distance above the s i t e and consequently, a vapor nucleus i s l e f t behind.
8. Although uniform temperature conditions a re not present, t he bubbles near t h e i r departure from t h e a r t i f i c i a l s i t e s match reasonably well the equilibrium shapes predicted by Bashforth and Adams [24] . Near the bubble base, the cons t ra in t imposed by attachment t o the a r t i f i c i a l s i t e causes some deviation from the predicted shapes.
NOMENCLATURE
surface area thickness of specimen containing a r t i f i -
c i a l s i t e radius of curvature a t t op of bubble dimensionless s i t e geometry constants maximum horizontal bubble diameter base diameter of bubble diameter of a r t i f i c i a l nucleation cavi ty buoyancy force surface tension force g rav i t a t iona l acce lera t ion conversion constant, 32.2 l b mass-ft/lb
force-sec2 bubble height bo i l ing heat t r ans fe r coef f ic ien t evaporating and condensing heat t r ans fe r
coef f ic ien ts f o r heat t r a n s f e r t o bubble nucleus
thermal conductivity of t e s t specimen or l i qu id
in t e rna l and ex terna l pressure a t t op of bubble
heat f l ux radius of a r t i f i c i a l nucleation cavity pr inc ipa l r a d i i of curvature of bubble temperature a t insu la ted surface of t e s t
sa tura t ion temperature of bo i l ing l i qu id mean thermal l aye r temperature temperature of vapor ins ide bubble temperature of bo i l ing surface of t e s t
temperature difference, Tw - Tsat (Tw - T s a t ) required t o form bubbles v"ime of L..-..-..,
bubble volume ly ing above area of bubble
distance coordinate from surface thermal d i f f u s i v i t y bubble shape parameter,
(g/go)[(pv - p,)b2/o1 thermal l aye r thickness heat of vaporization density of l i qu id or vapor surface tension of liquid-vapor in te r face time
specimen
specimen
"UUULC
base
REFERFNCES
1. Zuber, N. : "Recent Trends i n Boiling Heat Transfer Research. Par t I: Nucleate Pool Boiling," Appl. Mech. Rev. vol. 17, no. 9, September, 1964, pp. 663-672.

9
19. Morin, R. : '!Fundamental Studies i n Boiling, " Paper presented a t t h e 2nd Jo in t USAEC- Euratom Two Phase Flow Meeting, Germantown, Maryland, April, 1964.
Growth and Departure, Tech. Rep. No. 16, Massachusetts In s t . Tech. Cambridge, Mass., August, 1959.
21. F r i t z , W.; and W. Ende: "Uber den Verdamp- fungsvorgang Nach Kinematographishen Aufnahmen au Dampfblasen, I' Physik. Zeit.,
20. Staniszewski, B. E. : "Nucleate Boiling Bubble
VOL 37, 1936, pp. 391-401. 22. Plesset t , M. S.; and S. A. Zwick: "The Growth
J. of Vapor Bubbles i n Superheated Liquids, Appl. F'hys., vol. 25, no. 4, April, 1954, pp. 493-500.
23. Aydelott, J. : NASA-Lewis Research Center, Per- sonal communication.
24. Bashforth, F.; and J. C. Adams: An Attempt t o Test t h e Theories of Capillary Action by Com- paring t h e Theoret ical and Measured Forms of Drops of Fluid, Cambridge University Press, 1883.
c l ea t e Boiling, " PhD Thesis, I l l i n o i s Inst . of Tech., 1956.
25. Chun, K. S. : "A Study of Steam Bubbles i n Nu-
2. Leppert, G; and C. C. P i t t s : %oiling," Vol. I of Advances i n Heat Transfer, edi ted by T. F. I rvine, Jr. and J. P. Hartnett, Academic Press, New York, 1964, pp. 185-266.
Nucleation Cavi t ies on a Heating Surface," J. Heat Transfer, vol. 84, no. 3, August,
4. Han, C. Y.; and P. Gr i f f i t h : "The Mechanism of Heat Transfer i n Nucleate Pool Boiling. I - Bubble In i t i a t ion , Growth and Departure, " I n t l . J. Heat Mass Transfer, vol. 8, no. 6, June, 1965, pp. 887-904.
5. Gr i f f i t h , P.; and J. D. Wallis: "The Role of Surface Conditions i n Nucleate Boiling, " Chem. Eng. Frogr. Symposium Ser., vol. 56, no. 30, 1960, pp. 49-63.
Mechanism of Nucleate Boiling, " Paper A/Conf. 28/P/600, Presented a t t he Third United Na- t i o n s Internat ional Conf. on t h e Peaceful Uses of Atomic Energy, May, 1964.
"Microscopic Study of Bubble Growth During Nucleate Boiling," A I C h E J. vol. 7, no. 4, December, 1961, pp. 578-583.
8. Yatabe, J. M.; and J. W. Westwater: "Bubble Growth Rates f o r Ethanol-Water and Ethanol- Isopropanol Mixtures," AIChE Paper No. 7, Presented a t t he ASME-AIChE 8 t h Nat ' l Heat Transfer Conf., Los Angeles, August, 1965.
Spreading of a Liquid Over a Rough Surface. I' A I C h E J., vol. 4, no. 1, March, 1958,
3. Hsu, Y. Y.: "On the Size Range of Active
1962, pp. 207-216.
6. Ral l is , C. J.; and H. H. Jawurek: "The
7. Strenge, P. H.; A. Orell ; and J. W. Westwater:
9. Bankoff, S. G.: '%Entrapment of Gas i n the
pp. 24-26. 10. Jegl ic , F. A. : "An Analytical Determination of
Temperature Osci l la t ions i n a Wall Heated by Alternating Current, " NASA TN D-1286, July, 1962.
11. Marcus, B. D.; and D. Dropkin: "Measured Tem- perature P ro f i l e s Within the Superheated Boundary Layer Above a Horizontal Surface i n Saturated Nucleate Pool Boiling of Water, " J. Heat Transfer, vol. 87, no. 3, August, 1965, pp. 333-341.
12. Bergles, A. E.; and W. M. Rohsenow: "The Determination of Forced-Convection Surface- Boiling Heat Transfer, " J. Heat Transfer, vol. 86, no. 3, August, 1965, pp. 365-372.
and Experimental Study of t h e Thermal Hound- ary Layer and Ebu l l i t i on Cycle i n Nucleate Boiling, " NASA TN D-594, May, 1961.
I n i t i a l l y Sub-cooled Forced Convective Sys- tems." P ~ D Thesis, University of Minnesota, 1963.
15. Wei, C. C.; and G. W. Freckshot: "Photographic Evidence of Bubble Departure from Capi l lar ies During Boiling," Chem. Eng. Sei., vol. 19, October, 1964, pp. 838-839.
16. Zuber, N: "The Dynamics of Vapor Bubbles i n Nonuniform Temperature Fields, " I n t l . J. Heat Mass Transfer, vol. 2, no. 1/2, March, 1961,
1.7. Hsu, Y. Y.; and R. W. G r a h a m : "An Analytical
14. Grace, T. W. : "The Mechanism of Burnout i n
pp. 83-98. 17. Siegel, R.; and E. G. Keshock: '%Effects of Re-
duced Gravity on Nucleate Boiling Bubble I$- namics i n Saturated Water," A I C h E J. vol. 10, no. 4, July, 1964, pp. 509-517.
ment of Rapid Surface Temperature Fluctua- t i o n s During Nucleate Boiling of Water, " AIChE J. vol. 7, no. 4, December, 1961, pp.
18. Moore, F. D.; and R. B. Mesler: "The Measure-
620-624.
cn a) rl M
I w
.010
v
10
TABLE I. - BUBBLE DLMENSIONS AND FORCES AT ONSET OF DEP-
(MECHANICALLY D R I U D SITES)
.207
. E 3
.278
.270
.270
.252
.227
.205
.0763
.0529
Bubble iiameter,
in. D,
0.1208 .1181 .1144 .1112 . lo97 . lo79 .lo40 . lo66 .lo35 .0965 .0951 .0829 .0791 .0775 .0701 .0599 .0782 .0775 .0768 .0759 .0734 .0708 .0514 .0462
3ubble ieight,
in. H,
1.181 .176 .169 .162 .159 .156 .148 .157 .146 .133 .1m . lo6 .loo .0968 .0873 .0720 .0985 .0970 .0945 .0945 .0910 .OB70 .0586 .Om8
Diameter )f d r i l l e d
s i t e ,
in. DC,
0.0413 I I
.Om4
.Om4
.0209
.0209
.0209
.0114
.0114
.0076
.007 6
.0075
.0038
.oom
Depth Bubble x in. I in:3
hoyancy force, lb
L. 74X10-' L. 55 :. 25 b.06 i. 98 j. 87 5. 65 5. 27 109 !. 26 !. 21 .. 67 .. 17 .. 17 .790 .515
..021 .997 .999 .939 .860 .784 .291 .214
Surface tension
force, l b
. 3 4 ~ 1 0 - ~
i
1
). 19 k19 .19 '. 19 '. 19 .20 .20 .798 .798 .787
.399
.399
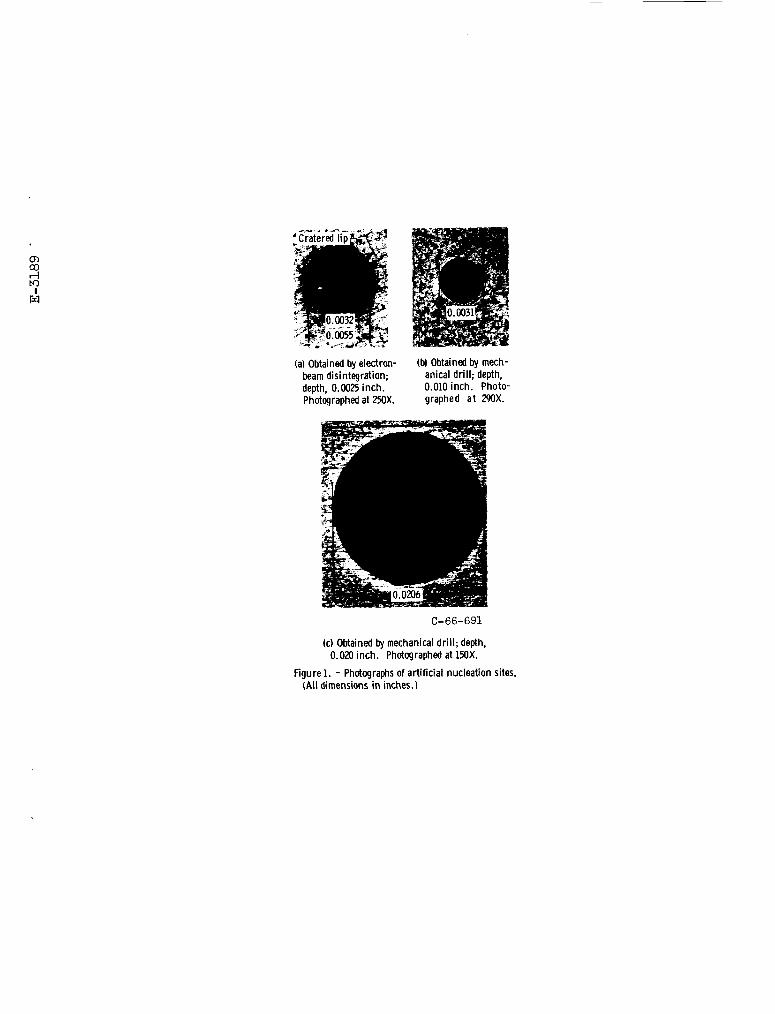
(a) Obtained by electron- beam disintegration; depth, 0.0025 inch. Photoqraphed at 25OX.
(b) OMained by mech- anical drill; depth, 0.010 inch. Photo- graphed at BOX.
C-66-691
(c) OMained by mechanical drill; depth, 0.020 inch. Photographed at 15OX.
Figure 1. - Photographs of artificial nucleation sites. (All dimensions in inches.)
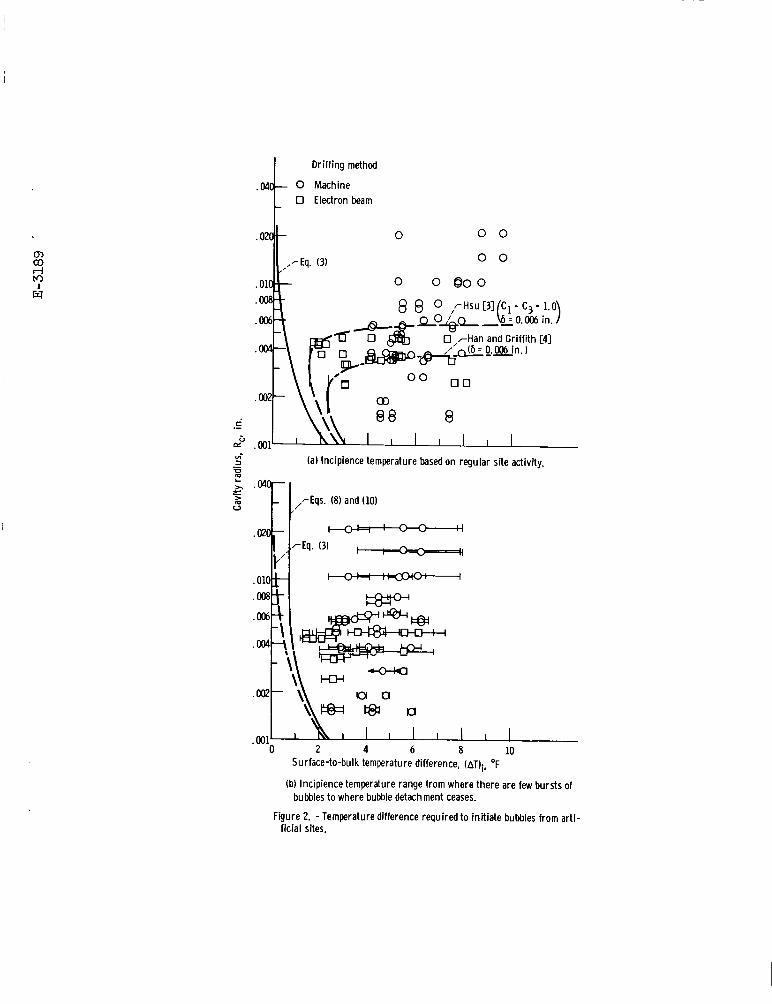
Drilling method
0 Electron beam
0 0
0 0 000
.- vi 3 (a) Incipience temperature based on regular site activity. U m - - -
0 2 4 6 8 10 Surface-to-bulk temperature difference, (AT+, OF
(b) Incipience temperature range from where there are few bursts of
Figure 2. -Temperature difference required to initiate bubbles from arti-
bubbles to where bubble detachment ceases.
ficial sites.
- x = o
(a) Nucleus extending outside thermal layer
- x - 0
(b) Nucleus contained within thermal layer.
Figure 3. - Criteria for growth of hemispherical bubble nucleus.
Time, T, sec O.ooo455 0.00137 0.00318 0.00591 0.00955 t Volume, V, in. 5 . 6 5 ~ 1 0 - ~ 4 . 0 0 ~ 1 0 - ~ 1 . 4 7 ~ 1 0 - ~ 3 . 8 5 ~ 1 0 - ~ a. 35x10-5
Time, T, sec 0.0136 0.0191 T 0.0~36 \~c!ume, V, in.3 1 . 2 7 ~ 1 0 ~ ~ 1. 7 8 x N 4 2.04~10-4
I 1 Time, T, sec Volume, V, in.3
0.0300 2. ~ ~ 1 0 - 4
(a) Site diameter, 0.0075 inch.
Figure 4. - Growth profiles of bubbles at artificial site. Temperature difference, AT, 8.3' F; ther- mal layer thickness, 6 = 0.006 inch

Time, T, sec O.OOO25 0.00243 0.00677 0.0120 0.0215 Volume, V, in. 6 . 1 0 ~ 1 0 - ~ 1 . 6 2 ~ 1 0 - ~ 6. 85xW5 1 . 3 2 ~ 1 0 - ~ 2 . 1 5 ~ 1 0 - ~ '
+b t Time, T, sec 0.0389 0.0695 0.122
Volume, V, in. 3 3.35x10⁻⁴ 5.00~10-4 8. 14xKi4
Time, T, sec 0.139 0.143 Volume, V, i n . 3 9.18~10-4 9.30~10-4
(b) Site diameter, 0.0413 inch.
Figure 4. - Concluded.

1x10⁻³
;I-3 . 2 1 M c .- '' .02 E- P =I -
.01~10-3
m
.002
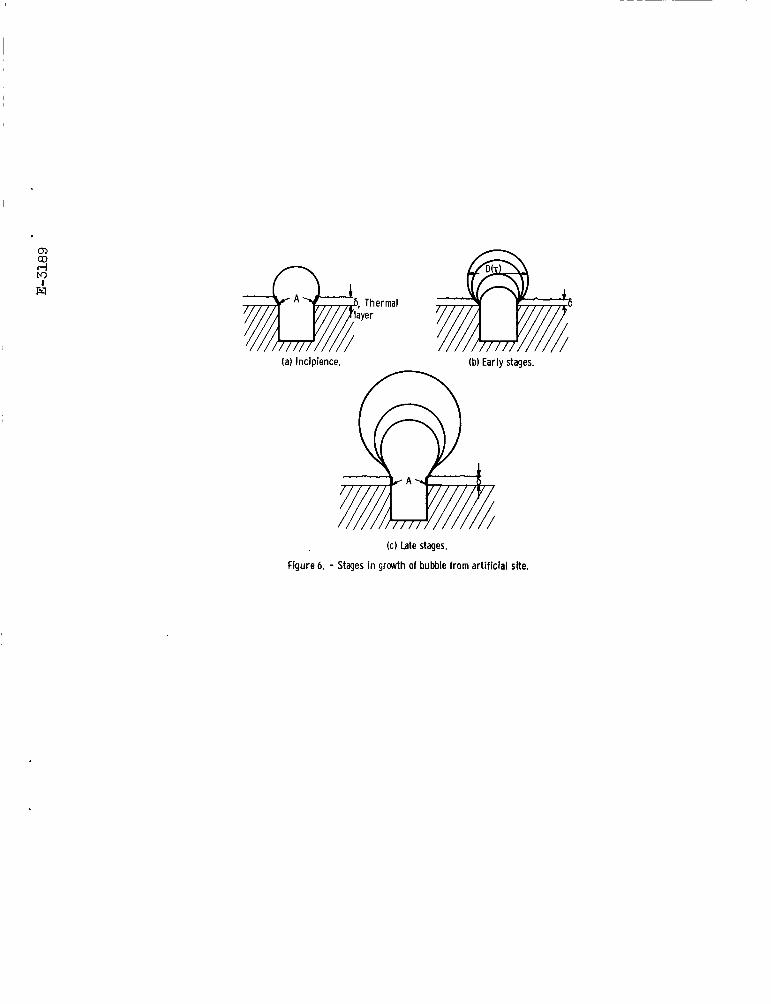
(a) Incipience. (b) Early stages.
( c ) Late stages.
Figure 6. - Stages in grnvth of bubble from artificial site.

.8~10-~
:I .1~10-3
i m K
>- .o d
.-
- 5 P .01~10-3

2x10⁻³ I - Experimental Fritz-Ende, Eq. (15) --
rn .- 1- E' . 2 i f .os
- .04
/ / /
/ /
Surface-to-bu Ik temperature difference. AT. "F /
.m
.ooo2 .OoO4.m .IN1 .IN2 ,004 .006 .01 .02 .04 .06 . 1 . 2 . 4 . 6 1 Time, T, sec
(b) Site diameter, ij.Si3 inch.
Figure 7. - Concluded.

l a ) Vol me, V, 2 .05~10-~ inchY; site diameter, 0.0075 inch (from micro-
(b) Volume, V, 2.9axio-4 inch3: site diameter, 0.0114 inch (from microscope).
scope).
(c) Volume, V, 5.40~10-~ inch3; (d) Volume, V, 8 .44~10-~ inch3; site diameter, 0.0209 inch (from microscope). (from microscope).
site diameter, 0.0413 inch
Figure 8. - Typical bubble configurations just prior to necking down and departure. Temperature difference, AT, 8.3' F. (Al l dimensions i n inches. )
Surface tension force, F ~ T , Ib force
Figure 9. - Comparison of buoyancy and surface tension forces acting on bubbles at onset of departure.

4 w
t I
] i ! ! l 3.6l I 0 . 4 .8 1.2 Radius of bubble, xlb, dimensionless
Figure 10. - Comparison of theoretical and experi- mental bubble profiles at onset of bubble departure when buoyancy and surface tension forces are i n equilibrium. Temperature difference, AT, 8.3" F.
NASA-CLEVELAND. OHIO E-3189