nasa technical loudness and annoyance response to simulated · nasa technical memorandum 107756...
TRANSCRIPT
NASA Technical Memorandum 107756
LOUDNESS AND ANNOYANCE RESPONSE TO SIMULATEDOUTDOOR AND INDOOR SONIC BOOMS
J. D. LEATHERWOODNASA LANGLEY RESEARCHHAMPTON, VIRGINIA
B. M. SULLIVANLOCKHEED ENGINEERINGHAMPTON, VIRGINIA
CENTER
& SCIENCES COMPANY
(NASA-TM-I07756) LOUDNESS AND
ANNOYANCE RESPONSE TO SIMULATED
OUTDOOR AND INDOOR SONIC BOOMS
(NASA) 38 p
N93-27271
Unclas
G3/71 0169405
MAY 1993
N/LRANational Aeronautics andSpace Administration
Langley Research CenterHampton, Virginia 23681-0001
https://ntrs.nasa.gov/search.jsp?R=19930018082 2018-06-03T02:39:18+00:00Z

i
i
II -+
7

LOUDNESS AND ANNOYANCE RESPONSE TO SIMULATED
OUTDOOR AND INDOOR SONIC BOOMS
by
Jack D. Leatherwood and Brenda M. Sullivan
SUMMARY
The sonic boom simulator of the Langley Research Center was used to
quantify subjective loudness and annoyance response to simulated indoor and
outdoor sonic boom signatures. The indoor signatures were derived from the
outdoor signatures by application of house filters that approximated the
noise reduction characteristics of a residential structure. Two indoor
listening situations were simulated: one with the windows open and the
other with the windows closed. Results were used to assess loudness and
annoyance as sonic boom criterion measures and to evaluate several metrics
as estimators of loudness and annoyance. The findings indicated that
loudness and annoyance were equivalent criterion measures for outdoor booms
but not for indoor booms. Annoyance scores for indoor booms were
significantly higher than indoor loudness scores. Thus annoyance was
recommended as the criterion measure of choice for general use in assessing
sonic boom subjective effects. Perceived Level was determined to be the
best estimator of annoyance for both indoor and outdoor booms, and of
loudness for outdoor booms. It was recommended as the metric of choice for
predicting sonic boom subjective effects.
2
INTRODUCTION
NASA Langley Research Center is supporting NASA High-Speed Research
Program efforts to develop an updated technology base for future high-speed
civil transport aircraft (HSCT). Two important parts of the effort include
(a) quantification of potential benefits, in terms of reduced subjective
loudness and annoyance, of sonic boom shaping and (b) determination of
sonic boom exposures that may be acceptable to the general public. These
are important because the economic viability of an HSCT would be
significantly enhanced if it were permitted to fly over land at supersonic
speeds. Experimental studies, using a new sonic boom simulator, are
underway at Langley Research Center to quantify subjective loudness and/or
annoyance effects for a wide range of simulated sonic boom signatures.
Overall objectives include identification of preferred signature shapes for
minimum sonic boom loudness and/or annoyance, development and refinement of
a sonic boom loudness and/or annoyance prediction model, and development of
sonic boom acceptance criteria.
Benefits of boom shaping for simulated outdoor symmetrical N-wave
signatures were explored in references 1 and 2. These demonstrated that
substantial reductions in subjective loudness of N-waves, for constant peak
overpressure, resulted from increases in rise time of the front and rear
shocks. Other studies (references 3 and 4) showed that sonic boom loudness
could be reduced by more detailed shaping of the signatures such as
replacing the N-wave signatures with signatures that achieved peak
overpressure in two distinct pressure rises instead of one. Booms shaped in
this manner are called front shock minimized (FSM) signatures. Results
3
indicated that FSM booms provided significant loudness reductions relative
to N-waves having the same peak overpressure.
Two of the studies described above (refs. 2,4) also investigated the
performance of several metrics as loudness estimators for simulated outdoor
N-wave and FSM booms. The metrics were Stevens Mark VII Perceivel Level,
Zwicker Loudness Level, A-weighted sound exposure level, C-weighted sound
exposure level, and unweighted sound exposure level. Results showed
Perceived Level, A-weighted sound exposure level, and Zwicker Loudness
Level were the best loudness estimators and that any one of the three could
be used as predictors of loudness for outdoor signatures.
Two points should be considered when evaluating the findings of
references 1 to 4. First, the subjective evaluation criterion was loudness
and, second, the booms represented signatures heard outdoors. Whether
loudness is the appropriate criterion measure for booms heard indoors is
uncertain. Indoor sonic boom pressure time histories and spectral content
will differ considerably from outdoor signatures for several reasons. These
include: (a) attenuation of high frequency spectral components with a
consequent increase in relative emphasis of the low frequency components of
indoor boom spectra, (b) loss of distinct rise time characteristics , and
(c) room acoustics. All of these factors may alter loudness and/or
annoyance perceptions of indoor booms. For example, the low frequency
components could introduce annoyance not present in outdoor booms. Studies
of annoyance response to sonic booms and subsonic aircraft noise (refs. 5-
9) inferred that people may judge the loudness or annoyance of these
noises, when heard indoors, by different criteria as compared to the same
noises heard outdoors.
4
The specific objectives of this study included: (a) investigation of
loudness and annoyance response to simulated N-wave and FSM booms as heard
outdoors and indoors; (b) determination of the appropriate criterion
measures (that is, loudness or annoyance) for use in soliciting subjective
reactions to outdoor and indoor booms, and (c) evaluation of several
loudness metrics as estimators of subjective response to indoor and outdoor
booms. Note that subjective perceptions of indoor booms may be influenced
by a number of other factors. These include building vibrations and the
rattle sounds caused by these vibrations. Investigation of these factors
was beyond the scope of the present study and were not considered.
EXPERIMENTAL METHOD
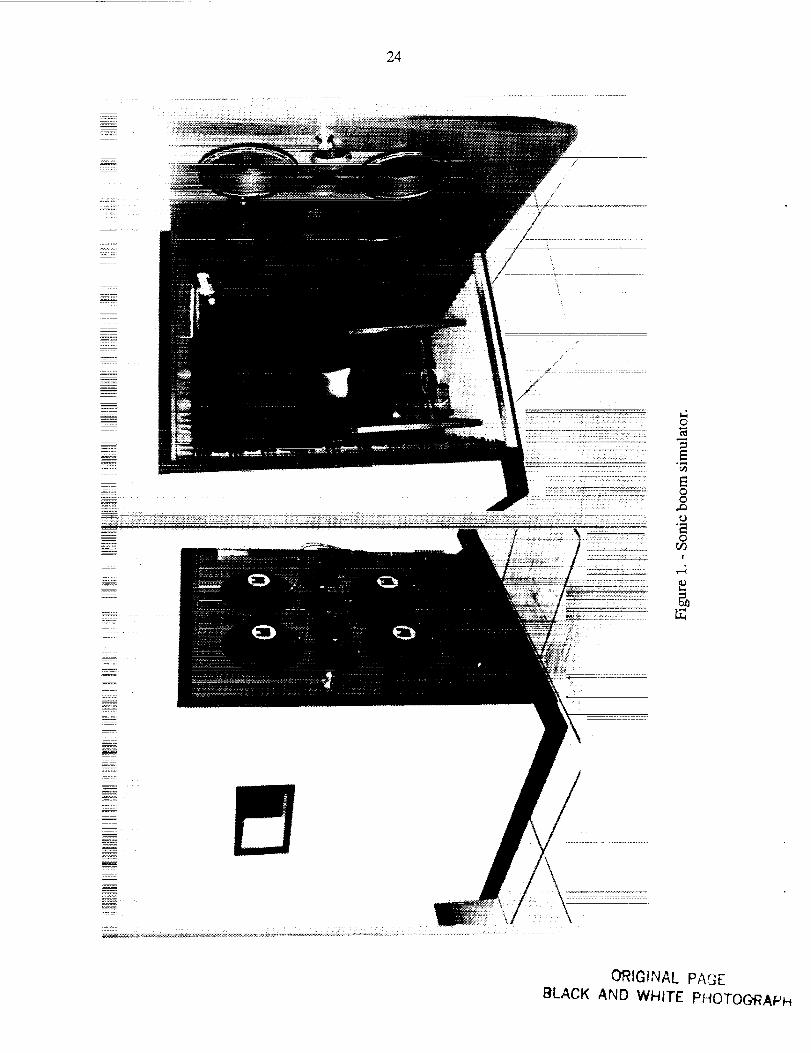
Sonic Boom Simulator
The experimental apparatus used in this study was the Langley Research
Center's sonic boom simulator described in reference 2. The simulator,
shown in figure i, is a person-rated, airtight, loudspeaker-driven booth
capable of accurately reproducing user-specified sonic boom signatures at
peak sound pressure levels up to 138 dB. Input waveforms were computer-
generated and pre-distorted to compensate for irregularities in the
frequency and phase response characteristics of the booth. Pre-distortion
was accomplished by means of a digital broadband equalization filter (ref.
i0). Construction details, performance capabilities, and operating
procedures for the sonic boom simulator are given in reference 2.
5
Test Subjects
Seventy-two test subjects (22 males, 50 females) were used in the
experiment. The subjects were obtained from a subject pool of local
residents and were paid for their participation in the study. Ages of the
test subjects ranged from 19 to 59 years with a median age of 32 years. All
subjects were audiometrically screened prior to the test in order to insure
normal hearing.
EXPERIMENTALDESIGN
Test Stimuli
General.- The test stimuli consisted of 135 simulated N-wave and FSM
signatures representative of those heard outdoors and indoors. Forty-five
of the stimuli were simulated outdoor booms. The remaining 90 stimuli were
simulated indoor booms obtained by modifying the outdoor booms to
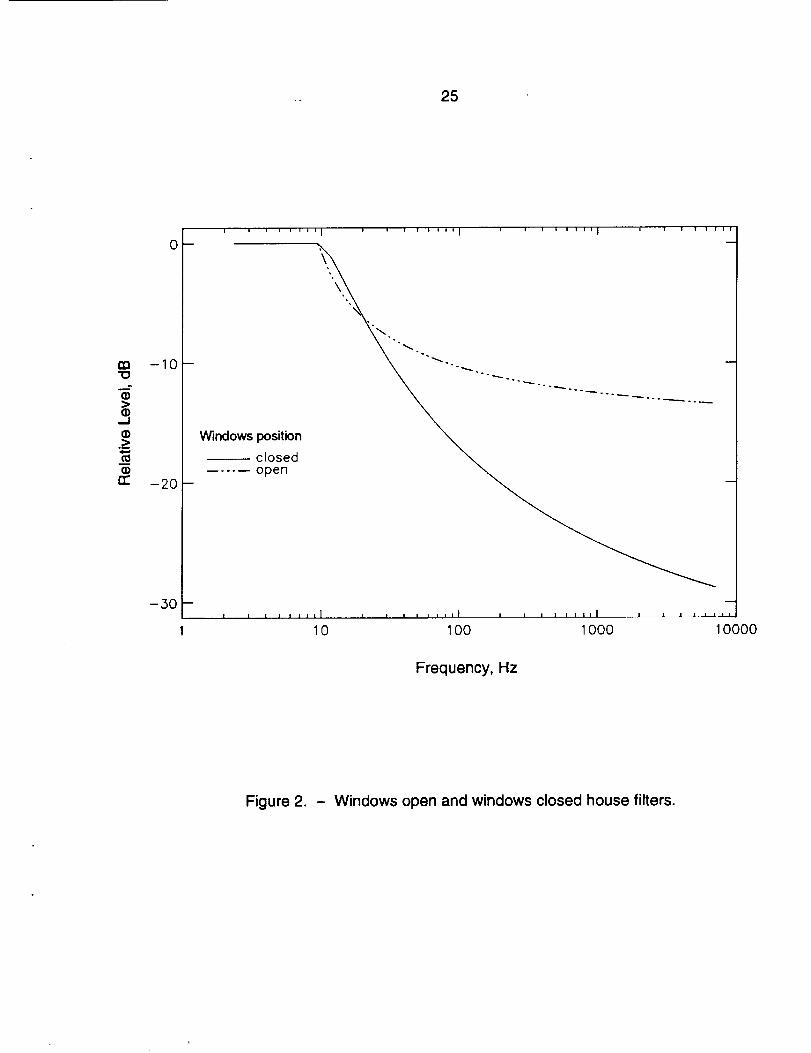
approximate two indoor listening conditions. The modifications involved
application of two "house filters" to the outdoor signatures. One house
filter approximated the frequency dependent noise reduction characteristics
associated with transmission of sound into a typical residential structure
with the windows closed. The other filter represented transmission with the
windows open. The amplitude-frequency characteristics of the two house
filters are shown in figure 2. These are similar to two noise reduction
models described in references 9 and ii for frequencies greater than i0 Hz.
For frequencies below i0 Hz the filters of the present study were assumed
6
to have zero noise reduction. This assumption was based in part upon
consideration of acoustic leakage paths (which exist in typical structures)
that result in zero noise reduction as frequency approaches zero, and in
part on the difficulty involved in specifying a "typical" noise reduction
characteristic for frequencies less than i0 Hz. At these frequencies noise
reduction depends strongly upon specific wall and room properties. Since
these frequencies would be expected to have minimal effect on loudness the
assumption of zero low frequency noise reduction was considered reasonable.
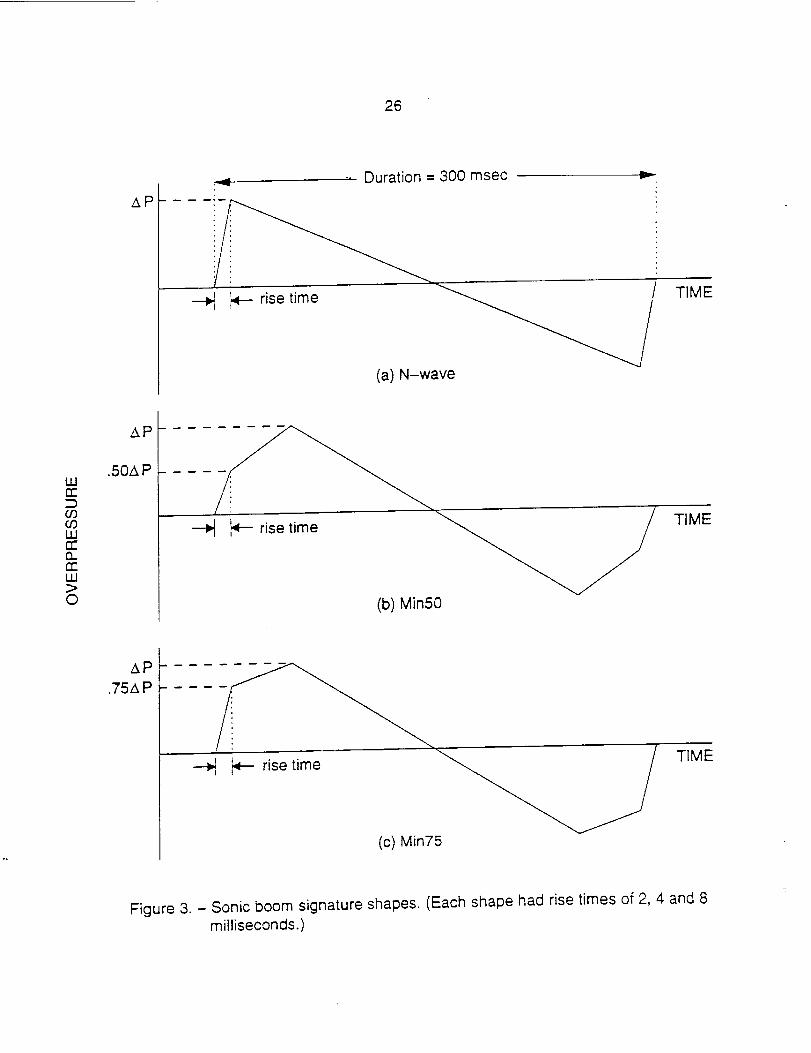
Outdoor Booms.- The outdoor signatures consisted of three boom types which
are displayed in figures 3(a)-3(c). These were: N-waves [fig 3(a)], FSM
signatures with the ratio of front shock overpressure to peak overpressure
equal to 0.50 [fig 3(b)], and FSM signatures with the ratio of front shock
overpressure to peak overpressure equal to 0.75 [fig 3(c)]. All signatures
had durations of 300 milliseconds. Both FSM signatures had secondary rise
times of 60 milliseconds. Each boom type was assigned rise times of 2, 4,
and 8 milliseconds, resulting in nine distinct outdoor shapes. All boom
signatures were symmetrical. For simplicity the FSM booms having a front
shock overpressure to peak overpressure ratio of 0.50 are referred to as
MIN50 booms and those having a ratio of 0.75 as MIN75 booms. Each of the
nine shapes (three boom types times three rise times) were presented at
five peak overpressure levels to give a total of 45 outdoor signatures.
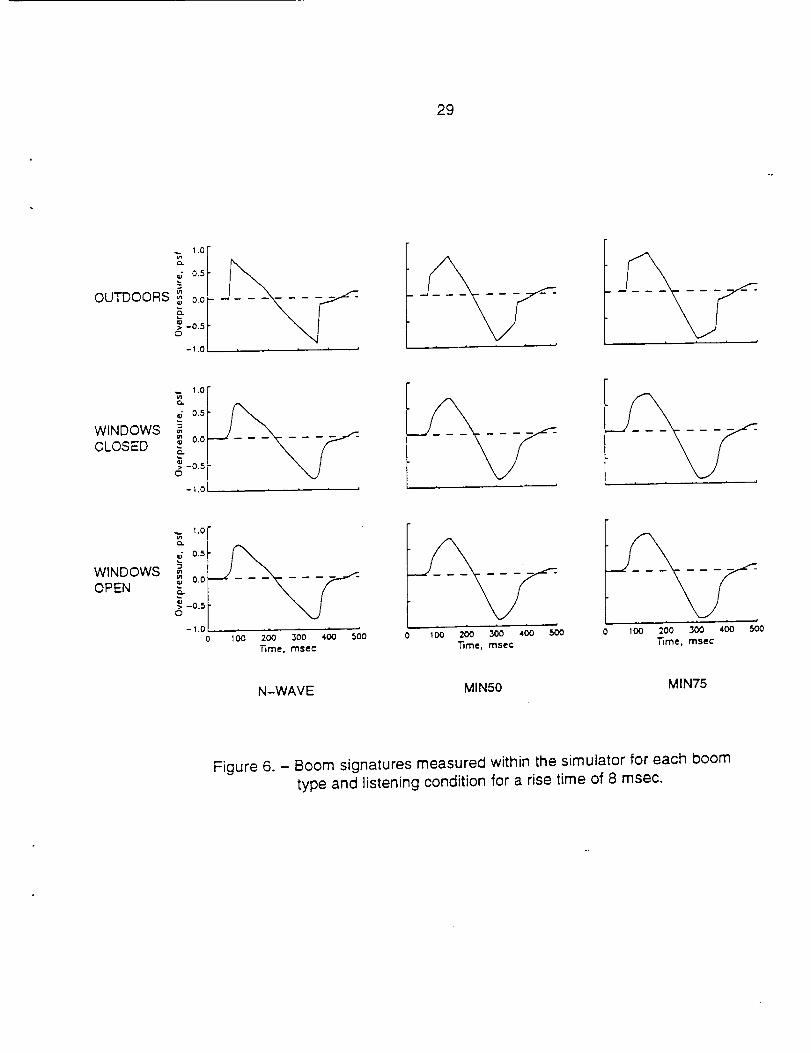
Indoor Booms.- The indoor signatures were obtained by applying each house
filter shown in figure 2 to the outdoor booms. This resulted in 45
signatures representing an indoor-windows closed condition and 45
signatures representing an indoor-windows open condition. Examples of each
7
boom shape (that is, boom type/rise time combination), measured within the
simulator are shown in figures 4 through 6. Note in particular the rounded
appearance and loss of rise time definition for the indoor signatures.
The 145 boom signatures were randomly assigned and randomly sequenced
in three sessions of 45 signatures each. To reduce order effects the booms
within each session were presented in reverse sequence to one-half of the
subjects. To further minimize order effects the presentation sequences of
the sessions were counterbalanced by application of balanced latin squares.
One group of 36 test subjects evaluated the stimuli using loudness as the
criterion measure. Another group of 36 test subjects used annoyance as the
criterion measure.
Scaling Method
The scaling method used was magnitude estimation. The validity of this
method for measurment of sonic boom subjective loudness was demonstrated in
reference 12. In particular, the ratio properties of magnitude estimation
scaling make it very useful for describing and interpreting loudness and
annoyance results obtained from sonic boom subjective response studies.
The magnitude estimation procedure used is summarized as follows: A
sonic boom stimulus, designated as the standard, was presented to a
subject. This standard was assigned a loudness (or annoyance) value of i00
by the experimenter. The standard was then followed by three comparison
(test) stimuli. The task of a subject was to rate the loudness (or
annoyance) of each comparison stimulus as compared to the loudness (or
annoyance) of the standard. For example, if a subject felt that a
8
comparison stimulus was twice as loud (or annoying) as the standard, then
he/she would assign it a value of 200. If the comparison stimulus was felt
to be only one-fourth as loud (or annoying) as the standard, then the
subject would assign it a value of 25. After three comparison stimuli were
evaluated, the standard was repeated and another three comparison stimuli
judged. This standard-comparison sequence was continued until the 45 test
stimuli assigned to a session were evaluated. The subjects were free to
assign any number of their choosing (except negative numbers) to reflect
their loudness (or annoyance) opinions. The standard used in this study was
a symmetrical N-wave signature with a rise time of three milliseconds and a
peak overpressure of 0.89 psf. The instructions explaining how to use the
magnitude estimation procedure are given in Appendix A for the loudness
criterion. Annoyance instructions were similar except that loudness was
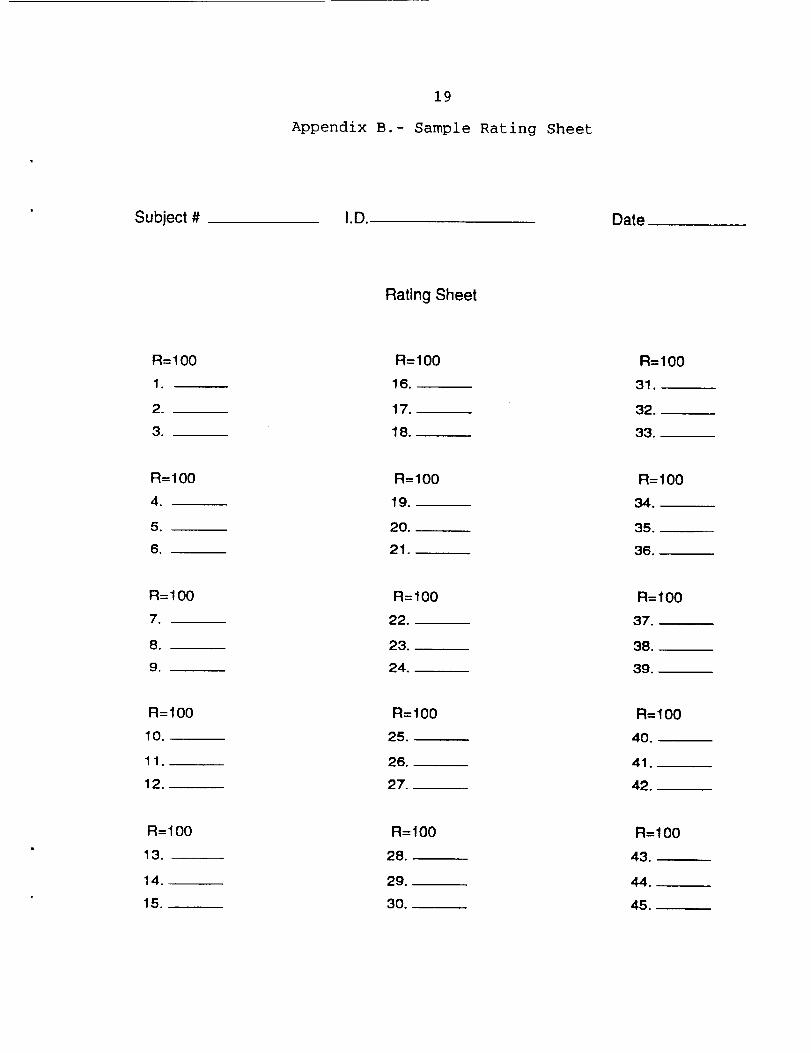
replaced by annoyance. An example of a magnitude estimation scoring sheet
is shown in Appendix B.
Test Procedure
Test subjects were delivered to the laboratory in groups of four, with
one group in the morning and one group in the afternoon on any given day.
Upon arrival at the laboratory each group was briefed on the overall
purpose of the experiment, system safety features, and their rights as test
subjects. A copy of these briefing remarks is given in Appendix C. The
subjects were then given specific instructions related to the test
procedure to be followed and to the use of the magnitude estimation
procedure (see Appendix A). At this point the subjects were taken
9
individually from the waiting room to the sonic boom simulator. At the
simulator the magnitude estimation scoring procedure was reviewed and the
subject listened to several boom stimuli, played with the simulator door
open, in order to become familiar with the type of sounds he/she would be
asked to evaluate. The subject was then given a practice scoring sheet and
seated in the simulator with the door closed. A practice session was then
conducted in which the subject rated a set of practice stimuli similar to
those used in the actual test sessions. Upon completion of the practice
session the practice scoring sheet was collected and any questions were
answered. The actual test session was then conducted. After all subjects
completed the first session they were then cycled through sessions 2 and 3.
No further practice sessions were given.
Data Analysis
The boom pressure time histories measured (within the simulator) were
computer-processed to calculate sound exposure level in terms of three
frequency weightings and to calculate two loudness metrics. The sound
exposure level metrics were: unweighted sound exposure level (Lue), C-
weighted sound exposure level (LEE), and A-weighted sound exposure level
(L_). The loudness metrics were Stevens Mark VII Perceived Level (PL) and
Zwicker Loudness Level (LLZ). The calculation procedure for PL was based on
the method described in reference ii.
The central tendency parameter used to characterize the subjective
rating scores was the geometric means of the magnitude estimates for each

i0
stimulus. It is customary (see reference 13, for example) to use geometric
averaging with magnitude estimation since the distribution of the
logarithms of the magnitude estimates is approximately normal. Furthermore,
subjective loudness (or annoyance) is a power function of the physical
intensity of a sound. Such a power function is linear when expressed in
terms of the logarithms of the subjective loudness (or annoyance) and sound
pressure level, dB.
DISCUSSION OF RESULTS
Loudness and Annoyance Response Considerations
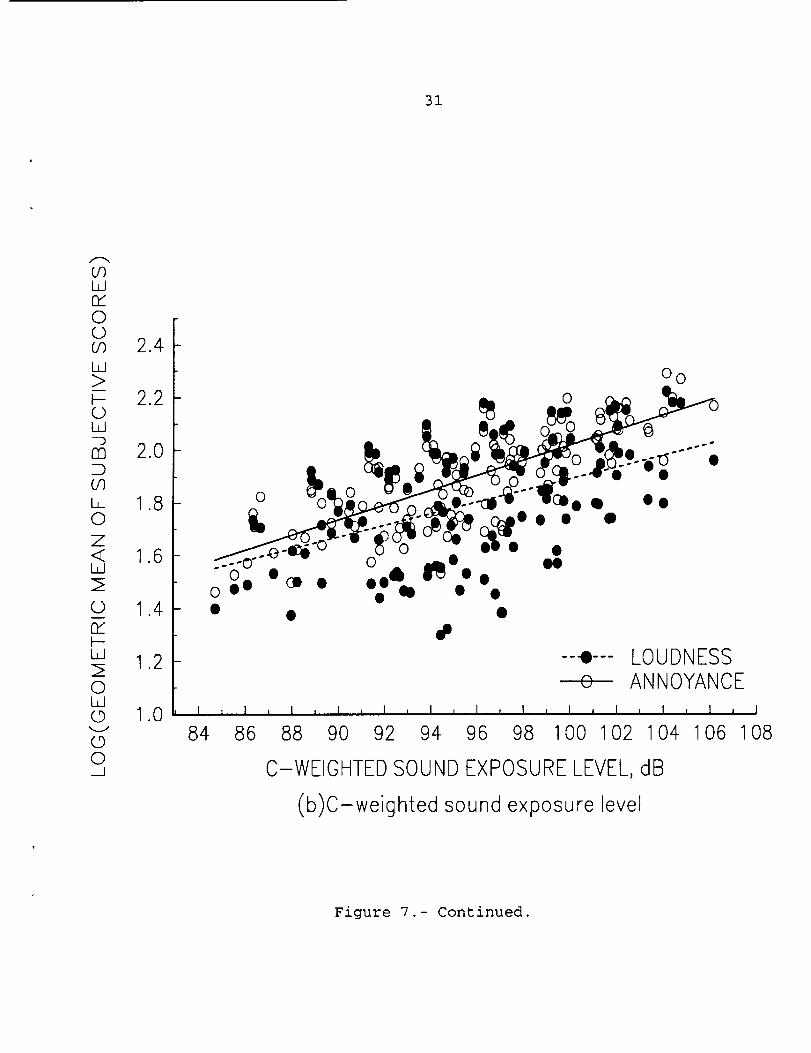
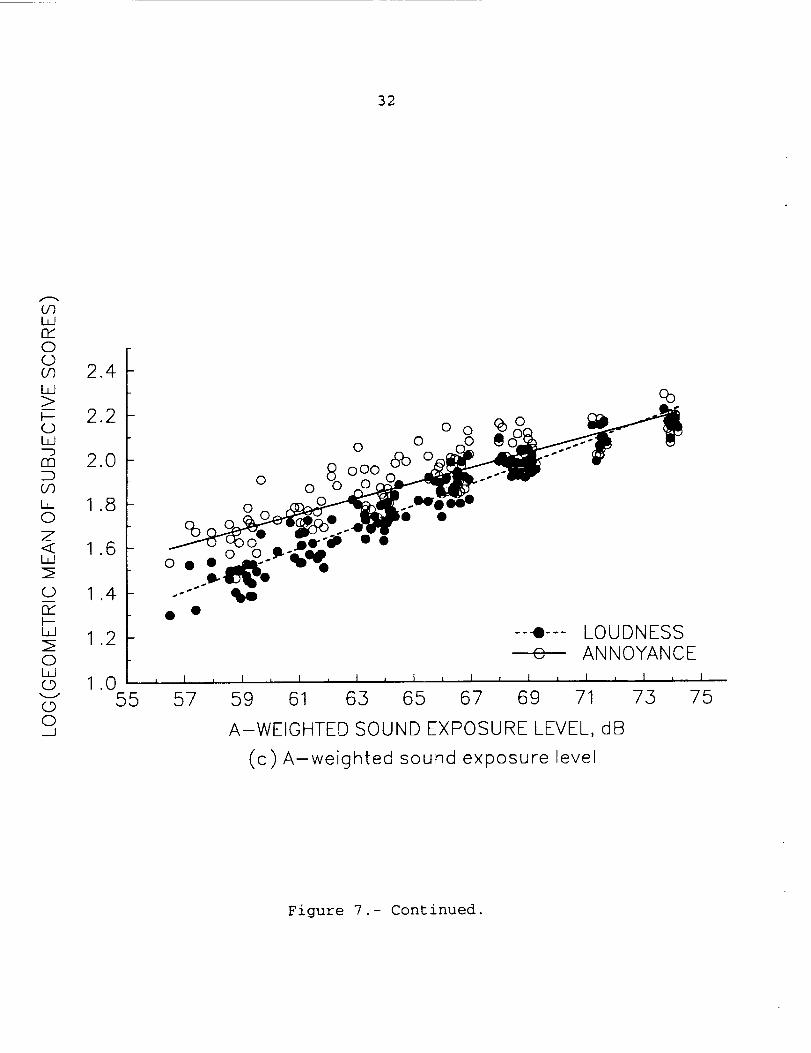
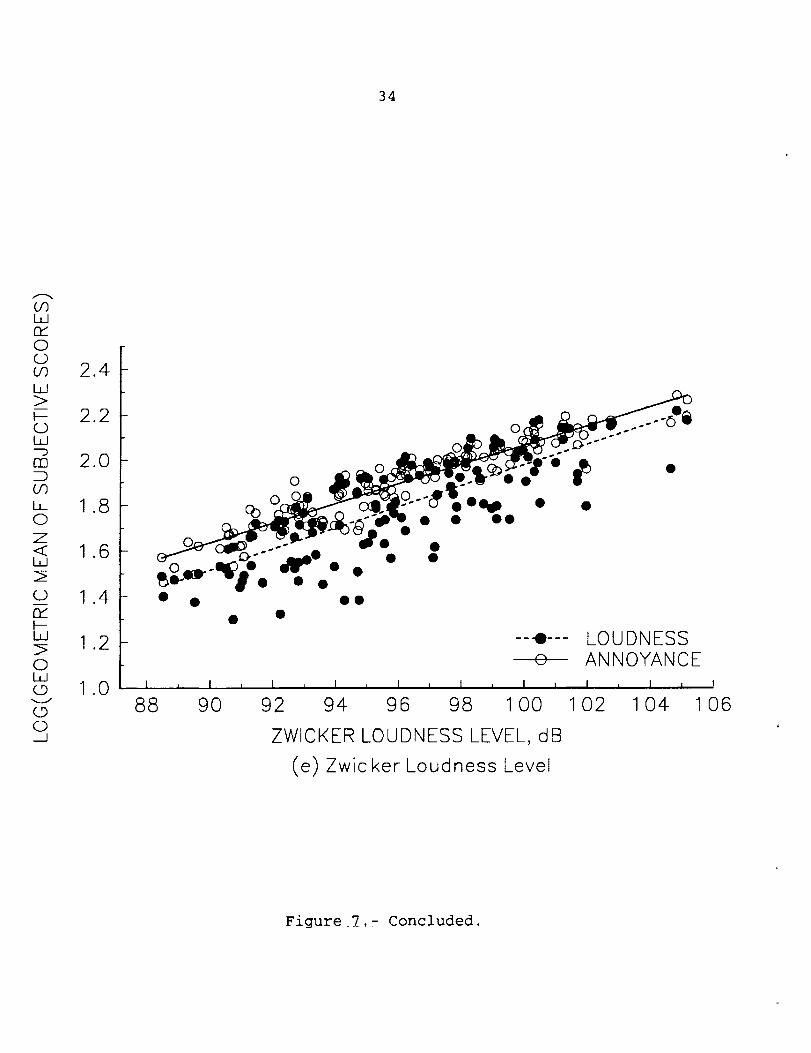
Overall Results.- The logarithm of the geometric means of the loudness and
annoyance scores for the complete stimuli set are shown in figures 7(a)-
7(e) for each of the five metrics. Also shown are the best-fit linear
regression lines calculated for each subjective response criterion. These
data indicate that annoyance and loudness scores generally differed for all
metrics. Dummy variable analysis indicated that each pair of regression
lines differed in slope and/or offset. This implies that loudness and
annoyance were not equivalent criterion measures. To more completely assess
the implication and extent of these results, the data were considered at an
additional level of detail. Specifically, the differences between loudness
and annoyance responses were examined for each of the three simulated
listening conditions: outdoors, indoors-windows closed, and indoors-windows
open.
Ii
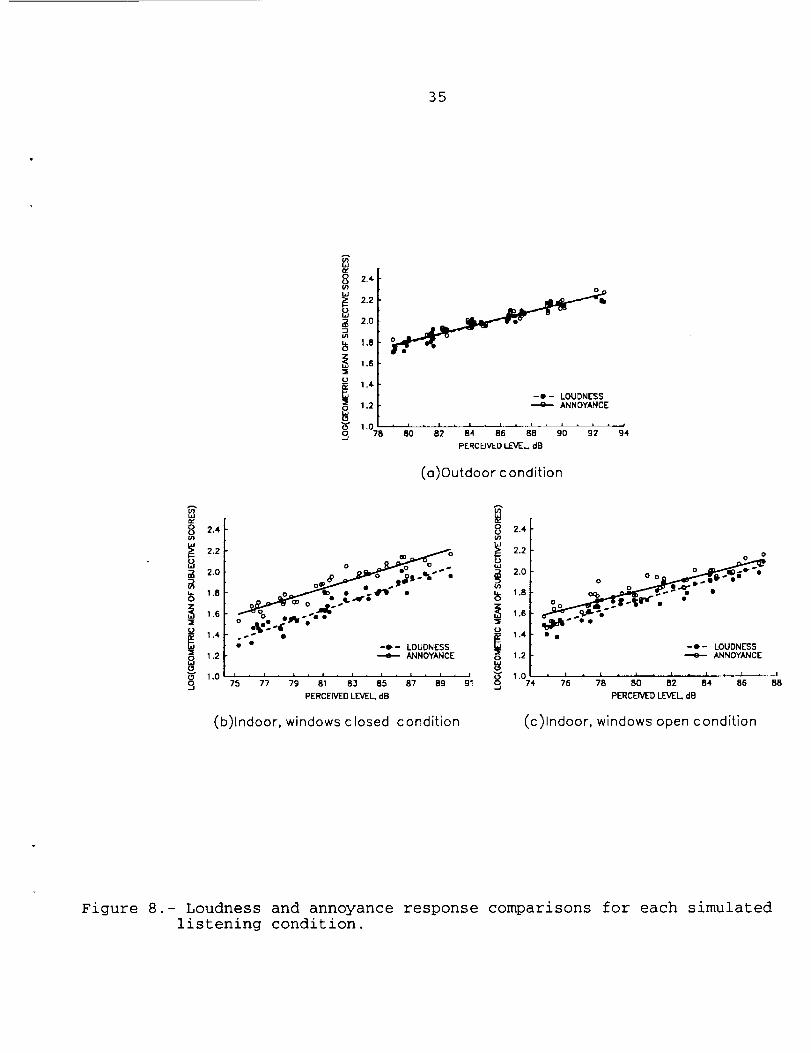
Loudness vs Annoyance Comparison.- Comparisons of the logarithms of the
geometric means of the loudness and annoyance magnitude estimates are
displayed in figures 8(a)-8(c) as a function of Perceived Level for the
outdoors, indoors-windows closed, and indoors-windows open signatures.
Linear regression lines calculated using the data for each criterion
measure are also shown. Perceived Level was used based upon its
demonstrated ability to predict the loudness of shaped booms (see refs. 2
and 4).
Figure 8(a) shows that loudness and annoyance responses were very
similar for the outdoor signatures. Thus loudness ratings of the outdoor
booms also represented annoyance outdoors. This was not true for the two
indoor conditions. Figures 8(b) and 8(c) indicate that loudness scores for
the indoor booms were lower than annoyance scores for these booms,
especially for the windows closed condition. Dummy variable analysis showed
these differences to be statistically significant (probability < 0.001) and
that the slopes of the two lines in each figure were equal. In terms of PL,
the difference between each pair of lines in figures 8(b) and 8(c) (based
on the dummy variable regression analysis) was equivalent to 4.2 dB for the
windows closed condition and 1.6 dB for the windows open condition.
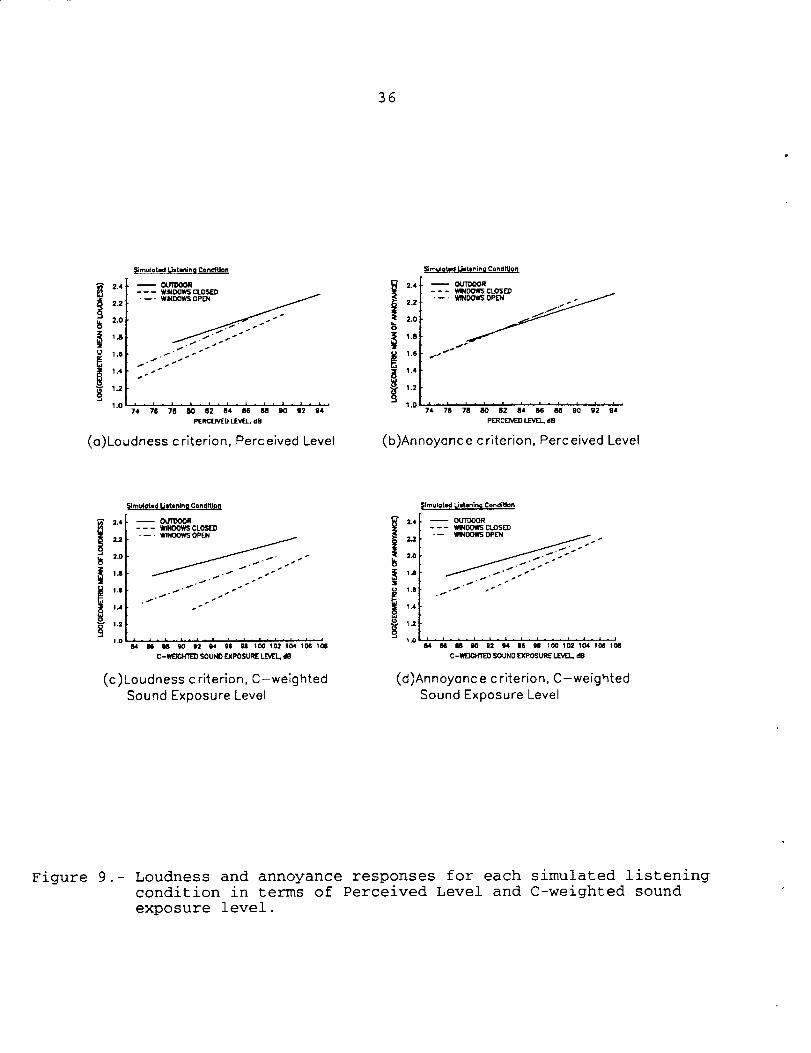
The regression lines of figure 8 were grouped in terms of loudness and
annoyance and are presented in figures 9(a) and 9(b), respectively, for the
three listening conditions. Figure 9(a) shows that, in terms of loudness,
the indoor booms were rated as being less loud than the outdoor booms for
equivalent PL. The largest differences were observed for the windows closed
condition. In terms of annoyance, however, the indoor and outdoor booms
were rated approximately equally annoying as indicated in figure 9(b).

12
Dummy variable analysis confirmed that the loudness differences [figure
9(a)] were significant and that the annoyance differences [figure 9(b)]
were not significant. Thus, PL was an effective estimator of annoyance for
all simulated listening conditions, but was not an effective estimator of
loudness. None of the remaining metrics performed better than PL. For
example, the regression lines for each listening condition obtained using
C-weighted Sound Exposure Level, LeE, as the independent variable are
displayed in figures 9(c) and 9(d). These results show that LeE did not
account for subjective response differences due to listening condition for
either subjective criterion measure.
The reasons for the differences between outdoor and indoor loudness
responses for equal PL are unclear. These booms differed primarily in
spectral content. The house filters progressively attenuated the high
frequency components (greater than i0 Hz) of the outdoor boom spectra,
resulting in indoor signatures having higher proportions of very low-
frequency (below i0 Hz) energy than outdoor signatures and increased high
frequency roll-off rates. Consequently, when matched on the basis of PL,
the relative level of the low frequency energy of the indoor signatures
substantially exceeded that of the outdoor booms. This was particularly
true of the windows closed signatures. These differences in spectral
"balance" between outdoor and indoor signatures may have been a
contributing factor to the observed results although the exact mechanisms
by which this could occur are uncertain. One possibility is that the
relatively intense low frequency energy in the indoor boom spectra,
although not audible, did result in an upward spread of loudness masking
(see reference 14 for a discussion of masking). Another possibility is that
13
the low frequency energy introduced an annoyance factor which interfered
with, or detracted from, the loudness perceptions. The presence of such an
annoyance factor was demonstrated by the significantly higher annoyance
scores (as compared to loudness scores, see figure 8) given to the indoor
booms.
The above results imply that sonic boom criterion levels based upon
indoor loudness judgments may not accurately reflect the actual subjective
acceptability of booms heard indoors. Furthermore, additional factors such
as contextual effects, fear of structural damage, interference with daily
activities, rattle, and window/wall/floor vibration may further increase
annoyance, and reduce acceptability of indoor sonic booms. Thus future
sonic boom subjective tests (and surveys) conducted within actual
residences should require subjects to make annoyance (or acceptability)
judgments in lieu of loudness judgments.
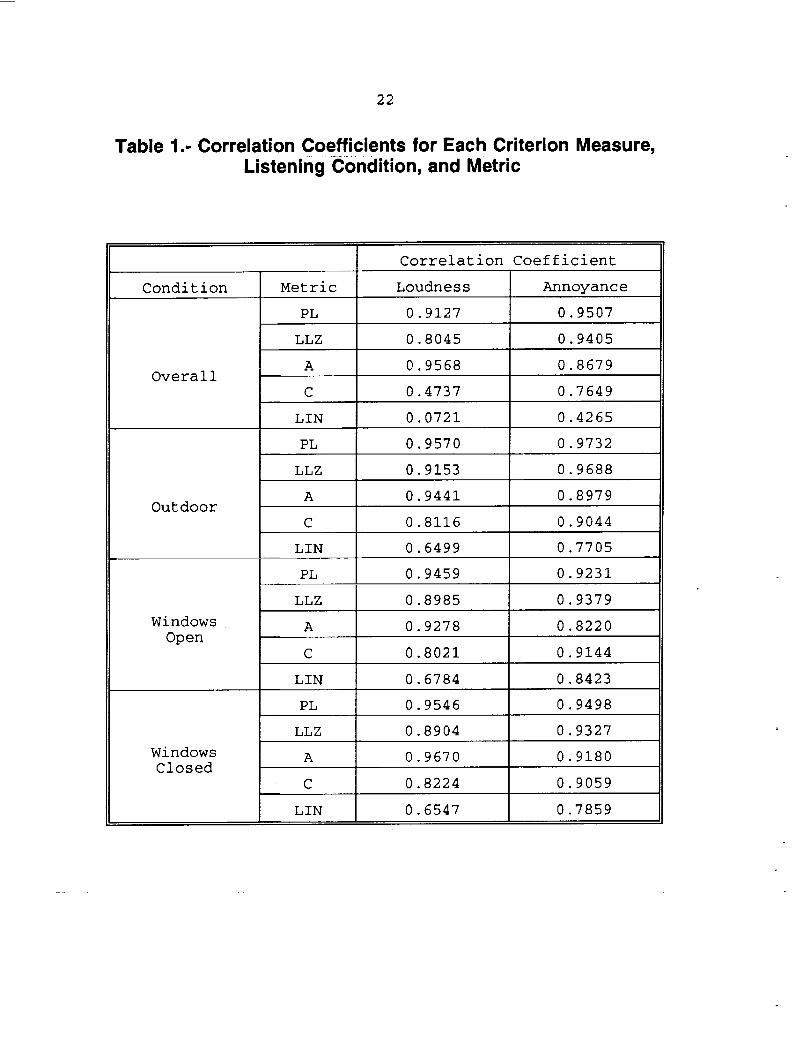
Metric Considerations
Previous studies (refs 2,4) determined that PL, L_, and LLZ were the
best estimators of the loudness of simulated outdoor booms. Those
conclusions were based upon consideration of the degree of relationship
between each metric and subjective loudness and upon the prediction
accuracy of each metric. The degree of relationship was defined by the
linear correlation coefficients and prediction accuracy by the standard
errors of estimate of the regression lines describing the relationship
between subjective loudness or annoyance response and metric level for each
14
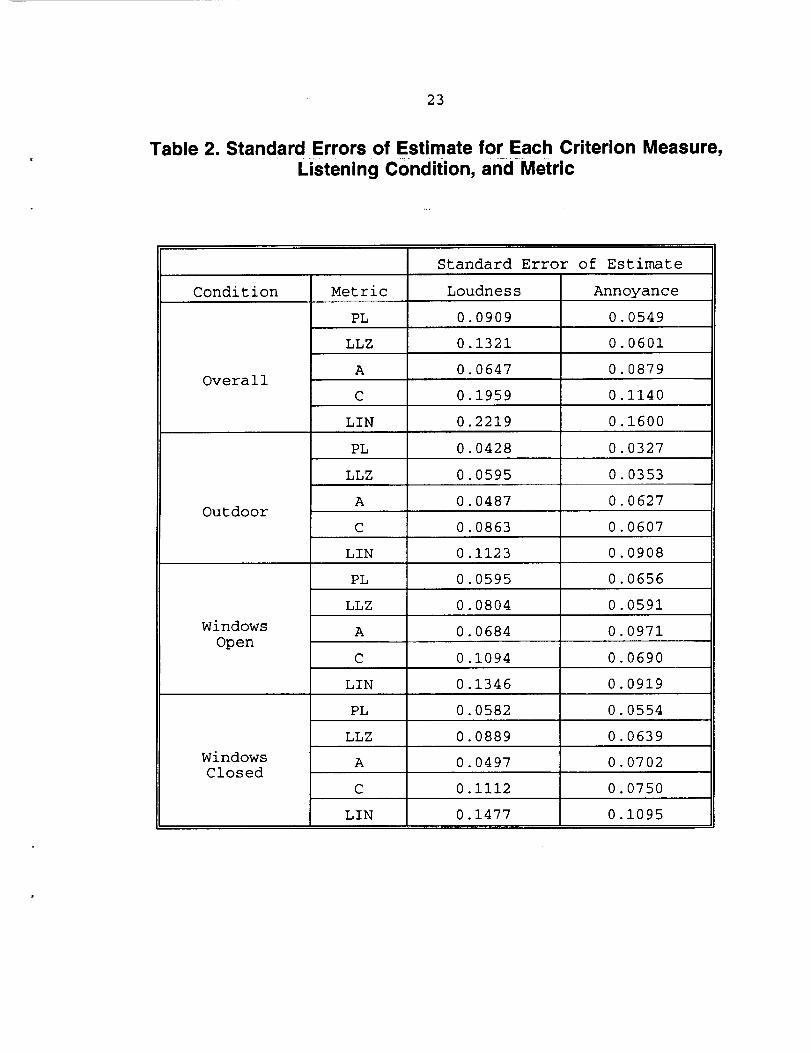
metric. These parameters were calculated for each metric and criterion
measure of the present study. The correlation coefficients are presented in
Table 1 and the standard errors of estimate in Table 2. The two parameters
were calculated for (a) the total stimuli set (135 booms), (b) the outdoor
signatures (45 booms), (c) the indoor-windows open signatures (45 booms),
and (d) the indoor-windows closed signatures (45 booms).
Tables 1 and 2 indicate that the correlations obtained using the
loudness criterion were generally consistent with the earlier findings with
the exception that LLZ did not perform as well for the indoor conditions.
Correlations obtained using the annoyance criterion, however, were not
fully consistent with those of the earlier studies nor with the loudness
results of the present study. For example, the highest annoyance
correlation coefficients were obtained for PL and LLZ. The L_ correlations
with annoyance were significantly lower than those obtained for loudness.
Note also that LeE and LuE correlation coefficients for the annoyance
criterion were significantly higher than those for the loudness criterion.
The reduced performance of L_ and improved performance of LeE and LeE for
annoyance relative to loudness implies that the low frequency content of
the booms was more important for annoyance than loudness. This is
consistent with the results described earlier which showed that the
annoyance scores were higher than loudness scores for the indoor booms.
Generally the standard errors of estimate (see Table 2) for each metric,
except L_, were smaller for the annoyance criterion. This means that
annoyance was estimated with less error than loudness for all metrics
except L_.
The above results, when considered in combination with those of
15
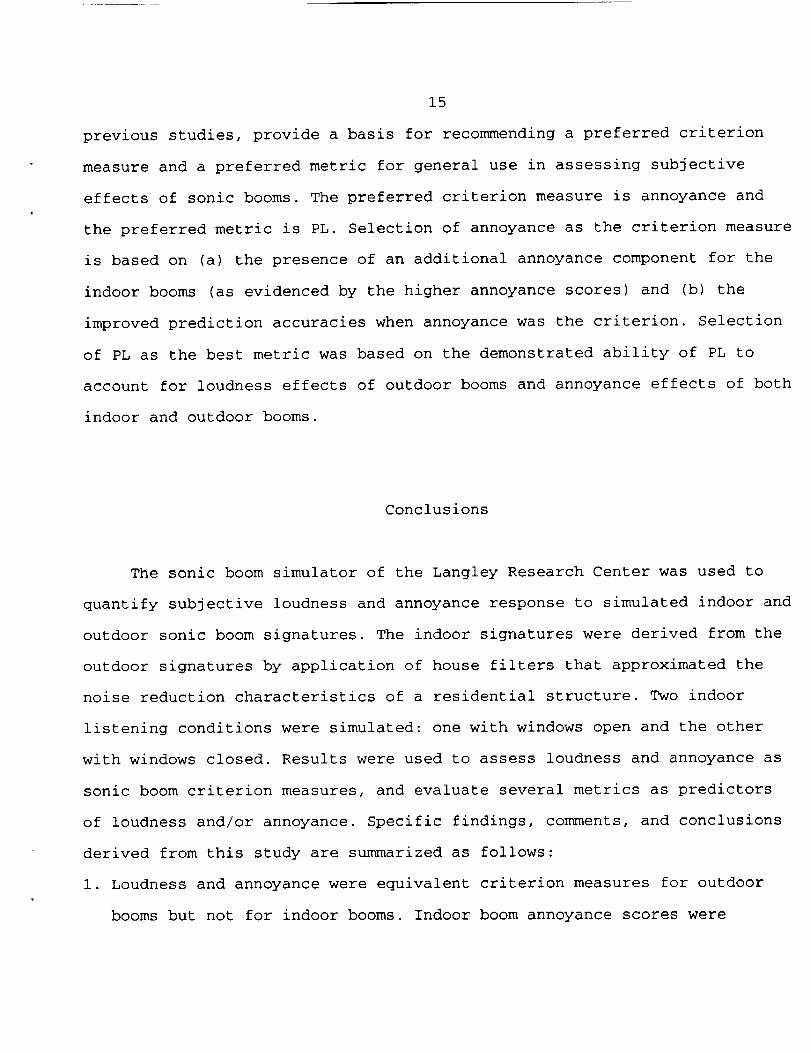
previous studies, provide a basis for recommending a preferred criterion
measure and a preferred metric for general use in assessing subjective
effects of sonic booms. The preferred criterion measure is annoyance and
the preferred metric is PL. Selection of annoyance as the criterion measure
is based on (a) the presence of an additional annoyance component for the
indoor booms (as evidenced by the higher annoyance scores) and (b) the
improved prediction accuracies when annoyance was the criterion. Selection
of PL as the best metric was based on the demonstrated ability of PL to
account for loudness effects of outdoor booms and annoyance effects of both
indoor and outdoor booms.
Conclusions
The sonic boom simulator of the Langley Research Center was used to
quantify subjective loudness and annoyance response to simulated indoor and
outdoor sonic boom signatures. The indoor signatures were derived from the
outdoor signatures by application of house filters that approximated the
noise reduction characteristics of a residential structure. Two indoor
listening conditions were simulated: one with windows open and the other
with windows closed. Results were used to assess loudness and annoyance as
sonic boom criterion measures, and evaluate several metrics as predictors
of loudness and/or annoyance. Specific findings, comments, and conclusions
derived from this study are summarized as follows:
i. Loudness and annoyance were equivalent criterion measures for outdoor
booms but not for indoor booms. Indoor boom annoyance scores were
16
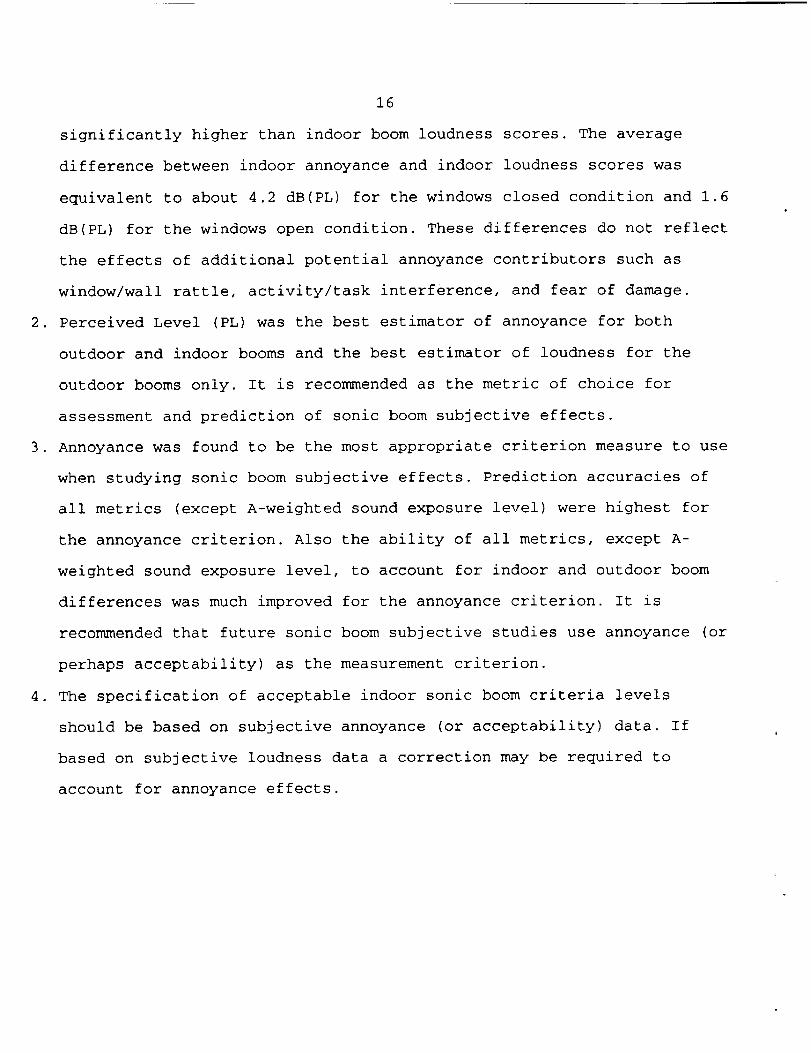
significantly higher than indoor boom loudness scores. The average
difference between indoor annoyance and indoor loudness scores was
equivalent to about 4.2 dB(PL) for the windows closed condition and 1.6
dB(PL) for the windows open condition. These differences do not reflect
the effects of additional potential annoyance contributors such as
window/wall rattle, activity/task interference, and fear of damage.
2. Perceived Level (PL) was the best estimator of annoyance for both
outdoor and indoor booms and the best estimator of loudness for the
outdoor booms only. It is recommended as the metric of choice for
assessment and prediction of sonic boom subjective effects.
3. Annoyance was found to be the most appropriate criterion measure to use
when studying sonic boom subjective effects. Prediction accuracies of
all metrics (except A-weighted sound exposure level) were highest for
the annoyance criterion. Also the ability of all metrics, except A-
weighted sound exposure level, to account for indoor and outdoor boom
differences was much improved for the annoyance criterion. It is
recommended that future sonic boom subjective studies use annoyance (or
perhaps acceptability) as the measurement criterion.
4. The specification of acceptable indoor sonic boom criteria levels
should be based on subjective annoyance (or acceptability) data. If
based on subjective loudness data a correction may be required to
account for annoyance effects.

17
Appendix A.- Magnitude Estimation Instructions for Loudness
SPECIFIC INSTRUCTIONS
This test will consist of three test sessions. Prior to the first test
session each of you will be taken individually to the simulator where you
will listen to sounds that are similar to those you will be asked to rate.
We will then place you in the simulator and a practice scoring session will
be conducted. Upon completion of the practice session we will collect the
practice rating sheets and answer any questions you may have concerning the
test. At this point the first actual test session will be conducted. You
will then return to the waiting room while the other members of your group
complete a similar test. You will return to the simulator two more times to
complete the remaining two test sessions.
During a test session we will play a series of sonic booms over the
loudspeakers in the door of the simulator. The first sonic boom that you
hear, and every fourth boom thereafter, will be a REFERENCE boom that you
will use to judge how loud the other booms are. In order to help you keep
track of which boom is the REFERENCE boom, it will always be preceded by a
short beep. The REFERENCE boom will remain the same throughout the test.
Your task will be to tell us how loud each of the other booms are as
compared to the REFERENCE boom. You will be provided rating sheets for use
in making your evaluations. The rating sheets will indicate when a
REFERENCE boom will be played and the sequence of REFERENCE and other booms
will be organized as follows:
< .......... beep
R =i00 < reference
i ,
o
.
< ........ beep
R=I00<-- reference
.
,
,
The scoring procedure will be as follows: The short beep will indicate
to you that the boom which follows is the REFERENCE boom. Please listen to
it carefully because you will compare the other booms to it. For this
purpose the REFERENCE boom will be assigned a loudness level of i00. Thus
you do not score the REFERENCE boom because it will always have an loudness
level of i00. You will then hear a sequence of three comparison booms.
After listening to each comparison boom you should decide how loud it is
relative to the REFERENCE boom and assign it a number accordingly. This
number will be entered on the appropriate line of the scoring sheet. For

18
example, if you feel the comparison boom is three times louder than theREFKRENCEboom then you would give it a loudness score of 300. If you thinkthe comparison boom is only one-fourth as annoying as the REFZRXNCE boom
you would give it a loudness score of 25. You may choose any number you
wish as long as it faithfully represents your impression of the relative
loudnesses of the comparison and REF2RENCE booms. After evaluating three
comparison booms in this manner you will hear the beep again, followed by
the R2FZRENCE boom and three more comparison booms. This will be repeated
within a test session until a total of 45 comparison booms have been
scored. Remember! There are no right or wrong answers. We are interested
only in how loud the booms sound to you.
19
Appendix B.- Sample Rating Sheet
Subject # I.D. Date
Rating Sheet
R=IO0
1.
2.
3.
R= 1O0
4.
5.
6.
R=IO0
7.
8.
9.
R=IO0
10.
11.
12.
R=IO0
13.
14.
15.
R=IO0
16.
17.
18.
R=IO0
19.
20.
21.
R=IO0
22.
23.
24.
R=IO0
25.
26.
27.
R=IO0
28.
29.
30.
R=IO0
31.
32.
33.
R=IO0
34.
35.
36.
R=IO0
37.
38.
39.
R=IO0
40.
41,
42.
R=IO0
43.
44.
45.
20
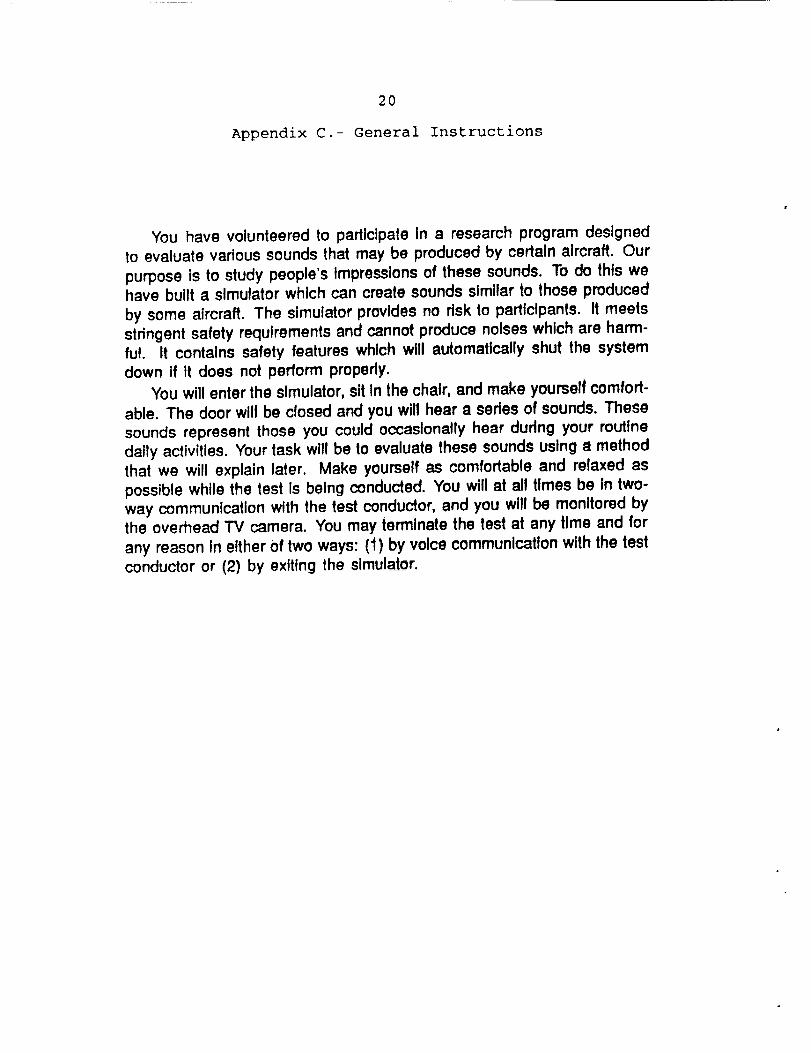
Appendix C.- General Instructions
You have volunteered to participate In a research program designedto evaluate various sounds that may be produced by certain aircraft. Our
purpose is to study people's Impressions of these sounds. To do this wehave built a simulator which can create sounds similar to those produced
by some aircraft. The simulator provides no risk to participants. It meetsstringent safety requirements and cannot produce noises which are harm-
ful. It contains safety features which will automatically shut the systemdown if it does not perform properly.
You will enter the simulator, sit in the chair, and make yourself comfort-
able. The door will be closed and you will hear a sedes of sounds. Thesesounds represent those you could occasionally hear during your routine
daily activities. Your task wilt be to evaluate these sounds using a method
that we will explain later. Make yourself as comfortable and relaxed aspossible while the test is being conducted. You will at all times be In two-way communication with the test conductor, and you will be monitored bythe overhead TV camera. You may terminate the test at any time and for
any reason in either Of two ways: (1) by voica communication with the test
conductor or (2) by exiting the slmula!or.

21
REFERENCES
I. Niedzwiecki, A.; and Ribner, H. S.: Subjective Loudness of N-wave Sonic
Booms. J. Acoustical Soc. Am., vol. 64, no. 6, December 1978.
2. Leatherwood, J. D,; Shepherd, K. P.: and Sullivan, B. M.: A New
Simulator for Assessing Subjective Effects of Sonic Booms. NASA TM-
104150, September 1991.
3. Niedzwiecki, A.; and Ribner, H. S.: Subjective Loudness of "Minimized"
Sonic Boom Waveforms. J. Acoustical Soc. Am., vol. 64, no. 6,
December 1978.
4. Leatherwood, J.D.; and Sullivan, B.M.: Laboratory Study of Effects of
Sonic Boom Shaping on Subjective Loudness and Acceptability. NASA
Technical Paper 3269, October 1992.
5. Johnson, D.R.; and Robinson, D.W.: The Subjective Evaluation of Sonic
Bangs. Acustica, vol. 18, no. 5, 1967, pp. 241-258.
6. Pearsons, K.S.; and Kryter, K.D.: Laboratory Tests of Subjective
Reactions to Sonic Booms. NASA CR-187, March 1965
7. Kryter, K.D.; and Lukas, J.S.: Simulated Indoor Sonic Booms JudgedRelative to Noise from Subsonic Aircraft. NASA CR-2106, August 1972.
8. Broadbent, D.E.; and Robinson, D.W.: Subjective Measurements of the
Relative Annoyance of Simulated Sonic Bangs and Aircraft Noise. J. Sound
Vib., vol. i, no. 2, 1964, pp. 162-174.
9. Brown, D.; and Sutherland, L.C.: Evaluation of Outdoor-to-Indoor
Response to Minimized Sonic Booms. NASA CR-189643, June 1992.
i0. Brown, D. E.; and Sullivan, B. M.: Adaptive Equalization of the
Acoustic Response in the NASA Langley Sonic Boom Chamber. Proc. Conf.
on Advances in Active Control of Sound and Vibration, VPI & SU,
Blacksburg, Va, April 15-17, 1991.
Ii. Shepherd, K. P.; and Sullivan, B. M.: Loudness Calculation Procedure
Applied to Shaped Sonic Booms. NASA TP-3134, December 1991.
12. McDaniel, S.; Leatherwood, J.D.; and Sullivan, B.M.: Application of
Magnitude Estimation Scaling to the Assessment of Subjective Loudness
Response to Simulated Sonic Booms. NASA Technical Memorandum 107657,
September 1992.
13. Stevens, S.S.: Psychophysics, John Wiley & Sons, 1975, pp. 269-270.
14. Kryter, Karl D.: Physiological, Psychological, and Social Effects ofNoise. NASA Reference Publication 1115, July 1984.
22
Table 1.- Correlation Coefficients for Each Criterion Measure,Listening Condition, and Metric
Correlation Coefficient
Condition Metric Loudness Annoyance
PL 0.9127 0.9507
Overall
Outdoor
Windows
Open
Windows
Closed
LLZ 0.8045 0.9405
A 0.9568 0.8679
C 0.4737 0.7649
LIN 0.0721 0.4265
PL 0.9570 0.9732
LLZ 0.9153 0.9688
A 0.9441 0.8979
C 0.8116 0.9044
LIN 0.6499
0.9459PL
0.7705
0.9231
LLZ 0.8985 0.9379
A 0.9278 0.8220
C 0.8021 0.9144
0.6784LIN 0.8423
PL 0.9546 0.9498
LLZ 0.8904 0.9327
A 0.9670 0.9180
C 0.8224 0.9059
LIN 0.6547 0.7859
23
Table 2. Standard Errors of Estimate for Each Criterion Measure,
Listening Condition, and Metric
Standard Error of Estimate
Condition Metric Loudness Annoyance
PL 0.0549
Overall
Outdoor
Windows
Open
Windows
Closed
0.0909
LLZ 0.1321 0.0601
A 0.0647 0.0879
C 0.1959 0.1140
LIN 0.2219 0.1600
PL 0.0428 0.0327
LLZ 0.0595 0.0353
A 0.0487 0.0627
C 0.0863 0.0607
0.1123LIN 0.0908
PL 0.0595 0.0656
LLZ 0.0804 0.0591
A 0.0684 0.0971
C 0.1094 0.0690
LIN 0.1346 0.0919
PL 0.0582 0.0554
LLZ 0.0889 0.0639
A 0.0497 0.0702
C 0.1112 0.0750
0.1477LIN 0.1095
24
//
0
E
Eo0
o°_
0O9
!
0
ORIGFNAL PAGE
BLACK AND WHITE PHOTOGRAPH
25
{:D"o
G)
.>
G)rr
o
-10
-2o
-30
Windows position
closed
..... open
I I I I I I I I I I I I I I I I I I , I I I I I I I I I I I
I I I I-I I I I] | I I I I I I i [ I i l I I I I II i I | I ] I I [
10 1O0 1000 0000
Frequency, Hz
Figure 2. - Windows open and windows closed house filters.
26
AP._ - _. Duration = 300 msec
_-- rise time ___ //
--.....d(a) N-wave
TIME
UJrr
0303LU
O.C_W
0
--_ _ rise time _ / TIME
(b) Min50
&P
.75A P
-_j _ rise time _/ TIME
(c) Min75
Figure 3. - Sonic boom signature shapes. (Each shape had rise times of 2, 4 and 8
milliseconds.)

27
1.0
t-,
6 o.5
OUTDOORS _ ooQ.,
_--0.5
0
-1.0
WINDOWSCLOSED
1.0
el.
6 0.5
0.0
_ -0.50
- 1.0
WINDOWSOPEN
1.0
t-,
_" 0.5
0.0
_ -0.5o
- t.O1O0 200 300 400 50(3 1O0 200 300 400 500 0 _O0 200 300 400 500
Time, msec Time, msec Time, msec
N-WAVE MIN50 MIN75
Figure 4. - Boom signatures measured within the simulator for each boom
type and listening condition for a rise time of 2 msec.

28
1.0
&0..5
OUTDOORS _ oo
-0.5O
-1.0
WINDOWSCLOSED
1.0
0.5
0.0
&_-0.5O
- 1.0
WINDOWS
OPEN
1.01
0.5
o.oc_.
_. -0.50
- 1.00
J
1O0 20O 3OO 4O0 5O0
Time. msec
t O0 200 300 400 500 1O0 200 300 400 500
T_me, msec _me, msec
N-WAVE MIN50 MINT5
Figure 5. - Boom signatures measured within the simulator for each boom
type and listening condition for a rise time of 4 msec.
29
_c. 1.0[
o5[ouTDooRsooi
WINDOWS
CLOSED
1.0
6 0.5
_ 0.0
._ -o.50
-I.0
WINDOWSOPEN
c_
6 0.5
,_ -0.50
-1.00 100 200 300 400 5OO 0 100 200 300 400 500 0 10(3 200 300 40(3 500
Time, msec Time, msec Time, msec
N-WAVE MIN50MIN75
Figure 6. - Boom signatures measured within the simulator for each boomtype and listening condition for a rise time of 8 msec.

30
O9I,I
00O9LLI
I---0LI
m
COLL0
Z<
0r_I--Ld
0Ld0
00_J
2.4
2.2
2.0
1.8
1.6
1.4
1.2
0
o o
• _ 8--v_ _ _o °°°°v'_@°• o_ " .__,,_ _'_
o qb OOo
o•o o IIo •
0LOUDNESS
ANNOYANCE
1.0 , ,,i , I , ..... I i I1 O0 11 0 1 20 1 30 1 40
UNWEIGHTED SOUND EXPOSURE LEVEL, dB
(o) Unweighted sound exposure level
Figure 7.- Loudness and annoyance response (in terms of the logarithms of
the geometric means of the subjective scores) for each metric.
31
A
W
0©
W
p-0W
O3
b
0
z
LO
©
n_p-w
0W
©V
©0
2.4
2.2
2.0
1.8
1.6
1.4
1.2
1.0
0 o
• • •
I , I
84 86
--O--- LOUDNESS0 ANNOYANCE
, I I I I I , I , I I I , I , I , I I l , I
88 90 92 94 96 98 100 102 104 106 108
C-WEIGHTED SOUND EXPOSURE LEVEL, dB
(b)C-weighted sound exposure level
Figure 7.- Continued.
32
bOLdrY0
09Ld>
(3Ld
m
Or)i,0
Z<i,i
rYF-LJ
0Ld(_9
(_90_J
2.4
2.2
2.0
1.8
1.6
1.4
1.2
%
oo %0o o no _o"_...-I_ _r
_oo o
Oo_i"_ °
--o--- LOUDNESS
o ANNOYANCE
I L I • I , I , i, i I , I i I _ l ,
57 59 61 63 65 67 69 71 75
A-WEIGHTED SOUND EXPOSURE LEVEL, dB
(c) A-weighted sound exposure level
I
75
Figure 7.- Continued.

33
O0I,In_0(3O0I,I>F--(DLLJ
m
O0li0
Z<ill
(3
n_
L0
0
(.90_J
24
22
2O
1 8
1 6
1 4
1 2
1 0 I
74
0
0
O o
0
I , I
76 78
0
OO
0
]PO •
I z I I I I I
80 82 84 86
PERCEIVED LEVEL, dB
(d) Perceived Level
--O---
0
, I
88
LOUDNESSANNOYANCE
1 _ 1 I
90 92I
94
Figure 7.- Continued.
34
09I,In-"0r.DO91,1>F--0Ld
OD
O9h_0
Z<I,I
rY"l--Ld
0Ld(_9
C_90
2.4
2.2
2.0
1.8
1.6
1.4
1.2
1.0
0
qb
. o Oo. " "o• • 00
• 00
--0---
0
L , l , I L I J I a t J I i I
88 90 92 94 96 98 100 102
ZWiCKER LOUDNESS LEVEL, dB
(e) Zwicker Loudness Level
LOUDNESSANNOYANCE
I u 1
1 04 1 06
Figure 7.- Concluded.
35
00 2.4.(/1
i 2.22.0
1.8
,_, 1.6
i1"I1.2
1.0 -q 78
o
-D - LOUDNESS
ANNOYANCE
PERCEIVED LEVEL' dB
(o)Outdoor condition
o° 2.4it}
2.2
2.0
1.8
1.6
i 1.41.2,.9
t_5
o_" 1.0 7'5 "
e,,-o 2.4o
o I0 °o _ ° 2.0
o_o../'-t__ * ".llrl • 1.S
o _ ^ _o q...,o"e -
_ - ° -4"'- _ 1.s
77
0 o
o o o o o•
°° • •
1.4i • •
-e.- LOUDNESS -o- LOUDNESS•--e.-- ANNOYANCE o 1.2 ,,,-e-- ANNOYANCE
1 o...... ...... ....79 81 8'3 87 89 91 '--& IG 80 B2 84 86
PERCEIVED LEVEL. dB PERCEIVED LEVEL, dB
(b)lndoor, windows closed condition (c)lndoor, windows open condition
i
B8
Figure 8.- Loudness and annoyance response comparisons for each simulated
listening condition.
36
(a)Loudness criterion, Perceived Level
S;mulo'_l Lllt_ir_ Co_tUon
I 2.4 _ OUIOOOR
--- W_DOW_ CLDSEI;t
• _ • W1NDOW'30P[N ._2.2
2.01,8
_ 1.4
_ 1.2
1,0 i i ....................74 76 78 80 B2 8& 66 E8 gO g2 g4
P[RCENEO LEVEL. dB
(b)Annoyence criterion, Perceived Level
i 2.42.3
.J
_ I_|
_ ,.4
_e4 Uetenlng Co.dlt_n
-- OUTOOOR _" 2.4- - -- W1NDOWS CLOSE])
- -- - WINOOW5 OPEN 2.2
1.1B
S
(c)Loudness c riterion, C-weightedSound Exposure Level
S_m_lote_l Ultening CondRJon
-- OUTDOOR
- - - _ CEOSE_
- -- WINOOW5 OPEN _..
84 84B 14 I10 92 94 116 g8 100 102 104 108 IOe
C -_R]GHTED 5OUND EXPOSURE LEVEL, dB
(d)Annoyanc e c riterion, C-weightedSound Exposure Level
Figure 9.- Loudness and annoyance responses for each simulated listening
condition in terms of Perceived Level and C-weighted sound
exposure level.

Form Approved
REPORT DOCUMENTATION PAGE OMa _o.o7o4-o188
Puoli¢ report=rig burden for this ccIleCtlOi_ of _'_forma(ion qs est_matecl _,o _verage 1 hour Der resporse. =nctucling the time for revlewmg _r_strLictlol_$. searching exrsttncj clata sources
_a_erlng and mamtalrllng the clara neecled, and co,preYing ariel revle_ng *_he _ollect_on Of infor_aTiOr_ C_erld ¢ommetlT$ tec_araing th_s burden eslimate of :_ny ,3_het a_Dect of th_scoiled O_ of infor_nation, qncludmg sugge_tlon$ for reclucmg th_ Durclen (o _Vashmg1on HeaClCluar_er$ _erwces, Direc_ofale for Information O_i'allons and Reo<)rt_, 1215 Jeffe¢$ol'l
Oav=s H,ghway, Suite 1204, _tlington, VA 22202-4302, and to the Office Of Managemen_ and Budgel PaDerwOrk ReOuc_lon Project 07Q4-0 8B). Washington. OC 20503.
t. AGENCY USE ONLY (Leave blank) 2. REPORT DATE 3. REPORT TYPE AND DATES COVERED
Ma_, lgg3 Technical Memorandum4. TITLE AND SUBTITLE 5. FUNDING NUMBERS
Loudness and Annoyance Response to Simulated Outdoor and Indoor Sonic Booms WU 537-03-21-03
6. AUTHOR(S)
J. D. LeatherwoodB. M. Sullivan
7. PERFORMING ORGANIZATION NAME(S) AND ADDRESS(ES)
NASA Langley Research CenterHampton, VA 23681-0001
9. SPONSORING/MONITORING AGENCY NAME(S) AND ADDRESS(ES)
National Aeronautics and Space AdministrationWashington, DC 20546
8. PERFORMING ORGANIZATIONREPORT NUMBER
10. SPONSORING / MONITORINGAGENCY REPORT NUMBER
NASA TM 107756
11. SUPPLEMENTARYNOTESLeatherwood: NASA Langley Research Center, Hampton, VASullivan: Lockheed Engineering & Sciences Company, Hampton, VA
12a. DISTRIBUTION/ AVAILABILITYSTATEMENT
Unclassified---UnlimitedSubject Category--71
12b. DISTRIBUTION CODE
13. ABSTRACT(Maximum200 words) The sonic boom simulator of the Langley Research Center was used to quantify subjectiveloudness and annoyance response to simulated indoorand outdoor sonic boom signatures. The indoor signatures werederived from the outdoor signatures by applicationof house filters that approximated the noise reductioncharacteristics of aresidential structure. Two indoor listeningsituationswere simulated: one with the windows open and the other with thewindows closed. Results were used to assess loudness and annoyance as sonicboom criterion measures and to evaluateseveral metrics as estimators of loudness and annoyance. The findingsindicated that loudness and annoyance wereequivalent criterionmeasures for outdoor booms but not for indoorbooms. Annoyance scores for indoor booms weresignificantly higher than indoor loudness scores. Thus annoyance was recommended as the criterion measure of choice forgeneral use inassessing sonicboom subjective effects. Perceived Level was determined to be the best estimator ofannoyance for both indoorand outdoor booms, and of loudness for outdoor booms. It was recommended as the metric ofchoice for predicting sonic boom subjective effects.
14. SUBJECTTERMS
Sonic Boom; Subjective Response; Loudness; Simulator; Shaped Boom; Minimized Boom
17. SECURITY CLASSIFICATION 18. SECURITY CLASSIFICATION 19. SECURITY CLASSIFICATIONOF REPORT OF THIS PAGE OF ABSTRACT
Unclassified Unclassified UnclassifiedNSN 7540-0:-:80-5500
15. NUMBER OF PAGES
37
16. PRICE CODE
A0320. LIMITATION OF ABSTRACT
Standard ;orm 298 [_ev 2-89)P,es¢" DeCl _ :,NSI :,_o Z39-'$
:'J8-_02