nasa...nasa army research laboratory technical memorandum 106432 memorandum arl—mr-122 gear sound...
TRANSCRIPT

NASA
Army Research LaboratoryTechnical Memorandum 106432
Memorandum ARL—MR-122
Gear Sound Levels With Various ToothContact Ratios and Forms
Joseph W. Lenski, Jr., Robert H. Spencer, and Raymond J. DragoBoeing HelicoptersPhiladelphia, Pennsylvania
Mark J. ValcoVehicle Propulsion DirectorateU.S. Army Research LaboratoryLewis Research CenterCleveland, Ohio
and
Fred B. OswaldNational Aeronautics and Space AdministrationLewis Research CenterCleveland, Ohio
Prepared for theRotary Wing Propulsion Specialists Meetingsponsored by the American Helicopter SocietyWilliamsburg, Virginia, October 25-28, 1993
U.S. ARMY
NASA RESEARCH LABORATORY
https://ntrs.nasa.gov/search.jsp?R=19940014845 2020-04-27T01:34:42+00:00Z
Gear Sound Levels With Various Tooth ContactRatios And Forms*
By
Joseph W. Lenski, Jr.Associate Technical Fellow
Boeing HelicoptersPhiladelphia, PA
Robert H. Spencer
Raymond J. Drago, PEStaff Engineer
Associate Technical FellowBoeing Helicopters
Boeing HelicoptersPhiladelphia, PA
Philadelphia, PA
Mark J. Valco
Fred B. OswaldAerospace Engineer
Research EngineerLewis Research Center/U. S. Army
Lewis Research Center/NASA
Cleveland, Ohio
Cleveland, Ohio
ABSTRACT
The real noise reduction benefits which may beobtained through the use of one gear tooth form ascompared to another is an important design parameterfor any geared system, especially for helicopters inwhich both weight and reliability are very importantfactors. This paper describes the design and testing ofnine sets of gears which are as identical as possibleexcept for their basic tooth geometry. Noisemeasurements were made at various combinations ofload and speed for each gear set so that directcomparisons could be made. The resultant data wasanalyzed so that valid conclusions could be drawn andinterpreted for design use.
* Presented at the American Helicopter Society, Inc.Rotary Wing Propulsion Specialists Meeting, October25-28, 1993
Material in this paper was extracted from a paperpresented at the American Gear Manufacturer'sAssociation Fall Technical Meeting, Oct. 14-15, 1993,Detroit MI.
INTRODUCTION
The problem of gear noise in helicopter transmissionsis ever present. The main exciting forces whichproduce this noise are the meshing forces of the gearteeth in the transmission. While this is certainly anoversimplification, the simple fact remains that if thebasic exciting forces are reduced and no amplifyingfactors are present, the overall sound level of thesystem will be reduced.
Among the several ways in which the gear toothmeshing forces may be reduced, two of the mostdirectly applicable to helicopter transmissions are theform of the teeth and the overall contact ratio. Bothapproaches are quite attractive for an aerospaceapplication since, unlike other "treatment" methods,which are applied with penalties to either systemweight or performance, these approaches have thepotential for reducing noise without causing anyincrease in overall system weight or reducingperformance. In fact, both approaches also offer thepossibility of actually providing improved gearperformance in terms of longer life, higher loadcapacity, improved reliability, and reduced weightwhile simultaneously reducing sound levels.

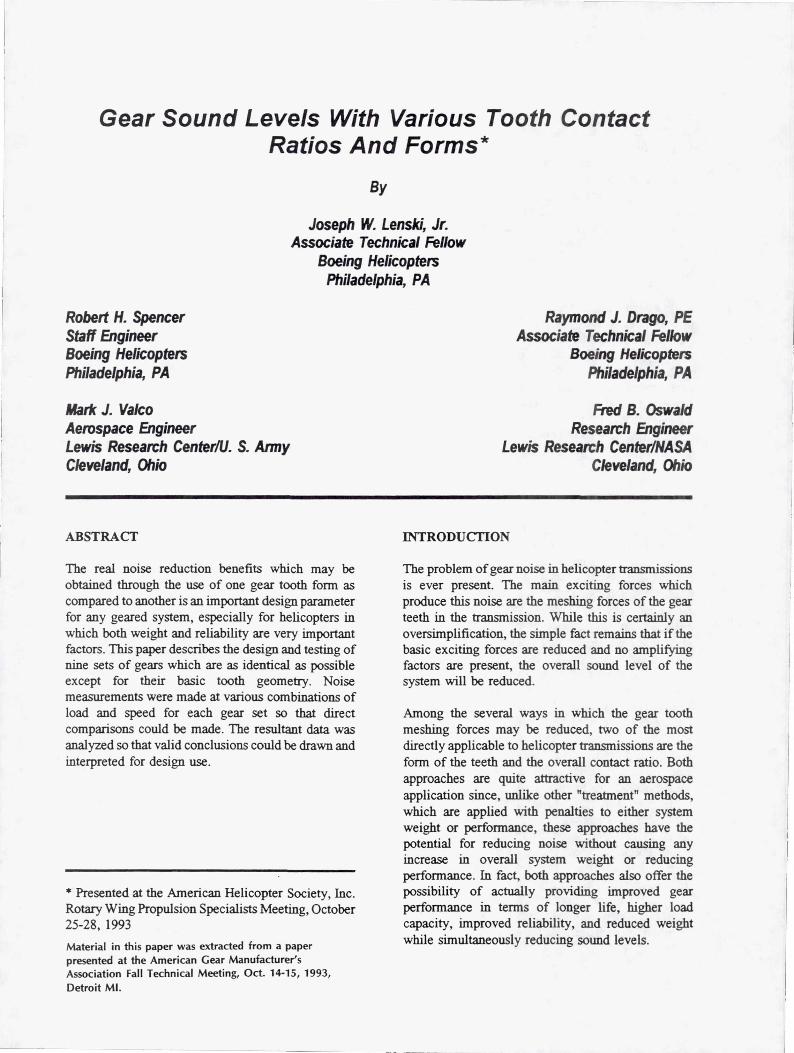
The objective of this pro gram was to define, bycontrolled testing and actual noise measurements, theeffect of changes in the profile, face, andmodified contact ratios and the gear tooth form,separately and in combination, for spur and helicalgears, on the sound levels produced by otherwiseidentical spur and helical gears. In order toaccomplish this objective, a program was defined todesign appropriate gears (Table 1), fabricate asufficient number of test specimens, and conduct thetesting required.
While a wide range of specimens is shown, they wereall configured as nearly alike as practical, within thelimitations imposed by manufacturing considerationsand the test stand. Testing was conducted in a singlemesh gear box under controlled conditions whichwere maintained as nearly identical as possible.Acoustic intensity measurements were taken with theaid of a robot to insure repeatability of measurementbetween gear sets and to minimize human techniqueinfluence.
TEST GEAR DESIGN
Eight (8) sets of gears, four (4) spur and four (4)helical as listed in Table I, compatible with theNASA Lewis gear noise test rig, were designed. Ofthe four sets of spur gears, two sets have an involutetooth form and two utilize a noninvolute, constantradius of curvature tooth form. All gears weredesigned in accordance with normal BoeingHelicopters practice so that, except for size, they arerepresentative of typical helicopter gears.Since these gears were tested in the NASA test rig, itwas also necessary to maintain compatibility with thetest rig. The standard NASA test gears incorporateda loose fit between the gear bore and the shaft outsidediameter. In order to be sure that the noise testresults, especially for the helical gears, were notaffected by this loose fit, it was changed to a press fitwhich would be more typical of that used in ahelicopter application. While this change caused somedifficulty in changing from one configuration toanother, it was important from a test validity point ofview. Previous' NASA testing of Boeing Helicoptersdesigned small gears using the high profile contactratio noninvolute tooth form (HCR-NIF) indicated thattheir surface load capacity was substantially higherthan that of conventional involute gears and that theirbending load capacity (at torque loads) was at least
equal to and actually slightly greater than the standardinvolute gears. The scoring resistance of the HCR-NIF gears, in the NASA tests, appeared to be lowerthan that of equivalent standard gears. The lowerscoring load capacity performance may have been dueto inadequate profile modification on the small testgears, therefore, the HCR-NIF gears for this testingincorporated improved profile modifications.
The test gear configurations were selected to berepresentative of those which are either actually in useor have near term potential of being used in helicoptertransmissions. While lower sound levels are generallyassociated with helical gears as compared to spurs,there was no definitive data, for accurate, groundtooth gears, which defines the sound advantage whichmay be obtained. Similarly, anecdotal informationindicates that higher contact ratios, both face andprofile, also tend to reduce sound levels but, again,hard data was not readily available.
While helical gears provide some noise reduction,their use also generates a thrust load which must bedealt with in the design of the overall system,especially the support beatings, gear blank design, andhousing structure. Double helical gears provide somerelief from the net thrust problems, however, thethrust loads from each helix must still be cancelledwithin the gear blank and the overall effect of this onthe sound level of the gear has not been studied at all.
New tooth forms of various noninvolute types havebeen investigated for possible use in helicoptertransmissions in recent years but these investigationshave centered almost universally on the load capacityaspect of the forms and not their noise behavior. Oneof these has demonstrated some potential forimproved load capacity in previous testing.
Considering all of these factors, the range of gearconfigurations defined in Table I and shown in Figure1 was selected to provide some basic answers to theirrespective noise behaviors. The basic gear tooth datafor the test gears is provided in Table II.
TEST FACILITY
The NASA Lewis Research Center gear noise rig,Figure 2, was used for these tests. This rig features asingle-mesh gearbox powered by a 150 kW (200
3 ^i ^, 5oP v rf
5`:
f'
r
I-,
Table I Gear Noise Test Matrix
Confiauratim Tooth FormContact Ratios
Profile Face Modified
1. ConventionalSpur Baseline
Involute Spur 1.25 0.00 1.25
2. HCR-INV Involute Spur 2.15 0.00 2.15
3. ConventionalSingle Helical Baseline
Involute Helical 1.25 1.25 1.77
4. Double Helical Involute Helical 1.25 1.25 1.77
5. HCR-INV Involute Helical 1.25 1.75 2.15
6. HCR-INV Involute Helical 2.15 2.25 3.11
7. NIF Baseline Nonlnvolute Spur 1.25 0.0 1.25
8. NIF-HCR NonInvolute Spur 2.15 0.0 2.15
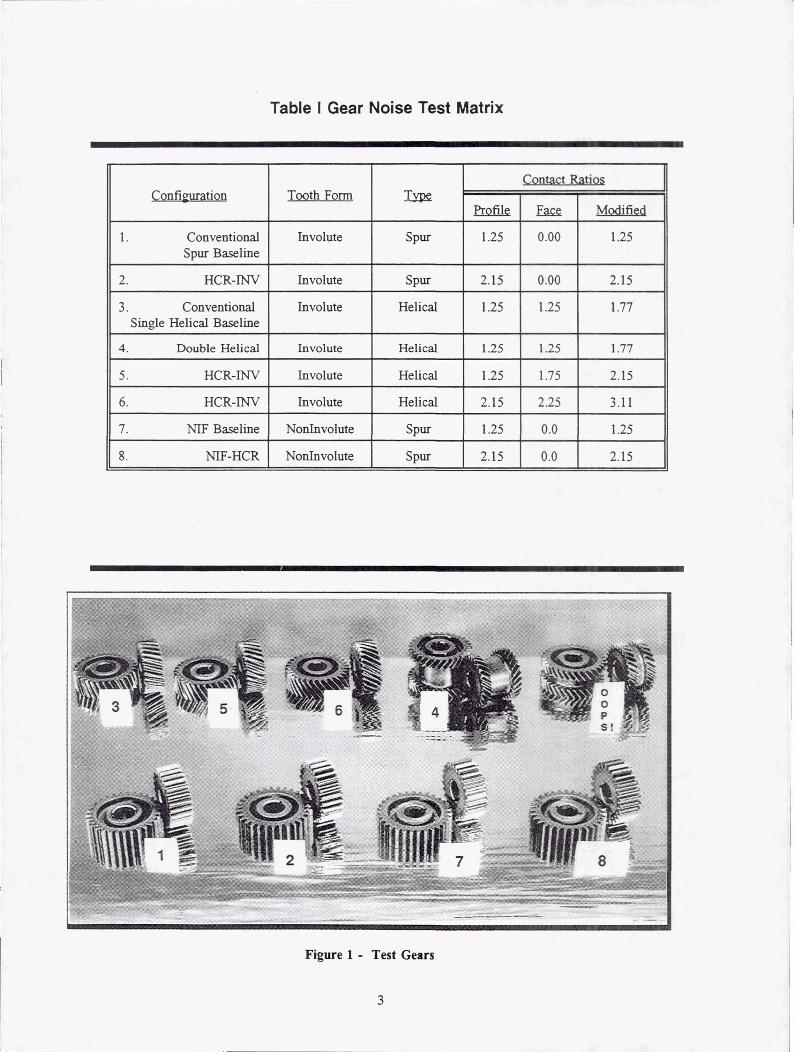
Figure 1 - Test Gears
3

Table H - Basic Test Gear Configuration
Pinion Gear
Number of Teeth 25 31
Diametral Pitch, Transverse 8.
Center Distance 3.50
Pressure Angle, Transverse 25 (Std Profile Contact Ratio)
20 (High Profile Contact Ratio)
Face Width (Spur & Single Helical) 1.25
Face Width (Double Helicals) Double Helicals 0.625 ea Helix
hp) variable speed electric motor. A poly-V belt drivewas used as a speed increaser between the motor andinput shaft. An eddy-current dynamometer loads theoutput shaft at speeds up to 6000 rpm. The rig wasbuilt to carry out fundamental studies of gear noiseand the dynamic behavior of gear systems. It isdesigned to allow testing of various configurations of.,ears, bearings, dampers and supports.
GEAR NOISE RIG
Figure 2 - NASA Gear Test Rig
To reduce unwanted reflection of noise, acousticalabsorbing foam baffles cover test cell walls, floor,and other surfaces. The material attenuates reflectedsound by 40 dI3 for frequencies of 500 Hz and above.
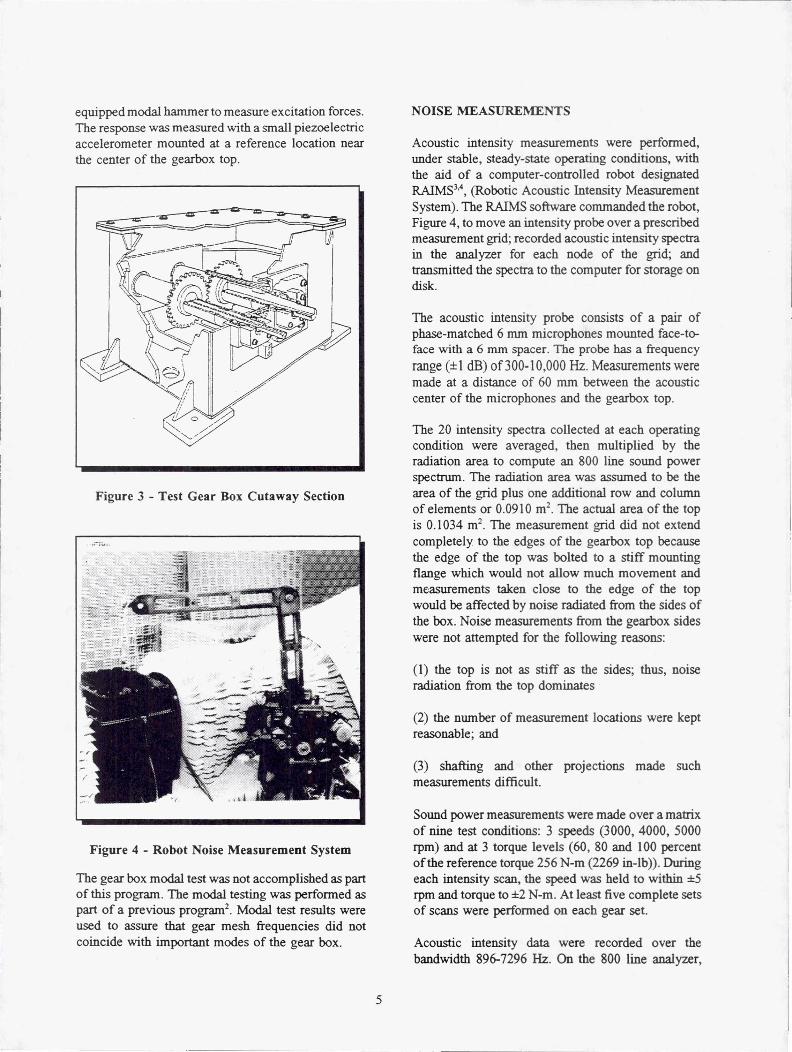
A 20 node measurement grid was drawn on the topcover of the gear box and used to insure repeatabilityof the noise measurements and to aid in avoidingoperator induced errors. The grid covers an area 228x 304 mm (9 x 12 in) centered on the 286 x 362 mm(11.25 x 14.25 in) top. A cutaway section of the testgear box is shown in Figure 3. All data was collectedusing the computer controlled robot arm coordinatedwith the reference grid so that no matter what gear setwas running, the readings were identically taken.
INSTRUMENTATION
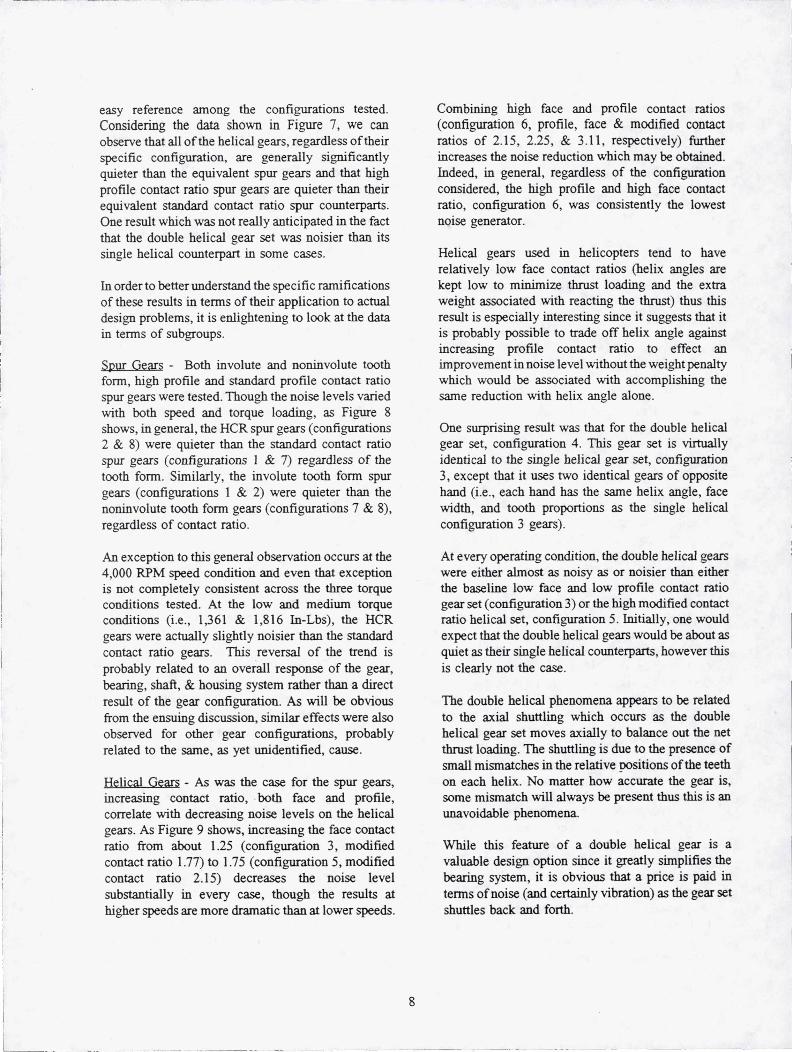
An experimental modal test was performed todetermine the modes of vibration and naturalfrequencies of the gearbox top. An 800 line, 2-channel dynamic signal analyzer collected frequency-domain data. Commercial modal software running ona personal computer was used for the analysis. Thetests were performed with the gearbox heated tooperating temperature. The structure was excitedsequentially at each of the 63 nodes using a load cell
equipped modal hammer to measure excitation forces.The response was measured with a small piezoelectricaccelerometer mounted at a reference location nearthe center of the gearbox top.
Figure 3 - Test Gear Box Cutaway Section
Figure 4 - Robot Noise Measurement System
The gear box modal test was not accomplished as partof this program. The modal testing was performed aspart of a previous program'-. Modal test results wereused to assure that gear mesh frequencies did notcoincide with important modes of the gear box.
NOISE MEASUREMENTS
Acoustic intensity measurements were performed,under stable, steady-state operating conditions, withthe aid of a computer-controlled robot designatedRAIMS',', (Robotic Acoustic Intensity MeasurementSystem). The RAIMS software commanded the robot,Figure 4, to move an intensity probe over a prescribedmeasurement grid; recorded acoustic intensity spectrain the analyzer for each node of the grid; andtransmitted the spectra to the computer for storage ondisk.
The acoustic intensity probe consists of a pair ofphase-matched 6 mm microphones mounted face-to-face with a 6 mm spacer. The probe has a frequencyrange (tl dB) of 300-10,000 Hz. Measurements weremade at a distance of 60 mm between the acousticcenter of the microphones and the gearbox top.
The 20 intensity spectra collected at each operatingcondition were averaged, then multiplied by theradiation area to compute an 800 line sound powerspectrum. The radiation area was assumed to be thearea of the grid plus one additional row and columnof elements or 0.0910 m'. The actual area of the topis 0.1034 m'. The measurement grid did not extendcompletely to the edges of the gearbox top becausethe edge of the top was bolted to a stiff mountingflange which would not allow much movement andmeasurements taken close to the edge of the topwould be affected by noise radiated from the sides ofthe box. Noise measurements from the gearbox sideswere not attempted for the following reasons:
(1) the top is not as stiff as the sides; thus, noiseradiation from the top dominates
(2) the number of measurement locations were keptreasonable; and
(3) shafting and other projections made suchmeasurements difficult.
Sound power measurements were made over a matrixof nine test conditions: 3 speeds (3000, 4000, 5000rpm) and at 3 torque levels (60, 80 and 100 percentof the reference torque 256 N-m (2269 in-lb)). Duringeach intensity scan, the speed was held to within t5rpm and torque to t2 N-m. At least five complete setsof scans were performed on each gear set.
Acoustic intensity data were recorded over thebandwidth 896-7296 Hz. On the 800 line analyzer,
5

this produced a line spacing of 8 Hz. We chose thisfrequency range because it includes the first threeharmonics of gear meshing frequency for the speedrange (3000-5000 rpm). In addition to the intensitydata, signals from two microphones and twoaccelerometers were recorded on four-channel tape.
PROCESSING SOUND POWER DATA
The sound power data as captured by the methodoutlined above consists of many data files of 800 linesound power spectra. A typical spectrum is shown inFigure 5. This trace (taken at 5000 rpm and 100percent torque) includes the first three
3-1— So— Geor g No 4/6
a^I' I^
i 1 ] ^ S 6 7
F—q—.9. kHz
Figure 5 - Baseline Spur Spectrum
harmonics of gear mesh frequency. Each harmonic issurrounded by a number of sidebands.
To characterize gear noise data, it was decided toreduce the 800 line sound power spectra to a singlenumber that would represent each gear meshharmonic. For the subject report, this is referred to asthe harmonic sound power level. Five alternativeswere considered for reporting of each harmonic level:
(1) The amplitude at gear mesh frequency only (nosidebands)
(2) The value of the largest amplitude mesh frequencyharmonic or sideband, whichever is highest
(3) The log sum of the sound intensity amplitudes ina fixed-width frequency band centered on the meshfrequency.
(4) A value similar to (3) except the size of thefrequency band varied with speed. The total numberof values added is not constant.
(5) Sum of gear mesh and fixed number of sidebands.
Alternative (5) was chosen for computing theharmonic sound power level. We used three pairs ofsidebands plus the harmonics (i.e., seven peaks) in thecalculation. Sound power levels were converted toWatts prior to calculating sums.
In the analysis of the intensity data, each harmonic ofgear mesh frequency was defined by several digitallines of the frequency analyzer. In order to capturethe total effective magnitude at each harmonic, whileaccounting for speed drift, etc, the peak value and twofrequency lines on either side of the peak weresummed. These values were converted to dB (re 10-1=W) to define a mesh harmonic level. Since sevenpeaks were used, 35 values (50) were summed toproduce the mesh harmonic sound power level. Figure6 illustrates the data (marked with the symbol "*")used to produce the harmonic sound power level. Thisis a portion of the spectrum of Figure 5 showing thefirst harmonic (at 2083 Hz). The sideband spacing(for 5000 rpm) is 83 Hz, thus there are about 10analyzer lines per sideband. At lower speeds, thereare fewer analyzer lines per sideband.
Figure 6 - Enlargement of Figure 5(Around First Harmonic)
DATA SAMPLING
In order to be assured that data measured on each
gear set could be reliably compared with data fromother gears, it was desired to have sufficient recordsto establish a 95% confidence level of tl dB. Thislevel is well beyond the practical difference (i.e., achange of about 3 dB) which most persons withnormal hearing can detect.
6

Based on these considerations, the confidence limit
TEST GEAR LOADINGis given by Equation 1:
C1 = t (8/v1—h) (1)
The loads applied to the test gears during thisprogram presented a problem in the design of theexperiment. Obviously, if the overall gear geometry iskept constant, the stress levels under identical torqueloading conditions will be different. An alternative tothe identical torque loading method would be to applyvarying torques to each configuration in order to keepthe tooth stresses the same. While this seemsreasonable, the question of which stress (not tomention Flash Temperature) should be held constant.
where:
C, = confidence limit, dB
= probability distribution ("StudentC distribution)
= standard deviation of data, dB
= number of samples (typically 5)
The values for the "t" distribution are found in anystandard statistics text. A confidence level of 95percent corresponds to a 5% probability. The numberof degrees of freedom in the "t" distribution is thenumber of samples minus 1 (typically 4).
To estimate the effect due to sample-to-samplevariation, two sets of gears for each design werefabricated and tested. Each gear was inspected indetail in accordance with typical production helicopterstandards. The overall accuracy of the gears wasfound to be consistent with what we expect ofproduction helicopter gears of similar size andconfiguration. Based on our evaluation of the geartooth inspection data, the variation between the twosets of gears is reasonably typical of normalproduction for gears in the same manufacturing lot.Lot to lot variations may be and differences betweendifferent manufacturers of the same parts certainlywill be higher but the overall trend of the effectshould be about the same.
We have also noted that a large difference in noiselevel is sometimes observed on large production gearboxes simply as a result of rebuilding them after theywere disassembled for a visual inspection, eventhough no parts were changed. Considering this effect,in addition to the manufacturing variability checks, wealso checked for variability due to disassembly andreassembly.
We accomplished this by testing three "builds" of thefirst gear set. Each build used exactly the same partsand each was accomplished by the same technicianusing the same tools, and miscellaneous parts.
After much deliberation, the authors decided to useidentical torque and speed conditions across the rangeof gear configurations. Since the overall geometry ofthe gear blanks was held constant, we believe that thisapproach is more representative of the actual noisewhich may result from a given weight or size of gear.Better load capacity, due to lower stresses, is anotherfactor but will be ignored for our purposes.
The stress levels at which these gears were run duringthis testing are reasonably representative of those atwhich 10 pitch accessory gears would be run at in atypical Boeing Helicopters transmission. Main powergears would, however, be run at considerably higherstress levels. Typically, for example, the bendingstresses in a helicopter application would be aboutdouble the maximum stress run during this testing.Both the contact stress levels and the flashtemperatures experienced in a typical helicopter mainpower transmission would be similarly higher than thetest conditions defined herein.
While it would have been desirable to run the testgears at higher stress levels (more consistent with theprofile modifications applied), limitations inherent inthe NASA test rig loading mechanism prevented thisfrom occurring. Still, since all results are comparative,the data obtained is quite meaningful and will providemuch insight into the problem. Caution should beexercised, however, when applying these results toany practical application. The results are valid in acomparative but probably not from an absolute sense.
RESULTS
A very large amount of data has been collected duringthe conduct of this test program. A rather complexoverview is presented in the bar chart shown inFigure 7. Note that the configuration numberingscheme followed in Table I is continued in Figure 7(and in other similar Figures presented herein) for
easy reference among the configurations tested.Considering the data shown in Figure 7, we canobserve that all of the helical gears, regardless of theirspecific configuration, are generally significantlyquieter than the equivalent spur gears and that highprofile contact ratio spur gears are quieter than theirequivalent standard contact ratio spur counterparts.One result which was not really anticipated in the factthat the double helical gear set was noisier than itssingle helical counterpart in some cases.
In order to better understand the specific ramificationsof these results in terms of their application to actualdesign problems, it is enlightening to look at the datain terms of subgroups.
Spur Gears - Both involute and noninvolute toothform, high profile and standard profile contact ratiospur gears were tested. Though the noise levels variedwith both speed and torque loading, as Figure 8shows, in general, the HCR spur gears (configurations2 & 8) were quieter than the standard contact ratiospur gears (configurations 1 & 7) regardless of thetooth form. Similarly, the involute tooth form spurgears (configurations 1 & 2) were quieter than thenoninvolute tooth form gears (configurations 7 & 8),regardless of contact ratio.
An exception to this general observation occurs at the4,000 RPM speed condition and even that exceptionis not completely consistent across the three torqueconditions tested. At the low and medium torqueconditions (i.e., 1,361 & 1,816 In-Lbs), the HCRgears were actually slightly noisier than the standardcontact ratio gears. This reversal of the trend isprobably related to an overall response of the gear,bearing, shaft, & housing system rather than a directresult of the gear configuration. As will be obviousfrom the ensuing discussion, similar effects were alsoobserved for other gear configurations, probablyrelated to the same, as yet unidentified, cause.
Helical Gears - As was the case for the spur gears,increasing contact ratio, both face and profile,correlate with decreasing noise levels on the helicalgears. As Figure 9 shows, increasing the face contactratio from about 1.25 (configuration 3, modifiedcontact ratio 1.77) to 1.75 (configuration 5, modifiedcontact ratio 2.15) decreases the noise levelsubstantially in every case, though the results athigher speeds are more dramatic than at lower speeds.
Combining high face and profile contact ratios(configuration 6, profile, face & modified contactratios of 2.15, 2.25, & 3.11, respectively) furtherincreases the noise reduction which may be obtained.Indeed, in general, regardless of the configurationconsidered, the high profile and high face contactratio, configuration 6, was consistently the lowestnoise generator.
Helical gears used in helicopters tend to haverelatively low face contact ratios (helix angles arekept low to minimize thrust loading and the extraweight associated with reacting the thrust) thus thisresult is especially interesting since it suggests that itis probably possible to trade off helix angle againstincreasing profile contact ratio to effect animprovement in noise level without the weight penaltywhich would be associated with accomplishing thesame reduction with helix angle alone.
One surprising result was that for the double helicalgear set, configuration 4. This gear set is virtuallyidentical to the single helical gear set, configuration3, except that it uses two identical gears of oppositehand (i.e., each hand has the same helix angle, facewidth, and tooth proportions as the single helicalconfiguration 3 gears).
At every operating condition, the double helical gearswere either almost as noisy as or noisier than eitherthe baseline low face and low profile contact ratiogear set (configuration 3) or the high modified contactratio helical set, configuration 5. Initially, one wouldexpect that the double helical gears would be about asquiet as their single helical counterparts, however thisis clearly not the case.
The double helical phenomena appears to be relatedto the axial shuttling which occurs as the doublehelical gear set moves axially to balance out the netthrust loading. The shuttling is due to the presence ofsmall mismatches in the relative vositions of the teethon each helix. No matter how accurate the gear is,some mismatch will always be present thus this is anunavoidable phenomena.
While this feature of a double helical gear is avaluable design option since it greatly simplifies thebearing system, it is obvious that a price is paid interms of noise (and certainly vibration) as the gear setshuttles back and forth.
8
Figure 7 - Summary Of Test Results
Figure 9 also shows data for a "Spread SingleHelical" gear set which is not listed in Table I. Thisconfiguration was not one of the eight planned testvariants. During the manufacture of the test gears, theinitial double helical gear drawings went out with aninadvertent drafting error such that both helices weremanufactured with the same hand. The resultant gearset (shown in the upper right comer of Figure 1) wassomewhat unusual, and probably would not be usedin a production environment, however, we decided totest it anyway.
The noise results from this rather unusual gear set(which one of the author's unceremoniously dubbedthe "OOPS" gear set), were surprising. It was actuallyquieter across the board than the double helical gearset under almost every operating condition. At first,these results were puzzling, however, after carefulevaluation of the circumstances, the explanationbecame clear.
Since the per helix face contact ratio, face width,profile contact ratio, etc. is identical for both theOOPS and the double helical gear sets, the onlyoperational difference is the lack of axial shuttling.
9
Figure 8 - Spur Gear Noise Levels
ss
8
85
80
° 75it
70
65
603W1361 312269 411816 Skl1361 SW2269
311816 411361 412269 SW1816Speed ( rpm) / Torgm fm'1D)
0 Baeelre He" 21.5 Deg O Dou01e Helkaj ® Hehca128.9 Degn Hekal 35.3 Deg :1 Spread Halca
Figure 9 - Helical Gear Noise Levels
The double helical set will be in a constantequilibrium seeking state because of the theoreticallyzero net thrust load while the OOPS gear runs in afixed axial position due to the net thrust load. Thistest thus provides some insight into the magnitude ofthe noise penalty which is paid when double ratherthan equivalent single helical gears are used. Sincethese test gears are all very accurate (accuracy typicalof helicopter gears), it should be obvious that a largerpenalty would be paid if gears of lesser quality wereto be used because the lower the gear quality is themore shuttling would be likely to occur.
If one considers the OOPS gear set to be a singlehelical gear set, then its effective face contact ratio
would also place it between the baseline helical gearset (configuration 3) and the high face contact ratiohelical gear (configuration 6). This being the case, itsnoise level is approximately where one would expectbased on the levels of gears with higher and lowerface contact ratios.
Build Variations - During other testing, the authorshave noted significant variations in the measured (andperceived) noise level of the same gear system beforeand after disassembly. In some cases, this variationwas of considerable magnitude. To investigate thisphenomena, each of the gears types was assembled,tested, disassembled, and then tested again. In onecase, for the baseline spur gears (configuration 1, thisprocess was repeated three times. Similar variations innoise levels were recorded for all gear sets. Figure 10shows the specific results for the baseline spur gears(S/N 2 & 6). The largest minimum to maximum buildvariation is about 8 dB (occurring at the highest speedcondition) while the minimum build variation is 1 dB(occurring at the medium speed condition). Except forthe low torque, highest speed condition, the averagebuild variation is about 3 dB. While no real pattern isapparent, it does appear that the variation decreasesslightly with increasing load.
Figure 10 also shows the results obtained from asecond "identical" set of spur gears , S/N 4 & 8. Itshould be obvious that the variation betweenotherwise identical S/N of the same part generallyexceeds the variation from rebuilding the same parts.
Baseline Spur Gears100
m'95
6s
e0
75
70
& 65< w
311361 3k,226940816 5W1361 W22693816 4W 1461 4krZ269 5k11816
Speed (rpm) / Torque Qn9D)
O sin: 2E6 Build 1 ® am 2d6 Build 2 n eln: 286 Buld 3n r
Figure 10 - Spur Gear Build Variations
This is not surprising, however it does point out theneed to establish noise test results over a broad rangeof repeated testing to insure that the differencesobserved are not simply due to part to part variation.
10
This latter effect can also be seen from Figure 11which shows the results for two "identical" sets of thebaseline helical gears. The variation observed isgenerally less than that observed for the spur gearsbut not markedly so.
Baseline Helical 21.5 Degree Gears100
95'5
90
85
80
$ 75E S
u )0
65is
603k/1361 3k2269 4k11816 Sk'1361 Sk'2269
30816 4k/1361 4k2269 5k/1816speed (rpm) / Torque (m9b)
M sin: 17521. Build 1 20 sin: 19824. Build 1 n Baseline Helical 21.5 Deg
Figure 11 - Helical Gear Build Variations
It is important to again emphasize several importantpoints about this data. Such variations, both betweendifferent builds of the same parts and among differentS/N of the same part, are not at all unusual, ratherthey are quite common. The build variations occurredwhen the same physical components were simplydisassembled and then reassembled under verycontrolled conditions and by a skilled technician. TheS/N to S/N variation occurred for helicopter qualityparts in which the apparent variations in the normallyaccepted measures of gear quality (e.g., lead, profile,spacing, etc.) are extremely small, probably at a levelwhere further improvements would be extremelycostly.
This points out one difficulty in defining a noisereduction effort in that the variations due to theseeffects are often of the same order of magnitudes thechanges which may be attributed to gear configurationor treatment. Such differences must at least exceedthe variations due to the build effect and thoseobserved among different S/N of the same P/N beforethey can be considered significant of themselves.
Torque Effect - The effect of torque on the noiselevel of a gear set depends on many factors. Ingeneral, as torque increases, the noise level would beexpected to increase if no other factors are at work.As described below, however, this is not the case.
This effect of torque level on gear noise will beseverely impacted by the amount of profile, and insome cases, lead modification which has been appliedto the gears. In the testing described herein, theprofile modifications were largely the same from gearset to gear set so that we were comparing differencesbetween gears and not between modifications. Nolead modifications were made to any of the test gears.In addition, the profile modifications which wereapplied were calculated for a torque substantiallyabove the upper end of the torque range under whichthese gears were actually run. Therefore, all of thegears were overmodified for the actual torqueconditions encountered. It is to be expected then thatas the load increases, more of the profile will comeinto contact as the teeth bend thus perhaps loweringthe noise level. Conversely, since our maximum testtorque was only about twice our minimum test torqueand the absolute load levels were not extremely high,it is also likely that the tooth deflections under loadwere small as well. If the latter effect dominates, thenthe noise level would tend to increase with torque.
As Figure 12 shows (for the lowest and highestspeeds only), the effect of torque on the noise level ofthe gears tested in this program is mixed. For thebaseline spur gears (shown on Figure 12 as 0° helixangle), the noise level appears to remain aboutconstant with torque. The helical gears, however,exhibit a slightly more varied behavior. At the lowspeed condition (3,000 RPM), the noise levelincreases as the torque increases while at the highspeed condition (5,000 RPM) the opposite appears tobe true. In both cases, the overall effects are notgenerally dramatic.
Sneed Effect - For all gears tested, increasing speedincreased the noise level. Figure 13 shows the generaltrend for the helical gears and the baseline spurs. It isinteresting to note that the increase in noise leveloccurs at an increasing rate as the speed increases.
That is the difference in noise level going from 4,000RPM to 5,000 RPM is generally more than twice thatwhich occurs from 3,000 RPM to 4,000 RPM. This,of course suggests a nonlinear effect of what evertooth errors are present. Before drawing this firmconclusion, however, other possibilities must beconsidered. For example, the test gear box hasexhibited a response of its own at about 5,000 RPMthus the increase in noise level at this speed may beattributable to housing and gear response.
Torque Effect On Gear NoiseS1 00
1 5000 rpm
s ^ t
6
90 s
^R 80
^ 3
s
E70
<.......... 30r40 rpm
60
1.200 1.400 1.600 1.800 2.000 2.200 2.400Torque (r>-Ib)
0 degree 0 degree 21.5 degree 21.5 degroe-n- —D- — —
28.9 degree 28.9 degree 35.3 degree 35.3 degree
Figure 12 - Torque Effect On Gear Noise
RPM & Torque Effect100
s33 90
890
sgECg 70
1
2.000 3.000 4,000 5.000 6,000Speed (rpm)
D ppG2100,r hs a.oO TJ60 m.a. B3op CT1ec n4a 35 3010 07259v
-E7 4-0 d" a 1 561 +.e. 21.5 a•a a 1361 -. 28 P a.o @ 1361 ...e. 35 3 0" ® 1301 —4.
n
1361 (in-lb) Torque
E
23
100
90
g80
70El
600 1 2 3
Face Contact Ratio
A 3000 rpm Q 4000 rpm ea 5000 rpmr1 .^
Figure 14 - Face Contact Ratio EffectLow Torque
ratios ranging from 1.25 to 3.11. In all cases tested,as the contact ratio increased, the noise leveldecreased. As Figures 14 and 15 show, the noisereduction appears to be almost a linear function of theface contact ratio, regardless of the applied loading.Similar effects can be seen if the noise level is plottedas a function of either total, Figure 16, or modified,Figure 17, contact ratios. These latter Figures do notshow quite the linearity that Figures 14 and 15 do,however.
Figure 13 - Combined Speed & Torque Effects
Face Contact Ratio Effect - While noise variationswhich can be attributed to speed and load arecertainly of interest, these factors are seldom geardesign parameters over which the design engineer hassubstantial control. Contact ratio, which is a functionof the basic tooth design-on the other hand, is a welldefined parameter over which the gear designengineer has a great deal of control, once theprerequisite stress requirements are met, of course.
Essentially four different helix angles were tested (0,21.5, 28.9, & 35.3 degrees). These configurationsproduced gears with face contact ratios ranging from0.0 to 2.25 and modified contact
2269 (in-lb) Torque
m 100
mJ
m 90aa°
rn 80m
70
cz
U
a' 600 1 2 3
Face Contact Ratio
Q 3000 rpm Q 4000 rpm Q 5000 rpmQ n 01
Figure 15 - Face Contact Ratio EffectHigh Torque
12

1361 (in-lb) Torque
m 100
mJ ^
903
U0 80mNon I
70Umo, -m`m
a' 601 2 3 4 5
Total Contact Ratio
@ 3000 rpm @ 4000 rpm @ 5000 rpm
Figure 16 - Total Contact Ratio Effect
Of all of the effects investigated, it appears that thecontact ratio is the most significant, if all other effectsare held reasonably constant. This is important in adesign for minimum noise situation since the contactratio is one of the parameters which the gear designercan control without drastically effecting the overallconfiguration of the gear system. That is, byjudiciously selecting the tooth proportions, helixangle, and face width, it is often possible to optimizethe contact ratio to yield a minimum noise design.
Tooth Form - In general, the non-involute tooth form,whether standard (configuration 7) or high profilecontact ratio (configuration 8), resulted inslightly higher noise levels at virtually all speed andload conditions tested than the equivalent involute(configurations 1 & 2, respectively). The differences,as Figure 18 shows, in some cases were about thesame order of magnitude as that due to the buildeffect described earlier. This being the case, it is hardto ascribe a specific figure to the difference in noiselevel other than to note the trend.
100
m95
Zm-' 90
85
so
m
75
Ev 70
m 65
a'60
3k/1361 3kl2269 UJ1816 5k/1361 5k/2269
30816 4k/1361 4/2269 5k/1816
Speed (rpm) 1 Torque (in'Ib)
q Baseline Spur q HCR Spur C NIF Spur q NIF HCR Sour
Figure 18 - Tooth Form Effect
1361 (in-Ibs) Torque
E 1000
m _J_90
80 \
So 70U
601 2 3 4
Modified Contact Ratlo
Q 3000 rpm Q 4000 rpm Q 5000 rpm
Figure 17 - Modified Contact Ratio Effect
While the difference between standard and highprofile contact ratio spur gears is not really a toothform variation in the strictest sense of the concept, itis often referred to as such. Based on the testingconducted herein, the high profile contact ratio gearsets (configurations 2 & 8) resulted in lower noiselevels than their standard contact ratio counterparts(configurations 1 & 7, respectively). This effect wasespecially pronounced at the lower speed end of thetest range and there were some exceptions, especiallyat the 4,000 RPM condition. Still, since high profilecontact ratio does not cause any additional loading onthe system (as would a helical gear), it is a viable,and possibly preferable option in many cases. Asimilar difference was also noted in another gear testprogram conducted at Boeing Helicopters but was notpart of this evaluation.
13
3000 RPM Relative To Baseline Spur'a 15
10 Increase
J5
3a° 0^ e
(5)o
g? (10)
c (15)
(20) Reductiona (25)
1361 1861 2269Torque (in`Ib)
n HCR Spur 0 BaseHellcal 21.5 deg IB Double Helical n Helical 28.9 dega Heir 135.3 deg 0 NIF Spur n NIF HCR Spur 0 Spread Single Helical
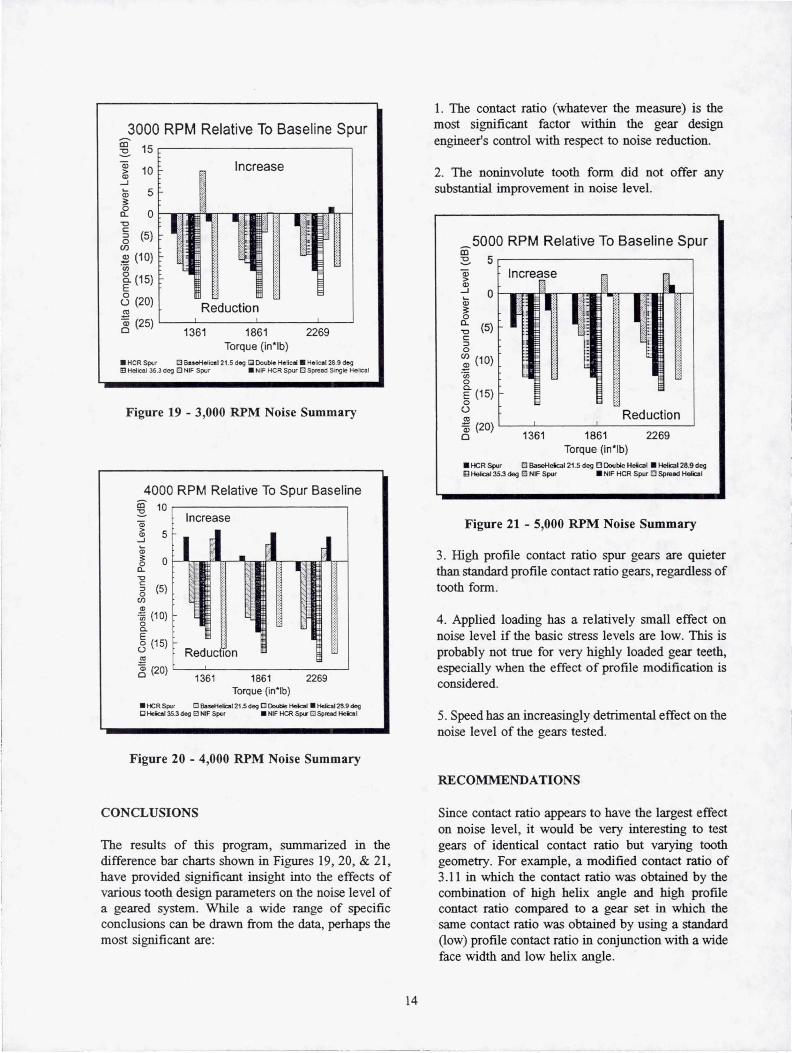
Figure 19 - 3,000 RPM Noise Summary
4000 RPM Relative To Spur Baseline10
m Increase' SJ
0 0 Eac (5)
0mo (10)C.
0 (15)Reduction
o (20) r1361 1661 2269
Torque (inlb)n HCR Spur 011.-H lial 215 deg 0 Double Helical n HNical 28.9 degC] Hebml 35.3 deg 0 NIF S W r n NIF HCR Spur (3 Spread Helical
Figure 20 - 4,000 RPM Noise Summary
CONCLUSIONS
The results of this program, summarized in thedifference bar charts shown in Figures 19, 20, & 21,have provided significant insight into the effects ofvarious tooth design parameters on the noise level ofa geared system. While a wide range of specificconclusions can be drawn from the data, perhaps themost significant are:
1. The contact ratio (whatever the measure) is themost significant factor within the gear designengineer's control with respect to noise reduction.
2. The noninvolute tooth form did not offer anysubstantial improvement in noise level.
5000 RPM Relative To Baseline Spurm
5Increase
J 0
o i >I
(5)
^ m io _
(10)0 i
Cn (15)0
Reductiono
(20)
1361 1861 2269
Torque (in'Ib)n HCR Spur D B—Helical 21.5 deg D Double Helical n Helical 28.9 degB Nebel 353 deg 0 NIF Spur n NIF HCR Spur D Spread Helical
Figure 21 - 5,000 RPM Noise Summary
3. High profile contact ratio spur gears are quieterthan standard profile contact ratio gears, regardless oftooth form.
4. Applied loading has a relatively small effect onnoise level if the basic stress levels are low. This isprobably not true for very highly loaded gear teeth,especially when the effect of profile modification isconsidered.
5. Speed has an increasingly detrimental effect on thenoise level of the gears tested.
RECOMMENDATIONS
Since contact ratio appears to have the largest effecton noise level, it would be very interesting to testgears of identical contact ratio but varying toothgeometry. For example, a modified contact ratio of3.11 in which the contact ratio was obtained by thecombination of high helix angle and high profilecontact ratio compared to a gear set in which thesame contact ratio was obtained by using a standard(low) profile contact ratio in conjunction with a wideface width and low helix angle.
14
ACKNOWLEDGEMENT
Support of this work by the U. S. Army and theNational Aeronautics and Space Administration,Lewis Research Center, under contract NAS3-25421is gratefully acknowledged.
REFERENCES
1. Townsend, Dennis P., Baber, Berl B., and Nagy, Andrew: "Evaluation of High-Contact-Ratio Spur Gears WithProfile Modification," NASA TP-1458, Sep 1979
2. Oswald. Fred B., Zakrajsek, James J., Atherton, William, and Lin Hsiang Hsi, "Effect of Operating Conditionson Gearbox Noise," Sixth International Power Transmission and Gearing Conference, American Society ofMechanical Engineers, Phoenix, AZ, Sep 13-16, 1992 (NASA TM-105331)
3. Atherton, William J., Pintz, Adam, and Lewicki, David G., 1987, "Automated Acoustic Intensity Measurementsand the Effect of Gear Tooth Profile on Noise", Mechanical Signature Analysis--Machinery Vibration, Flow-InducedVibration, and Acoustic Noise Analysis, S. Braun, et al., eds., ASME, pp. 109-113 (also NASA TM-100155).
4. Flanagan, P. M., and Atherton, W. J., 1985, "Investigation on Experimental Techniques to Detect, Locate andQuantify Gear Noise in Helicopter Transmissions", NASA CR-3847.
15
Form ApprovedREPORT DOCUMENTATION PAGE OMB No. 0704-0188
Public reporting burden for this collection of information is estimated to average 1 hour per response, including the time for reviewing instructions, searching existing data sources,gathering and maintaining the data needed, and completing and reviewing the collection of information. Send comments regarding this burden estimate or any other aspect of thiscollection of information, including suggestions for reducing this burden, to Washington Headquarters Services, Directorate for Information Operations and Reports, 1215 JeffersonDavis Highway, Suite 1204, Arlington, VA 22202-4302, and to the Office of Management and Budget, Paperwork Reduction Project (0704-0188), Washington, DC 20503.
1. AGENCY USE ONLY (Leave blank) 2. REPORT DATE 3. REPORT TYPE AND DATES COVEREDDecember 1993 Technical Memorandum
4. TITLE AND SUBTITLE 5. FUNDING NUMBERS
Gear Sound Levels With Various Tooth Contact Ratios and FormsWU-505-62-101 L 162211 A47A
6. AUTHOR(S)
Joseph W. Lenski, Jr., Robert H. Spencer, Raymond J. Drago,
Mark J. Valco, and Fred B. Oswald
7. PERFORMING ORGANIZATION NAME(S) AND ADDRESS(ES) 8. PERFORMING ORGANIZATIONNASA Lewis Research Center REPORT NUMBERCleveland, Ohio 44135-3191andVehicle Propulsion Directorate E-8274
U.S. Army Research LaboratoryCleveland, Ohio 44135-3191
9. SPONSORING/MONITORING AGENCY NAME(S) AND ADDRESS(ES) 10. SPONSORINGIMONITORINGAGENCY REPORT NUMBER
National Aeronautics and Space AdministrationWashington, D.C. 20546-0001 NASA TM-106432and ARL—MR-122U.S. Army Research LaboratoryAdelphi, Maryland 207 83-1 145
11. SUPPLEMENTARY NOTESPrepared for the Rotary Wing Propulsion Specialists Meeting sponsored by the American Helicopter Society, Williamsburg, Virginia, October 25-28, 1993.Material in this paper was extracted from a paper presented at the American Gear Manufacturer's Association Fall Technical Meeting, October 14-15, 1993,Detroit, Michigan. Joseph W. Lenski, Robert H. Spencer, and Raymond J. Drago, Boeing Helicopters, Philadelphia, Pennsylvania 19142; Mark Valco, VehiclePropulsion Directorate, U.S. Army Research Laboratory, Lewis Research Center, Cleveland. Ohio 44135; and Fred B. Oswald. NASA Lewis Research Center.Responsible person, Fred B. Oswald, (216) 433-3957.
12a. DISTRIBUTION/AVAILABILITY STATEMENT 12b. DISTRIBUTION CODE
Unclassified - UnlimitedSubject Category 37
13. ABSTRACT (Maximum 200 words)
The real noise reduction benefits which may be obtained through the use of one gear tooth form as compared to another
is an important design parameter for any geared system, especially for helicopters in which both weight and reliabilityare very important factors. This paper describes the design and testing of nine sets of gears which are as identical aspossible except for their basic tooth geometry. Noise measurements were made at various combinations of load and
speed for each gear set so that direct comparisons could be made. The resultant data was analyzed so that valid conclu-
sions could be drawn and interpreted for design use.
14. SUBJECT TERMS 15. NUMBER OF PAGES
Gear noise; Acoustic intensity; Spur gears; Helical gears; Tooth form; Contact ratio 1716. PRICE CODE
A03
17. SECURITY CLASSIFICATION 18. SECURITY CLASSIFICATION 19. SECURITY CLASSIFICATION 20. LIMITATION OF ABSTRACTOF REPORT OF THIS PAGE OF ABSTRACT
Unclassified Unclassified Unclassified
NSN 7540-01-280-5500 Standard Form 298 (Rev. 2-89)Prescribed by ANSI Std. Z39-18298-102

Nat
iona
l A
eron
auti
cs a
ndS
pace
Adm
inis
trat
ion
Lew
is R
esea
rch
Cen
ter
Cle
vela
nd, O
H 4
4135
-319
1
Offi
cial
Bus
ines
sP
enal
ty fo
r P
rivat
e U
se $
300