nasa instrument incubator program (iip) multi-band ... estf2019.pdfnasa instrument incubator program...
TRANSCRIPT

11 June 2019
NASA Instrument Incubator Program (IIP)
Multi-Band Uncooled Radiometer Instrument (MURI)
Pre-Flight Test Presentation
NASA ESTO IIP PI: Phil Ely, Leonardo DRS
Co I: Ray Wagoner, Leonardo DRS
Science Team Co I: John Kerekes, Rochester Institute of Technology (RIT)
NASA Grant # 80NSSC18K0114

2
MURI Sensor Concept
• DRS will use a Piezo Stage to Backscan a 6-
Band Multispectral Uncooled Radiometer
Imager (MURI) to achieve NETD and RER
performance consistent with LANDSAT
• Absolute Radiometric Precision of <2% (260K
to 330K Scene Temp) will be achieved by
controlling FPA & Lens Temp and then
monitoring the Lens and Camera Housing
Temp and correcting the radiometry using
DRS patented TCOMP algorithms
• Two Flight Data Collects Planned as
LANDSAT 8 Under-flights:
1. The first (8/26 to 9/6) will assess initial
data quality and calibration with known
targets deployed (Landsat Truth data) in
Southern California
2. The second (9/27 to 10/8) will
demonstrate scientific products
available over vegetative and urban
environments in Northern California
Band Center
Wavelength
(um)
Spectral
Bandwidth
(um)
Application
1 7.65 0.111 Methane Monitoring
2 8.55 0.370 SO2, cloud/volcanic ash properties
3 8.94 0.371 Minerals, SO2
410.07 0.491
Surface temperature, vegetation,
minerals
5 10.88 0.634 LANDSAT 8 TIRS 1
6 11.94 1.005 LANDSAT 8 TIRS 2
MURI Airborne Concept
6 Spectral Bands as Built
TRL at Start of Program = 3
TRL Now = 4
TRL at Completion of Year 3 of Program = 6

3
UFPA Package Ge Window and Six MURI
Spectral Filters Transmission
Using Narrow Spectral Bands
Increases NEDT Compared to
Broadband NEDT – Get
Sensitivity Back with Frame
Stacking

4
3 Major Challenges Being Addressed on DRS’ IIP MURI Program Using
Microbolometers for Earth Imaging from Low Earth Orbit
Issue #1: Long time constant of microbolometers make them susceptible to image smear
when imaging from LEO satellites travelling @ ~7km/sec or aircraft flying at 142 Knots
Solution: Implement piezo backscan of FPA to precisely match the image velocity on the FPA
and hence stabilize image (i.e. eliminate image smear)
Issue #2: NETD of bolometers are degraded when used with the narrow spectral band filters
Solution: Maintain use of f/1 optics, fabricate bolometers with an even longer time constant
(~20msec) to get a 40% improvement in NETD and then frame stack 14 frames to improve
NETD further
Issue #3: Bolometer FPAs are sensitive to temperature of their surrounding environment
(lens temp, camera housing temp, etc.) making achieving a radiometric accuracy of < 2%
challenging.
Solution: Stabilize and control the lens and focal plane assembly temperatures, and utilize
DRS’ proprietary TCOMP algorithms to correct the FPA Output data for FPA and Lens
Temperature Changes in real time.
MURI Instrument Challenges Using Bolometers

5
MURI Assembly Overview
Uncooled FPAs
FPAs mounted on CMLB
Piezo Stage
CMLB mounted on
Piezo Stage
Heat Exchanger for precise
thermal control of FPAs
120mm f/1 Optic
Integrated Instrument with Water
Cooling in holding fixture
Filters Mounted
On FPAs/Piezo
Stage
MURI Instrument has been Fully Integrated is
in Calibration and Pre-Flight Checkout
System Controller Module

6
MURI Instrument Assembled and in Test
MURI Instrument Imaging
in a Lab Environment
MURI 4 FPA/Piezo Stage Assembly Prior
To Butcher Block Filter Attachment
Piezo Stage Assembly with Radiation
Shield and Butcher Block Filters

7
Pie
zo
Sta
ge P
osit
ion
Final Piezo
Stage
Position
Time to
Allow Piezo to Reach
Constant Velocity
Snap 1 = 3 Stacked Frames
Frames 1, 2 & 3
Period of Constant
Velocity Where Image
is stabilized and
Frames can be stacked
Together with no smear
Time for Piezo
to Return to
Starting Position
For next Snap
Snap 1
Snap 2
Snap 3
Direction
Of Travel
Time
Overlap
between
Snaps
Snap 2 = 3 Stacked Frames
Frames 4, 5 & 6
Starting
Piezo
Stage
Position
Example of Piezo Stage Movement
DRS Patent Pending for
Piezo Stabilization
Piezo Stage Assembly
(Arrow Showing Direction of Motion)
3 Stacked Frames Shown for this Illustration
14 Frames Stacked in Actual MURI Instrument

8
Example of Piezo Stage Image Stabilization
Aircraft/Sensor MotionOver the Ground
Piezo Stage Not Being Moved – Image Smear Occurs
MoveablePiezo Stage
Staring Focal PlaneMounted toPiezo Stage
Lens
Object on Ground
Being Imaged
Image on Focal Plane – Frame 1
Image on Focal Plane – Frame 2
Image on Focal Plane – Frame 3Showing 3 successive frames:
Image moving on the Staring
Focal Plane due to Aircraft Velocity
Over the ground would Cause Smear
over multiple frames
Piezo Stage Static
Aircraft/Sensor MotionOver the Ground
Piezo Stage Being Movedat Constant Velocity to match Aircraft motion- NoImage Smear
MoveablePiezo Stage
Staring Focal PlaneMounted toPiezo Stage
Lens
Object on Ground
Being Imaged
Image on Focal Plane – Frame 1
Image on Focal Plane – Frame 2
Image on Focal Plane – Frame 3
Piezo Stage Moving
Showing 3 successive frames
with the Piezo Stage
Moving at the same Relative
Velocity as the aircraft:
the image is stabilized on the
Staring Focal Plane and no
image smearing occurs, image
frames can be added together to
improve signal to noise ratio
For illustration Purposes. Without Piezo Stage, Image would
Move ~4pixels per Frame in Airborne Instrument

9
Backscan Test Setup Shows Image
Stabilization with Piezo Stage
Backscan AVI (click play)
Rotary Stage
Collimator with
slanted edge targetMURI

10
0
0.2
0.4
0.6
0.8
1
1.2
RER
Distance from Edge in Pixels
RER Static vs Backscan and No Backscan at 280kts GS
280 kts (Backscan) = 0.52953
280 kts (No Backscan) =
0.34141
Static(x1) = 0.52759
RER ComparisonStatic vs. Backscan = 0.37 %Static vs. No Backscan = 35.3 %
400 500 600 700 800 900 1000 1100 1200 1300 1400 1500 1600 1700 18000
100
200
300
400
500
600
700
800
900
1000
1100
1200
Time ms
Positio
n um
Backscan Zoom
Period = 643.5 (ms) slope= 2.0489 (um/ms)
Reset Time = 160msec Data Collect Time = 465msec
(12+1 setup frame)
Rotary Stage moves in yaw
(CCW) to simulate aircraft forward
velocity
Control Loop measures yaw
velocity and commands backscan
of piezo at appropriate velocity to
de-smear image
2deg FOV Collimator
projecting a slanted edge
for measuring RER
Lab Demo Shows Piezo Backscan Works
DRS Patent Pending for
Piezo Stabilization

11
Demo Concept & System Architecture
The collection sequence consists of:• Twin Otter aircraft will fly at 15000ft and
120-150kts; Landsat 8 Under-flight
• Collection during piezo-backscan
• Piezo returns to nadir position
• Aircraft motion carries nadir pointing LOS to
next image position (with some overlap)
• This gives us a maximum of 6 colors in two
ground swaths with existing packaging
MURI Aircraft Demo For Earth Science Applications
Demonstration Data Collection In 6 LWIR Wavebands
MURI
Detector
layout
6 bands in One Swath shown for this illustration
MURI Sensor has 0.65m GSD @ 15,000 ft Altitude
IFOV is Equivalent to 100m GSD at 705Km Landsat Orbit
6
Demo Concept & System Architecture
The collection sequence consists of:• Twin Otter aircraft typically flies at 15000ft
and 120-150kts
• Collection during piezo-backscan
• Piezo returns to nadir position
• Aircraft motion carries nadir pointing LOS to
next image position (with some overlap)
• This gives us a maximum of 6 colors in two
ground swaths with existing packaging
MURI Aircraft Demo For Earth Science Applications
Demonstration Data Collection In 6 LWIR Wavebands
MURI
Detector
layout
6 spectral Bands Sample Same Ground Swath
MURI Sensor has 0.65m GSD @ 15,000 ft AltitudeIFOV is Equivalent to 100m GSD at 705Km Landsat Orbit
T= 0 T= 655msec T= 1310msec T= 1865msec

12
Scene Imaging from DRS Rooftop
in Cypress, CA
ENEN
Visible Panorama
MURI Panorama
LWIR Panorama Using MURI (prior to Butcher Block Filter Installation)
Panoramic Image Covered 120

13
Display of Panorama Image Still (click play)
Scan of Panorama Taken in Cypress, CA
Panoramic Image Covered 120
14
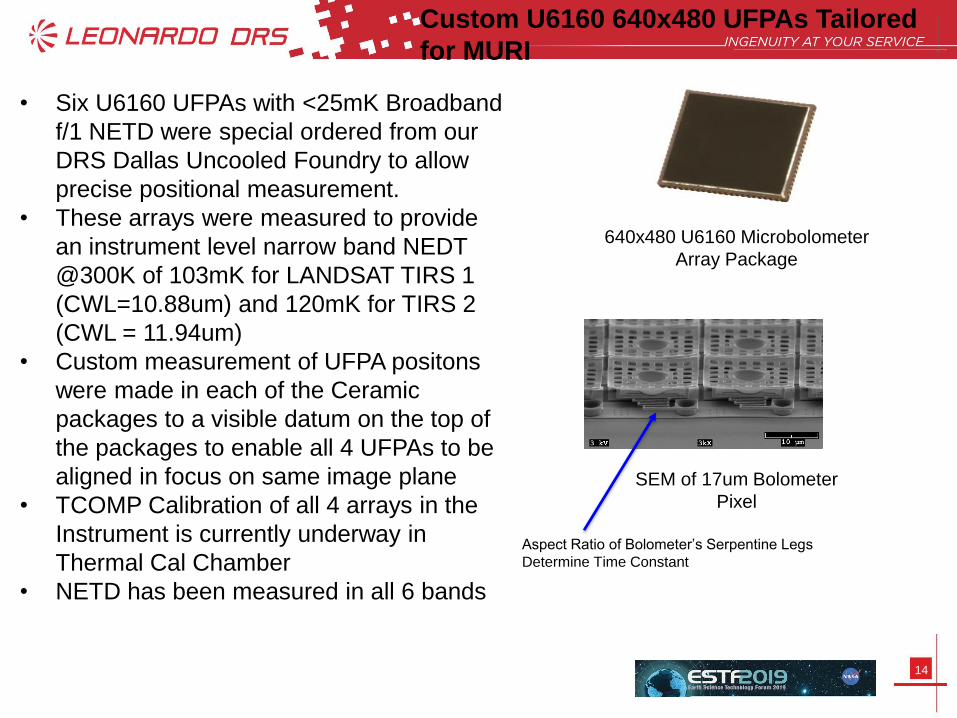
Custom U6160 640x480 UFPAs Tailored
for MURI
• Six U6160 UFPAs with <25mK Broadband
f/1 NETD were special ordered from our
DRS Dallas Uncooled Foundry to allow
precise positional measurement.
• These arrays were measured to provide
an instrument level narrow band NEDT
@300K of 103mK for LANDSAT TIRS 1
(CWL=10.88um) and 120mK for TIRS 2
(CWL = 11.94um)
• Custom measurement of UFPA positons
were made in each of the Ceramic
packages to a visible datum on the top of
the packages to enable all 4 UFPAs to be
aligned in focus on same image plane
• TCOMP Calibration of all 4 arrays in the
Instrument is currently underway in
Thermal Cal Chamber
• NETD has been measured in all 6 bands
640x480 U6160 Microbolometer
Array Package
SEM of 17um Bolometer
Pixel
Aspect Ratio of Bolometer’s Serpentine Legs
Determine Time Constant

15
NEDT @300K of 14 Stacked Frames Measured for each Band for all 4 arrays
80 Rows used for Each Band to compute NEDT -
ROI identified by purple box
NEDT @300K of 14 Stacked Frames
for Both Image Swaths
W1 NEDT Grayscale
W5 NEDT Grayscale W7 NEDT Grayscale
W3 NEDT Grayscale
Forward
Flight
Band 5
(10.88um)
103mK
754mK
146mK
Band 1
(7.65um)
Band 3
(8.94um)
126mK
159mK
120mK
Band 4
(10.07um)
Band 2
(8.55um)
Band 6
(11.94um)
103mK
775mK
148mK
Band 5
(10.88um)
Band 1
(7.65um)
Band 3
(8.94um)
126mK
165mK
123mK
Band 4
(10.07um)
Band 2
(8.55um)
Band 6
(11.94um)

16
MURI Instrument NEDT @300K Summary
Landsat TIRS1 and TIRS2 Bands for Both Image
Swaths Highlighted Above, Spec is <400mK
• Collected 450 frames at Blackbody Temperatures of 300K and 305K for each array
• Processed NEDT for Unstacked Frames and 14 Stacked Frames
Note: ~40% Better NEDT than Shown here can be Achieved with DRS’
15mK “High Sensitivity” Bolometers
FPA3 (W5) FPA4 (W7)
BandCenter WL
(um)Unstacked NEDT (mK)
14-Frame Stacked
NEDT (mK)
Unstacked NEDT (mK)
14-Frame Stacked
NEDT (mK)4 10.07 315.85 125.51 319.56 125.762 8.55 398.61 158.87 408.86 164.86
6 11.94 295.75 119.62 300.35 123.14
FPA 1 (W1) FPA2 (W3)
BandCenter WL
(um)Unstacked NEDT (mK)
14-Frame Stacked
NEDT (mK)
Unstacked NEDT (mK)
14-Frame Stacked
NEDT (mK)5 10.88 258.05 103.10 257.35 103.19
1 7.65 1715.74 753.59 1908.49 775.343 8.94 365.12 145.89 368.58 147.85

17
Water ChillerHeater Control
CMLB Bottom Side
Thermal strap
heaters (2)
UFPA temp control
sensors (4)
Thermal strap
temp monitors (2)
Forward Lens Heat
Sink Aft Lens Heat
Sink
Piezo Mount Heat
Sink w/ temp monitor
(1)Lens temp
monitors (5)
Radiation
shield temp
monitor (1)
Thermal Control and Monitoring
Thermal Control and Monitoring is Critical to Achieve Desired Radiometric Accuracy.
DRS will also Employ TCOMP Algorithms for the Necessary Radiometric Precision.
In Lab Environment FPA has be shown to controlled to
+/-20mK and the lens to +/-200mK
Example of TCOMP Correction
BB Temps - C
Ambient
Temp- C -5.00 0.00 5.00 10.00 15.00 20.00 25.00 30.00 35.00
5.00 -5.14 -0.06 4.75 9.70 14.73 19.84 24.84 29.95 34.97
10.00 -5.12 -0.12 4.71 9.68 14.63 19.81 24.80 29.87 34.89
15.00 -4.98 0.08 4.78 9.71 14.79 19.84 24.97 30.01 35.03
20.00 -5.03 -0.10 4.78 9.68 14.69 19.80 24.83 29.91 34.90
25.00 -5.11 -0.01 4.78 9.69 14.73 19.76 24.84 29.89 34.96

18
MURI IIP Program Status Summary
• MURI Radiometer has been Fully Integrated and imaged prior to Filter
Installation
• Butcher Block Filters have been installed over each of the 4 UFPAs
• MURI Instrument is Undergoing TCOMP Calibration to Provide an onboard real
time radiometric correction for all 4 UFPAs to account for Instrument
temperature changes that normally lead to radiometric error.
• NETD has been measured in all 6 Spectral Bands for both Image Swaths
• Prior to Flight Piezo Scan rate will be Optimized in the Lab Environment and
RER with Filters will be measured
• Have Made Arrangements for two Twin Otter Flight Tests Currently Scheduled
for Late August and Late September 2019
• On Track for Successful Demonstrations of MURI Instrument for Earth Science
Applications in 2019
DRS Thanks NASA ESTO for the Opportunity to Build and Demonstrate a Prototype
Uncooled Multi Band Radiometer Imager for Future Earth Imaging Applications