nasa grant ngr-11-002-166 (nasa-cr-138188) … · of tall smokestacks for so2 control are...
TRANSCRIPT

FINAL REPORT
NASA Grant NGR-11-002-166
(NASA-CR-138188) COMPARATIVE EVALUATION N74-22603OF SOLAR, FISSION, FUSION, AND FOSSILENERGY RESOURCES. PART 4: ENERGY FROMFOSSIL FUELS Final Report (Georgia Unclas'Inst. of Tech.) - G3/34 37627
COMPARATIVE EVALUATION OF SOLAR, FISSION,FUSION, AND FOSSIL ENERGY RESOURCES
PART IV
ENERGY FROM FOSSIL FUELS
J. R. Williams
Reproduced by
NATIONAL TECHNICALINFORMATION SERVICE
US Department of CommerceSpringfield, VA. 22151
Prepared for the
,QNional Aeronautics and Space AdministrationLewis Research CenterCleveland, Ohio 44135
by the
Schools of Mechanical and Nuclear EngineeringGeorgia Institute of Technology
Atlanta, Georgia 30332
https://ntrs.nasa.gov/search.jsp?R=19740014490 2018-05-30T18:42:48+00:00Z

TABLE OF CONTENT
page
FOSSIL FUELS: SUPPLY AND DEMAND .................................. 1
FOSSIL FIRED POWER PLANTS ....................................... 9
Characteristics of New Plants ............................... 9
Technology................................................. 11
Costs ........................................... ........... 18
GAS TURBINES .................................................... 22
Regenerative Gas Turbines ................................ .. 23
Combined Cycles ............................................ .. 26
COAL GASIFICATION ............................................... 32
The Lurgi Process ........................................ .. 35
HYGAS ...................................................... 38
CO2 Acceptor Process ...................... ................. 40
BI-GAS ........................... *........................... 41
ATGAS . ........... ................................. 43
Self-Agglomerating Gasification Process .................... 45
Koppers-Totzek Process ..................................... 45
The Slurry Methanation Process .............................. 47
Electrofluid Coal Processing ............................... 48
NEW TECHNOLOGIES ................................................ 51
Fluid-Bed Boilers .......................................... 51
MHD ........ .............................................. 53

page
AIR POLLUTION ..................................................... 55
Health Effects ............................................... 55
Costs ........................................................ 69
Control .................................................... .. 71
REFERENCES .......................................... 76

This document is Part IV of a 5-part report entitled Comparative
Evaluation of Solar, Fission, Fusion and Fossil Energy Resources, prepared
under NASA Grant NGR-11-002-166 from the Lewis Research Center. George
Kaplan is Technical Officer for this project.

FOSSIL FUELS: SUPPLY AND DEMAND
Each year the average person consumes about 4.4 million BTU's (MBTU) of
energy in the food he eats, which is the amount of energy contained in about
340 pounds of coal. This is the minimum amount of energy required to survive.
Energy consumption today in some underdeveloped nations is not much greater than
this value. However, in the United States today per capita energy consumption
is about 390 MBTU's,equivalent to 15 tons of coal per person, a 90 fold increase
over the energy consumption of primative man. As shown in figure 1, coal accounts
HYDRO+u
CHEMICAL
GAS
COMMERCIALRESIDENTIAL
OIL
SPACEOL HEATING
STEAMAND
PROCESSHEAT
GAS
TRANSPOR-TATION
ELECTRICITY
COAL
ENERGY CONSUMPTION INPUT END USERESOURCES
Figure 1. Comparison of Coal, Oil, Gas and U2 3 5 Resources and Uses I

2
for about 80% of the fossil fuel energy resources of the United States, gas
about 10% and oil about 10%. However, gas and oil are being used much faster
than coal. About 36% of these fossil fuels are used each year to generate elec-
tric power, which accounts for only 12% of our energy use, because of the energy
lost as waste heat when fossil fuels are burned to produce electricity. Between
1900 and 1950, coal accounted for 65% of the fossil fuels used to generate electric
power at central station plants. In 1971 this declined to 54%, and declined
further with the enforcement of air pollution emission regulations prohibiting
the combustion of high sulphur coal without expensive flue gas scrubbing equip-
ment. However, the Arab oil embargo in 1973 and subsequent relaxation of air
quality standards has caused this trend to reverse. States which permit the use
of tall smokestacks for SO2 control are continuing to rely heavily on high sulphur
coal (up to 3% sulphur) for electric power generation2 , rather than use gas or
fuel oil which are now much more expensivethan coal.
Figure 2 illustrates the total world petroleum resources given in equivalent
Middle90 East
USSR &
80 81. 1 ChinaAnnual, Total
--/ World Energy70 - Consumption (1970) 67.6
c 60
U. S.
- 5045.5
Ac LatinU 40 rica America
S . 33. 8 Far Eastu 30 30.4E 0o1 27.0 /
" 20 Canada
10 Europe
2. 7
Figure 2. Total World Oil Resources 3

3
metric tons of coal. Figure 3 gives the total world coal reserves. The total
world reserves of oil.is equivalent to 300 billion metric tons of coal, only
about 4% of the total world reserves of coal which is given as 7637 billion
metric tons. Figures for mainland China are very rough at present.
70USSR
4,310 x 109
60
300 x 109 Total World Petroleum
F Resources (4% of CoalResources)
50
40
30 U.S.
1,486 x 10
20 No. AmericaAsia less U.S. Western
68 109 601 Europe
601 x 10 South and 9Central 377 x 10
10 Africa Oceania America 10
109 x 10 59x 10 14 x 109
Figure 3. Total World Coal Resources3
The basis for the long term energy problem of the United States is illus-
trated by Table 1, which compares the United States annual consumption in 1970
with the proved recoverable fossil fuel reserves at that time4 . Obviously, even
at the 1970 rate of consumption, if the United States relied on domestic resources
alone, the natural gas would be gone in 12 years and domestic oil would disappear
in 7 years. However, these figures do not tell the whole story. The cost of

TABLE 1. Proved Recoverable Fossil Fuel Reservesand Annual Consumption - 1970
Proved U. S. AnnualReserves Consumption
Coal, U.S. (billion tons) 265 0.6Gas, U.S. (trillion cu ft) 265 22.2Oil (billion bbl)
U.S. 37 5.5Balance of free world 474 -Communist bloc 100
extracting any of those resources increases as the resource becomes depleted,
since the lowest cost deposits tend to be extracted first. Extraction cost is
the big difference between the United States oil reserves (Figure 2) and the
Mideast oil - extraction costs run about $0.25 per barrel in much of the Mideast
as compared with several dollars per barrel in the United States.
Although the percentage of nuclear electric power generation is growing
rapidly, the growth of nuclear power is not expected to reduce the demand for
fossil fuels over the next two decades. Tables 2 and 4 illustrate projections
by the Federal Power Commission made in 1970. The percentage of nuclear fuel
use increases from 3% in 1970 to 55% in 1990 and the percentage of fossil drops
from 97% to 45%, but the actual quantities of coal and oil use are expected to
double. The main point here is that nulcear electric generation is not expected
Table 2. Projection of United States Generating Capacity5
(1 GW = 1000 Megawatts)
1970 1980 1990
GW % GW % GW %
Conventional Hydro 51.7 15.2 68 10.4 82 6.5
Pumped Storage Hydro 3.6 1.1 27 4 71 5.6
Fossil steam 260.3 76.5 393 59 557 44.6
Internal combustion 18.3 5.4 30 4.5 50 3.9and gas turbine
Nuclear 6.1 1.8 147 22.1 500 39.4
TOTAL 340.0 100.0 665 100.0 1260 100.0

5
Table 3. Electric Utility Power Generation-Thermal Generation by Types of Fuel
1920 1956 1960 1968 1969 1970
Coal 92% 70.8% 66.3% 61.9% 59.2% 58.0%
Gas 1% 21.7% 26.0% 27.6% 28.0% 28.0%
Oil 7% 7.5% 7.6% 9.4% 11.6% 12.0%
Nuclear -- -- 0.1% 1.1% 1.2% 2.0%
Table 4. Projected Fuel Use by Electric Utilities5
1970 1980 1990
M TONS* % M TONS* % M TONS* %
Coal 300.2 55 472.0 41.9 613.6 28.7
Gas 150.1 27.6 162.3 14.4 200.2 9.4
Oil 79.3 14.6 136.4 12.1 145.1 6.8
Nuclear 15.2 2.8 356.5 31.6 1176.1 55.1
TOTAL 544.8 100.0 1127.2 100.0 2135.0 100.0
*Fuel requirements here are expressed in equivalent tons of coal havinga heating value of 25 million BTU/ton. M TONS = millions of tons.
to come in fast enough to reduce the consumption of coal, oil and gas for electric
power generation. Of course, transportation, space heating, and industrial uses
of energy are almost exclusively fossil fuels, especially oil and gas. Figure 8
of Part I of this report illustrates the switch from coal to fuel oil and gas foi
heating buildings. Our transportation systems rely almost exclusively on oil
derivatives. Since the easily obtained domestic resources are gone ana domestic
reserves ofc il and gas are rapidly running out (Table 1), the only alternative

appears to be the importation of huge quantities of oil and liquified natural
gas (LNG) from foreign countries.
Until very recently this appeared to be the solution to the energy problem.
Since the Arabs were willing to sell us their oil at $1.80 per barrel, cheaper
than we could extract it within the United States, continued supplies seemed
assured. Japan and others built thriving economies on cheap foreign oil. How-
ever, economic pressures - the basic law of supply and demand - caused the price
to rise to about $3.00/barrel, still a good price. Then came the Arab-Israel
war of 1973 and the embargo and escalation of the price to over $11/barrel, twice
the price of domestic crude in the United States. At this price, which threatens
to go even higher, foreign oil is no longer the solution to the energy problem.
Many projections have been made showing. dramatic increases in oil imports to make
up the deficit between domestic demand and domestic supply. These projections
are pure fantesy. At today's prices, the United States simply cannot afford these
imports. Such continued increases in imports are economically impossible. This
is just as true for other western nations as it is for the United States.
With the rising price of oil and limited supplies of domestic gas and oil,
the following approaches are being taken to reduce oil consumption and guarantee
a continued gas supply.
1) Convert fossil-fired power plants now burning oil or gas to burn coal. Relax
the air quality standards or use tall stacks to permit the combustion of high
sulphur coal without causing the ambient air quality standards to be violated2 .
2) Develop coal-gassification processes to insure a continued supply of gas from
coal.

Both of these measures increase the consumption of coal in order to reduce
requirements for oil and natural gas.
The location of major crude oil producing areas, refining areas, and pipe-
lines in the United States are illustrated in Figure 5. Figure 6 shows major
natural gas producing areas and pipelines.
1
CRUDE OIL PRODUCING AREAREFINING AREA
CRUDE OIL PIPELINESPLANNED OR UNDER CONSTRUCTION
Figure 5. Oil Fields, Refining Areas and Pipelines in
the United States 7
Oil shale, a sedimentary rock containing organic matter, will yield oil when
it is heated. 'Although the recovery of oil from shale has not been done on a
commercial basis in the United States, it has been demonstrated on a small scale

8
It i i
MAJOR SOURCE OFNATURAL GAS SUPPLY
GENERALIZED AREA OFNATURAL GAS SUPPLY
NATURAL GAS PIPELINES
--- PLANNED OR UNDER CONSTRUCTION /
Figure 6. Natural Gas Fields and Pipelines in the United States 7
that a range of acceptable fuel oils may be produced from shale oil by relatively
simple refining techniques and that motor and diesel fuels can be produced by
special refining methods. Since the yield of oil may be only 30 gallons per ton
of shale, recovery of oil from this source involves handling large quantities of
solid matter. The amount of domestic oil available from oil shale is about ten
times the crude oil reserves in the United States7 , and greater than the oil re-
serves of the Mideast; however, the cost of extracting this oil is high and the
environmental damage greater.

FOSSIL FIRED POWER PLANTS
Characteristics of New Plants
Schwieger6 reported a survey of new fossil fired generating plants in 1971
and concluded that most new plants were operating with steam conditions above
2400 psi, 1000 OF (Figure 7). Turbine size and boiler capacity of the new plants
Throttle steam conditions Reported capacity
these new ants. The larger boilers use oil and as.
0. 4. -0 0

10
"'urbine size Capacity of boilers
Below 100 Below 1000100-199 1000-1499
200-299 1500-1999300- 399 2000-2499
400-499 e 2500-2999500-599 I o 3000-3499
600-699 3500-3999 F700-99 4000-44990 700-799800-899 C4500-4999
80S 5000-5499900-999 5500-5999
1000-1099 , 6000-69991100-1199 7000- 79991200-1299 8000-8999
Above 1299 1 Above 8999
0 5 10 15 20 0 5 10 15 20Percent of surveyed units Percent of surveyed units
Figure 8. Turbine Capacity and Boiler Capacity of New Plants in 1971
Furnace heat release Plant features
Below 12 I Outdoor turbine12-13.9 Outdoor boiler14-15.9 ,(6- 17.9 Balanced draft
1 8- 19.9 Pressurized furnace20- 21.9 M Primary fuel:
S 2 2- 23.9 = - Cool- ond lignite-fired Cool24-25.9. 0Il Oil- and gas-fired Oil
Gas28-2979
S 30-31.932- 33.91 Combustion additive
34- 35.9 i Closed-circuit TV, 36-40 'E-,l Data logger
Above 40+ M, Computer control
0 5 10 15 20 0 20 40 60 80 100Percent of surveyed units reporting data Percent of surveyed units reporting data
Figure 9. Heat Release, Fuels Used and Other Features ofNew Plants in 1971

ATTEMPERATOR
SECONDARY
BURNERS
GASRECIRCU- AIR HEATERLATING
FAN
S AIR GASTEMPERING- INLET OUTLET
AIR DUCT
PRIMARY-AIR FAN
PULVERIZERS
Figure 10. B&W Boiler for Providing 2.4 Million Lb/hr Steam at
2500 psi, 1050 OF with 1050 OF Reheat 7
Technology
Figure 10 illustrates a modern fossil-fired boiler manufactured by Babcock
and Wilcox, Inc. 7 Pulverized coal is blown into the furnace where combustion takes
place. The wall of the furnace contains many boiler tubes; much of the heat of
combustion is transferred to the water in the tubes, causing the water to boil too
produce steam. The exhaust gases flow through the superheaters, then the economizer,
then through the air heater, then through particulate (and perhaps SO2). removal
equipment, then up the stack. The air heater transfers heat from the exchaust gases
to the air entering the furnace. In a well designed steam plant the exhaust gases
may enter the stack at temperatures as low as 3000F. The boiler in Figure 10
produces 2.4 million lb/hr of steam at 2500 psi and 1050 OF with reheat to 1050 F7.

12
ATTEMPERATOR
SUPERHEATER
BURNERS'
7
TEMPERING-
Figure 11. B&W Boiler (925 psi, 900 OF Steam)7
Figure 11 illustrates a smaller boiler for generating steam.at lower temperatures
and pressures.
A 4500 psi, 1150 OF steam supply system with two stages of reheat is shown in
Figure 12. Few plants have been built operating at these steam conditions. This
unit produced 120 MWe .

13
STEAM OUTLET
FORCED-DRAFTFAN
RAW-COAL I.BUNKER I
SINDUCED-DRAFTFAN
IAIR HEATERNOMINAL 120,1-KW TURBINEAND GENERATOR w T- i
S FEEDE AND COAL
CODITIONER ectly proportional to the volume of gas movedFEEDWATER INLET -
CYCLONE FURNACE GAS-RECIRCULATING
SLG TANK FAN
Figure 12. 120 MWe Generating Unit with a B&W Boiler Operating at4500 psi, 1150 OF with Reheats to 1050 OF and 1000 0F7
The fan circulates air or gas by means of a bladed rotor, or impeller, and
a housing which collects and directs the gas discharged by the impeller. The
power required by the fan is directly proportional to the volume of gas moved
and the head (pressure difference) against which the gas is delivered, and inversely
proportional to the efficiency of the fan and drive. Fans are used both for cir-
culating air and gases in the plant and for blowing the exhaust up the stack.
Stacks seldom provide the draft required by modern boilers, so fans are used to
provide the required mass flow rate. Higher flow velocities up the stack also in-
crease the plume rise, providing better dispersion of the effluent in the atmosphere.
There are basically two types of fans; the centrifugal fan (Figure 13) and
the axial flow fan (Figure 14). The centrifugal fan accelerates gas radially out-
ward by a rotor to a surrounding scroll casing. The axial flow fan accelerates
the gas parallel to the fan axis.

14
V, v V VY, IfSYb
FORWARD - FLAT BACKWARD -CURVED BLADES CURVEDBLADES BLADES
Y = ABSOLUTE VELOCITY OF AIR LEAVING BLADE,(SHOWN EQUAL FOR ALL THREE TYPES OF BLADES)
Y, = VELOCITY OF AIR LEAVING BLADE RELATIVE TO BLADEYb = VELOCITY OF BLADE TIP
Figure 13. Three General Types of Centrifugal Fans7
CAuING
FANDRIVE
Figure 14. Simple Type of Axial Flow Fan7

15
Several techniques are used to vary the fan speed including magnetic cou-
pling, hydraulic coupling, mechanical drive systems, variable speed d.c. motors,
and variable speed steam turbines. The magnetic coupling uses two windings;
a change in field strength between them carries the slip and the speed of the
fan. Similarly, the hydraulic coupling (Figure 15) uses a variable thickness of
oil to provide for variable slip.
INPUT OUTPUtSHAFT p SHAFT
OIL
SCOOPTUBE
Figure 15. Hydraulic Coupling for Varying Fan
Speed with Constant Speed Driver 7
Two-speed AC motors are also used in connection with variable coupling de-
vices to vary fan speed with minimal efficiency loss.
For higher pressure differentials centrifugal compressors can be used, of
the type shown in Figure 16.

16
DISCHARGE
Figure 16. Centrifugal Compressor
The flow of gases through a down-fired boiler is shown in Figure 17. The
combustion gases in the furnace are much hotter than the water in the boiler
tubes; this large temperature difference is necessary for the high heat transfer
rate in the boiler. The exhaust gas is somewhat cooler when it enters the super-
heater, but still several hundred degrees hotter than the peak steam temperature.

17
BURNERS
ECONOMIZER
VIA SUPERHEATER
2200
FURNACE
1800
Figure 17. Temperature Profile of Combustion Gases in
Down-Fired Boiler7
Air heaters transfer heat from the products of combustion to the air entering
the furnace, so that this heat is recovered and the plant efficiency is increased.
Tubular air heaters consist of a nest of straight tubes expanded into tube sheets
and enclosed in a steel casing. The tubes are rolled into tube sheets at both ends
with one sheet free to move to provide for expansion. The tubes are typically 2
to 2-1/2 inches in diameter. Five types of tubular air heaters are illustrated by
Figure 18.
Another type of air heater, called the rotary regenerative air heater, uses
slightly separated metal plates supported on a slowly rotating shaft. As the
plates pass through the exchaust gas stream they are heated and then in passing

18
GAS INLET GAS UTLET
, I GASAIR
OUTLET
AR \AIA
AIR AIROLA INLET OUTLET
" UGAS OUTLET GAS INLETGAS OUTLET
GAS INLETGAS DOWNFLOW GAS UPFLOW GAS UPFLOW AND DOWNFLOW
AIR AND GAS COUNTERFLOW, AIR COUNTERFLOW, THREE PASS AIR COUNTERFLOW, SINGLE PASSSINGLE PASS GAS INLET
GAS GASGAS OUTLET AIR
I INLET
AIR AIR
AIRIOUTLETA
AIR
GAS INLETGAS OUTLET GAS INLET GAS OUTLET
GAS UPFLOW AND DOWNFLOW GAS UPFLOW GAS DOWNFLOWAIR COUNTERFLOW, SINGLE PASS AIR COUNTERFLOW, TWO PASS AIR PARALLEL FLOW, THREE PASS
Figure 18. Five Types of Tubular Air Heaters
through the air stream they give up heat to the air before reentering the exhaust
gas stream.
At the present time there appears to be no significant economic incentive to
increase steam temperature beyond 1050 OF, so the most widely used steam conditions
today for coal and oil burning plants are in the range of 1800-3500 psi with an
initial temperature of 1000-1050 OF and single-stage reheat to 1000-1050 oF.- One
stage and, in a few cases, two stages of reheat are employed with a maximum tem-
perature of 1050 oF8
Costs
Based on data from 42 modern power plants of 34,808 MWe total generating capac-
ity, the average capital cost for this fossil-fired generating capacity was

19
$123/KWe, the average load factor was 62.8%, and the average thermal efficiency
was 34%. The total operating cost in 1970 averaged 3.48 mills/kw hr. These
generating costs ranged from 2.16 mills/kw hr. for a large multi-unit station
burning 21.6C/million BTU gas to 6.73 mills/kw hr. for a smaller unit burning
41.8C/million BTU coal . Figure 19 illustrates the operating cost and capital
cost of these fossil fired power plants. As is seen from the chart on operat-
ing costs, the cost of fuel accounts for the largest part of the operating cost of
the plant. These fuel costs have risen sharply since 1970. In addition, costs of
building plants have increased due to inflation.
In 1971 the annual rate of increase of construction costs was more than 12%,
primarily due to the 17% increase in construction labor cost that year. This in-
crease was due both to wage rate increases and productivity decreases. As reported
by Roe 0 in 1972, "When both wages and fringe benefits are considered, workers in
the construction industry today earn on the average between $6 and $10 per hour.
Many of these workers also earn overtime. For example, for a 45-hour work week, many
of the higher skilled trades such as steam-fitters and boilermakers today can earn
a gross pay of $550 to $600 per week, or around $30,000 per year.
"Another factor of importance is a wide variation in construction wage rates
throughout various areas of the country. Laborers' hourly wages vary from $4.40 in
New Orleans to $8.81 in New York. Steamfitters' hourly wages vary from $8.40 in
Denver to $11.54 in Los Angeles.
"Another significant contributor to increasing construction labor costs is a
decline in productivity. Overall statistics for the construction industry indicate
that output per man-hour increased approximately 1-1/2% per year during the twenty-

20
After fuel, maintenance and repair is largest component of operating cost5.0
4.0 -
Wages & supervision-- --
3.0- Maintenance & repairs -.-
Water & supplies - -
Fuel2.0-
1.0-Survey includes no data forstations in these ratings:
I I I I I. I0.0
Oto 20to 40to 60to 75 to 100to 150to 300to 500to l,O00upMw19.9 39.9 59.9 74.9 99.9 149.9 299.9 499.9 999.9
Group I II III IV V VI VII VIII IX X
0.5Engineering & supervision
0.4 Buildings & structures- -
0.3-
Prime movers & electrical boilers
0.2
Boilers
0.1-
Fuel & ash syste
Mw Oto 20 to 40 to 60to 75to 100to 150 to 300to 500 to 1.000 up
19 .9 39.9 59.9 74.9 .99.9 149.9 299.9 499.9 999.9Group I II III IV V VI VII Vill IX X
Figure 19. 1970 Operating and Captial Costs of Fossil Plants9

21
year period between 1947 and 1967. This rate of increase was well below that of
most other industries. Careful examination shows that this output increased through
advances in equipment technology and use, not through increased labor productivity.
The rate of overall productivity improvement in this country declined in the late
1960s. There appears to be clear evidence that productivity has actually decreased
a great deal in the construction industry.
"On many power plant construction projects today, the trend has been toward
very liberal use of overtime to try to meet schedules and to provide incentives to
attract labor to a particular project work location. The use of overtime can add
tens of millions of dollars to the cost of a generating plant, frequently with ques-
tionable long-term improvement in schedule. A study of the use of overtime in the
construction industry was performed for the Construction Users Anti-Inflation
Round Table. It was found that a 50-hour work week over periods of four to six
months boosted labor costs 50% while producing little if any extra output. There-
fore, overtime should be resorted to only where there is no alternative.
"In recent years, equipment and material costs, which have traditionally
comprised up to 60% - 80% of power plant construction costs, have generally in-
creased at rates of 4% - 10% per year. The increases occurred for a number of
reasons such as wage increases, increased quality requirements, and higher interest
rates."
Other factors increasing costs are schedule delays, and new requirements for
pollution control equipment which can add $50 million or more to the cost of a
fossil plant. Roel0 expects the capital cost of fossil-fired plants to rise as
high as $400/KWe by 1980.

22
GAS TURBINES
The electric utility industry is now using gas turbines extensively be-
cause they can be installed quickly to provide needed capacity. The new larger
gas turbines of more than 50 MWe rating, with their improved efficiency, are
proving valuable for peaking service. The basic characteristics of short ship-
ment cycle and low installed cost has been crucial to customers suffering from
low peak load forecasts, long nuclear delays, or poor reliability of new large
units.
Two types of mid-range gas turbine plants are the regenerative cycle gas
turbine, and the combined cycle STAG (acronymn meaning Steam and Gas) plant.
Each has its own unique advantages for specific utility systems.
Until recently, there was little industry interest in mid-range generation.
The typical utility load duration curve was essentially supplied according to
the age of the power sources. The latest large plants having the best efficiency
supplied the base service at load factors of 80-90 percent. The middle part of
the curve was coveredby older plants with poorer heat rates at load factors of
20-80 percent. Plants for peaking duty were the very oldest steam plants with
12,000 to 20,000 BTU/Kw hr heat rate. This system has worked for quite some
time, as the plants being ordered were basically much better versions of the same
type of power source - fossil steam turbines. Sizes continued to increase and
heat rates continued to decrease.
Recent changes, however, have forced changes in this approach. Rather than
continuing to buy the same type of plant, utilities have seen the value in very
large nuclear and fossil steam plants for economical base load generation. At

-23
the same time peaking requirements have sharply increased to meet escalating
peak load trends, combined with decreasing system load factors.
No longer does
a system's oldest units have either the characteristics or
the total power to
supply this peak load. Recently large numbers of gas turbines have been order-
ed to supply this need. Thus recent history has tended to divide power systems
into two separate power sources, gas turbines and very large base load units,
each ideally suited to its special purpose. In between these two lies mid-range
service. As before, the older fossil units are supposed to fill this need.
But
present day needs are making this service difficult. The absolute size of the
most modern base load units places added emphasis on mid-range units during
scheduled maintenance outages. Unfortunately, lower availability of the large
plants has increased each system's total mid-range power requirement.
At the
very time these older units are being asked to shoulder this added burden,
with
their inherent characteristics of poor load swing capability, long starting and
stopping cycles, and poor part load performance, they are being hardest
hit for
their air pollution. For the future, these fossil units must continue to operate
until they reach retirement age. But they must be supplemented now, and .replaced
later, by power plants intended for mid-range service.
Regenerative Gas Turbines
The regenerative cycle gas turbine is essentially a simple cycle gas turbine
modified to make more efficient use of the available energy. It accomplishes
this by using the heat of the turbine exhaust to preheat the air leaving the
com-
pressor just before it enters the combustion chambers. This preheating, of
course, reduces the amount of fuel required to raise the air temperature to the
desired turbine inlet temperature. The reduction in fuel consumption lowers the

24
plant heat rate by over 2000 BTU while reducing the net plant power output only
slightly. Table 5 lists the output and heat rate for simple cycle and regenerative
cycle machines operating on three different fuels: gas, distillate, and residual
oil.
TABLE 5
NET HEAT RATENET OUTPUT (BTU/KW-HR)
(KW) (HHV)CYCLE FUEL BASE PEAK BASE PEAK
Simple Gas 45,800 53,300 13,460 13,220Distillate 44,800 52,100 12,980 12,790Residual 40,800 45,900 12,800 12,500
Regenerative Gas 44,800 50,400 11,100 10,640Distillate 44,000 49,500 10,720 10,270Residual 38,800 43,500 11,200 10,670
The regenerative cycle gas turbine, then, is basically a significantly more
efficient machine than the simple cycle, and accomplishes this without sacrific-
ing any of the simple cycle units' advantages. Except for the additional air
piping, it is the same compact, packaged unit. It thus has a short shipment
schedule, minimal installation labor, and short installation time to cut down
interest-during-construction costs. Combining its small land area requirement
with the latest advances in both air pollution control (no visible smoke) and
acoustic design will allow optimum utilization of this unit's self-sufficiency to
reduce transmission costs. This plant is completely independent, requiring no
cooling water or auxiliaries and is capable of remote operation and black starting.
Remote unattended operation, no water, no smoke, and minimum space requirements,
and esthetic appearance, allow properties such as substations and existing plant
sites to be used. This can result in significant savings in site development and

25
transmission costs.
Since the regenerative cycle machine uses the standard simple cycle unit
as a base, and adds a time-tested regenerative unit with no untried developmental
problems, it has high availability. It makes no compromises on the simple-cycle
unit's fast, low-cost starting ability. The unit provides good part-load per-
formance by using variable inlet guide vanes designed to reduce the air flow at
part load in order to maintain a constant exhaust temperature, thus allowing a
constant efficiency down to 83% load. This feature actually results in almost a
1000 BTU additional heat rate improvement for loads below 83% over the simple
cycle performance.
The modular construction of the regenerative cycle design allows great
latitude in plant size flexibility, both in the definition of initial plant size,
and in the capability for future additions. The 50,000 KW range unit size per-
mits load carrying flexibility, spinning reserve capability, and low reserve
margin requirements unattainable by large fossil plants, while forcing no limita-
tion on maximum plant size.
The regenerator itself is a very simple component, with no moving parts.
The regenerator is built in two sections, one on each side of the gas turbine.
The gas turbine exhaust splits and flows through the regenerator after which it
is turned upward and discharges to the atmosphere. By splitting the regenerator
in two sections the piping is symmetrical and the top half of the turbine can be
removed.without disturbing the regenerator piping.
The air from the compressor passes through an integral manifold system into
a number of tubes. This air passing through the tubes is heated by exhaust gases

26
flowing on either side of the air channels in the opposite direction. The air
is then collected in a second manifold and discharged to the outlet piping where
it is then conducted to the combustion chambers.
The regenerator is of bar and plate construction. This design allows max-
imum utilization of the available heat transfer surface and results in a compact
unit. An exhaust gas tube consists of a copper brazed and welded envelope with
internal corrugated extended surface. Copper brazing the extended surface to the
tube sheets results in a thermal bond of maximum heat conduction. Structural
reliability is assured by preloading the bond in compression.
A tube bank consists of a number of these tubes, separated by spacers, and
welded to form an integral unit. The passages for the compressor air are thus
formed by the spacers between the exhaust gas tubes. The regenerator assembly is
completed by manifolding the number of tube banks required for the rated air flow.
Combined Cycle
Higher efficiency is achieved by effective use of the energy wasted in the
form of heat in the exhaust. The regenerative cycle unit uses this heat to raise
the temperature of the compressor air. In the steam and gas turbine STAG plant
the exhaust is used to make steam in a heat recovery boiler. This steam then
drives a steam turbine. Table 6 lists parameters for two plants sold by the
General Electric Company.

27
TABLE 6
PARAMETERS OF TWO STAG PLANTS
NET HEAT RATE(KW) (BTU/KW-HR) (HHV)
PLANT FUEL BASE PEAK BASE PEAK
STAG 330 gas 307,300 336,700 9110 8760distillate 303,400 331,800 8750 8430residual 286,300 306,200 9080 8750
STAG 180 gas 168,000 182,700 9100 8850distillate 165,900 180,200 8790 8570residual 159,500 167,500 9140 8850
To the gas tubines are attached heat recovery boilers. A bypass stack and
damper are provided between gas turbine and boiler to allow peaking operation of
any or all gas turbines apart from the rest of the system. All dampers, boiler
controls, supplementary firing burner controls, and retractable soot blower con-
trols (if needed), as well as controls for the gas turbines and steam turbine,
are remotely located in a central control house.
The steam turbine for the STAG 330 is a GE tandem compound, double flow,
non-reheat steam turbine with 23 inch last stage buckets. Again, in steam tur-
bine design, packaging and standardization play key roles, For example, the
downward exhaust has been replaced by side exhausts to twin condensers. As a
result, the turbine can be factory assembled and shipped complete. The condenser
elements can be factory tubed and shipped completely assembled.
The balance-of-plant electrical and mechanical hardware is also arranged
in a manner allowing for minimum installation cost while still providing the
necessary operational flexiblity. For example, provisions are included for dual
sources of auxiliary power: one from the station bus and one from a separate
outside source. The plant output is available through three separate step-up
transformers and associated circuit breakers, one for each pair of gas turbine
generators and one for the steam turbine generator. The mechanical accessories

28
include two half-sized boiler feed pumps, two half-sized circulating water
pumps, two full capacity condensate pumps and a steam bypass arrangement for
plant startup.
Control of the STAG plant is designed for optimum mid-range operation.
Most efficient operation requires control between the maximum output points for
different numbers of gas turbines in operation. This plant is controlled as
a single power source,not as a combination of five different sources, for mid-
range service. Two men operate the plant from a master station control console
located in a central control house. (Use of a high-salt, high-metal residual
fuel would require an additional man for the fuel analysis, washing, treating,
and transfer system.) Maximum automation has been incorporated in all start-up
and load change sequences. A load change is actuated by the operator through
a manual movement of a single load selector.
The STAG plant, then, is quite different than the regenerative cycle plant,
yet offers advantages for mid-range operation. It has a low heat rate (high
efficiency) rivaling fossil steam plants in its size range. The package concept
using tried and proven components assures high availability. The plant is de-
signed for fast starting. After a 12 hour shutdown, the plant can be brought to
full load in 45 minutes. Even in a completely cold start, more than half the
rated output can be available within 20 minutes, with full load in 150 minutes.
Plant control design assures excellent part load performance.
The plant is designed to require a minimum number of operators: one at the
control console, and one roving inspector (unless one man is needed for fuel
treatment).

29
STAG can be in commercial operation two years from the placement of an
order. Due to maximum packaging, installation time is less than six months
after the arrival of the major equipment at the site.
The plant has complete black start capability. Water requirements are
only 40% of those for a similarly rated fossil steam plant. This feature, plus
the no-smoke combustion in the gas turbines assure minimal air and water pollu-
tion.
While the overall plant control has been emphasized, the composition of
the plant allows peak load pick-up by operating any number of the gas turbines
alone - an important feature.
Each of the mid-range plants discussed above has its own unique advantages.
They are completely different concepts in mid-range plant design. The optimum
plant selection for a specific time in a specific utility system requires the
analysis of a number of economic questions. These are reviewed below.
Costs
The mid-range plants that have been discussed have their own characteris-
tics which will be reflected in their long-term costs. Any analysis of the costs
of alternative power plants must be based on several major assumptions. The need
for a given plant is a function of the entire generation presently in operation
on a system. All alternative plants must be judged on the same type of operation
and load factor.
The costs given here included the cost of the basic plant and required options.
To this is added installation costs, cooling water costs where required, fuel
treatment costs where necessary, and interest during construction. A capitaliza-
tion rate of 15% was assumed. Neither transmission costs nor system reserve

30
differentials were included. These.could vary substantially between systems.
Fuel storage costs and system electrical equipment beyond the 13.8 KV breaker
were not included, but are essentially equal for all machines. All costs are
for mid-1972 commerical operation.
The installed costs for the simple cycle, regenerative, and STAG units for
three fuels are shown in Table 7.
TABLE 7
PLANT INSTALLED COST
($/KW AT PEAK RATED NET OUTPUT)
Gas Distillate Residual
Simple Cycle 85 87 107
Regenerative Cycle 105 107 130
STAG 119 121 135
Operating costs for these machines include fuel cost, labor, and mainte-
nance. For this evaluation fuel costs of $.40/106 BTU for natural gas, $.80/106
BTU for #2 distillate oil, and $.40/106 BTU for residual oil were used. No
operators were assumed for gas or distillate fuels for the simple and regenerative
cycle machines, and one man to handle fuel treatment equipment for residual oil.
Two operators are needed for the basic STAG unit, plus one additional for fuel
treatment of residual oil. Maintenance costs can be accurately estimated based
on 20 million hours of gas turbine operating experience.
For natural gas, the simple cycle unit is most economical at low operating
hours. The regenerative and STAG machines do not better the simple cycle unit
until almost 3500 hours per year. In the mid-range area, between 2000 and 5000
hours, the differences between utility systems could favor any of the three

31
machines. With the distillate oil, which is twice as expensive as gas, the
breakeven point is at one half the gas breakeven time. The very efficient STAG
unit is the clear favorite for long operation, unless cooling water or trans-
mission limitations are governing.
For residual oil, the breakeven point is at 2000 hours, with the regenerative
unit significantly poorer than STAG. This difference is largely a function of
the proportionately higher fuel treatment costs for the regenerative unit.
The differences that can result from individual utility requirements must
be emphasized. Each system should be evaluated separately.
The rapid increase in gas turbine purchases is illustrated by Table 8.
TABLE 8
UNITED STATES PUBLIC POWER SYSTEMS PLANTADDITIONS AND IMPROVEMENT
Type of $ Expenditures (millions)Generation 1970 1971
Fossil-Steam 305 321
Gas Turbine 18 59
I.C. Engine 19 36
Hydro 85 80
Nuclear 204 299
Projections to 1980 indicate that it is possible that 6 to 10% of the total
600,000 MWe capacity could be fossil fired gas turbines.
In the 1971-72 period the installed costs ranged from about $60/KWe to about
$85/KWe for simple gas turbines, to $105/KWe for 50 MWe regenerative plants, to
$125/KWe for 330 MWe combined cycle (STAG) plants I .

32
COAL GASIFICATION
The manufacture of both substitute natural gas (SNG) and low-Btu gas from
coal has become a subject of increasing interest in recent years-SNG because of
the decline in natural-gas reserves and low-Btu gas because of the potential de-
mand for clean fuel gas to meet environmental goals in the generation of electric
power. Many coal-gasification processes have been used in the past to generate
low-Btu producer gas or water gas. These processes generally operate at atmo-
spheric pressure and do not represent economically feasible routes to high-Btu
gas. The only commercially available high-pressure process for coal gasification
is the Lurgi process. The commerical use of the Lurgi process that comes closest
to SNG manufacture is that in which town gas, which has a heating value of 400 to
450 Btu/scf, is produced. One such installation is at the Westfield plant of
the Scottish Gas Boardl2. There are numerous other coal-gasification processes
being developed today. Most of the more widely known developments are being
sponsored by the U. S. government or by government-industry groups.
Table 9 lists the major coal gasification processes. There are three basic
steps in each of these processes: local preparation, gasification, and raw gas
upgrading. The preparation phase includes handling, storage and size reduction
of the coal. Some processes also require air oxidation of the coal in a fluidized
bed at 600 to 800 OF and low pressure to drive off some of the volatile matter and
render it nonagglomerating for the gasification process. The gasification step
includes the chemical reactions which produce gas; these reactions are about the

33
TABLE 9
SUMMARY OF BETTER-KNOWN COAL
GASIFICATION PROCESSES1 3
PROCESS Heat Input Pressure, psig Reactor Status
NAME DEVELOPER type
Lurgi Lurgi oxygen 300-500 downward nearmoving-bed demonstrated
HYGAS oxygen IGT oxygen 1000-1500 fluidized 80-ton/dayP.P. constructer
BI-GAS BCR oxygen 1000-1500 entrained/ will build 120-slagging ton/day P.P.
Synthane BOM oxygen 600-1000 entrained/ will build 70-slagging ton/day P.P.
Kellogg Kellogg 02/air 400-1200 molten salt have bench-scaledata
CO2-acceptor Consol air 150-300 fluidized 40-ton/day(dolomite) P.P. constructer
COGAS FMC air 50-200 entrained/ have bench-fluidized/ scale dataslagging
HYGAS electrothermal IGT electrical 1000-1500 fluidized 80-ton/day P.P.constructed
same for all the different processes. However, there are important differences in
the method of feeding coal to the reactor system, in the reactor configuration itself,
and in the method of supplying the heat needed for the gasification reactions.. For
simplicity, only four basic reactions are shown.
coal + H2 -ap CH4 + C (1)
C + 2H2 -P CH4 (2)
C + H2 0 - CO + H2 (3)
C + 02 C02 (4)

r 34
First, the coal pyrolyzes, and much of the volatile matter is cracked and
hydrogasified to methane and smaller quantities of higher hydrocarbons. Second,
some of the char that remains can react with hydrogen to form additional methane.
This reaction is very exothermic, but for most of the processes currently under
development, the extent of reaction 2 is not sufficient to balance the very en-
dothermic heat of reaction 3. In reaction 3, steam is the gasifying agent for
the carbon, and the products are carbon monoxide, hydrogen, and smaller quantities
of carbon dioxide. From a material-balance standpoint, reaction 3 is necessary
because the coal is deficient in hydrogen (relative to the hydrogen content of
methane); the additional hydrogen is supplied from water through the steam-
carbon reaction. In almost all cases, the necessary heat input to the system is
achieved via reaction 4 in which char is reacted with either oxygen or air to
produce carbon dioxide or carbon monoxide. When air is used, the nitrogen-contain-
ing flue gases must be prevented from mixing with the raw gas produced in the
gasification reactors.
The raw gas has a higher heating value of about 300 to 500 Btu/scf (dry basis).
This gas contains methane, carbon monoxide, hydrogen, carbon dioxide, hydrogen
sulfide, ammonia, and unconverted steam. The raw gas is upgraded to SNG in a se-
ries of steps common to almost all the processes. In shift conversion, the carbon
monoxide-to-hydrogen ratio is adjusted for the later methanation step by reacting
some of the carbon monoxide with steam to produce hydrogen and carbon dioxide. A
second step is the removal of carbon dioxide and hydrogen sulfide from the raw
product gas. Finally, carbon monoxide and hydrogen in the approximate ratio of
1 to 3 are reacted over a methanation catalyst to produce additional methane.

35
After the methanation step, the heating value of the SNG is in the range of 900
to 1000 Btu/scf.
The Lurgi Process
The Lurgi process could provide fuel for a power plant that combined the
Lurgi process with a gas turbine.
Coal is introduced in the top of the gasifier after having passed through
a crusher and a pressurized hopper. Air and steam are introduced through slots
in the grating at the bottom of the gasifier. The oxygen in the air combines
with coal in the combustion zone to form CO2 . Simultaneously coal is using the
energy given off by combustion to react with steam to form CO and H2 . The endo-
thermic reaction of C and H20 keeps the temperature down. As the gases pass up-
ward some carbon dioxide reacts with the coal to form carbon monoxide and some
methane is formed. The fresh coal introduced in the top undergoes successive
drying, devolitization and reaction with oxygen and steam. The volatile fraction
of the coal cracks to form methane, hydrogen and other light hydrocarbons. The
gasifier efficiency is approximately ninety-five percent with losses due to un-
burned material and some heat losses.
The crude gas contains sixteen percent CO, twenty-five percent H2, and five
percent CH . The gas is under approximately twenty atmospheres pressure and re-
quires purification before it is ready for a gas turbine. The gas is under pres-
sure and because of this it can be completely cleansed of solids (1-2%) by a
quenching wash with hot water containing tar. The dust contained in the gas is
bonded to the tar in the water and removed. The cooling caused by the quenching
wash is responsible for the condensation of the tars contained in the gas and
they too are removed. The washing process also removes all traces of alkali and

36
chlorine which would be detrimental to a turbine. After this washing process
the gas is ready for the gas turbine and has increased in volume fifty percent
due to saturation by steam.
Although the gas is ready for the turbine the sulphur content must be lowered
by a considerable margin before it can be released to the atmosphere. Ninety-five
percent of the sulphur content of the gas is hydrogen sulfide, which can be re-
moved by washing the gas with an ammoniacal liquor according to the following
reaction:
NH3 + H20 + H2S = NH4HS + H20
The sulphur recovered in this manner is not completely lost. It can act as a
feed stream and be converted into salable sulphuric acid. When the sulphur is
used to produce sulphuric acid the cost of meeting the emission standards by re-
moving the sulphur is .336 mills/kwh.
The synthetic fuel gas is now fed to a pressure reduction turbine to reduce
the gas pressure from 300 psig to 140 psig. The turbine is used to compress the
air feed to the gasifier. The fuel gas is now fed to a combustor and the gas
turbine. The gas is burned in the combustor with stoichiometric amounts of air.
The boiler is placed between the combustor and the gas turbine to control the
temperature of the gas fed to the turbine without using excess air.
The present Lurgi process consists of five discrete steps:
1. Pressure gasification-formation of the crude contaminated gas.
2. Shift conversion-adjustment of the H2/CO ratio to facilitate subsequent
methanation, hydrogenation of carbonization products, and desulfurization
of naptha gas.
3. Rectisol gas purification-adsorption process with organic solvents (preferential-
ly methanol) to remove all impurities.

37
4. Methane synthesis-conversion of clean components (essentially CO and H2 of
gas to methane.
5. Gas liquor treatment-removal of phenols and ammonia (this is a side stream).
All parts of the Lurgi process have been proved in operating plants except
for methanation to the point of comparability with natural gas. Successful bench
scale tests have been concluded and demonstration of the process is underway to
produce a gas having 970 Btu/cu ft.
Overall efficiency of the process is about 68 to 70%, so the current gasifier
with a capacity of about 500 million Btu input would produce about 350,000 cu ft/hr
of gas. A 250-million cfd plant would require about 30 of the standard gasifier
units, which are each about 12 ft in diameter. The equipment is now as big as it
can be for convenient transport. If it were made much bigger, it would have to
be site assembled.
At present the conversion of coal to gas by the Lurgi process is cheaper
than the conversion of coal to the same number of BTU's of electricity.
Three major energy companies announced in October 1972 that they were start-
ing immediately on technical and economic feasibility studies for the construction
of a gasification plant in northwest New Mexico. They are Texas Eastern Trans-
mission Corp., Utah International Inc., and Pacific Lighting Corp. According to
the announcement, they hope to begin operating one 250-million cfd plant in 1975
and the possibility of adding three additional plants in the future is being con-
sidered.
If the project proves feasible, Texas Eastern and Pacific Lighting will build
and operate the plant, and they will contract with Utah International for the coal.

38
It is estimated that each 250-million cfd plant would consume 7.5 million tons
of coal a year.
El Paso Natural Gas Company was the first firm to announce definite plans
to build a 250-million cfd gasification plant. It applied to the FPC in November,
1972 for approval to build facilities based on the Lurgi process with methanation
added. Initial plans called for startup in 1976 with full production attained in
1977. The gas is expected to have a heating. value of 950 Btu/cu ft. Gas that
El Paso currently delivers to California has an average heating value of 1070
Btu/cu ft.
The plant would be located in northwest New Mexico and would consume about
8.8 million tons of subbituminous coal per year. El Paso Gas and Consolidation
Coal Company jointly hold a coal lease on 40,000 acres of land on the Navajo
Indian Reservation. It is estimated that the land contains over 600 million tons
of recoverable coal under less than 150 feet of over-burden. Therefore, conven-
tional surface mining methods can be used.
HYGAS
In the HYGAS process, coal is first crushed, dried, and sized, and then sent
to the pretreatment section. Here, agglomerating coals such as Eastern bituminous
coals undergo a mild surface oxidation with air at about 800 OF. to prevent
agglomeration in the hydrogasifier. Research is being directed toward eliminating
this process step. Nonagglomerating coals, such as lignite and subbituminous; do
not require pretreatment. The feed coal is slurried with a light oil (a byproduct
of the process), pumped to hydrogasifier pressure (1,000 pounds per square inch
gage), and fed to the top of the 135-foot hydrogasifier (reactor) vessel. In the
upper section of the hydrogasifier, the slurry oil is evaporated. The vaporized
oil leaves the vessel with the product gas from which it is then separated and
later recovered for recycle. The coal falls by gravity through the reactor, pass-

38a
ing first through a low-temperature (1,2000 to 1,400 OF.) gasification zone
where methane is primarily generated from the volatile matter in the coal.
The devolatilized coal next passes into the lower section of the reactor. Here,
the coal is hydrogasified at 1,7000 to 1,800 OF. to methane by reaction with
hydrogen and steam. This methane joins with the methane generated in the upper
section to exit from the top of the hydrogasifier as the main constituent of the
product gas. The product gas also contains hydrogen, steam, carbon dioxide, and
carbon monoxide, along with hydrogen sulfide and other impurities.
To make this gas suitable for injection into the pipeline system, the gas
must first be purified. It is scrubbed to remove carbon dioxide and sulphur-
bearing gases. (The sulphur-bearing gases are further processed to produce
elemental sulphur, a byproduct of the process.) The purified gas passes into a
catalytic methanation section. Here, the carbon monoxide and hydrogen react in
the presence of a catalyst at a pressure of 1,000 pounds per square inch and
at temperatures ranging from 5500 to 850 OF to form additional methane. The
product gas, which is predominantly methane, is subsequently dried to remove the
steam formed in methanation to produce the final produce-methane. At 1,000 pounds
per square inch gage pressure, it is suitable for injection into a natural gas
pipeline.
The reacted coal, now called char, is discharged from the bottom of the hydro-
gasifier. Approximately half of the initial coal fed to the hydrogasifier is
gasified to methane. The remaining char contains significant amounts of unreacted
carbon and can be used in any of several processes to generate the hydrogen-rich
gas necessary in the HYGAS process.

39
The HYGAS pilot plant in Chicago for conversion of coal to pipeline quality
gas has been made operational. The plant, together with supportive equipment,
represents a capital investment of about $10 million. It is designed to convert
75 tons of coal per day to 1.5 million cubic feet of high-Btu gas.
Pilot plant construction began in 1969 and was completed in 1971. As of the
fourth quarter of 1972, several significant operating runs have been made; the
most notable being successful operation at 1,000 pounds per square inch gage.
This is the pressure at which both the heat-generating methane-forming reactions
and the heat-absorbing steam-carbon reactions occur at significant rates and is
the pressure upon which the commertial plant design is based. Concentration of
methane in the hydrogasifier effluent exceeded 40 percent. This corresponds
closely to the design concentration. Operating problems,with essentially off-the-
shelf mechanical equipment which delayed initial gas production, continue to be
troublesome and require frequent shutting down of the hydrogasifier. The repeated
heatup and shutdown has caused refractory spallins in the reactor and plugging of
transfer lines. Unexpected severe expansion and concentration of high temperature
internal piping has also been a problem. These conditions are being solved one at
a time and semicontinuous operation of the hydrogasifier has been achieved. The
gas purification and methanation systems have been checked out and are on standby
awaiting continuous operation of the hydrogasifierI
Construction of the electrothermal gasification section was completed in
June 1972. It has been pressure tested to 1800 psig and the electrical control
system has been tested extensively. Operation of the HYGAS section of the plant
with the package hydrogen plant is expected to be completed this spring and opera-
tion with the electrothermal gasifier can begin then.

40
Development work is also continuing on steam-oxygen gasification of coal
char. The novel feature of this development is the gasification of char under
nonslagging conditions in a high-pressure fluidized bed. Estimated construction
cost for this section is about $2.5 million. Construction is projected to be
completed by mid-1974, by which time testing with the HYGAS-electrothermal gasifier
combination should be completed. Integration of the steam-oxygen gasifier will
then be made with the HYGAS reactor for subsequent tests.
CO2 Acceptor Process
Another process for which a demonstration plant has been constructed is the
CO2 Acceptor Process, developed by Consolidation Coal Company. Total funds for
construction of the plant (over $9 million) were furnished by OCR. It will take
an estimated $5 million per year to operate the plant. ;The plant :is designed to
use 1.5 tons per day of lignite and 3 tons of dolomite to produce 2 million scfd
of 375-Btu/scf gas.
It is estimated that a commerical lignite gasification plant using the CO2Acceptor Process would cost about $150 million, use 30,000 tons of lignite per day,
and produce 250 million scfd of pipeline gas. Present estimates indicate the gas
would be in the $1/Mcf price range. Start of construction of the first commercial
plant is projected for sometime in the 1974-76 period.
The unique feature of the CO2 Acceptor Coal-Gasification Process is the cir-
culation of calcined dolomite through a fluidized bed of lignite char operatingo
under gasification conditions. The reaction of dolomite with carbon dioxide, one
of the gasification reaction products, liberates heat sufficient to sustain the
endothermic carbon-steam reaction, and also results in a product gas enriched in
methane, and particularly enriched in hydrogen. Spent dolomite from the gasification

41
zone is calcined in a separate regenerator using air and high-ash char from
gasification as a source of fuel, thus eliminating the need for an expensive
oxygen plant.
The development of this concept by Consolidation Coal Company had been
carried through the laboratory stage by 1964 when the Office of Coal Research
awarded a contract to complete the bench-scale development of the process. This
phase was completed successfully in 1968. Feasibility studies before and after
the bench-scale work indicated the process had potential commercial possibilities.
The conceptual design of a pilot plant was completed in April 1967. Design
of the pilot plant was based upon extrapolation of bench-scale data obtained in
the 1964 to 1968 period. The pilot plant is designed to operate at pressures of
150 to 300 per square inch gage and temperatures up to 1,800 OF. Proper operation
requires carefully controlled flows of char and dolomite, as well as fluidizing
gases, to the several fluidized vessels under balanced pressure conditions.
Construction of the $9 million pilot plant at Rapid City, South Dakota, was
initiated in January 1970, and completed in November 1971.
At the completion of the plant shakedown tests in April 1972, a series of
startup attempts was initiated. Each run was terminated due to some mechanical
problems which have since been solved.
BI-GAS
The BI-GAS process employs an entrained bed, rather than a fixed or fluidized
bed, and all. types of coal may be used in the gasifier without pretreatment. The
two-stage gasifier is said to be relatively simple in design and subject to scale-up
to very large installations. Work has been carried out on a laboratory scale with

42
a 100-lb/hr reactor. General objective of this test program was to optimize
the controlling operating variables of temperature, pressure and residence time,
for maximum methane formation in Stage 2 of the gasifier. The program reportedly
confirmed the original concept that methane could be produced in high yield direct-
ly from coal in an entrained gasifier.
Present methanation processes are based on fixed-bed catalytic reactors.
In connection with the BI-GAS program, work is directed toward development of a
methanation system based on a fluidized-bed catalytic reactor. Design details for
a nominal 6000 scfh fluidized-bed unit have been completed and equipment erected.
Data from this unit will be used for the design of the pilot plant methanator.
The heat of the BI-GAS process is the two-stage gasifier which uses pulverized
coal (70 percent minus 200 mesh) in entrained flow. Fresh coal and steam are in-
troduced into the upper section (stage 2) of the gasifier at pressures in the
range of 70 to 100 atmospheres. In stage 2, the coal comes in contact with a
rising stream of hot synthesis gas produced in the lower section (stage 1) and
is partially converted into methane and more synthesis gas. The residual char
entrained in raw product gas is swept upward and out of the gasifier. The char
is separated from the product gas stream and recycled to stage 1 of the gasifier.
In stage 1, the char is completely gasified under slagging conditions with
oxygen and steam, producing both the synthesis gas and the heat required in stage
1 for the partial gasification of the fresh coal.
The raw product gas from stage 2 is purified by removal of hydrogen sulfide
and carbon dioxide and upgraded in Btu content to pipeline quality by catalytic
methanation.

43
The BI-GAS process offers several advantages in the production of synthetic
natural gas:
1. A high yield of methane is obtained directly from coal, and subsequent
processing of the product gas is minimized.
2. Because it is entrained rather than a fixed or fluidized-bed system,
all types of coal should be amenable without prior treatment for use in this
gasifier.
3. The conditions in stage 2 are such that no tar and oils are formed in
the gasification process.
4. All the feed coal is consumed in the process; principal byproducts are
slag for disposal and sulphur for sale.
ATGAS
The ATGAS process uses molten iron to gasify all types of coal with steam and
oxygen at low pressure for the production of a gas suitable for conversion to
synthetic natural gas. The ATGAS process eliminates the problem of feeding coal
into high pressure gasifiers. Any type and size of coal can be used for synthetic
natural gas production.
The gasifier is a cylindrical refractory-lined vessel (Figure 20) containing
molten iron with a slag layer floating on the iron. Coal and limestone are in-
jected through tubes (lances) placed relatively deep in the molten iron, using
steam as the carrier. The coal devolatilizes with some thermal cracking of the
volatiles leaving the fixed carbon and sulphur to dissolve in the iron. The dis-
solved carbon is oxidized to carbon monoxide with oxygen that is introduced via
lances shallowly immersed in the iron bath. The dissolved sulphur (both organic

44
CONCEPTUAL DESIGN OF ATGAS GASIFIER
COAL-LIMESTONE OXYGEN LANCESTEAM LANCE
OFFGAS
SLAG-IRON SEPARATOR
SLAG TO DESULFURIZERMETAL SHELL __--- ----------- -- -----------_ -_ X>
SLAG ----- - IRON TO GRANULATOR
MOLTEN __REFRACTORY IRONLINING
Figure 20. Conceptual Design of ATGAS Gasifier
and pyritic) migrates from the molten iron to the slag layer where it reacts with
the lime to produce calcium sulfide. Provided the carbon content of the molten
iron is maintained relatively high (3 to 4 percent), the injected oxygen and steam
preferentially react with carbon without sulphur oxidation to form hydrogen and
carbon monoxide. Thus, the oxidation of fixed carbon, the cracking of volatile
matter, and dissociation of water (introduced via the reactor with the coal) produce
a hot (2,600 OF) off gas consisting mainly of carbon monoxide, hydrogen, and pos-
sibly methane.
Capital investment for a 250 MMscfd ATGAS plant is eatimated to be about
$200 million. With 12,600 Btu/lb coal at 30/million Btu, the estimated 20-year
average price of gas is $1.10/million Btu. With the same coal available at 20¢/
million Btu, the average price would be 95/million Btu.

45
Self-Agglomerating Gasification Process
This process is a two-stage fluidized-bed system for steam gasification
of coal. The heat requirement for the endothermic gasification reaction is de-
veloped by fluidized-bed combustion of a part of the carbon bed. Air is used
for combustion. The heat for the gasification reaction is provided by recircula-
tion of coal ash from the burner through a fluidized-bed gasifier.
A major feature of the process is the method of combustion which applies
the "self-agglomerating" fluidized-bed technique for burning coal with simultaneous
pelletization of the ash during the combustion. The ash agglomerates formed in
the combustion bed are free-flowing spherical particles. These are circulated
through the gasifier as a direct-contact heat-transfer medium to provide the heat
for the steam-carbon reaction. This pelletized ash, after giving up a part of its
sensible heat in the gasifier, is returned to the burner to moderate the burner
temperature and be reheated for return to the gasifier.
In addition to providing a pelletized heat-transfer medium to the gasifier,
the self-agglomerating fluidized-bed burner is effective for collecting the ash
contained in the incoming fuel. Thus, the fuel can be burned to yield a combustion
gas essentially free of flyash. This particulate-free hot combustion gas can then
be expanded in an open-cycle gas turbine for recovery of kinetic energy.
Koppers-Totzek Process
In the K-T process (Figure 21), coal is reacted with steam and oxygen ina
patented gasifier to form a raw synthesis gas. The gas is cooled and all par-
ticulate matter is removed. Upgrading to natural gas quality would involve chemi-
cally removing the acid gases produced and then shift conversion and methanation
steps. Because of the high temperature reaction in the gasifier (about 2700 F),

46
FLUIDIZED-BED GASIFICATION PEDU PROCESS FLOW DIAGRAM
To Sulfur Removal
and Thermal OxidizerProduct Gas
Cooler- Coal Lock Hopper Stage 1 Off Gas
ScrubberProduct Gas Cooler
Stage 1 Bag Filter
1200 F Cyclone
Coal I Separator
Stage 2 Stage 3 Flue Gas Char FinesHold Bin
2000 F Cyclone, Stage 3 Separator
DevolatilizedCoal Char 2100 F
Coal Feed Hopper Air and Steam
Ash
A ir a n d S t e a m
Ash Lock Hopper
Figure 21. Koppers-Totzek Process
it is claimed that the raw gas produced by the K-T process is free of condensable
organic compounds. Therefore, potential gaseous or liquid pollutants such as
ammonia or phenotic effluents are not produced.
Koppers Company designed and built the first demonstration unit for gasifying
coal in suspension based on the K-T process in 1948 for the U. S. Bureau of Mines
in Missouri to demonstrate the feasibility of using the process to produce gas
for conversion to synthetic liquid fuels. It was operated jointly by the Bureau
and Koppers Company with the assistance of Heinrich Koppers engineers. Production
at the plant was discontinued in 1950 after a successful demonstration period.
The design of a process and equipment development unit (PEDU) for studying
fluidized-bed catalytic methanation was completed in 1971 under subcontract with

47
Koppers Company, Inc. The 6,000-cubic-foot-per-hour PEDU was scheduled to
be operational early in 1973.
The Slurry Methanation Process
In this process an inert liquid is pumped upward through the reactor at a
velocity sufficient to fluidize the material and remove the reaction heat. The
low BTU feed gas is also passed upward through the reactor so it is converted to
a high concentration methane stream. This process is illustrated in Figure 22.
SLURRY METHANATION EXPLORATORY UNIT
BACK PRESSURE EFFLUENTREGULATOR SAMPLE
DEMISTER
WEVE-VENT
WELLWET TEST
ENCLOSED
REACTORWATER 8
SSOLVENT
_SOLVENT RECEIVER
PUMPPREHEATER
GAS/ N2SPARGER
GASROTAMETER SOLENOID
VALVES
FEEDSAMPLE
Figure 22. Slurry Methanation Process
48
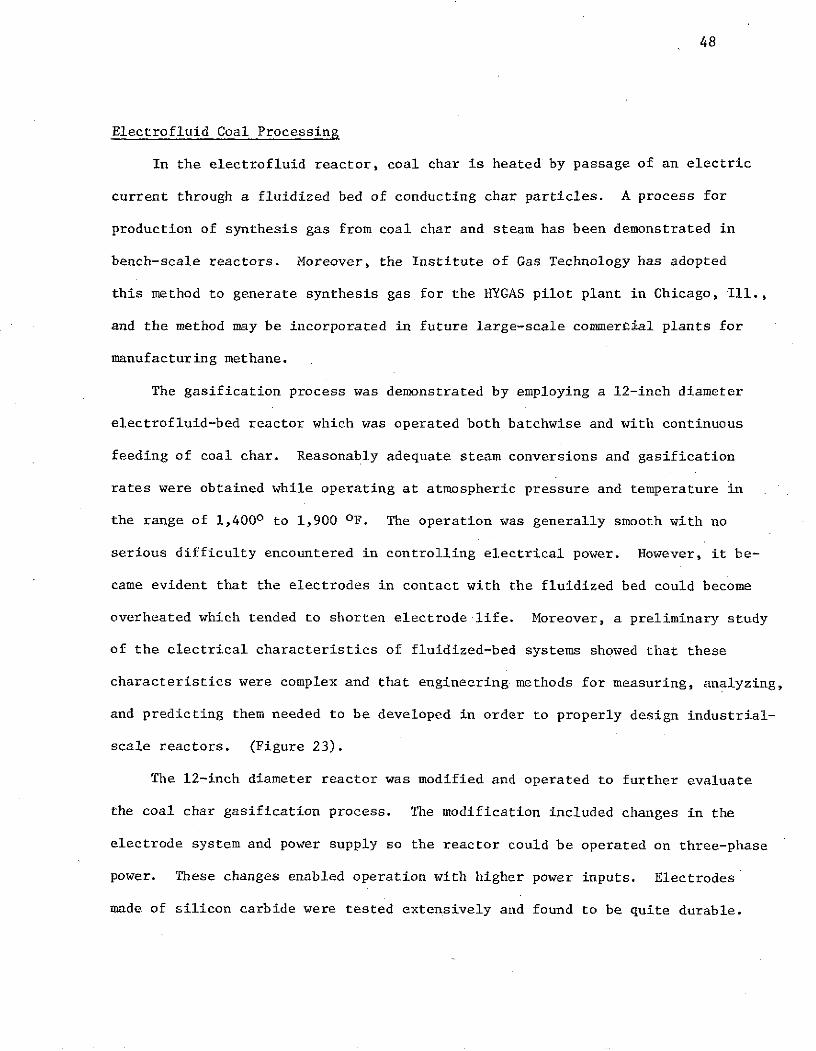
Electrofluid Coal Processing
In the electrofluid reactor, coal char is heated by passage of an electric
current through a fluidized bed of conducting char particles. A process for
production of synthesis gas from coal char and steam has been demonstrated in
bench-scale reactors. Moreover, the Institute of Gas Technology has adopted
this method to generate synthesis gas for the HYGAS pilot plant in Chicago, Ill.,
and the method may be incorporated in future large-scale commercial plants for
manufacturing methane.
The gasification process was demonstrated by employing a 12-inch diameter
electrofluid-bed reactor which was operated both batchwise and with continuous
feeding of coal char, Reasonably adequate steam conversions and gasification
rates were obtained while operating at atmospheric pressure and temperature in
the range of 1,4000 to 1,900 OF. The operation was generally smooth with no
serious difficulty encountered in controlling electrical power. However, it be-
came evident that the electrodes in contact with the fluidized bed could become
overheated which tended to shorten electrode life. Moreover, a preliminary study
of the electrical characteristics of fluidized-bed systems showed that these
characteristics were complex and that engineering methods for measuring, analyzing,
and predicting them needed to be developed in order to properly design industrial-
scale reactors. (Figure 23).
The 12-inch diameter reactor was modified and operated to further evaluate
the coal char gasification process. The modification included changes in the
electrode system and power supply so the reactor could be operated on three-phase
power. These changes enabled operation with higher power inputs. Electrodes
made of silicon carbide were tested extensively and found to be quite durable.

49
16
15 1_-15
0
14 -14
121
II13
I I
Z 0%
608 2Y -
RADIAL EQUPOTSITIALONn. RADIAL POSITION, in.
CONCENTRIC ELECTRODINES TO5 AND TTOM
ELECTRODES
Figure 23. Current Distributions in ElectrofluidCoal Gasifiers

50
However, under some conditions the electrodes became heavily coated with ash
or slag. The extent of coating appeared to be related to the char source. The
electrical characteristics of fluidized-bed systems were also investigated ex-
tensively. The resistivity of fluidized beds was measured under a wide variety
of conditions including temperatures varying from ambient to 1,500 OF. Arcing
or sparking in fluidized beds as well as electrode-to-bed contact resistance
received attention. At the same time, extensive use of field theory was made.
to predict and analyze the electrical characteristics of fluidized beds. A pre-
liminary demonstration of the feasibility of a process for producing carbon
disulfide by reacting sulphur and coal char in an electrofluid.reactor was also
completed. The demonstration included operating the electrofluid-reaction system
over a range of temperatures and sulphur feed rates.

51
NEW TECHNOLOGIES
Fluid-Bed Boilers
Fluidized beds have two major attributes arising from the rapid agita-
tion of the relatively dense particle phase: (1) rapid heat and mass transfer
occurs between the gas and the particles, and (2) high heat transfer coefficients
are obtained at surfaces immersed within the bed in comparison with gas-to-surface
heat exchange.
Early research work into fluidized combustion utilized only the high heat and
mass transfer between the phases in attempts to burn fuels intractable to con-
ventional methods, e.g.anthracite fines, lignite, oil shale, and washery tailings.
Much of this work was successful, resulting in at least one commerical system.
However, the approach to heat utilization was conventional in that the aim was to
heat the combustion gases to the maximum obtainable temperature and pass them
through conventional water-tube boiler systems. For fuels with an ash content
less than about 70 percent, combustion in the fluidized bed was so rapid that
the combustion temperature was higher than the melting point of the ash.
With heat extracted directly from tubes in the bed, very high heat release
rates could be obtained, resulting in a more compact boiler (compared with con-
ventional plant) and a consequent reduction in capital cost. It also seemed
likely that operating costs would be reduced by the use of low-grade fuels and
that the relatively low combustion temperatures would alleviate deposit and corro-
sion troubles.
In the boiler shown in Figure 24, coal was pneumatically fed to the center
of the bed just above the air distributor, and the flue gases passed through a
heat exchanger to a cyclone. The particles from the cyclone could be passed to

52
waste or recycled to the combustor in any required proportion. The combustor
was water cooled.
To stock
Induced-droughtis Cyclone
Heatexchanger bsrbigu
Jacket 7 L I obunker
oC
oaooo oo
Figure 2F.00
l04e 0 00"ei valve
,2 -t colleO
ForcT-draught 7All dimensions are in mm
Turbine-blade specimensvnd target tubes
, b b -------- ,
Combustion gasesleave at 800'C-
-- First-stage cyclonedust collector
Tubes Pressureabsorbing casing60 - 70 per centof coal heat
Coo! burns influidized bedof ash
Ash d, 6 ci,
--- Air6 atm distributor
Figure 25. 4 Ft. x 2 Ft. Fluidized Bed Combustor

53
3-1 bar1-Obor15'C 520 C
26MW
20bor
Intercooler "A 14-7 bar800C
Fluid-bed
15-Obor boiler 1.02 bar291*C 368*C
2561C
259 baor 286 bar 1104.5 bar5381C 371*C 538*C
10 bar Economizer
-Gas cycle
c.130 bor -- Steam cycle
120MW 1 220-C
004bor
Condenser Pump Feed heaters(6)
Figure 26. Combined Cycle Power Plant
Figure 25 illustrates a small fluidized bed boiler, and Figure 26 a 140
MW combined cycle power plant using a fluidized bed boiler.e
MHD
Magnetohydrodynamics has great potential for supplying electricity at higher
efficiencies than at present, and with minimum environmental impact. While the
principle has been demonstrated often in short-time experiments of relatively small
scale, a great deal of work remains to be done before the availability of long-
lived coal-fired central-station MHD generating units becomes a reality.
Fuel is burned at a pressure of 6 or 7 atmospheres, and the resulting hot
gas then flows at a high velocity through a duct within a magnetic field. The gas
must be at such a high temperature that it is electrically conductive. (This
conductivity may be enhanced by potassium or cesium seed.) When a conductor cuts
a magnetic field an electric current is generated-as in the ordinary rotating
turbine-driven generator. Electrodes on the sides of the duct collect the current.

54
This constitutes a thermal-electric generator with no moving mechanical parts.
The gas from the MHD duct, still very hot, may flow to a conventional steam boiler
to power a standard steam turbogenerator. The first generation of such plants
is expected to reach a thermal efficiency of around 50 percent. Eventually 60
percent is believed attainable.
Aside from the need for better understanding of the dynamics within the
MHD duct, the problems are largely associated with the very high temperatures
which require the development of new materials and methods of construction for
dependable performance over a period of years. There are additional problems
associated with seed recovery, coal ash and slag, and large superconducting
magnets. Nonetheless, rational solutions are envisioned.

55
AIR POLLUTION
Health Effects
The most obvious adverse environmental effect of energy generation to
date has been the air pollution which is evident in most major cities of the
world. This air pollution is almost entirely due to the combustion of fossil
fuels, and results in damage to people, to property, and to plant and animal
life. Table 10 lists the five major pollutants and their sources.
Table 10. Sources of Air Pollution (millions of tons per year)
Source CO SO NO Hydro- Particu- Total %carbons lates
Transportation 66 1 6 -12 1 86 60
Industry 2 9 2 4 6 25 17
Electric Power 1 12 3 1 3 20 14
Heating 2 3 1 1 1 8 6
Waste Disposal 1 I 1 1 1 4 3
TOTAL 72 25 12 18 12 143 100
As can be seen, even though electric power plants burn about 25% of fossil
fuels, they only contribute 14% of the air pollution. Internal combustion engines,
with their low efficiency, release 2/3 of the unburned hydrocarbons, practically
all of the carbon monoxide, and 60% of all air pollution. Internal combustion
vehicles and industry are also concentrated in areas of high population density,
whereas power plants tend to be located on the outskirts of these areas. Thus,
the automobile is the worst polluter. Cleaning up automobile emissions alone
should tremendously reduce air pollution in the large cities. Space heating con-

56
sumes as much energy as transportation but produces very little air pollution
because most space heating is done with gas, the cleanest of the fossil fuels.
In some areas, electric power companies are being required by law to burn gas
or oil instead of coal in order to meet emission standards. Table 11 presents
emission rates for the five major pollutants from a fossil fueled power plant
assuming no pollution control equipment, other than flyash control when coal is
burned. Electrostatic precipitation can remove practically all of the particles
from the exhaust. The gaseous pollutants are difficult to remove.
Table .11. Annual Release from a 100 MWe Power Plant
(millions of pounds)
Coal Oil Gas
CO 1.15 0.018 ---
NO 46 48 27x
SO 306 116 0.027x
Hydrocarbons 0.46 1.47 ---
Particulates 10 1.6 1.02
Perhaps the most serious single air pollution incident was the London smog
in the winter of 1952-1953 in which 4000 people died. At that time the primary
fuel for space heating and industry was high sulphur coal. The high atmospheric
concentration of sulphur oxides, which combine with fog droplets to form sul-
phuric acid, was responsible for most of these deaths. Since that time, the
British government passed the Clean Air Act, and it is being enforced. This Act
requires residents of London and other parts of Britain to burn only smokeless

57
fuels in their homes and requires smoke from factory chimneys to be controlled.
Since this act was passed, smog has practically disappeared from London.
When an electric utility shifts from high sulphur coal (2-3% sulphur) to
low sulphur coal (1% or less) or other cleaner fuels, its fuel costs increase.
For example, in 1967 when Consolidated Edison contracted for 1% sulphur coal
to replace the 1.6% sulphur coal they had been using, their fuel costs in-
creased from 33¢/Mbtu to 37€/Mbtu, an annual cost increase of $7.5 million.
This cost increase was, of course, passed on to the consumer through a rate
increase. Burning low sulphur coal reduces the efficiency of electrostatic
precipitators, so simply shifting to low sulphur coal in a plant results in a
decrease in SO2 emission and an increase in the release of particulates. New
York City's regulations require that 99% of the particulates be collected.
Some plants which had been operating with 99% collection efficiency released
more particulates when the switch was made to low sulphur coal, so expensive
additional equipment had to be installed to reduce.particulate emissions to
the previous level. Many utilities are required to burn low sulphur oil (1%
or less), which is considerably more expensive than oil with a higher sulphur
content and has a lower viscosity, resulting in equipment changes. The first
commercial desulfurization plant for fuel oil is now operating in Venezuela
and will furnish 100,000 barrels a day to the United States. This plant re-
duces the sulphur content from 2.6 to 0.5 percent. The requirement of low
sulphur content has increased the prices of usable coal and oil to the extent
that natural gas is economically competitive in some areas.

58
There is a synergistic effect with SO2 and particulates, over 75% of
which are from industry and power plants. In the presence of atmospheric
particles which contain iron, manganese, or vanadium, SO2 reacts to form
sulfuric acid, a severe irritant to the bronchial system and lungs. This
accounted for the large number of deaths from the London smog. SO2 and par-
ticulates together are more damaging than either alone.
The dolomite process has recently been utilized by several power plants
to reduce SO2 emissions. Dolomite, a limestone, is injected into the combus-
tion chamber as a powder where it reacts with about 20% of the SO2 and prac-
tically all of the SO3. The gas then flows to a wet scrubber containing an
aqueous suspension of limestone or lime particles that removes more SO2 as
well as the fly ash. This system removes about 80% of the SO2, essentially
all of the SO3, about 20% of the nitrous oxides, and 99% of the flyash. The
resulting total solids collected is three times greater than the fly ash
alone, so a solid waste disposal problem has been substituted for an air pol-
lution problem.
Most hydrocarbons and oxides of nitrogen are released into the air of
our cities by internal combustion vehicles. These hydrocarbons react with
the nitrogen oxides in the presence of solar ultraviolet light to produce
photochemical smog of the type that appears so often over Los Angeles and
other cities. These reactions produce ozone and complex organic compounds
which can have a serious effect on people, animal life, and vegetation.
Ozone particularly is highly damaging to plant life. Photochemical smog is
basically different from the type of smog formed from high SO2 concentrations.
Also, the automobile is the primary source of the pollutants which cause
photochemical smog, whereas the sulfurous smog is the result primarily of
factories and power plants. The effects of either type of pollution on people

59
can be quite serious, especially for those with allergies or other respiratory
conditions. New emission standards for automobiles to go into effect in 1975
should reduce emission of carbon monoxide and unburned hydrocarbons consider-
ably.
Seven common respiratory diseases which have been associated with air
pollution are cancer of the respiratory system, chronic bronchitis, acute
bronchitis, the common cold, pneumonia, emphysema, and asthma. Ridker14 cal-
culated the total cost in the United States of these respiratory diseases in
terms of 1958 dollars to be $2 billion. Quite a few studies have been carried
out using the basic numbers provided by Ridker, apportioning a part of this
respiratory disease cost to air pollution. The usual way of doing this is to
compare the incidence of respiratory disease in urban and rural areas and at-
tribute the difference in incidence to air pollution in the urban areas. The
ratio of urban incidence to rural incidence is called the urban factor.
15Lave and Seskin provided a detailed analysis of studies up to that time
which indicated a strong correlation between the urban factor and respiratory
disease. In the case of air pollution and lung cancer they cited studies show-
ing a ten-fold difference between death rates in rural and urban areas in
England, and another study showing that the urban death rate due to lung cancer
is twice as high as that in rural areas of England, and another study showing
that the urban death rate due to lung cancer is twice as high as that in rural
areas of England and Wales. Evidence for other parts of Europe also shows an
association between lung cancer and the urban factor. Also cited are American

60
studies which show that the death rate due to lung cancer is 34 per 100,000
in rural areas as compared to 56 per 100,000 in cities with population over
50,000. When standarized with respect to both smoking habits and age, this
lung cancer rate is adjusted to 39 in rural areas as opposed to 52 in cities
of over 50,000, which indicates that the urban factor is responsible for 25%
16of lung cancer in cities. Buell et al. summarized lung cancer mortality
studies to that time and showed that the ratio of the lung cancer rate in the
city to that in rural areas ranged from 1.26 to 2.23, and was slightly higher
when only non-smokers were considered. Also, studies of the.mortality rate
due to cardiovascular disease have shown that the mortality rate is 10% to 20%
higher in urban areas as opposed to rural areas. These comparisons are typically
made of matched groups with similar smoking habits. As a result of these and
other studies, Lave and Seskin concluded that "there would be a 25 to 50% re-
duction in morbidity and mortality due to bronchitis if air pollution in the
major urban areas was abated by about 50%," and that "about 25% of the mortality
from lung cancer could also be saved by a 50% reduction in air pollution."
These conclusions are based on the assumption that the urban factor is entirely
due to air pollution in the case of respiratory disease, including lung cancer.
Carrying this assumption one step further, they conclude that the urban factor
would be eliminated by a 50% reduction in air pollution, since a 50% reduction
in pollution would be expected to result in an air quality equal to that of the
cleaner areas.
Using the correlation between urban and non-urban areas, and assuming the
difference to be due to air pollution, over 20% of cardiovascular morbidity and

61
about 20% of cardiovascular mortality could be eliminated if air pollution
were reduced by 50%. Likewise, they estimated that 15% of non-respiratory
cancer would be saved by a 50% reduction in air pollution.
The fallacy of these arguments, which are found throughout the literature
describing health effects of air pollution, is the assumption that the urban
factor is either due entirely to air pollution or is largely caused by air
pollution. The basic assumption that is made, which seems reasonable until
investigated further, is that the major causative factor for the difference in
frequency of these diseases between urban and rural areas is the greater air
pollution in the urban areas.
Goldsmith 17 analyzed data regarding respiratory disease, heart disease,
and cancer and pointed out that there is a great deal of evidence favoring
urban factors in the epidemiology of lung cancer and other respiratory disease,
and that it appears to have a synergistic relationship to the well-established
effect of cigarette smoking, but that "While many have considered that the factor
might be air pollution, a number of consequences should follow which have not
been observed: 1) the urban factor should be largest in those counties where
there is the heaviest urban pollution; it is not, 2) assuming that the larger
the city the greater the population exposure will be to air pollution, then the
urban factor should increase regularly with city population; it does not, at
least in the United States, 3) if exposure to urban pollution causes an aug-
mentation in lung cancer, then the rates should be higher in lifetime urban
residents than in migrants to urban areas; they are not, 4) correlations of
lung cancer rate with major pollution should be found by studies in the United

62
Kingdom where lung cancer rates are high and pollution is great; a positive
correlation is found with population density and not with pollution, 5) if
the urban factor were community air pollution, it should affect women at least
as much as men; it does not." Goldsmith continued, "There may be other ex-
planations of the urban factor (greater smoking, occupational exposure, popula-
tion density, infections), but the evidence presently available that it is air
pollution does not confirm the suspicion of casualty which previously existed."
Williamson1 8 also discussed the urban factor and stated that "We emphasize that
a casual relationship between air pollution and this factor has been neither
established nor refuted. However, there is a strong possibility air pollution
is at least a contributory cause." Obviously, air pollution does enhance
respiratory disease, but the question which one must answer in order to arrive at
realistic projections of health costs of air pollution is how much of respiratory
disease is caused by air pollution. Lave and Seskin may have grossly overestimated
the costs due to air pollution by attributing the urban factor solely to air
pollution and assuming also that the urban factor could be eliminated by a 50%
reduction in air pollution.
The Surgeon General's report on Smoking and Healthl9 make it quite clear
that cigarette smoking is the major cause of respiratory disease in the United
States. Drastic increases over the last few decades in the incidence of respi-
ratory disease and lung cancer are correlated with the rapid increase in cigarette
smoking. As stated in the report, "Cigarette consumption in the United States
has increased markedly since the turn of the century, when per capita consump-
tion per person was 138. It rose to 1,365 in 1930, to 1,828 in 1940, to 3,332 in
1950, and to a peak of 3,986 in 1961. Similarly, lung cancer deaths, less than

63
3,000 in 1930, increased to 18,000 in 1950. In the short period since 1955,
deaths from lung cancer rose from less than 27,000 to the 1962 total of 41,000.
This extraordinary rise was not recorded for cancer at any other site. Deaths
from heart disease also rose from 273,000 in 1940 to 578,000 in 1962. It is
also shown that, in comparison with non-smokers, average male.smokers of cigarettes
have a ten-fold risk of developing lung cancer and heavy smokers at least a twenty-
fold risk. Cigarette smoking is the most important of the causes of chronic
bronchitis and emphysema." It is further stated that "for the bulk of the popu-
lation in the United States, the relative importance of cigarette smoking as a
cause of broncho-pulmonary disease is much greater than atmospheric pollution
or occupational exposure." A recent report by the Environmental Protection
Agency states that smoking causes three times as much respiratory disease as air
pollution. 20
In this paper actual data on incidence of respiratory disease are used
in the analysis, which is physically reasonable and which properly accounts for
the relative effects of smoking and air pollution. From the results of this
analysis the following conclusions may be drawn regarding air pollution related
respiratory disease: 1) the major cause of respiratory disease in the United
States is cigarette smoking, and 2) although the incidence of these diseases
in urban areas is greater than in rural areas, it has not been shown that this
urban factor is primarily due to air pollution. There is evidence that air
pollution is a contributor to the urban factor, but it is not the only contributor,
and possibly not even the major contributor. Much of respiratory disease is
communicable, and in urban areas the higher population density facilitates its
transmission. Other infectious diseases (possibly including some forms of cancer)
are more easily transmitted in the urban areas because of the higher population

64
densities. Because of more crowded urban conditions, urban non-smokers also
inhale more tobacco smoke produced by tobacco smokers than is the case for
rural non-smokers. Also, significant differences exist between rural and urban
areas with respect to life styles, diet, and other factors which can strongly
affect the health of an individual. Another factor which could be a major
contributor to the urban factor for death rates due to major illnesses is the
fact that many rural people tend to go to a nearby major city to be treated for
major illness. Since demographic data records deaths only by place of occurrence,
if a rural person dies while hospitalized in a nearby city, this would show up
in the urban death rate. Unless a detailed study is made to determine death
rates by place of residence, this factor could have a big effect.
Bates21 concluded that 70% of respiratory disease is due to cigarette smok-
ing. This is in general agreement with the Surgeon General's report on Smoking
19and Health . Thus, the percentage of respiratory disease due to cigarette
smoking is taken to be 70%. Of the remaining 30% of respiratory disease, the
urban factor accounts for 50% of the respiratory disease in cities, keeping in
mind that studies of the urban factor compared groups of equal smoking habits
in order to eliminate the effect of smoking.
Results cited by Goldsmith and others indicate that air pollution is not
the major cause of the urban factor, since there is a stronger correlation
between the urban factor and population density than there is between the urban
factor and air pollution levels. Many factors help account for the difference
in incidence between urban and rural areas, and air pollution is certainly one
of these factors. In a few cases, such as Los Angeles, air pollution may in fact

65
be the major cause of the urban factor; but in most cities, it is not. In
arriving at total costs of respiratory disease due to air pollution, one must
assign a portion of the urban factor (averaged over all metropolitan areas) to
air pollution. It is the considered opinion of the authors that, in view of
the many studies which have so far been reported, air pollution does not account
for more than 50% of the urban factor. If the contribution were greater than
50%, strong correlations with air pollution levels would have been cited by
17 18Goldsmith and Williamson , instead of the lack of correlation which they re-
ported. On the other hand, the authors agree with Williamson in that "there is
a strong possibility that air pollution is at least a contributory cause." Thus,
we assign a minimum contribution of 10% of the urban factor to air pollution.
The effects of cigarette smoking and the urban factor are synergistic, not
additive. Some previous cost studies make the mistake of assuming that these
effects are additive and assign costs independently to the urban factor and
cigarette smoking.
With regard to non-respiratory disease, there have been studies which show
some correlation with the urban factor and smoking. But even though a slight
correlation between the urban factor and non-respiratory diseases, such as cancer,
has been shown to be valid, there is no justification at present for assuming
that this correlation is due to air pollution. There are too many other factors
which may be more important. Likewise, it has not yet been conclusively proven
that smoking is a significant cause of non-respiratory disease.
The health cost of air pollution is calculated to be between $62 million
22and $311 million . This is lower than some of ten-cited estimates of total
health cost due to air pollution because most estimates don't separate out the
effect of cigarette smoking, and they also start with the assumption that the
urban factor is either totally or primarily due to air pollution. As has been

66
pointed out clearly by Goldsmith and others, the urban factor is probably not
primarily due to air pollution for a variety of reasons. It is probably more
connected with factors such as: population density effects on transmission of
infectious diseases, significant differences in life sty1es between urban and
rural areas, urban non-smokers being affected more (because of higher population
density) by inhalation of cigarette smoke produced by smokers, and rural persons
dying after coming to a nearby city for hospitalization (thus contributing
erroneously to the demographic data on urban death rate). Factors such as these
may be major contributors to the so-called urban factor.
15Lave and Seskin calculated the total health cost of air pollution in 1963
to be $2.08 billion. They assumed that "25 percent of all morbidity and mortality
due to respiratory disease could be saved by a 50 percent abatement in air
pollution levels. Since the annual cost of respiratory disease is $4887 million,
the amount saved by a 50 percent reduction in air pollution in major urban areas
would be $1222 million." They also assumed that a 50 percent reduction in air
pollution would reduce cardiovascular disease by 10 percent and reduce cancer by
15 percent, saving $468 million and $390 million, respectively. Thus, they
arrived at a total 1963 cost of $2.08 billion which would be saved if air pollu-
tion were reduced 50 percent, resulting in an air quality equal to that of
relatively non-polluted areas to which the polluted areas had been compared. In
these estimates, half or more of the urban factor was attributed to air pollution,
both for respiratory and non-respiratory disease.
Barrett and Waddell23 further inflated the Lave and Seskin estimate by
assuming that if a 50% reduction in air pollution would result in a savings of

67
$4.16 billion. They arrived at a 1968 cost by multiplying the $4.16 billion by
the fractional increase in Gross National Product from 1963 to 1968, for a
total health cost of $6.06 billion. One difficulty with this estimate is that
the data on which Lave and Seskin based their estimates of $2.08 billion more
properly represented a cost due to all air pollution, rather than costs due to
half of the air pollution. Lave and Seskin spoke in terms of a 50% reduction
in air pollution since that is what would be required to improve the air quality
to that of relatively non-polluted areas, where air pollution was not believed
to be a significant health factor.
The RECAT Committee took the inflated Barrett and Waddell estimate of
$6.06 billion to be a cost due to SO2 and particulates alone, and by employing
the Caretto-Sawyer emission severity factors, used it to project a total 1968
health cost of $15.168 billion for all pollutants. Their reasoning was that
since the air pollution index used by Lave and Seskin incorporated only SO2
and particulate measurements, then the observed effects costing $6.06 billion
were due to SO2 and particulates alone. This would be true if there were no
correlation between SO2 and particulate pollution and other types of air pollu-
tion, but in fact they usually do correlate strongly. During episodes and
general adverse weather conditions, all pollutants usually show high concentra-
tions, and in roughly the same areas. Thus, even though the numerous studies
cited by Lave and Seskin often used only smoke or smoke and sulfation as an air
pollution index, the effects which they report are usually effects due to all
air pollution, not SO2 and particulates alone. In fact, most of these correla-
tions are actually with the urban factor (comparing "clean" rural areas with
"dirty" urban areas) which may have little relation to air pollution. As stated

68
by Barrett and Waddell, "Lave and Seskin seem to have a stronger faith in the
magnitude, sign and statistical significance of their regression coefficients
than what their analysis would seem to support. Their many statements about
the causes of these 'effects' are not as justified as they seem to conclude."
Lave and Seskin clearly intended their cost estimate of $2.08 billion to repre-
sent a cost of air pollution in general, not just SO2 and particulates.
What has happened in arriving at the $15.168 billion health cost due to
air pollution is that a rough estimate of $2.08 billion has been inflated twice
using highly questionable techniques. The Lave and Seskin estimate of $2.08
billion for all air pollution was inflated by Barrett and Waddell to $6.06
billion for all air pollution; then the RECAT Committee took the $6.06 billion
value to be only due to SO2 and particulates, so proportional costs were
assigned to CO ($303 million), hydrocarbons ($6.06 billion), and NOx ($2.745
billion) based on severity factors and tonnages of emissions, for a total cost
of $15.168 billion. This result is actually equivalent to the highly unrealistic
assumption that 125% of all respiratory disease costs, plus 50% of all cardio-
vascular disease costs, plus 75% of all non-respiratory cancer, are attributable
to air pollution.
If one starts with the basic numbers for respiratory disease costs, as
provided by Ridker and by Lave and Seskin, and apportions these costs properly
between smoking and the urban factor, and then takes a realistic percentage of
the urban factor to be caused by air pollution, the resulting cost estimates are
much more reasonable.
The major conclusion of this analysis is that cigarette smoking is a far'
more important cause of respiratory disease than air pollution. The dollar value

69
of these respective costs were arrived at using Ridker's estimate for .the
total cost to society of respiratory disease based in loss of income, hospital
expenses, and other discernable economic factors. Of course, the actual dollar
value of human life and health is impossible to quantify since its value, in
each individual case, depends on the viewpoint of the observer; i.e. whether
the affected individual is an employee or the observer himself. However,
regardless of the total assigned cost of respiratory disease, the conclusion
regarding the relative importance of cigarette smoking and air pollution
remains valid. The dollar values given in this paper represent an estimate of
the overall loss to the economy of the United States due to these factors.
Costs
One of the earliest studies of the cost of air pollution damage was the
1913 Mellon Institute study of smoke damage in Pittsburgh. This study utilized
the now-standard techniques of literature survey, questionnaires, and direct
observation to evaluate a variety of costs related to smoke. The total damage
cost estimate was $9.9 million, or $20 per person in the city of Pittsburgh in
1913. Although this study was for a very specific situation and included- only
soiling and materials damage due to smoke, it is important for two reasons: 1)
it established a procedure for evaluating air pollution costs which has been used
many times since 1913 to estimate costs due to air pollution, and 2) the
resulting cost of $20 per person has been used and misused in many subsequent.
studies of air pollution costs. The highly publicized value of $65 per person
for the total national cost of air pollution has been arrived at by simply inflat-
ing the Mellon result by the cost-of-living increase since 1913, and the often

70
used national cost of $11 billion to $15 billion is this figure multiplied by
the United States population, with an additional inflation factor sometimes
applied to update the $65 per person value.
Obviously, the projection of the 1913 Mellon result to a current national
estimate for all air pollution damage is completely unwarranted. More recent-
ly, several more detailed studies have been conducted in order to arrive at
estimates for the national cost of air pollution damage. Ridker14 published
a book on the economic costs of air pollution, which included consideration
of costs due to health effects, soiling, materials damage, esthetics, and
property values. He projected that the total cost of air pollution in 1970
would be between $7.3 billion ard $8.9 billion. The 1968 total cost has been
estimated at $8.1 billion. More recently, Barrett and Waddell23 reported a
survey of the pertinent literature up to that time and arrived at a total national
cost of $16.1 billion for air pollution damage to health, property values, ma-
terials and vegetation. They went on to assign these costs to the various
pollutants according to their relative tonnage of emissions. For example, of
the $6.06 billion in total health costs, they assigned costs to SO2 and par-
ticulates solely on the basis of their relative emissions, and since SO2 accounts
for 54% of the total emissions of SO2 and particulates combined, the conclusion
was drawn that SO2 alone causes $3.272 billion in health damage. This conclusion
is based on two incorrect assumptions: 1) that air pollution damage to health
is due to SO2 and particulates alone and 2) that the toxicity of SO2 and par-
ticulates are the same. Both of these assumptions are without justification.
The assignment of damage solely on the basis .of tonnages of emissions is
unjustified because differences in toxicity and exposure are not taken into

71
account. Clearly, an approach which accounts for these differences is needed
to arrive at reliable estimates of total air pollution damage by specific
pollutants. In order to apportion costs among the separate pollutants, nation-
wide total costs for air pollution damage to health, materials, plants, animals,
and reduction in visibility are developed from a survey of the latest literature
on these costs.
A method has been developed by which the costs of air pollution damage
are evaluated from the exceedence of damage thresholds and the application of
severity factors for each pollutant-effect interaction. The damage thresholds
were assumed to be the air quality standards, since accurate thresholds have not
yet been determined. Total annual damage cost estimates for each of five
pollutants are: Particulates - from $1.0 billion to $4.7 billion, surphur
dioxide - from $0.3 billion to $1.7 billion nitrogen dioxide - $0.1 billion to
$0.5 billion, oxidants - $0.5 billion to $1.5 billion, carbon monoxide -
$0.06 billion to $0.3 billion; for a total 1970 nationwide air pollution cost
of from $2.0 billion to $8.7 billion5
Control
One set of emission regulations (for Georgia) based on using tall stacks
for SO2 control is described as follows:
SO2 emissions from any source is restricted to a value of 400F (hs/300)3 pounds
per hour for sources with weighted average stack heights (hs) less than 300 feet
and to 400F (hs/300)2 pounds per hour for sources with stack heights h greater
than 300 feet. The factor F is taken to be 1 for urban fuel burning sources
and all other kinds of sources, 0.8 when 2 or more fuel burning sources have a

72
heat input of more than 500 million BTU/hour and which burn fuel containing
more than 1 percent sulphur are located in an urban area, 2 for rural fuel
burning sources having a heat input less than 10,000 million BTU/hour, and 3 for
rural fuel burning sources with a heat input greater than 10,000 million BTU/hour.
A source is considered to be urban if it is located within 5 miles of a city
with a population of 50,000 or more. Similar stack height dependent emission
regulations were also applied for particulates, to be applied in addition to
the restriction by the boiler curve or process weight rate chart. The SO2
emission regulations, when tested under 1975 projected conditions, were found to
successfully attain the state SO2 ambient air quality standard (43 pg/m3 annual
mean), which is more restrictive than the Federal secondary air quality standard
(60 pg/m 3 annual mean). The annual air quality standard for particulates and
the short term SO2 and particulate air quality standards, as estimated by the
AQDM statistical model, were also found to be achieved satisfactorily.
As the Georgia SO2 emission regulations are constructed, a source which is
not in compliance with the regulations (and which does not burn more than 3%
sulphur fuel), can come into compliance by four alternative methods; using
lower sulphur fuel, installing SO2 scrubbing equipment, constructing a taller
stack, or a mixture of SO2 reduction and taller stack. The present SO2 regulations
are formulated entirely in terms of the stack height dependent emission regula-
tions, however additional regulations in the form of boiler curves and process
weight rate charts for SO2 can also be developed as soon as the uncertainties'of
SO2 removal equipment or availability of low sulphur fuel are adequately resolved.
The stack height dependent emission regulations for the State of Georgia are
unique, but in view of the lack of acceptable alternate control measures to

73
achieve the air quality standards on schedule, were considered to be necessary.
Engdahl, in a critical review commissioned by the Board of Directors of the Air
Pollution Control Association, considered the various possible SO2 control strat-
egies and concluded that "While it is recognized that the ultimate aim of the
current regulations is to limit the overall emission of SO2 into the atmosphere,
the immediate goal is to assure that ambient air quality standards are attained.
In view of the lack of proven methods or processes for removing SO2 from flue
gases, explicit consideration should be given to encouraging the use of tall
stacks, where appropriate, as an interim approach to help reduce the ground level
concentration of SO2 " Engdahl further states, "Judging from the failure of
supposedly promising SO2 removal processes in recent years, many of the current
experiments can also be expected to fail. This is the nature of research ....
Meanwhile, tall stacks have been shown both here and abroad to be effective in
reducing the concentration of SO2 in the vicinity of large plants, and the
public will be benefited if tall stacks are encouraged as an interim measure un-
til reliable removal processes are available."
A primary factor influencing the decision to utilize a stack height related
standard to meet ambient standards was the necessity of achieving this goal by
mid-1975. The State of Georgia feels, as do others, that there-are sound reasons
to prefer actual reduction of SO2 emissions. This is presently accomplished by
limiting the sulphur content of fuels, based on boiler input capacity. When the
use of SO2 removal devices and/or fuel desulfurization methods are reasonably
proven and available, the use of such technology is to be considered and put to
use where needed or beneficial. In the meantime, use of tall stacks is a method
proven effective in achieving air quality standards. When removal devices are

74
added at later dates, the existing tall stack will allow continued air quality
improvements, and a minimum acceptable air quality even during removal equipment
breakdowns and adverse meteorological conditions.
The Georgia SO2 emission regulations have been subjected to further diffu-
sion analysis by the PEDCO Corporation (under EPA sponsorship), and it was con-
firmed that compliance with the Georgia SO2 emission regulations would insure
attainment of the air quality standards. However, the legal status of the
Georgia tall stack standard is somewhat uncertain, since it is currently being
challenged in court by the Natural Resources Defense Council (NRDC). The posi-
tion of the courts is also unclear. In the "Findings of Fact" in the case of
Commonwealth of Pennsylvania vs. Pennsylvania Power Company (Case No. 2 - 1972 -
Equity, in the Common Pleas Court of Lawrence County, Pa.), the court stated
that "The utilization of high stack technology as a method to improve ambient
air quality, which is the ultimate goal of Pennsylvania's regulations, has
demonstrated value." On the other hand, several other legal actions with regard
to SO2 compliance to regulations which would require SO2 scrubbing, as summarized
by Snyder (1973), have ended with varying results: compliance being required,
complaince being postponed, or no action being taken.
The alternative to using tall stacks to meet the air quality criteria on
schedule may well be to postpone achieving the air quality standard. The Indus-
trial Gas Cleaning Institute submitted to EPA hearings a statement concerning
the achievability of the SOx compliance schedules through the use of SO2 scrubbing
equipment. The statement said in part: "In view of the practical design, manu-
facturing and construction problems, the proposed (SO compliance) schedulesxcannot be met. The final compliance should be set back until at least July 1,1980
cannot be met. The final compliance should be set back until at least July 1,1980

75
and compliance should be on a staggered basis." The official position of
EPA as handed down in its "supplementary controls" policy is to revoke the
annual SO2 secondary air quality standard and to allow selective use of air-
dispersion procedures to control pollution from industrial sources threatened
with shut-down because of air quality standards. The new supplementary con-
trols proposal would ban the use of tall stacks, leyond those considered "good
engineering practice," as a control strategy, and defines "reasonable time" for
meeting primary ambient air standards called for in the clean Air Act as the
time required to design, fabricate, and install "reasonably available control
technology."
These actions which delay the attainment of the primary and secondary air
quality standards have been brought about or worsened by the present energy
crisis, with its resultant shortages of low sulphur fuel. In contrast, the
tall stack standard in Georgia has meant that the decreased supply of low
sulphur fuels has resulted in little or no change in the compliance schedules
for SO2 sources in Georgia, and the primary and secondary air quality standards
will still be met on schedule by 1975. Since the Georgia regulations allow
power plants to burn coal with up to 3% sulphur, the citizens of Georgia will
continue to have an adequate supply of power. Most states have more restrictive
regulations which result in a shortage of electric power since high sulphur coal
cannot be burned.