nasa earth observatory arset air quality applications webinar adam voiland, science writer science...
TRANSCRIPT
NASA Earth Observatory
ARSET Air Quality Applications Webinar
Adam Voiland, Science Writer
Science Systems and Applications, Inc.
@avoiland
April 8, 2015

Mission
The Earth Observatory’s mission is to share with the public the images, stories, and discoveries about the environment, Earth systems, and climate that emerge from NASA research, including its satellite missions, in-the-field research, and models.
What we do
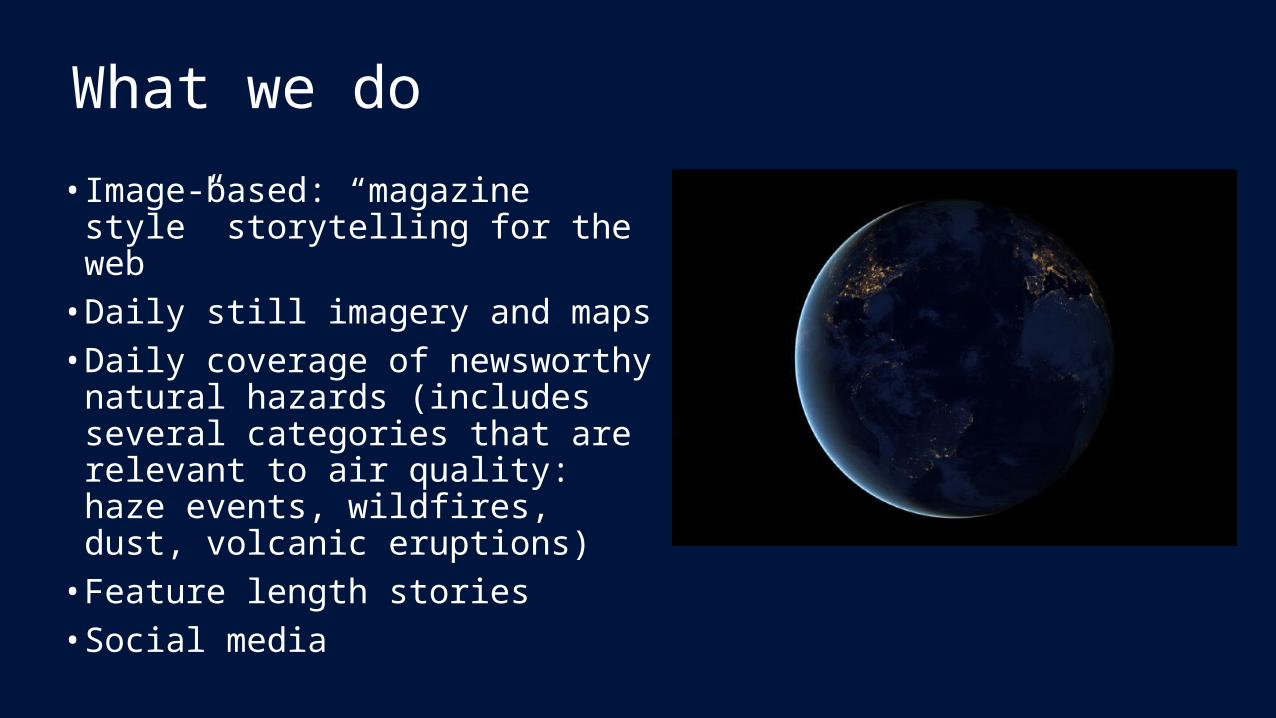
• Image-based: “magazine style” storytelling for the web• Daily still imagery and maps• Daily coverage of newsworthy
natural hazards (includes several categories that are relevant to air quality: haze events, wildfires, dust, volcanic eruptions)• Feature length stories• Social media

earthobservatory.nasa.gov•705k visitors/month
7.9M visitors22.9M pageviews
•79k email subscribers3 newsletters
•6.5 million Facebook followers•434k twitter followers


Key Air Quality Resources from EO•Natural Hazards Section http://earthobservatory.nasa.gov/NaturalHazards/
• Image of the Day coveragehttp://earthobservatory.nasa.gov/IOTD/
•Global Mapshttp://earthobservatory.nasa.gov/GlobalMaps/?eocn=topnav&eoci=globalmaps
•Feature coveragehttp://earthobservatory.nasa.gov/Features/

Natural Hazards Section
•Timely, breaking news. Usually imagery no more than a few days old•Divided into sections: 1) fire 2) dust, smoke haze 3) volcanoes •Goal of at least one new hazards image per day•Straightforward, succinct captions.

Hazards Example: Holuhraun Eruption• Event galleries• Updated as we go
with imagery from different sensors/datasets
Image of the Day•Deeper stories. Often multi-image.•Common data sources: MODIS on Aqua/Terra, OLI on Landsat 8, VIIRS on Suomi NPP, CALIPSO, OMI. •Usually reported stories that include several references and links to sources of data.•Examples: Seasons of air quality in India, New map of PM2.5, ship tracks in NO2

Example: Seasons of Indian Air Quality
MODIS, 2014 http://earthobservatory.nasa.gov/IOTD/view.php?id=84731

Example: Dust Crossing the Atlantic
VIIRS, OMI, 2013 http://earthobservatory.nasa.gov/IOTD/view.php?id=81864

Example: New Map of fine PM2.5
http://earthobservatory.nasa.gov/IOTD/view.php?id=84731Based on MODIS, MISR data. Analysis by van Donkelaar et al, 2010 http://ehp.niehs.nih.gov/0901623/

Example: Shipping Pollution Map (NO2)
OMI, 2005-2012 http://earthobservatory.nasa.gov/IOTD/view.php?id=80375

Example: Ash tracking with CALIPSO
Eyjafjallajökull Volcano, 2010 MODIS, CALIPOP http://earthobservatory.nasa.gov/IOTD/view.php?id=44052

Global Maps•Regularly updated global maps of key NASA datasets relevant to air quality•Presented as monthly averages.•Quicktime animations include several years of data.•Datasets include: aerosol optical depth (Terra MODIS), aerosol size (Terra MODIS), carbon monoxide (Terra MOPITT), fire (Terra MODIS)
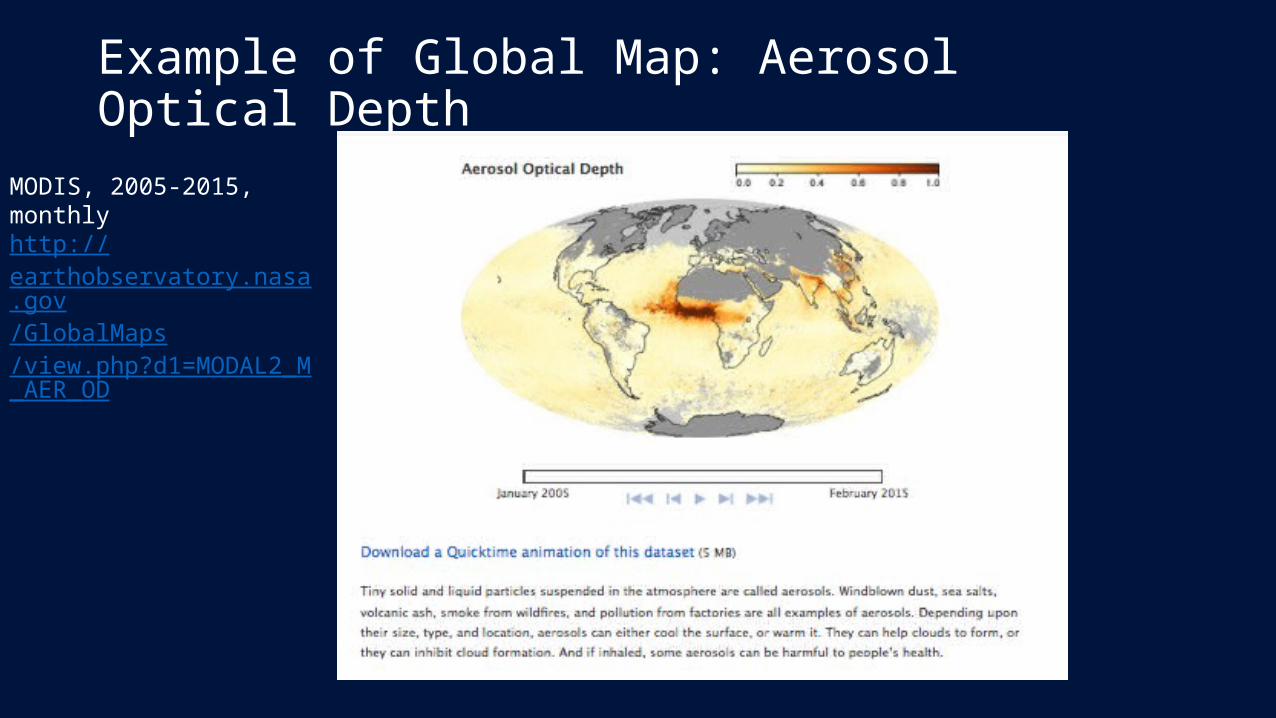
Example of Global Map: Aerosol Optical Depth
MODIS, 2005-2015, monthlyhttp://earthobservatory.nasa.gov/GlobalMaps/view.php?d1=MODAL2_M_AER_OD

Features•Broad overviews. Intended for non-experts.•1) Aerosols: Tiny Particles, Big Impact (Primer)
http://earthobservatory.nasa.gov/Features/Aerosols/
•2) Air Quality: A Clearer View of Hazy Skies (Aerosol Trends)
http://earthobservatory.nasa.gov/Features/AirQuality/

Aerosol Feature
These scanning electron microscope images (not at the same scale) show the wide variety of aerosol shapes. From left to right: volcanic ash, pollen, sea salt, and soot. [Micrographs courtesy USGS, UMBC (Chere Petty), and Arizona State University (Peter Buseck).]
Desert dust, volatile organic compounds from vegetation, smoke from forest fires, and volcanic ash are natural sources of aerosols. (Photographs copyright (left to right) Western Sahara Project, Jonathan Jessup, Vox, and Ludie Cochrane.)

Air Quality Trends Feature
Nitrogen dioxide pollution increased strongly over cities in China, the Middle East, and India from 1996 to 2011. Western Europe, the United States, and Japan showed decreasing amounts over the same period. Monthly data shows these changes in more detail. [Graph by Robert Simmon, data provided by A. Hilboll/University of Bremen (Hilboll et al., 2013)]

Social Media
•2-3 updates on Facebook per day•5-6 updates on Twitter per day (@NASA_EO)•Also on Google+, Instagram, Flickr, YouTube•Facebook especially popular in Asia. •1.6 million from India, 350K from the Philippines, 250K from Pakistan, 220K from Bangladesh, 89k for Nepal. (Compare to 760K for USA)

NASA Earth Observations (NEO)
• Repository of global data imagery• 185k images from 50+ datasets/parameters• Includes aerosol optical depth, carbon monoxide, aerosol particle radius, ozone.• Choose time period and download imagery. Designed for educational purposes, not research.• http://neo.sci.gsfc.nasa.gov/

Other Resources
•MODIS Rapid Response Galleryhttp://rapidfire.sci.gsfc.nasa.gov/gallery/
• EOSDIS Worldviewhttps://earthdata.nasa.gov/labs/worldview/
• Earth Explorer (Landsat, EO-1)http://earthexplorer.usgs.gov/
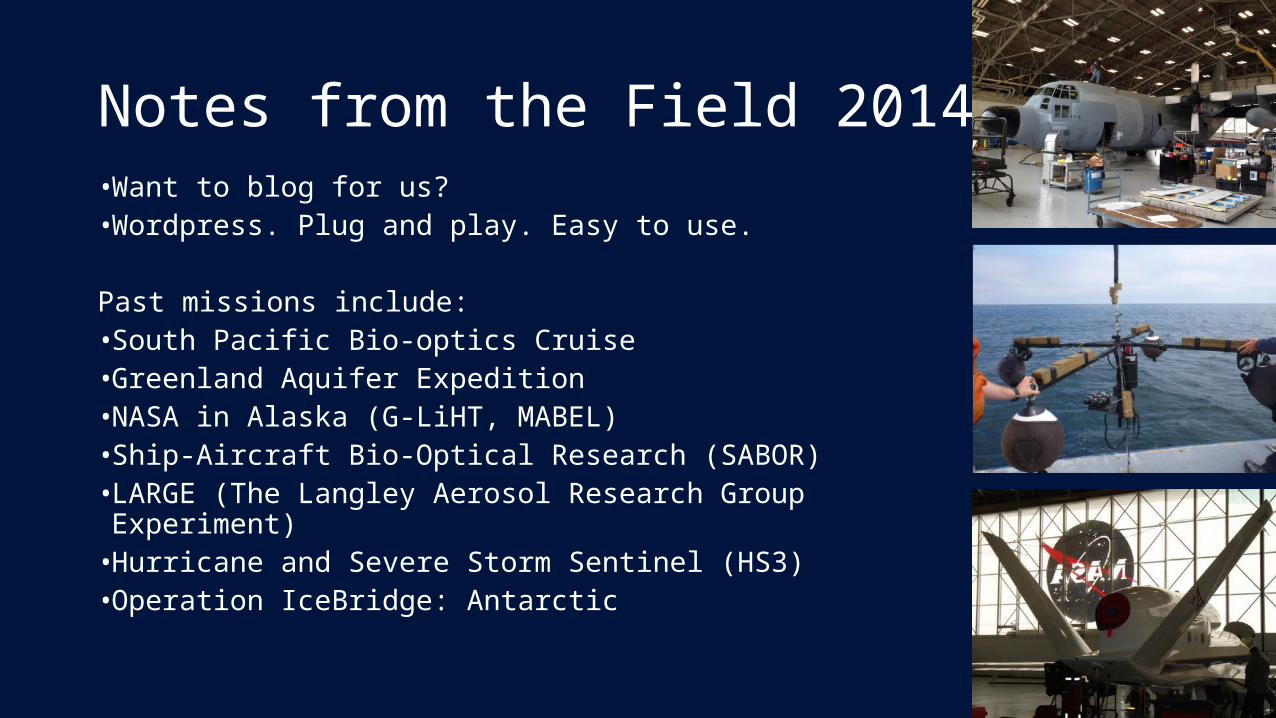
Notes from the Field 2014• Want to blog for us? • Wordpress. Plug and play. Easy to use.
Past missions include:• South Pacific Bio-optics Cruise• Greenland Aquifer Expedition• NASA in Alaska (G-LiHT, MABEL)• Ship-Aircraft Bio-Optical Research (SABOR)• LARGE (The Langley Aerosol Research Group Experiment)• Hurricane and Severe Storm Sentinel (HS3)• Operation IceBridge: Antarctic


Facebook•6.5M likes [836k]•322M total reach
•707 posts (2-3/day)•Avg post reach: 455k
Jan-14 Feb-14 Mar-14 Apr-14 May-14 Jun-14 Jul-14 Aug-14 Sep-14 Oct-14 Nov-14 Dec-140
5000000
10000000
15000000
20000000
25000000
30000000
35000000
40000000
45000000
0
1000000
2000000
3000000
4000000
5000000
6000000
7000000
FB lifetime post total reach FB Page Likes