nasa · · 2013-08-30imaging data analysis jaiwon shin and thomas h. bond lewis research center...
TRANSCRIPT

7io-,^e" 6930
NASA Technical Memorandum 105745
Results of a Low Power Ice ProtectionSystem Test and a New Method ofImaging Data Analysis
Jaiwon Shin and Thomas H. BondLewis Research CenterCleveland, Ohio
and
Geert A. MesanderUnited States Air ForceTinker Air Force Base, Oklahoma
Prepared for the48th Annual Forum and Technology Displaysponsored by the American Helicopter SocietyWashington, D.C., June 3-5, 1992
NASA
https://ntrs.nasa.gov/search.jsp?R=19920019453 2018-05-30T08:53:23+00:00Z

Results of a Low Power Ice Protection System Testand a New Method of Imaging Data Analysis
Jaiwon Shin and Thomas H. BondAerospace Engineer
National Aeronautics and Space AdministrationLewis Research Center
Cleveland, Ohio
Geert A. MesanderUnited States Air Force
Oklahoma City Air Logistics CenterTinker Air Force Base, Oklahoma
ABSTRACT
Tests were conducted under a USAF/NASALow Power De-icer program on a BF GoodrichDe-Icing System's Pneumatic Impulse IceProtection (PIIP) system in the NASA LewisIcing Research Tunnel (IRT). Characterizationstudies were done on shed ice particle size bychanging the input pressure and cycling time ofthe PIIP de-icer. The shed ice particle size wasquantified using a newly developed imagesoftware package. The tests were conducted on a1.83 m (6 ft) span, 0.53 m (21 in) chord NACA
0012 airfoil operated at a 4 0 angle-of-attack. The
IRT test conditions were a - 6.7 °C (20 °F) glaze
ice, and a - 20 °C (- 4 °F) rime ice. The iceshedding events were recorded with a high speedvideo system. A detailed description of theimage processing package and the resultsgenerated from this analytical tool are presentedhere.
INTRODUCTION
With the advent of the increased use ofturbofan engines on modern aircraft, the enginecore flow has decreased substantially, causingconcern about the operation of engine bleed airequipment, i.e. hot bleed air anti-icing systems.The high cost, in terms of electrical power andweight, has always been an issue in restrictingthe application of electrically heated (thermal)anti-icers. Advances in new low power iceprotection designs may provide opportunities toovercome the above limitations.
Presented at the AHS 48th Annual Forum,Washington, D.C., June 3-5, 1992.Copyright 1992 by the American HelicopterSociety, Inc.All rights reserved.
Unlike conventional anti-icing systems, de-icing systems let ice accrete on the surface untilthere is enough mass to expel. Most of the newde-icing technologies rely on very rapid surfacedisplacement, induced by a repulsive force, tocrack and debond the ice. Once expelled, the shedice particles are carried away from the surface bythe airflow. If an engine inlet or upstreamairframe component is to be protected with a de-icing system, the ice protection system needs tobe designed so that shed ice particles are not bigenough to damage the engine fan blades.Therefore, the quantification of shed ice particlesize is very important for an application of de-icing systems on or in front of engine inletsbecause the potential for future use of thesesystems will be determined in part by the size,shape, and number of particles that the enginecan safely ingest.
The tests of low power ice protectionsystems in the NASA Lewis Icing ResearchTunnel (IRT) in 1990 by the United States AirForce (USAF) Oklahoma Air Logistics Centerand NASA Lewis Research Center (LeRC)resulted in the development of new test methodsand data acquisition systems to capture iceshedding events and quantify ice particle size.lThe initial image processing work to quantify iceparticle size was very labor intensive andprovided minimal data. It became clear a moreautomated and extensive data characterizationpackage was needed. The tests also identifiednew questions such as the effects of input powerand/or pressure and the effects of very shortcycling times (less than one minute) on shed iceparticle size. A follow-on test of the BFGoodrich Pneumatic Impulse Ice Protection(PIIP) system was implemented to investigateinput pressure and short de-icer cycling timeseffects on shed ice particle size. This testprovided a good opportunity to examine the newimage processing package developed since the1990 USAF/NASA Low Power Ice Protection

Program IRT tests.
In this paper, the shed ice particle sizeresults from the PIIP system test will bepresented. A detailed description of theexperimental method and the image processingcapability will also be included.
TECHNICAL APPROACH
To eliminate any geometry sensitive issuesin regard to both hardware installation andoperation, a generic airfoil with a relatively mildleading edge radius was chosen. Two icingconditions were chosen: a glaze ice, and rime ice.Both reflect ice accretions that have historicallybeen hard to remove. The key parameters focussedon in this test were PIIP input pressure andcycling time. To quantify shed ice particle size,a series of baseline conditions were run and theneach parameter was varied individually to gagethe effects on system attributes. Shed iceinformation was captured during each run on highspeed videography and occasionally on high speed16 mm motion pictures. The data from the highspeed videography was coupled to an imageprocessing software package that resided on aworkstation platform. This allowed the transferof digitized visual information to a computerwhere the shed ice particle distributions and sizeswere calculated through pixel identification andscaling techniques.
HARDWARE AND SYSTEMDESCRIPTION
Icing Research Tunnel
The NASA LeRC IRT is a closed-looprefrigerated wind tunnel. A 5000 hp fan providesairspeeds up to 134 m/sec (300 mph). Therefrigeration heat exchanger can control the total
temperature from - 1.1 to - 42 °C. The spraynozzles provide droplet sizes from approximately10 to 40 µm median volume droplet diameters(MVD) with liquid water contents (LWC)ranging from 0.2 to 3.0 g/m 3 . The test sectionof the tunnel is 1.83 in ft) high and 2.74 inft) wide.
Ice Protection Technologies
The Pneumatic Impulse Ice Protectionsystem was designed and developed by BF
Goodrich (Fig. 1). It uses pneumatic pressureto generate the ice debonding process. The de-icer has a matrix of spanwise tubes imbedded in acomposite leading edge. The tubes lay flat in the
relaxed state. When the system is activated therapidly pressurized tubes expand slightly with aresultant distortion of the outer surface thatdebonds the ice (Fig. 2). The high accelerationof the skin due to the extremely fast pressurepulse launches the shattered particles into theairstream. There are a number of outer skinoptions: for this test it was made ofpolyetherether ketone (PEEK).
Model Hardware
The testing was done on a 1.83 in ft) spanNACA 0012 airfoil with a 0.53 m (21 in) chord(Fig. 3) and a 8.43 mm (0.332 in) leading edgeradius. There was a break between the leadingand trailing edges at 0.18 in in) thatallowed the front section to be removed. Theleading edge was fabricated by BF Goodrich andhad the ice protector integrally built into thestructure. The trailing edge was made with awood spar, foam core, and a fiberglass skin. Themodel was mounted vertically in the center of the
test section and set at a 4 0 angle-of-attack for theentire test.
The PIIP system was composed of spanwisetubes imbedded in a toughened polymeric corewith a thin overlay sheet of PEEK. Two tubesthat were located symmetrically about the leadingedge were operated for ice removal in this test.The PIIP system air supply was a smallcompressor that provided air to a reservoir thatwas connected to an impulse delivery valve thatreleased the air charge to the tubes. A micro-computer in the IRT Control Room controlledthe cycling rate of the valves; the input pressurewas adjusted by hand at a regulator. A back-upset of nitrogen bottles was used for supplypressure when cycling conditions were below 30second intervals.
Kodak Ektapro 1000 Motion Analyzer
The high speed videography system was aKodak Ektapro 1000 Motion Analyzer. Itconsists of an intensified imager, controller,monitor, and the Ektapro 1000 Processor. Aschematic view of the system is shown inFig. 4. The Kodak Ektapro 1000 Imager has agated image intensifier assembly behind the lensand in front of the sensor which functions as anelectronic shutter and light amplifier. Thisincreases the imager's ability to capture events inlow light and reduces the blurring of objectsmoving rapidly through the field of view. TheIntensified Imager Controller sets the shutter andamplification functions. The gate time (the
2

amount of time the electronic shutter is openduring each frame) can be adjusted from 10microseconds to 5 milliseconds. The intensifiedimager sends its video output to the Ektapro1000 Processor where the image data wastransferred to a special cassette tape that acceptsmagnetic media information at up to 1000 framesper second full field of view. The Processor canplay back and temporarily store the taped images,and set the communication protocols to transferthe visual information in video or digital format.Time, frame rate, session number, and otherpertinent data are included in the transfer.
The Ektapro 1000 Analyzer has a resolutionof 240 columns of pixels by 192 rows of pixels,and provides a video output signal compatiblewith either NTSC (North American) standard orPAL (European) standard video recording signalformats.
TEST METHODS
Test Conditions
Two different icing conditions weresimulated: glaze and rime ice. The airspeed forthe glaze ice condition was 103 m/s (230 mph) at
- 6.7° C (20 °F) with 0.56 g/m 3 of LWC, andan MVD of 20 µm. The rime ice condition was
at 103 m/s, - 20 °C (- 4 °F), 0.36 g/m3'and20 µm. Both conditions fall within calibrationsettings for the IRT and were chosen from theFederal Aviation Regulations (FAR 25) icingenvelope for Continuous Maximum AtmosphericIcing Conditions.
The system was tested at four different inputpressures: 2413, 3309, 5171, and 6895 kPa (350,480, 750, and 1000 psi). The de-icer was fired atspecified intervals during a continuous sprayevent. The spray time was fixed at 10 minutes,and five different cycling times were used: 5, 15,30, 60, and 120 seconds. During the 5 secondcycling interval the de-icer was only fired onceper cycle. For all the remaining times, the de-icer was fired twice per cycling interval with a 3second dwell time between pulses.
Visual Data Acquisition
A Kodak Ektapro 1000 high speed videocamera system described in the Hardware sectionwas used to collect information on ice shedding.The field of view was chosen to cover the mid-span of the airfoil where there is good clouduniformity. Image resolution was set to define a
particle as small as 3.2 mm (0.005 in 2 ) forpost-test analysis requirements. The high speedvideo imaging equipment has more severelimitations imposed on resolution capabilitiesthan standard video transmission signals becauseof the sampling rates, shuttering, andamplification. This yields a system with lowerillumination requirements and with high speedimage capture abilities, but sacrifices theresolution expected in modern digital videocamera systems. These constraints, along withthe minimum threshold particle size criteria,forced the definition of a limited area of coveragefor monitoring the ice shedding event. Theresulting dimensions for the field of view were0.33 m high (13 in) and 0.41 in in) wide.
The Ektapro camera was positioned 164 in(64.5 in) away from the airfoil, shootingperpendicular to the airfoil chordwise axis tominimize the optical distortion due to angularity.It was decided to use a recording rate of 1000frames per second. This provided non-blurredimages that defined the ice particle edges, as wellas enough images of the shed event to analyze iceparticles before they leave the field of view. Thetrade-off with this equipment set-up was that theparticles were well defined within the field ofview, but the amount of information about theice shed history was limited. Within theEktapro's field of view, particles could be trackedfor about 0.41 m (15 in.). To observe shed iceparticles downstream of the Ektapro's field ofview, a 16 mm high speed film camera was used.
With its greater resolution potential, the 16mm visual data could provide a larger field ofview (for the same shed ice particle sizeresolution bounds) than the high speedvideography. This allowed the examination ofparticle size equilibrium versus airstream loadsi.e., how far downstream from the ice shedlocation would large particles travel before theairloads did not induce any further break up.
Ice shedding was recorded twice during thespray and once after the spray was turned off. Allhigh speed video information was stored inspecially designed Kodak video tapes to preservethe original resolution for later data reduction.
An electronically gated video camera fromXybion Electronic Systems was mounted on thehatch above the tunnel test section and aimeddownward, parallel to the pressure surface of theairfoil. A numbered grid map (0.0254 m squares)on the floor of the test section was included inthe field of view so that when ice was expelled

outward from the airfoil surface the particledistance could be documented. The images fromthis camera provided information on how far iceparticles travelled away from the airfoil as theywere going downstream. This data was used toapply a scaling factor for depth of field correctionof the Intensified Imager camera 2-D imageplane.
A depth of field correction procedure wasinitiated prior to testing. A grid map was locatedparallel to the airfoil chordwtse axis at severaldifferent distances from the airfoil. An image ofthe grid was recorded to provide reference lengthsto generate scaling factors for field of viewcorrections.
The 16 mm high speed film camera was usedin support of imaging documentation. The fieldof view included the whole airfoil chord andabout 0.81 meters after the trailing edge,providing a much wider field of view than theEktapro system. The trigger for the camera wasLied to a master sequencer which started all theimaging equipment at the appropriate time. Thefilm camera was typically run at 3000 frames persecond and provided pictures with slightly higherresolution than the Ektapro pictures (due to thelarger field of view that the film camera covered).Grid map pictures were also taken in the samemanner as for the Ektapro system.
A 35 mm camera with a high speed motordrive was mounted above the 16 mm high speedfilm camera to document ice shedding. The highspeed motor drive enabled the camera to take fivepictures per second at 1/8000 shutter speed. Thisprovided sharp non-blurred images of ice sheddingfor some runs. For post-run photographicinformation, a 35 mm camera was used todocument residual ice shapes and any close-upinformation on ice formations. In addition to thevisual equipment described above, a VHS videocamera was mounted on the tunnel ceilingupstream of the model to record an overall viewof the test for general documentation and tunneloperation monitoring purposes.
Figure 5 provides a description of how theimage processing techniques have been organizedto allow either high speed videography or 16 mmhigh speed film to be used. Both options arenecessary because of different requirementsimposed on the test. The sheer volume of imageinformation collected during an ice sheddingevent, the fast processing capability, and the nearreal time data viewing of the high speedvideography make it the primary imaging tool
for the shed ice tests. However, there are specificcases where very short cycling time de-icer firingintervals and large image field of view exposuresare needed that exceed the resolution potential ofthe high speed videography. The 16 mm highspeed film system can overcome theselimitations and thus provide good data. Since itis much more cumbersome to reduce the imagesfrom this medium, and since the final particleresolution is limited by the digitizationprocessing equipment resolution, the 16 mmhigh speed film system was not used until thelimitations of the high speed videography werecoached.
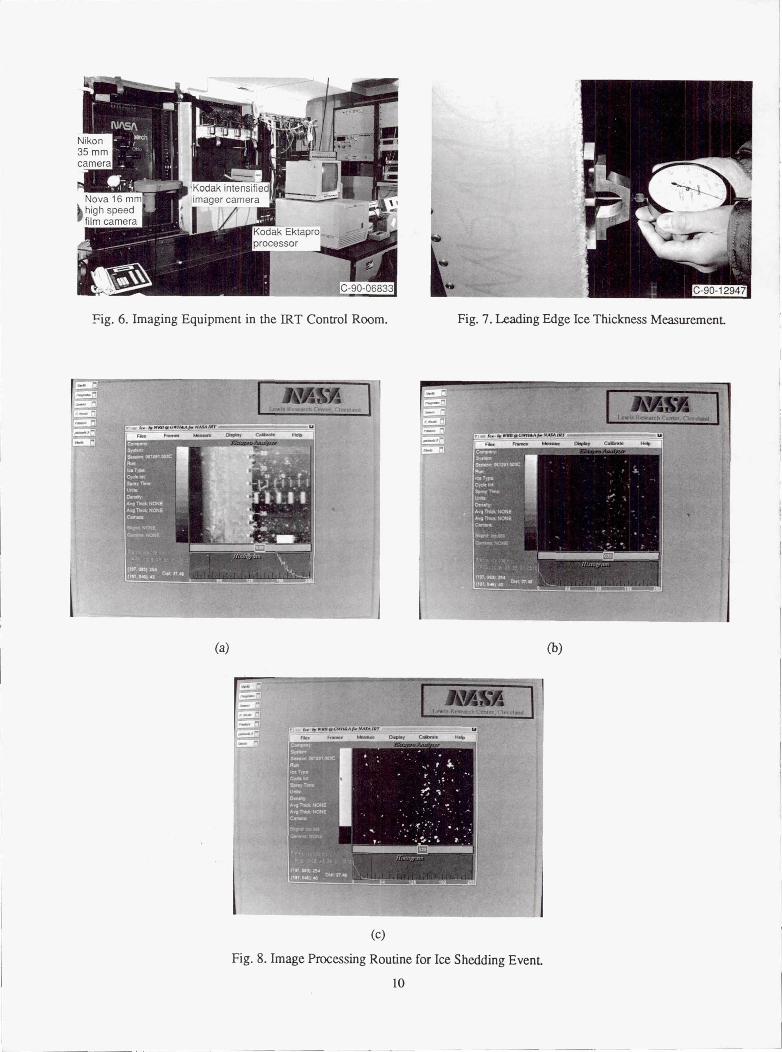
Figure 6 shows the set up of all of thecontrol room visual documentation equipment.
ExWrimental Procedure
The standard routine for each run involvedstarting the icing spray when the IRT was at thespecified test condition. Imaging data was takena set period of time after the cloud was turned on.At the end of the spray and before the final de-icercycle, the tunnel speed was brought down to idleand test personnel went inside the test section tomeasure pre-fire ice thickness at various spanwiselocations on the leading edge and the lowersurface adjacent to leading edge (Fig. 7).
Thickness measurements on the lowersurface (pressure side) were made at two sites: theactive region which was the area directly abovethe de-icer tubes, and the inactive region definedas the float area adjacent to the tubes. The uppersurface (suction side) was normally clear, butmeasurements were made there if noticeableresidual ice was present.
Once these measurements were made, andany pictorial data recorded, the tunnel wasbrought up to operating speed for a final shedevent. This shed was captured with the highspeed imaging data. The tunnel was thenstopped, and a final set of post-fire residual icemeasurements were taken. Spanwise locations ofice, known as cap ice left along the leading edgetip, were also documented. The model was thencleaned off for the next test.
ICE PARTICLE SIZEMEASUREMENT
Ice shedding images on Ektapro tapes wereanalyzed to calculate the ice particle size using aprogram called Whipice that was developed inSpring/Summer of 1991. Whipice runs on a

Silicon Graphics (SGI) Personal IRISworkstation utilizing its superior graphicalcapabilities. The program communicates withthe Ektapro Processor through an IEEE-488 port.Images recorded on Ektapro tapes are digitized inthe Processor and transmitted to the PersonalIRIS.
The Whipice program has two main workingmodes: 'Acquire' and 'Analyze'. In the 'Acquire'mode, a user can control the Ektapro Processorremotely and import images stored on Ektaprotapes to the IRIS's memory. The 'Analyze' modeallows the user to view the imported images onthe IRIS monitor and to process the images tomake various measurements including theparticle size.
The Whipice program differentiates iceparticles from the background image byrecognizing differences in grey level intensity.Therefore, the better the grey level (tonal)contrast between the ice particles and thebackground, the easier the recognition taskbecomes. A series of steps are required to assurethe necessary level of contrast.
First, the program subtracts the staticbackground image (the final image in an iceshedding event where all the shed ice has left thefield of view) from every frame in the event(Figures 8 (a) & 8 (b)). The only informationnow left on the frame will he the ice particlesmoving across the screen. At this point theparticles still contain the whole grey levelspectrum. This tonal shading of the particleagainst the background makes it difficult for theprogram to define their boundaries.
The second step is to eliminate the particlerecognition problem by changing all the iceparticles to be just one color, and the backgroundto be another color. This is done by selecting athreshold grey level that makes any pixels abovethe threshold pure white and any pixels below thethreshold pure black (see Fig. 8(c)). Thethreshold selection process is dependent on userinput - the program allows the user to adjust thethreshold setting by scrolling between the pre-selection image and the threshold setting imageuntil the two appear similar enough to satisfy theuser. In this selection process small changes inthreshold setting result in obvious adjustments tothe particle array, so defining an accurate imagerepresentation is quite straight forward.
Finally, this selected threshold value isapplied to all the frames of the shedding event.
After the image contrast has been set, Whipice isready to make an ice particle size measurementby counting the number of pure white pixels.
The program calculates particle size bycounting the number of pixels within theboundary (pure white area) of the ice particle Ipixel or larger. The pixel count is converted toan area with a physical dimension by applying ascale factor. A scaling factor (detailed in TestMethods) is necessary to provide image planedepth correction because the ice particles traveloutward from the airfoil as they go downstream.Both a thickness and density can be added whichyield particle volume and mass. Whipice cangenerate tabular information for each image frameselected and choose either the completedistribution of particles and their respective sizesor just single particles.
A typical procedure for ice particle sizemeasurement is as follows. An ice shed event isviewed to select frames of interests formeasurement. The image processing thresholdselection routine described in an earlier paragraphis performed. Then a corresponding overheadshot from the Xybion camera is found todetermine the average linear distance of theparticles from the airfoil surface. This is used tocalculate a scaling factor which is applied to thepixel count representing the size of the particle.As each particle size measurement is completedin a frame, the program generates a tablecontaining this information: including thenumber of particles, particle size, volume, andmass of each identified particle. Ice particlethickness information can be provided from adirect measurement in the image using theWhipice program or from an experimentalmeasurement typed in as an input value.
RESULTS
Documentation for the icing encounter canbe divided into two broad categories. The shedice particle size is important when examiningconditions that are pertinent to engine iceingestion or mechanical damage on downstreamaircraft components. The quantity and thicknessof ice remaining on a surface have a directrelation to aero -performance concerns. Duringthe tests, both categories were documented,however for the scope of this paper, only theresults of shed ice particle size measurements arepresented.

Shed Ice Particle Size
There are two aspects to consider in order toacquire valid information on shed ice particle sizedistribution. When an ice shedding occurs, anumber of the ice particles do not reach theirsteady state size immediately. During the initialde-icing phase, ice particles keep breaking up asthey are expelled from the airfoil surface. Whilein the airstream, the ice particles can break upeven further from aerodynamic forces or bycolliding with each other. This aspect dictatesthe amount of delay necessary before analysis ofthe shedding event should begin. The otherimportant aspect is to capture enough particles torepresent a true distribution of particle sizes. Thesmall particles travel downstream faster than thelarger ones, and the trade-off comes in trying tocapture most of the small shed ice in the framewhile still waiting long enough for the largerparticles to be of stable size. This aspectsuggests how far into the shedding event theanalysis should continue. Since the field of viewis fixed, these two requirements bound a windowfor analysis within an ice shedding event.
The actual measurement was made overseveral consecutive image frames within thewindow bound dictated by the aboverequirements. Ice particles rotate while beingcarried downstream. Since the program analyzesa two-dimensional image, a rotating particle willreflect a different size during different frames.Therefore, a particle size distribution obtainedanalyzing any one frame of data will not result ina representative distribution. The approach tocope with this limitation was to analyze severalconsecutive frames to obtain a particledistribution in an averaged sense. The number offrames analyzed depended on the character of eachice shedding event. Typically 5 to 7 consecutiveframes were analyzed per shedding event.
The PIIP system was tested to investigateeffects of input pressure and cycling time on iceparticle size. The results are presented for both.The baseline input pressure was determined byBF Goodrich to be 3309 kPa (480 psi).
Effects of input pressure
During the 1990 USAF/NASA Low PowerIce Protection Systems test, limited runs weremade with a few systems for the effects of inputpower and/or input pressure on the systemperformance. Typically, it was done duringsystem check-out and calibration, and it appearedthat input energy had an effect on system
performance, but there was no time during thesetests to quantify this issue. This present testfurther examined the effects of input pressure onshed ice particle size by operating at four differentinput pressures: 2413, 3309, 5171, and 6895 kPa(350, 480, 750 and 1000 psi), with up to fivedifferent cycling times: 5, 15, 30, 60 and 120seconds. Table 1 provides a compilation of theimaging data points. Each condition tested wasrepeated. Test points at 30 and 60 second cyclingtimes for 2413 and 6895 kPa were added duringthe last 3 days of IRT testing when theopportunity arose to extend the test matrix.
The results for 30 and 60 second cyclingtimes for the glaze ice condition are presentedhere; these have test points over the entire inputpressure range tested.
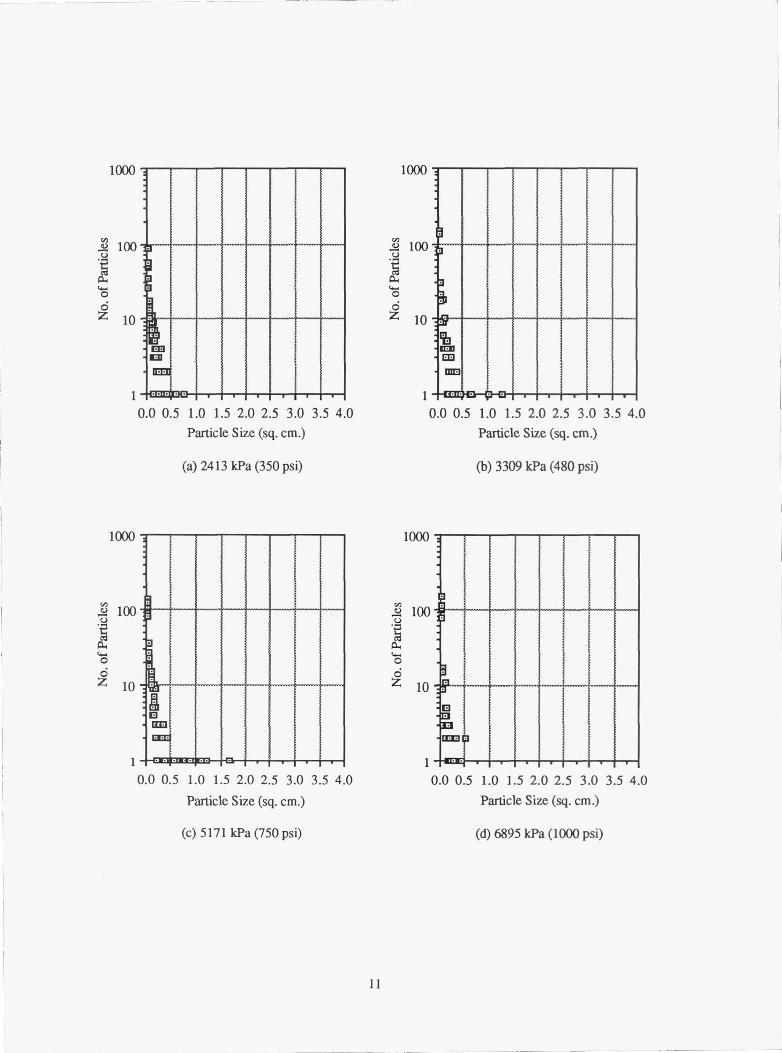
Figure 9 shows particle size distributions forfour input pressures with a 30 second cyclingtime. The x-axis denotes the particle size in cm2and the y-axis the number of particles. Each plotin the figure contains the particle sizedistributions from all the analyzed frames for aspecific shed event. The Whipice analysisprocess examines every particle 1 pixel or largerin the frame to give this distribution. The sizeof one pixel particle equals to 0.032 cm2 . Allthe figures show large numbers of smallparticles, with particle counts decreasing as theparticle size becomes bigger. For the first threepressures (Figs. 9 (a), (b), and (c)), the particlesize distribution is similar except at the ends.The number of the smallest particles changesfrom approximately 90 for 2413 kPa toapproximately 140 for 3309 and 5171 kPa. Themaximum particle size was larger for 3309 and5171 lcPa than for 2413 kPa. For the 6895 kPa,the number of the smallest particles increased toaround 150 and the maximum particle size wassmaller than for other pressures. Figure 9 (e)shows a combined plot of all the pressures with acurve that defines the outer bound of the particledistribution for each case. The particle sizedistributions for the three lower pressures lienearly on top of each other, and therefore showinsignificant sensitivity to pressure. But theparticle size distribution for 6895 kPa shows thatthe highest pressure definitely produced smallerice particles than the lower pressures.
Figure 10 shows particle size distributionsfor a 60 second cycling time. For this cyclingtime, the particle distributions show little changewith input pressure. Figure 10 (e) showsdistribution curves similar in shape to those inFig. 9 (e), except that in Fig. 10 (e) the 6895

kPa curve is not so dramatically displaced to theleft of the lower pressure curves as it is in Fig. 9(e). The major difference in the experimentalconditions represented by Figs. 9 and 10 is thatthe ice thickness at the 30 second cycling time isabout half that at the 60 second cycling time.Therefore, for the thinner ice layer the highestpressure was more effective in breaking up theice than it was for the thicker ice. Thus it isspeculated that somewhere between the 30 secondand 60 second ice accumulations there may havebeen a threshold ice thickness below which thehighest pressure was dramatically more effectivein reducing shed ice size.
Effects of cycling time
The performance of the ice protection systemis directly related to the thickness of ice it isrequired to remove. One way to control thethickness of the ice on the surface is by changingthe cycling interval between shedding events.During these tests, the input pressure was heldconstant, and the effects of cycling time on shedice particle size were investigated for fivedifferent cycling intervals: 5, 15, 30, 60, and 120seconds. Results are presented for glaze and rimeice with an input pressure of 3309 IcPa.
Figure 11 shows plots of shed ice particlesize versus the number of particles for eachcycling time for the glaze ice condition. A trendis apparent that shorter cycling times result insmaller ice particles. The distributions show twodistinctly different patterns. The first pattern,showing smaller particle distributions, is with 5,15 and 30 second cycling times. The distributionprofiles do not differ much with the cycling time.The second pattern, which shows much largerparticle distributions than the first pattern, iswith 60 and 120 second cycling times. As thecycling time increases there is a thicker ice onthe de-icer which creates a larger particledistribution profile. These results suggest thatice thickness may be an important parameter indetermining ice particle size. And as wassuggested in the discussion of Figs. 9 and 10above, somewhere between the 30 second and 60second ice accumulations there may have been athreshold ice thickness below which the iceparticles could be more easily broken up intosmaller sizes.
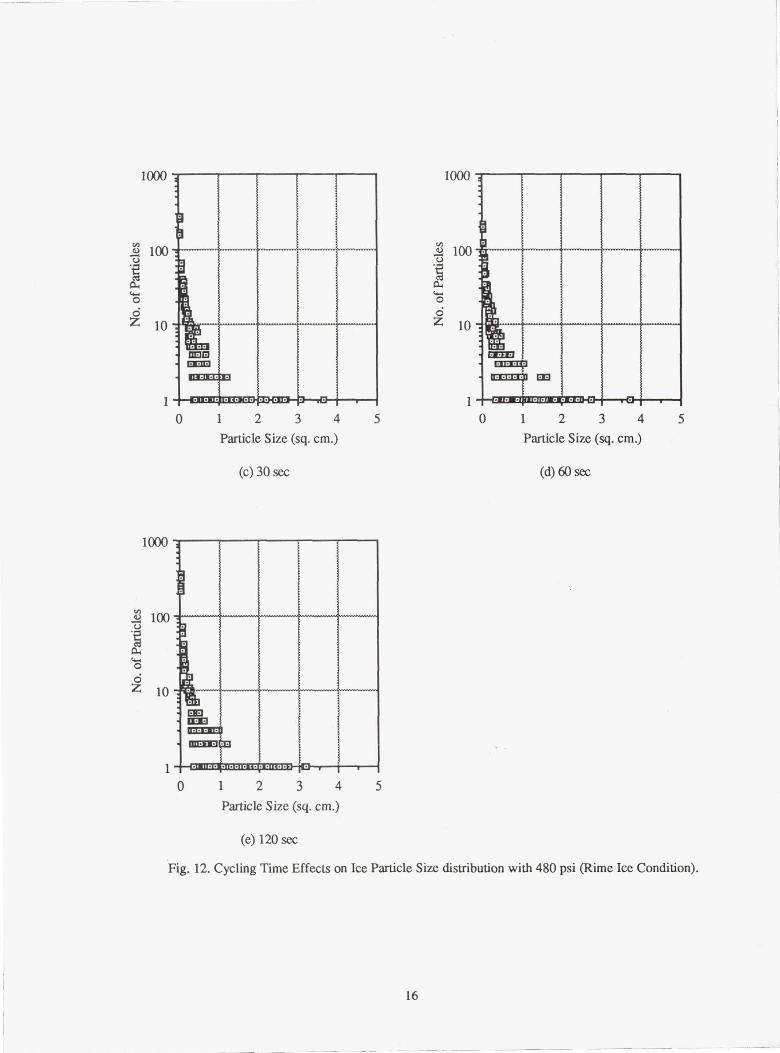
Figure 12 shows the same type of results forrime ice. Although the distributions show twodistinct patterns again, it appears that the
threshold lies between 15 and 30 second withrime ice. This implies that ice type may also beaffecting the ice particle distribution.
CONCLUDING REMARKS
The test was part of the continuing effort tocharacterize low power de-icers as a part ofUSAF/NASA Low Power Ice ProtectionSystems program. The BFG PIIP systemperformance was examined in terms of inputpressure and cycling time. The test also providedthe opportunity to check-out the new imageprocessing technique: Whipice. This newcapability to document the shed ice particle sizedistribution was tested and proved to be veryefficient and powerful. The development of anautomated image processing package to measureparticle distribution was a significantimprovement to the Low Power De-icer program.Whipice handles a large amount of data with anorder-of-magnitude savings in time and laborcompared to the previous technique, makingparametric studies such as the current testpossible.
This new imaging capability should proveespecially useful to engine manufacturers,because they could use it during an engine inletdeicer test to obtain the distribution of shed iceparticle sizes that the engine would have toingest safely.
Considering the significant increase in thenumber of operational cycles for the very shortfiring intervals, there is a penalty in powerconsumed that is not returned in improvedsystem performance in terms of shed ice particlesize distributions.
REFERENCES
1. Bond, T.H., Shin, J., and Mesander, G.,"Advanced Ice Protection Systems Test in theNASA Lewis Icing Research Tunnel," NASATM 103757, Presented at the 47th AmericanHelicopter Society Annual Forum andTechnology Display, Phoenix, AZ, May,1991.
2. Martin, C. and Putt, J., "An AdvancedPneumatic Impulse Ice Protection System(PIIP) for Aircraft," AIAA Paper 90-0492,Jan. 1990.

PIIP COMPOSITE LEADING
EDGE ASSEMBLY
OUTWARD NORMAL DEFLECTION.03"-.05" TYP. UPON IMPULSE
TITANIUM SURFACE
DIMPLED FOR FLUSH FASTENERS-'
Table 1 High Speed Videography Shed Ice Imaging Data.
Cycling 2413 kPa (350psi) 3309 kPa 480psi) 5171 kPa (750psi) 6895 kPa 1000psi)
Time Glaze Rime Glue Rime Glaze Rime Glaze Rime
(sec) 1st re 1st re 1st re 1st re 1st re 1st re 1st re 1st re
120 Xbad
X X X X
60 X X data X X X ^ X X
30 X Xbad
X X X X X X Xbad
15 X X I X X
5 X X I X X
28 VDC
2500 PSIG AIR HYDRAULIC DRIVESUPPLY COMPRESSOR
(IMPULSE DELIVERY VALVE(
-------------------^-a- 1
SPENT IMPULSE VENTED OVERBOARD
PIIP SYSTEM SCHEMATIC "^ -31
Fig. 1. BF Goodrich Pneumatic Impulse Ice Protection(PIIP) System Schematic.
ACTIVE EXTENT DETERMINED BY IMPINGEMENT LIMITS
-INFLATED SPANWISE PIIP PROFILES-SIMULTANEOUS IMPULSE SHOWN
Fig. 2. BF Goodrich PIIP Composite Leading EdgeAssembly (Distortion exaggerated for clarity).
Fig. 3. NACA 0012 Airfoil with PIIP system in the IRT.
8

Fig. 4. Schematic View of Ektapro High Speed Videography System.
High Speedhi-res chip Videography
camera Monitor
Kodak EktaproHigh Speed
Videography....0 Process6;f::W
Captures shed ice event,stores on tape and down-loads digitized image for
processing and datamanipulation on SGI
workstation
az Vt'" C7 SGI
Monitor
SiliconGraphics
Computer Accepts digitized image files
(UNIX) and processes them through imagesubtraction and gray scaling techniques to
provide particle and mass distributioninformation
Film ViewingArea and X-Y
CoordinateGrid
Vanguard 16 mm DataReduction Svstem
16 mm film examined frame byframe, selected images captured by
hi-resolution video cameraand digitized by frame grabber for data
processing in SGI workstation
Fig. 5. De-icer Shed Ice Image Processing and Data Reduction Package.
9
0
d
b
Nikon35 mmcamera
Nova 16 mnhigh speedfilm camera
(b)(a)
Fig. 6. Imaging Equipment in the IRT Control Room
Fig. 7. Leading Edge Ice Thickness Measurement.
(c)
Fig. 8. Image Processing Routine for Ice Shedding Event.
10
1000
1000
looU
aw00z to
I mla
10.0 0.5 1.0 1.5 2.0 2.5 3.0 3.5 4.0
Particle Size (sq. em.)
(a) 2413 kPa (350 psi)
100U
aw0
O
z 10
im
10.0 0.5 1.0 1.5 2.0 2.5 3.0 3.5 4.0
Particle Size (sq. cm .)
(b) 3309 kPa (480 psi)
1000
100U
awOOz to
10.0 0.5 1.0 1.5 2.0 2.5 3.0 3.5 4.0
Particle Size (sq. cm .)
1000
100U_
awO
O
z 100
10.0 0.5 1.0 1.5 2.0 2.5 3.0 3.5 4.0
Particle Size (sq. cm .)
(c) 5171 kPa (750 psi) (d) 6895 kPa (1000 psi)
11

1000
100U
aw0
Z 10
1
0.0 0.5 1.0 1.5 2.0 2.5 3.0 3.5 4.0Particle Size (sq. cm .)
(e)
Fig. 9. Pressure Effects on Ice Particle Size Distribution with 30 sec. Cycling Interval (Glaze Ice Condition).
1000 1000
100 ? 100
.CCa aO OO Oz 10 z 10
oq13 :
o m o
0.0 0.5 1.0 1.5 2.0 2.5 3.0 3.5 4.0 0.0 0.5 1.0 1.5 2.0 2.5 3.0 3.5 4.0Particle Size (sq. cm .) Particle Size (sq. cm .)
(a) 2413 kPa (350 psi)
(b) 3309 kPa (480 psi)
12

1000 1000
loo 100U U
w wO OO Oz 10 z 10
Elm O
0.0 0.5 1.0 1.5 2.0 2.5 3.0 3.5 4.0
0.0 0.5 1.0 1.5 2.0 2.5 3.0 3.5 4.0Particle Size (sq. cm .)
Particle Size (sq. cm .)
(c) 5171 kPa (750 psi)
(d) 6895 kPa (1000 psi)
1000
100U
awO
Z 10
1
0.0 0.5 1.0 1.5 2.0 2.5 3.0 3.5 4.0Particle Size (sq. cm .)
(e)
Fig. 10. Pressure Effects on Ice Particle Size Distribution with 60 sec. Cycling Interval (Glaze Ice Condition).
13

1000
1-00 1 2 3 4
Particle Size (sq. cm .)
(a) 5 sec
1000
U
a00Z 10
0
1
5 0 1 2 3 4
Particle Size (sq. cm .)
(b) 15 sec
U 100
a0OZ to
5
5
1000
100U
aw00Z to
mU3
10 1 2 3 4
Particle Size (sq. cm .)
(c) 30 sec
1000-7
100U
a0Z 10
1 't
0
m
..m o
1 2 3 4
Particle Size (sq. cm .)
(d) 60 sec
5
14

1000
U 100
C14I-0
0Z 10 ..
'- O
•m o
1
0 1 2 3 4 5
Particle Size (sq. cm .)
(e) 120 sec
Fig. 11. Cycling Time Effects on Ice Particle Size distribution with 480 psi (Glaze Ice Condition).
1000
100U
a0
0Z to
0ED
10 1 2 3 4
Particle Size (sq. cm .)
1000
100Ucda00Z 10
0
M
1
5 0 1 2 3 4
Particle Size (sq. cm .)
5
(a) 5 sec
(b) 15 sec
15
1000 1000
100 2 100U U
a aw wO OO OZ to W z 10
MOOQD
0 1 2 3 4 5 0 1 2 3 4 5
Particle Size (sq. cm .) Particle Size (sq. cm .)
(c) 30 sec
(d) 60 sec
1000
100U
awOOZ 10
aEK
o^
1
0 1 2 3 4 5
Particle Size (sq. cm .)
(e) 120 sec
Fig. 12. Cycling Time Effects on Ice Particle Size distribution with 480 psi (Rime Ice Condition).
16

Form ApprovedREPORT DOCUMENTATION PAGE OMB No. 0704-0188Public reporting burden for this collection of information is estimated to average 1 hour per response, including the time for reviewing instructions, searching existing data sources,gathering and maintaining the data needed, and completing and reviewing the collection of information. Send comments regarding this burden estimate or any other aspect of thiscollection of information, including suggestions for reducing this burden, to Washington Headquarters Services, Directorate for information Operations and Reports, 1215 JeffersonDavis Highway, Suite 1204, Arlington, VA 22202-4302, and to the Office of Management and Budget, Paperwork Reduction Project (0704-0188), Washington, DC 20503.
1. AGENCY USE ONLY (Leave blank) 2. REPORT DATE 3. REPORT TYPE AND DATES COVEREDJune 1992 Technical Memorandum
4. TITLE AND SUBTITLE 5. FUNDING NUMBERS
Results of a Low Power Ice Protection System Test and a New Method ofImaging Data Analysis
WU-505-68-106. AUTHOR(S)
Jaiwon Shin, Thomas H. Bond, and Geert A. Mesander
7. PERFORMING ORGANIZATION NAME(S) AND ADDRESS(ES) 8. PERFORMING ORGANIZATIONREPORT NUMBER
National Aeronautics and Space AdministrationLewis Research Center E-6930Cleveland, Ohio 44135-3191
9. SPONSORING/MONITORING AGENCY NAMES(S) AND ADDRESS(ES) 10. SPONSORING/MONITORINGAGENCY REPORT NUMBER
National Aeronautics and Space AdministrationWashington, D.C. 20546-0001 NASA TM-105745
11. SUPPLEMENTARY NOTESPrepared for the 48th Annual Forum and Technology Display, sponsored by the American Helicopter Society, Washington, D.C., June 3-5,1992. Jaiwon Shin and Thomas H. Bond, NASA Lewis Research Center; Geert A. Mesander, United States Air Force Base, Oklahoma CityAir Logistics Center, Tinker Air Force Base, Oklahoma. Responsible person, Jaiwon Shin, (216) 433-8714.
12a. DISTRIBUTION/AVAILABILITY STATEMENT 12b. DISTRIBUTION CODE
Unclassified -UnlimitedSubject Category 02
13. ABSTRACT (Maximum 200 words)
Tests were conducted under a USAF/NASA Low Power De-icer program on a BF Goodrich De-Icing System'sPneumatic Impulse Ice Protection (PIIP) system in the NASA Lewis Icing Research Tunnel (IRT). Characterizationstudies were done on shed ice particle size by changing the input pressure and cycling time of the PIIP de-icer. Theshed ice particle size was quantified using a newly developed image software package. The tests were conducted ona 1.83 m (6 ft) span, 0.53 m (21 in) chord NACA 0012 airfoil operated at a 4° angle-of-attack. The IRT test condi-tions were a -6.7°C (20 °F) glaze ice, and a -20 °C (-4 °F) rime ice. The ice shedding events were recorded with ahigh speed video system. A detailed description of the image processing package and the results generated from thisanalytical tool are presented here.
14. SUBJECT TERMS 15. NUMBER F PAGES18Low power ice protection system; Ice shedding event; Shed ice particle size;
16. PRICE CODEImage processingA03
17. SECURITY CLASSIFICATION 18. SECURITY CLASSIFICATION 19. SECURITY CLASSIFICATION 20. LIMITATION OF ABSTRACTOF REPORT OF THIS PAGE OF ABSTRACT
Unclassified Unclassified Unclassified
NSN 7540-01-280-5500 Standard Form 298 (Rev. 2-89)Prescribed by ANSI Std. Z39-18298.102

National Aeronautics andSpace Administration
Lewis Research CenterCleveland, Ohio 44135
Official BusinessPenalty for Private Use $300
FOURTH CLASS MAIL
ADDRESS CORRECTION REQUESTEDU.S.MAIL
Postage and Fees PaidNational Aeronautics anSpace AdministrationNASA 451
NASA