nasa contractor report nasa cr-61379 fl^ ft si c · nasa contractor report nasa cr-61379 fl^ ft si...
TRANSCRIPT
NASA CONTRACTORREPORT
NASA CR-61379fL^ ft Si iEa
C f\ D V^^ r^ • j
THE MSFC UNIVAC 1108/EXEC 8
SIMULATION MODEL
By T. Williams, F. M. Richards,J. E. Weatherbee, and L. K. PaulComputer Sciences CorporationField Services Division, Aerospace Systems Center8300 S. Whitesburg DriveHuntsville, Alabama 35802
March 31, 1972
Prepared for
N A S A - G E O R G E C. MARSHALL SPACE FLIGHT C E N T E RMarshall Space Flight Center, Alabama 35812
https://ntrs.nasa.gov/search.jsp?R=19720016561 2018-07-10T09:54:02+00:00Z
TECHNICAL REPORT STANDARD TITLE PAGE
1 . RFf 'ORT NO.
NASA CR-613792. GOVERNMENT ACCESSION MO. 3. RECIPIENT'S CATALOG NO.
4, TITLE AND SUBTITLE
The MSFC UNIVAC 1108/EXEC 8 Simulation Model
5. REPORT DATE
March 31. 19726. PERFORMING ORGANIZATION CODE
7. AUTHOR (S)
T. Williams, F.M. Richards, J.E. Weatherbee, L.K. Paul
8. PERFORMING ORGANIZATION REPORT •»
9. PERFORMING ORGANIZATION NAME AND ADDRESSComputer Sciences CorporationField Services Division, Aerospace Systems Center8300 S. Whitesburg Drive,Huntsville, Alabama 35802
10. WORK UNIT NO.
11. CONTRACT OR GRANT NO.
NAS8-21805
12. SPONSORING AGENCY NAME AND ADDRESS
National Aeronautics and Space AdministrationWashington, D.C. 20546
13. TYPE OF REPORT & PERIOD COVERED
NASA Contractor Report
14. SPONSORING AGENCY CODE
15. SUPPLEMENTARY NOTES
This report defines a model which simulates the MSFC Univac 1108Multiprocessor System. The hardware/operating system is described toa level of detail necessary to enable a good statistical measurementof the system behavior to be made.
The performance of the 1108 is evaluated by performing twenty-four different experiments designed to locate system bottlenecksand also to test the sensitivity of system throughput with respect toperturbation of the various Exec 8 scheduling algorithms.
The model is implemented in the General Purpose System Simulation(GPSS) language and the techniques described can be used to assist inthe design, development and evaluation of new multiprocessor systems.
17. KEY WORDS
Computer System SimulationSimulation ModelSimulatorUNIVAC 1108 EXEC 8
18. DISTRIBUTION STATEMENT
B. Hodges 'Computer Systems DivisionMSFC/Computation Laboratory
Unclassified-unlimited
13. SECURITY CLASS1F. (of this report)
Unclassified
20. SECURITY CLASSIF. (of,this page) ...
Unclassified21. NO. OF PAGES
5922. P R I C E
$3.00
MSFC • Form .?292 (May 1969)
8KOJ T-AST2UJi.il 10 xauTABLE OF CONTENTS
-— )-~&».«™,
C „ 7'
SECTION I
A- 1
S-IISECTION II
£-11
s-ni
S--TTT
d-IIJSECTION III
\~II1
'8 -'III
£-vI
•dj-ySECTION IV
V ] -'.7 •
Pi '[ ^V
Pi-7 • • -SECTION V
OC-iV
,f.S-V -a-tfi;
ss-vSECTION VI
ois.fiffisiba ;m3Dalij|>3 801 i-U 3585-'INTRODUCTION
wed! .orgoJ - 8 S2Xa\S01I OAVIKuA. Overall Flow of Exec 8
3 .3 2 "jadsfiiBijs'? :ls£-.TSIMULATION OF THE U- 1108/8 SYSTEM
no!:!3nw'i uoijird.ri.-ia.Kj x)\ZA. The User Programs
nol:!3i0gl:voo0 sgsioaS 80.11-rB. Executive Overhead
5^oi:;I slgoJ - ssfuisdoB sa-JBoDC. Input/Output
wafi oi§ol ~ ^-DS;;ooIiA 3±ci£0vt!DETAILED SIMULATOR MODULES
3sl:J rforJiwa -j.sif.-3.3AO«lCA. Coarse Scheduler
.wol'S si'^oJ •- -jsiiorj-soaKIB. Dynamic Allocator
noi:tiiaiJrTs¥ l^feoHC. Dispatcher
TJ - £1 eassjsil o3 '^sK'MODEL VERIFICATION
•fi')'a9'iBt.i30xri 'fj3±35i3j3 .raS'3'£'''S fcrja sriBTA. Initial Verification
&3ncJfrjjtsc^';-; Nq - j ^ r~ i i i «t*>-oOBo Further Verification
ajfisfffistscpsJ. fvrt.j^,l«jj 0\1SIMULATOR APPLICATIONS
a^nsrai^sq^E fioi5sslrni:;iBM auodguoicxirA. Introduction
3£U'39oxS '/'S rviJiaflsS /cu^fi&ij.Q si/ixT USDB. Discussion of Results
fesnsmiasciKS 5lMS-i>7l.rils
CONCLUSIONS
Page7-
1-1x?
1-1 '
^II-l,j^
II-lc
II-3,s
II-3i"
III-l8
III-l?
III-l03'
III-311
IV- 1xl
IV-1c '--
IV-1.^.i
V-lCi
V-l>i J
V-23^.i
VI-1
111
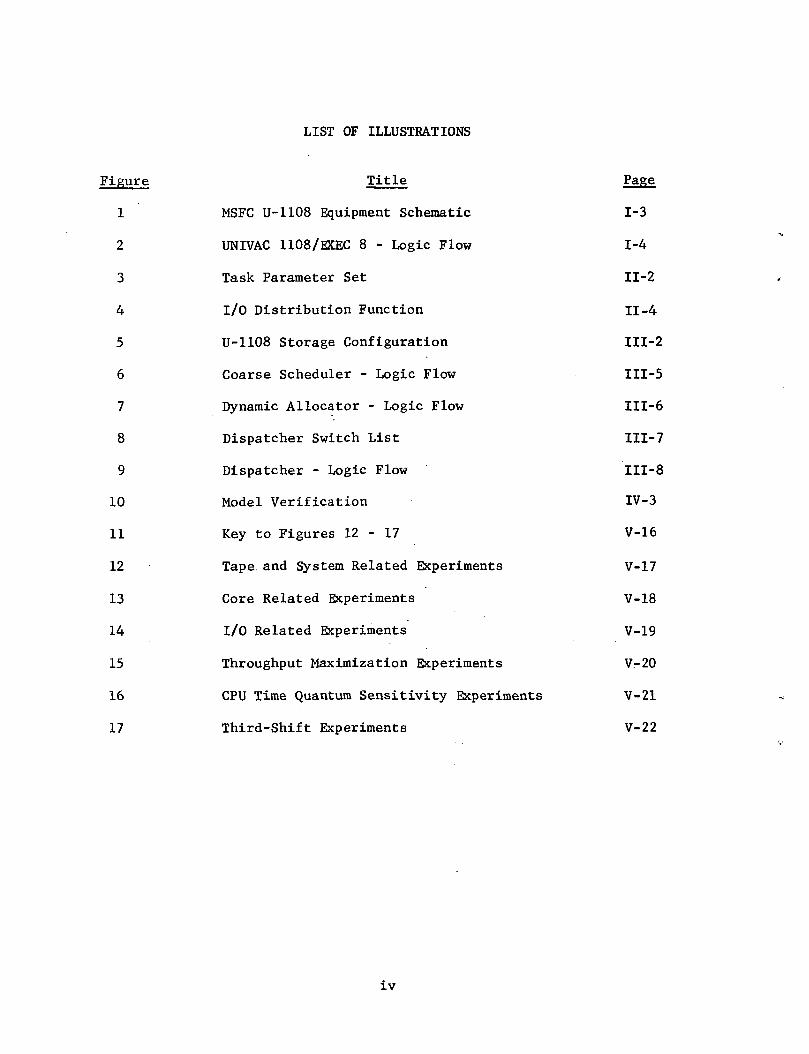
LIST OF ILLUSTRATIONS
Figure Title Page
1 MSFC U-1108 Equipment Schematic 1-3
2 UNIVAC 1108/EKEC 8 - Logic Flow 1-4
3 Task Parameter Set II-2
4 I/O Distribution Function II-4
5 U-1108 Storage Configuration III-2
6 Coarse Scheduler - Logic Flow III-5
7 Dynamic Allocator - Logic Flow III-6
8 Dispatcher Switch List III-7
9 Dispatcher - Logic Flow III-8
10 Model Verification IV-3
11 Key to Figures 12 - 17 V-16
12 Tape and System Related Experiments V-17
13 Core Related Experiments V-18
14 I/O Related Experiments V-19
15 Throughput Maximization Experiments V-20
16 CPU Time Quantum Sensitivity Experiments V-21
17 Third-Shift Experiments V-22
iv
UNUSUAL TERMS
1. GPSS HELP Block - GPSS command which transfers controlto the user provided HELP subroutine.
2. GPSS Parameter - Attributes of GPSS transaction.
3. GPSS Transaction - The unit of traffic processed by thesimulator.
4. MAXOPEN - UNIVAC 1108/EXEC 8 system parameterwhich limits the number of concurrentactive runs.
5. THRPUT Program - Software monitor of U-1108/8
NONSTANDARD ABBREVIATIONS
1. U-1108 - UNIVAC 1108
2. U-1108/8 - UNIVAC 1108/EXEC 8
3. R,,E0S.T. - Run Entered System Time
vi
ACKNOWLEDGMENT
The authors wish to acknowledge Dr. H. Kerner (S&E-COMP-C), theinitiator of the project, for his help and guidance during the manydiscussions and planning sessions held during the course of the work.Thanks is also due to the Project Monitor, Mr. B. Hodges (S&E-COMP-C),for his helpful contributions made throughout the project and in pre-paration of this report.
vii
SUMMARY
To gain experience in simulating a large multiprocessorcomplex, a deterministic throughput model of the MSFC UNIVAC 1108has been developed. The model simulates the MSFC UNIVAC 1108 whenprocessing a stream of programs under the EXEC 8 operating system.
As well as determining the system throughput for a givenload, the simulator allows the interaction between the various userprograms and the executive operating algorithms to be examined indetail. Hence, bottlenecks and hardware/software mismatches can beidentified and experimentally resolved.
The simulator input is a stream of tasks generated fromthe system accounting tape and the console log. These tasks re-presented by attributes such as priority, core and central process-ing unit (CPU) time requirements, are used to construct an inputrunstream having the same characteristics as the actual runstream.This runstream is stored on a tape (JOBTAPE) and is used as thedriving mechanism for the simulator.
The simulation model is coded in the general purposesimulation language, GPSS, and FORTRAN. GPSS was chosen for itssuitability to throughput-type investigations.
The milestones of each run's life cycle, as it movesthrough the UNIVAC 1108/EXEC 8 (U-1108/8) system, involve input,facility acquisition, core allocation, processor access, and finallyprogram generated output. These milestones are achieved via the vari-ous EXEC 8 components: Card Read Symbiont, Coarse Scheduler, DynamicAllocator, Dispatcher, and the Print and/or Punch Symbionts.
Each of these modules has been implemented in the simulatorand interconnected to form a deterministic model of the overall U-1108/8system.
An important component of the model is the load imposed uponthe system by the execution of EXECUTIVE tasks. This represents thecollection of all tasks which EXEC 8 must perform during the course ofprocessing a given stream of user tasks. Since neither the AccountingLog Tape nor the THRPUT program collects sufficient data to provideprecise inputs for the simulator in this area, it was arbitrarily de-cided to create one EXEC task for each of the user tasks within agiven runstream. The primary function of such EXEC tasks is to placean additional load upon the CPU's and I/O subsystems within the model,thereby delaying the execution of user tasks as in the actual system.
For each run processed by the simulator, two times arerecorded: (a) The run-entered-system-time, Te, which is the time therun card is read by a card-reader, and (b) the termination time, Tt,
viii
the time at which the run completes execution. Both these times arerecorded on the system log. The run-entered-system-time may be usedas the parameter which provides the arrival pattern of runs to thesimulator. Tt is then determined for each run processed by the simu-lator and can be compared with the times logged on the system accountingtape.
The simulator may also be monitored at many internal pointsto give such system parameters as core utilization, CPU utilization,channel utilization, channel waiting times, etc.
The model was verified by comparing its measured performancewith that of the actual U-1108/8 system as recorded oh the accountingtape.
Using a generalized job-mix, a series of experiments wascarried out on the simulator. These experiments were designed tolocate system bottlenecks and also to test the sensitivity of systemthroughput with respect to perturbation of the various Exec 8 schedulingalgorithms. A major system bottleneck was located, and two differentsolutions for its removal are identified.
ix
SECTION I. INTRODUCTION
To gain experience in simulating a large multiprogramming/multiprocessor computer environment, a deterministic throughput modelof the MSFC UNIVAC 1108 system has been developed. This model simu-lates the MSFC UNIVAC 1108 when processing a stream of runs under theEXEC 8 operating system.
The simulator allows the interaction between the varioususer programs, the executive scheduling algorithms, and the configur-ation hardware elements to be examined in detail. Because of thiscapability, algorithm and/or hardware changes may be studied and evalu-ated with the simulator and not require actual system implementation.
The simulator input is a stream of runs sampled from actualinstallation accounting data. This input-stream is defined in terms ofattributes such as run priority, number of tapes, task core requirements,task CPU time requirements, and the number of task I/O references (seeFigure 3).
The simulation model, presently implemented on the UNIVAC 1108,is coded in the general purpose simulation language, GPSS, and FORTRAN.
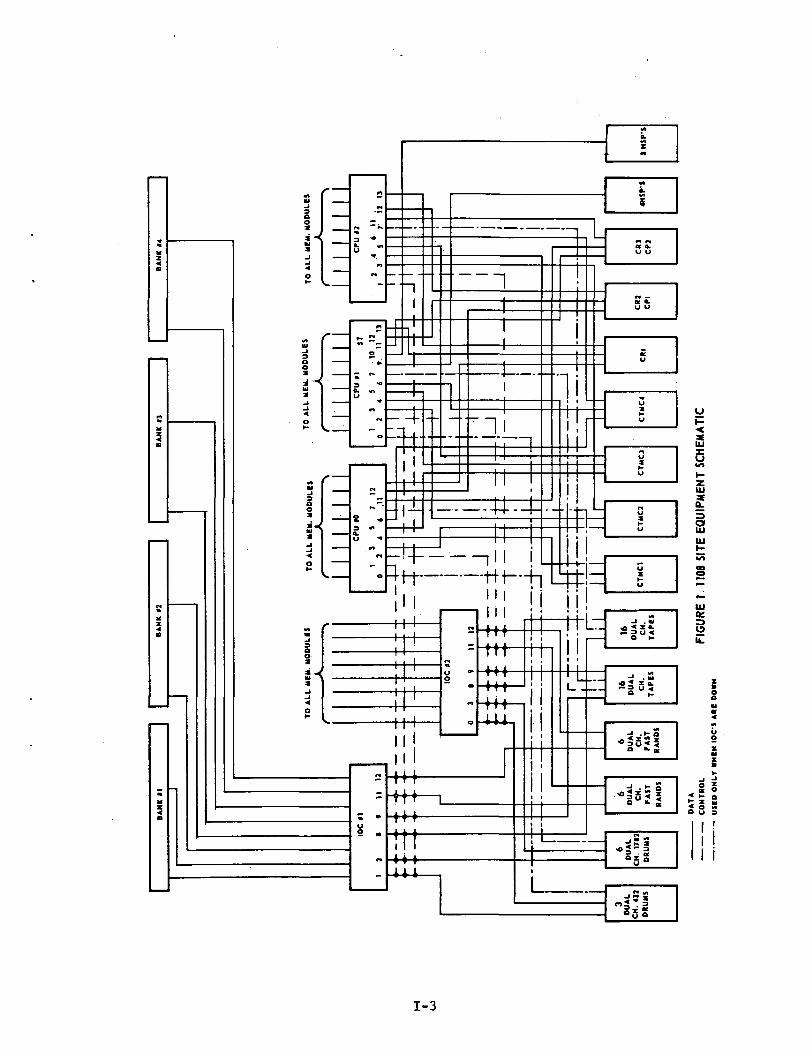
Figure 1 describes the MSFC UNIVAC 1108 hardware configuration.
A. Overall Flow of Exec 8
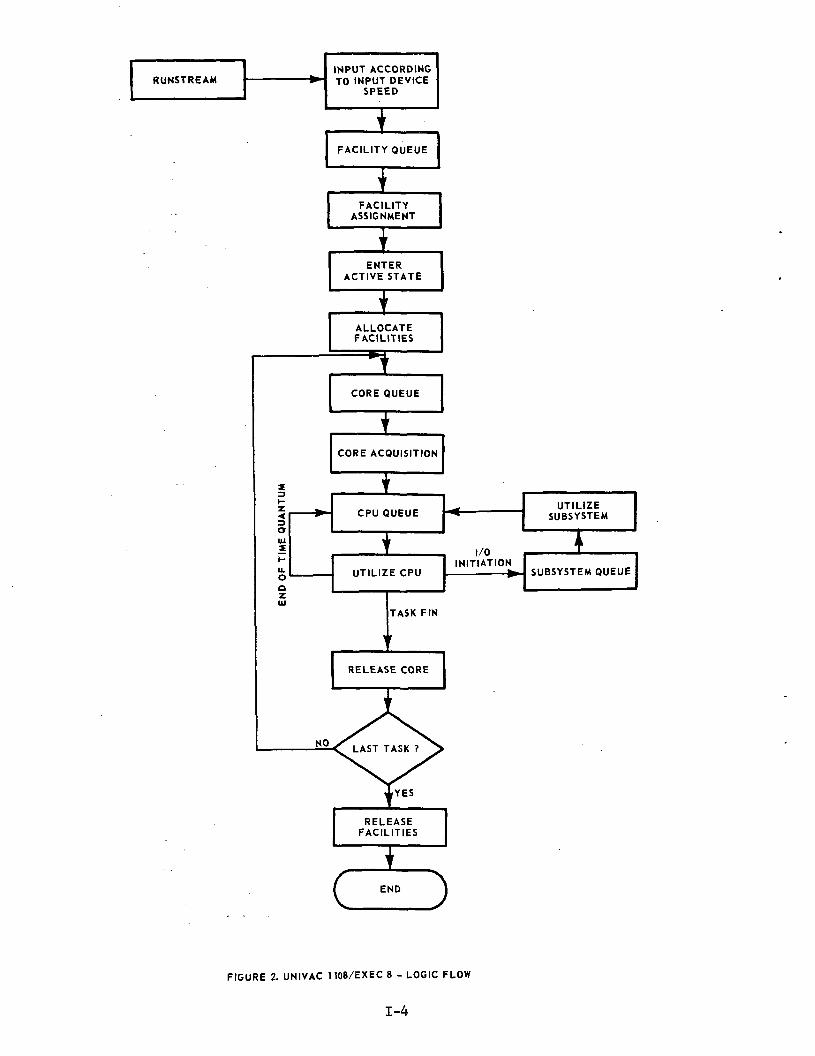
Figure 2 depicts the abbreviated logic flow for a run as itmoves through the UNIVAC 1108/EXEC 8 (U-1108/8) system. The milestonesof each run's life cycle involve run card-deck input, facility acquisi-tion, core allocation, and processor utilization. These milestones areachieved via the various EXEC 8 components: Input Symbionts, CoarseScheduler, Dynamic Allocator and Dispatcher, respectively. EXEC 8 alsosupervises all I/O requests to and from the peripheral subsystems. Eachrun arrives in the form of a punched card deck, the card images beingtransferred to a run file on mass storage as the deck is input on eitherthe Communications Terminal Module Controller (CTMC) or Central SiteCard Reader. The runs are ordered in a run queue according to runpriority.
The run having the earliest Run Entered System Time (R.E.S.T.)within the highest priority class of the run queue is examined for thepurpose of acquiring the necessary mass storage and tape drives whichwill be required during execution. This examination is provided by theCoarse Scheduler, assignment being made only when all such facilityrequirements can be met simultaneously. If this condition cannot bemet the next run within that priority class is considered by the
1-1
Coarse Scheduler. No run from a lower priority class can requestfacilities until the higher priority class has been satisfied. Whenthe required facilities are assigned the run becomes eligible toenter the active state. This active state is entered only if one ofthe following criteria can be satisfied:
1) a. The active state limit (MAXOPEN)has not been exceeded, and
b. no tasks are in the core queue.
2) The run is of demand status.
Once active, the facilities are allocated to the run and task 1enters the core queue, where the Dynamic Allocator attempts toassign the I-bank and D-bank core requirements. Since tasks ofmultiple runs exist in the core queue concurrently, tasks are con-sidered by the Dynamic Alloca; ;;: in order of their priority. Uponallocation of core the task proceeds to the CPU queue. However, ifcore requirements cannot be met, the task remains in the core queuepending the release of core by the termination of an active task.The functions of the Dynamic Allocator are illustrated in Figure 7.
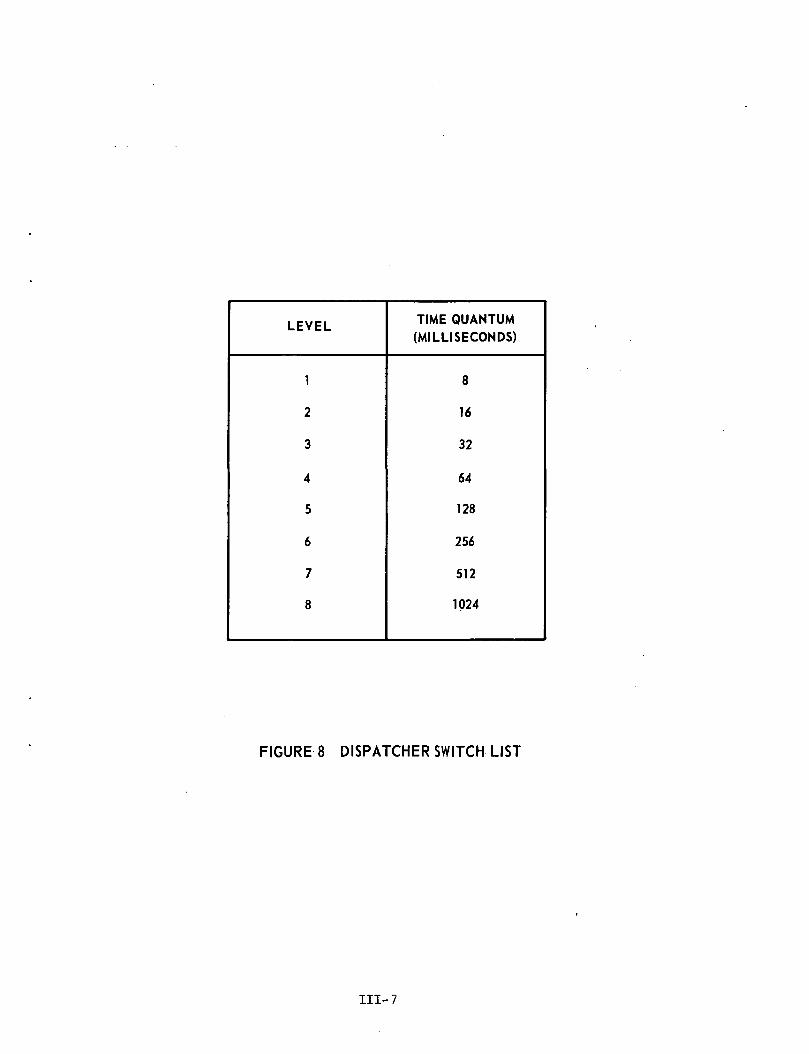
The Dispatcher is the routine through which EXEC 8 accompli-shes its time-sharing processes. The Dispatcher uses an eight-levelswitch list (see Figure 8) to coordinate the activities of all thetasks which are resident in core. This mechanism allows CPU's to beassigned to and released from specific task execution as variousevents and contingencies arise (e.g., I/O initiations).
A task will lose control of a CPU in favor of another taskat the currently lowest switch list level either upon expiration ofa set time quantum, completion of the task's CPU requirements, or byvoluntarily releasing control of a CPU while awaiting completion ofan I/O request. On completion of the I/O request the task will enterthe CPU queue at the lowest switch list level for which it is eligible.
The Dispatcher switches control according to the currentstructure of the list, always yielding to a task at the currentlylowest switch list level.
The CPU time quantum has a value of 8 milliseconds forlevel 1, and is doubled for each subsequent level up to a maximum of1.024 seconds at level 8.
Batch-type runs enter the list at level 2.
1-2
*za
i
M
S
IU
2
^ JIU
<
O
3a0
IU-JO
^ JIU
-1
o•fr-
IU
o
* -«l
J•4
O
-^_
— _
k _
^
-.__3 •"
•
~
0,"
a
3 *
U
"*
w
o
^"~-
a- _
•
e
-
X
„
--
J-— 1
-3m\
\\
=h
-H
I
4-f-i
i-|~
*+-
Hf-
~u2
M
""
-
»*
"
_
.
1
"H
iT
-*-,1
-T"*
-h
-H4
~1
_ _
.
H
hH;
i—
-
1
—]T~
fl
4— I
'-1
1
IL_
f—
-
!
iiiiin
fl
-H
1
"
n
-
-
I ,
E
--
:-
._
L
•-
Mt
b.X
Mt
a.
*
oe a.u u
r-4 —
U U
U
u
u
n
H
„
^
H
U
U
S < ± B.
-1 ""
S| 5i
„•°35<1
fc "
< -h s
•"guj 5
«<S|iz o
* " '
<'5"2«l
y<xot/».H
uQ.
IUIU
wtaeO
IUoe.Ou.
zoM
M
O
M
o z
^sQ U 3
i ;1 1i i
1-3
RUNSTREAM
UTILIZESUBSYSTEM
1SUBSYSTEM QUEUE
FIGURE 2. UNIVAC 1108/EXEC 8 - LOGIC FLOW
1-4
SECTION II. SIMULATION OF THE U-1108/8 SYSTEM
The preceding section summarized the U-1108/8 system andthe remainder of the report describes how this system was modelledin order to obtain a statistical measure of system throughput,,
In order to illustrate the level of detail of the simu-lation it is appropriate at this point to describe the method ofsynthesizing a mix of jobs which form the workload to be processedby the simulated system,
A. The User Programs
Actual data collected from the MSFC U-1108 accounting tapesand the corresponding console typewriter facility assignment recordsare used to fabricate realistic runstream inputs to the simulationmodelo This section describes the construction of this runstream.A computerized procedure has been developed to digest accountingtapes and create run tables over preselected time intervals corres-ponding to the three shifts operated at MSFC. The runstream is thenconstructed by randomly sampling the run table corresponding to aparticular shift. The set of run attributes includes:
1) Priority2) Number of input cards3) Number of tasks4) Input mode (on-site or remote)5) Number of tapes6) Demand status
The set of task attributes includes:
1) I-bank core requirements2) D-bank core requirements3) CPU time requirements4) Number of I/O references
These attributes differ markedly from shift to shift due to the differ-ent nature of the data processing performed and hence three run tablesare necessary.
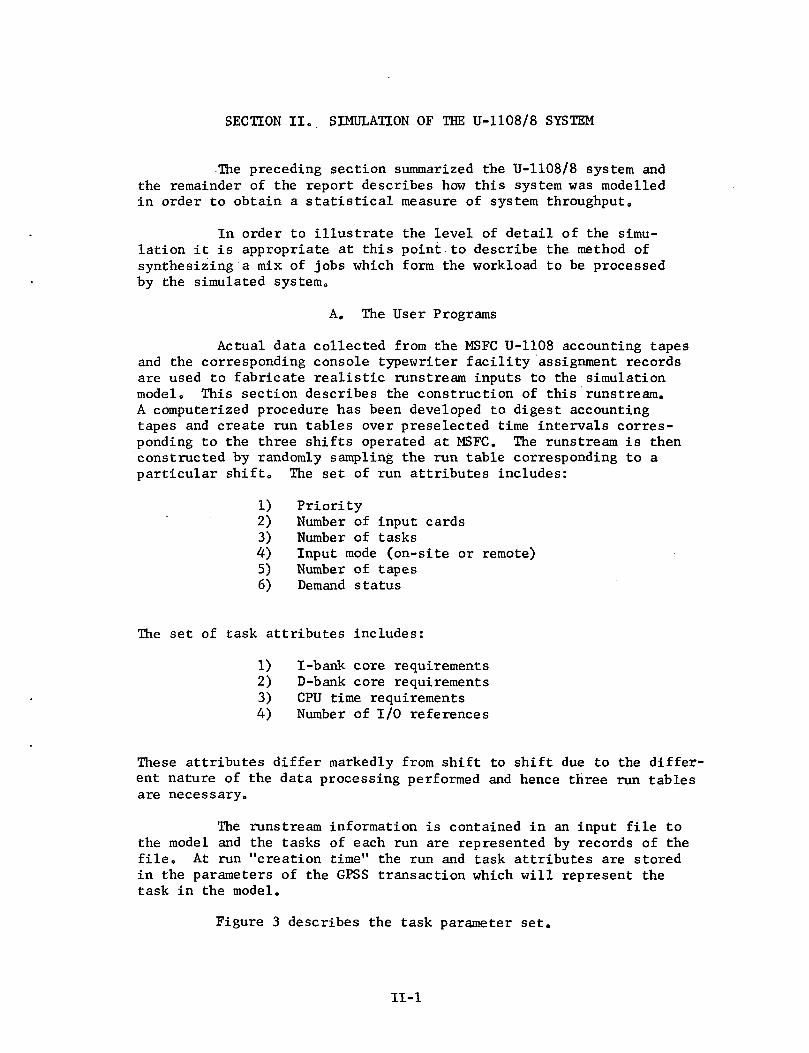
The runstream information is contained in an input file tothe model and the tasks of each run are represented by records of thefile. At run "creation time" the run and task attributes are storedin the parameters of the GPSS transaction which will represent thetask in the model.
Figure 3 describes the task parameter set.
II-l
PARAMETER DESCRIPTION
1 Run Identification Number
2 Task Identification Number
3 Number of Tapes Required
4 Total Number of Tasks in Run
5 Run Priority
6 Demand Status:
1 =^ Demand, 0 =^ Not Demand
7 Number of Input Cards to Run
8 Run's Input Mode:
0 =^ Central Site, 1 =^ Remote Terminal
9 Task I-Bank Core Requirements
10 Task D-Bank Core Requirements
11 Number of I/O References
13,14 Task CPU Time (in milliseconds)
FIGURE 3. TASK PARAMETER SET
II-2
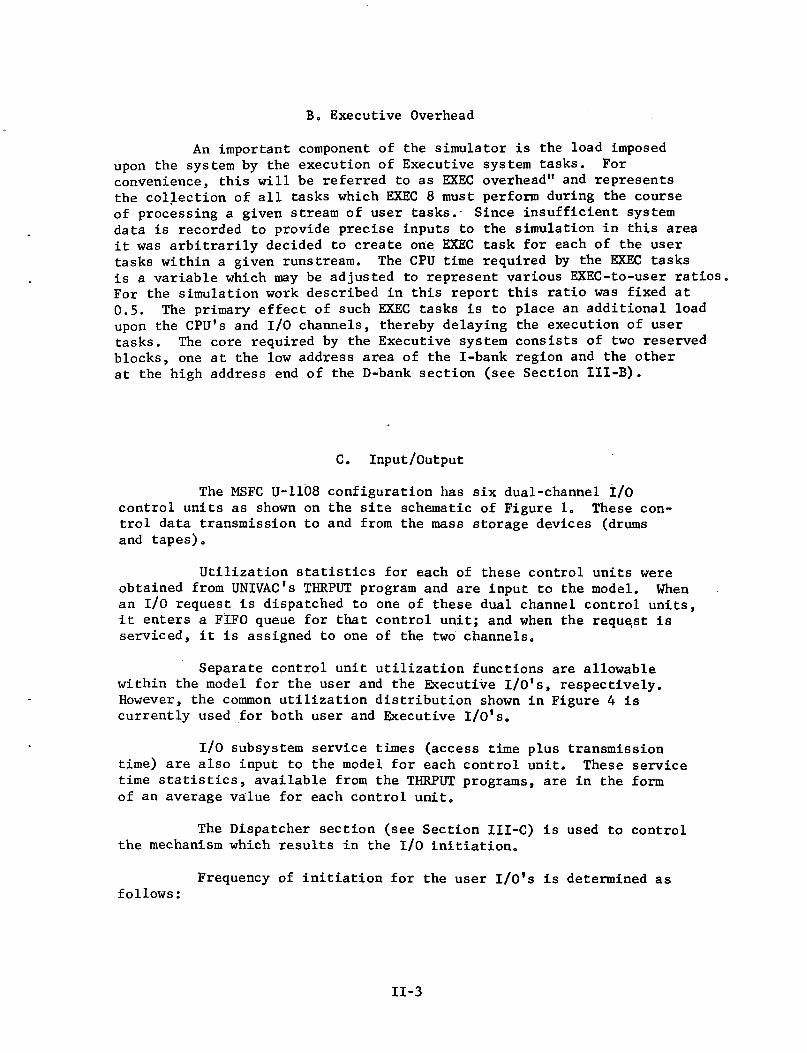
B. Executive Overhead
An important component of the simulator is the load imposedupon the system by the execution of Executive system tasks. Forconvenience, this will be referred to as EXEC overhead" and representsthe collection of all tasks which EXEC 8 must perform during the courseof processing a given stream of user tasks. Since insufficient systemdata is recorded to provide precise inputs to the simulation in this areait was arbitrarily decided to create one EXEC task for each of the usertasks within a given runstream. The CPU time required by the EXEC tasksis a variable which may be adjusted to represent various EXEC-to-user ratios,For the simulation work described in this report this ratio was fixed at0.5. The primary effect of such EXEC tasks is to place an additional loadupon the CPU's and I/O channels, thereby delaying the execution of usertasks. The core required by the Executive system consists of two reservedblocks, one at the low address area of the I-bank region and the otherat the high address end of the D-bank section (see Section III-B).
C. Input/Output
The MSFC U-1108 configuration has six dual-channel I/Ocontrol units as shown on the site schematic of Figure 1. These con-trol data transmission to and from the mass storage devices (drumsand tapes).
Utilization statistics for each of these control units wereobtained from UNIVAC's THRPUT program and are input to the model. Whenan I/O request is dispatched to one of these dual channel control units,it enters a FIFO queue for that control unit; and when the request isserviced, it is assigned to one of the two channels.
Separate control unit utilization functions are allowablewithin the model for the user and the Executive I/0's, respectively.However, the common utilization distribution shown in Figure 4 iscurrently used for both user and Executive I/0's.
I/O subsystem service times (access time plus transmissiontime) are also input to the model for each control unit. These servicetime statistics, available from the THRPUT programs, are in the formof an average value for each control unit.
The Dispatcher section (see Section III-C) is used to controlthe mechanism which results in the I/O initiation.
Frequency of initiation for the user I/0's is determined asfollows:
II-3
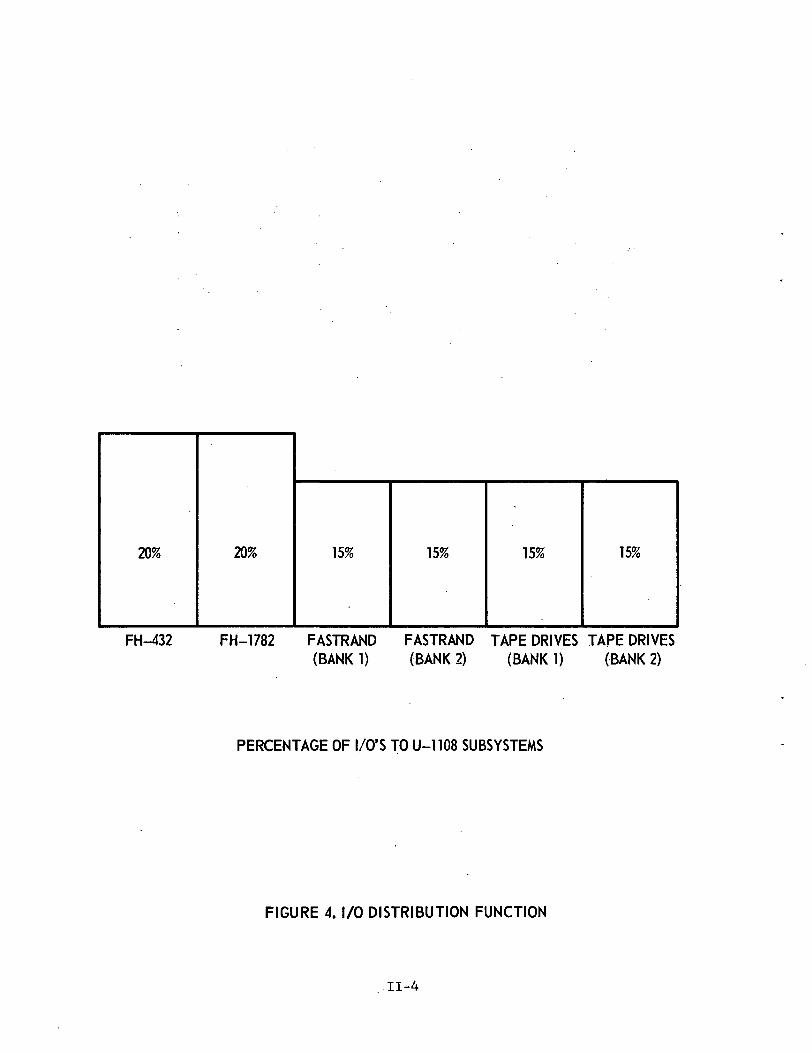
20% 20% 15% 15% 15% 15%
FH-432 FH-1782 FASTRAND FASTRAND TAPE DRIVES TAPE DRIVES(BANK1) (BANK 2) (BANK 1) (BANK 2)
PERCENTAGE OF I/O'S TO U-1108 SUBSYSTEMS
FIGURE 4. I/O DISTRIBUTION FUNCTION
.11-4
Each task has associated with it a number of I/O referencesobtained from accounting tape statistics. This number of I/O initia-tions will occur during the life of the task and are assumed to beperiodic with respect to the task's CPU time. Hence, if a task hasn I/0's and requires m milliseconds of CPU time, an I/O periodp = m/n milliseconds is computed. For the cases where p<l, p isset to 1, since the model's basic time unit is 1 millisecond.
Frequency of initiation for Executive I/0's, however, ishandled in a different manner; at the model user's option an arrivalfunction may be specified and all Executive tasks will conform to thisinitiation pattern. Current implementation utilizes an average EXECI/O initiation rate whose value was determined by experiment with thesimulator. The EXEC I/O initiation rate selected was that which madethe simulated CPU utilization figure match that of the actual system asgiven by the THRPUT program.
The "number of I/O references" mentioned above is a measureof physical I/O activity on the mass storage devices. Since, however,the periodic frequency of the I/0's is determined by the executingprograms, a blocking factor on the physical I/0's is allowed to convertthem to program-oriented or logical I/0's.
II-5
SECTION III. DETAILED SIMULATOR MODULES
A. Coarse Scheduler
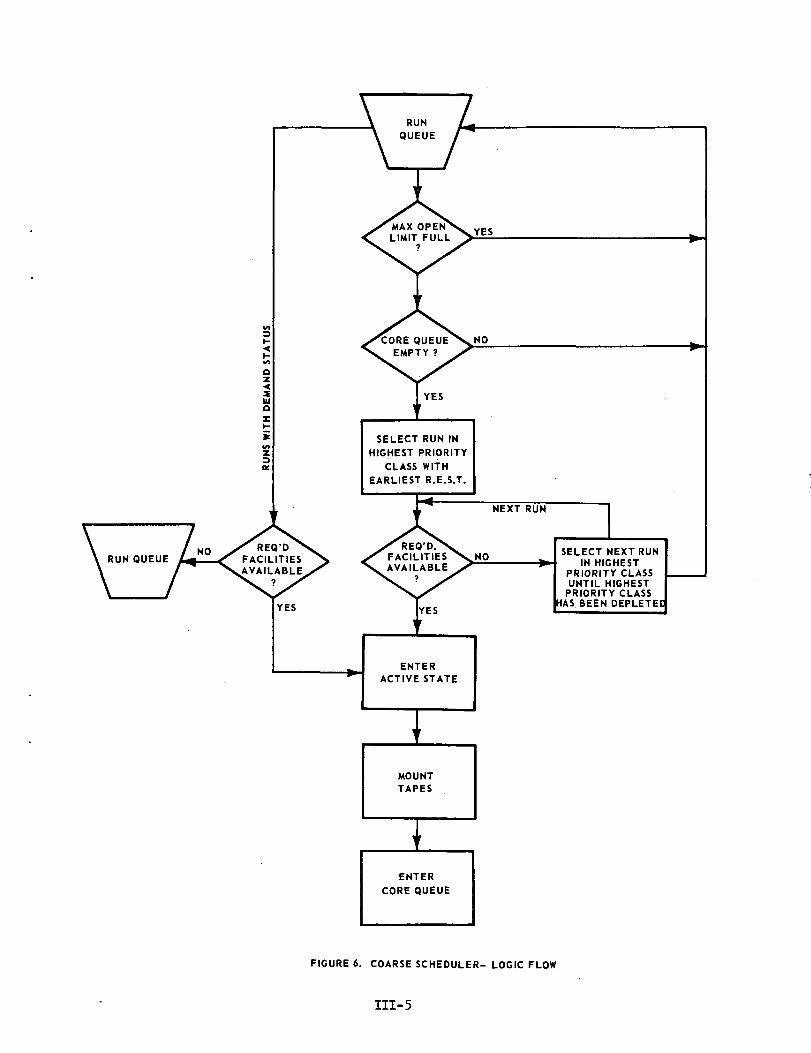
The Coarse Scheduler is an executive function responsiblefor the assignment of peripheral devices and the introduction of newruns into the operating environment. The only peripheral deviceswhich the simulator is concerned with, for purposes of allocation,are the tape drives. Figure 6 presents the logic flow for theCoarse Scheduler. According to run type there are two paths throughthe Coarse Scheduler. Those runs of demand status which enter therun queue are allowed to enter the active state immediately if theirfacilities are available. Runs of batch status must satisfy the twoconditions:
1) The Maxopen limit would not be exceeded, and
2) the core queue must be empty.
That batch run with the earliest Run Entered System Time (R.E.S.T.) inthe highest priority class is selected. If its facility requirementscan be met it enters the active state and its facilities are allocated.If its facility requirements cannot be met, it returns to the run queueand the run with the next earliest R.E.S.T. within the highest priorityclass attempts to procure its facilities. This procedure goes on untila run is able to satisfy'its facility requirements.
B; Dynamic Allocator
Memory is acquired on a per task basis according to R.E.S.T.within a priority class. The Dynamic Allocator has the function ofefficiently assigning core space and maintaining a memory map. This in-cludes the tasks of allocating available memory when requested and makingit available for reallocation when released.
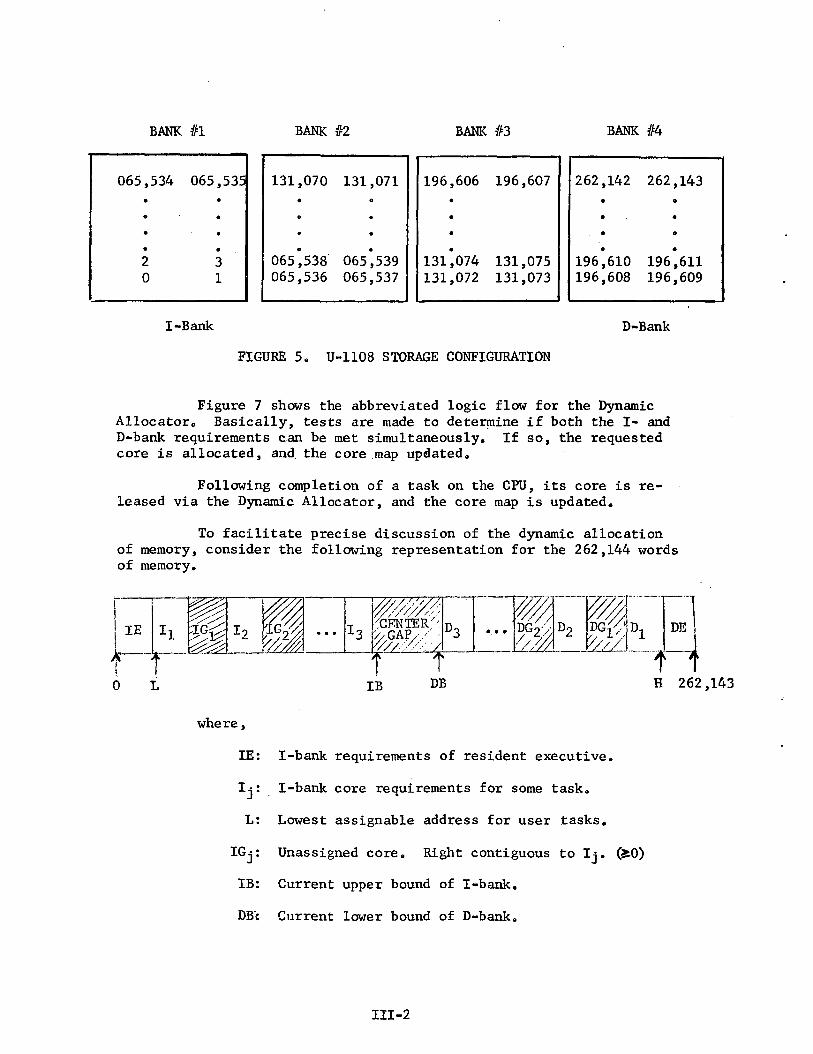
Main storage on the U-1108 is configured as shown in Figure 5.There are four banks of memory, each consisting of 65,536 words. Thesebanks, although subdivided into odd/even storage locations to facilitateinterleaving operations, constitute contiguous storage of instructions(I-bank) from location 0 upward, and storage of data (D-bank) fromlocation 262,143 downward. Core is allocated from these extremitiestoward the middle by a "collision" process. EXEC 8 operating systemroutines reside in locations 0 up to 24,590 (I-bank) and from 217,111 upto 262,143 (D-bank). The Dynamic Allocator insures orderly utilizationof the "gap" from 24,591 through 217,110.
III-l
BANK #1 BANK #2 BANK #3 BANK #4
065,534 065,535• •
o - •
• - •
• •
2 30 1
131,070 131,071• 0
o •
* •
065°, 538 065 ',539065,536 065,537
196,606 196,607•
•
•
131*,074 131,075131,072 131,073
262,142 262,143o o
• - •
• o
196,610 196,611196,608 196,609
I-Bank D-Bank
FIGURE 5. U-1108 STORAGE CONFIGURATION
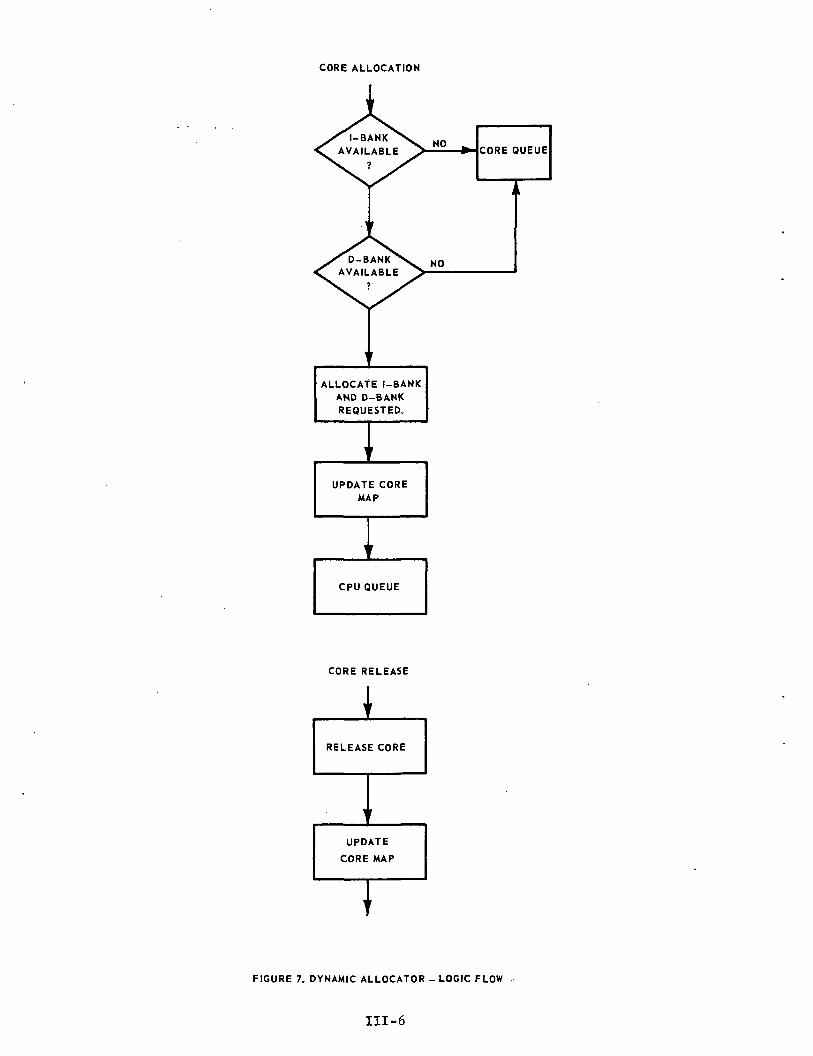
Figure 7 shows the abbreviated logic flow for the DynamicAllocator,, Basically, tests are made to determine if both the I- andD-bank requirements can be met simultaneously. If so, the requestedcore is allocated, and the core map updated.
Following completion of a task on the CPU, its core is re-leased via the Dynamic Allocator, and the core map is updated.
To facilitate precise discussion of the dynamic allocationof memory, consider the following representation for the 262,144 wordsof memory.
IE
—k-
L
•iy/m/CFNTER''GAP/,/
TIBTDB
TinJJ\JO / J
t2MDGi&ii DE
t\
H 262,143
where,
IE: I-bank requirements of resident executive.
1^: I-bank core requirements for some task.
L: Lowest assignable address for user tasks.
IGj: Unassigned core. Right contiguous to Ij. (iO)
IB: Current upper bound of I-bank.
DB; Current lower bound of D-bank.
III-2
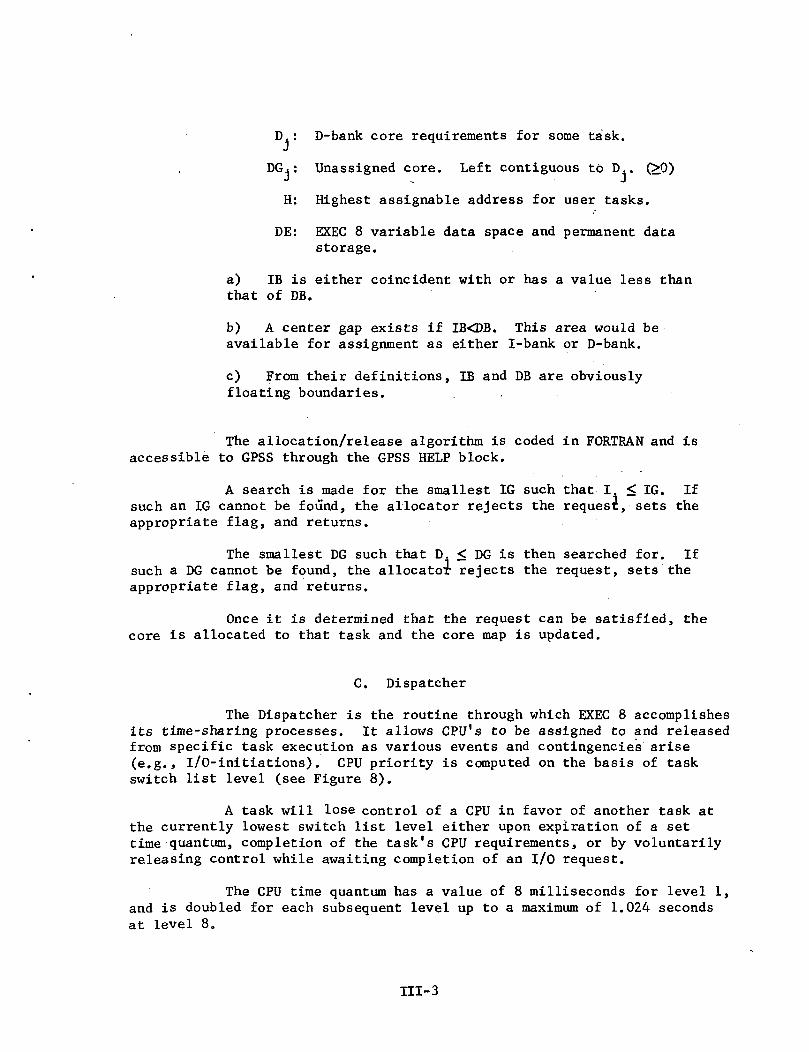
D.: D-bank core requirements for some task.
DG.= : Unassigned core. Left contiguous to D.. (>0)
H: Highest assignable address for user tasks.
DE: EXEC 8 variable data space and permanent datastorage.
a) IB is either coincident with or has a value less thanthat of DB.
b) A center gap exists if IB<DB. This area would beavailable for assignment as either I-bank or D-bank.
c) From their definitions, IB and DB are obviouslyfloating boundaries. . ,
The allocation/release algorithm is coded in FORTRAN and isaccessible to GPSS through the GPSS HELP block.
A search is made for the smallest IG such that I. < IG. Ifsuch an IG cannot be found, the allocator rejects the request, sets theappropriate flag, and returns.
The smallest DG such that D. < DG is then searched for. Ifsuch a DG cannot be found, the allocator rejects the request, sets theappropriate flag, and returns.
Once it is determined that the request can be satisfied, thecore is allocated to that task and the core map is updated.
C. Dispatcher
The Dispatcher is the routine through which EXEC 8 accomplishesits time-sharing processes. It allows CPU's to be assigned to and releasedfrom specific task execution as various events and contingencies arise(e.g., I/0-initiations). CPU priority is computed on the basis of taskswitch list level (see Figure 8).
A task will lose control of a CPU in favor of another task atthe currently lowest switch list level either upon expiration of a settime quantum, completion of the task's CPU requirements, or by voluntarilyreleasing control while awaiting completion of an I/O request.
The CPU time quantum has a value of 8 milliseconds for level 1,and is doubled for each subsequent level up to a maximum of 1.024 secondsat level 8.
Ill-3
Batch-type runs enter the list at level 2.
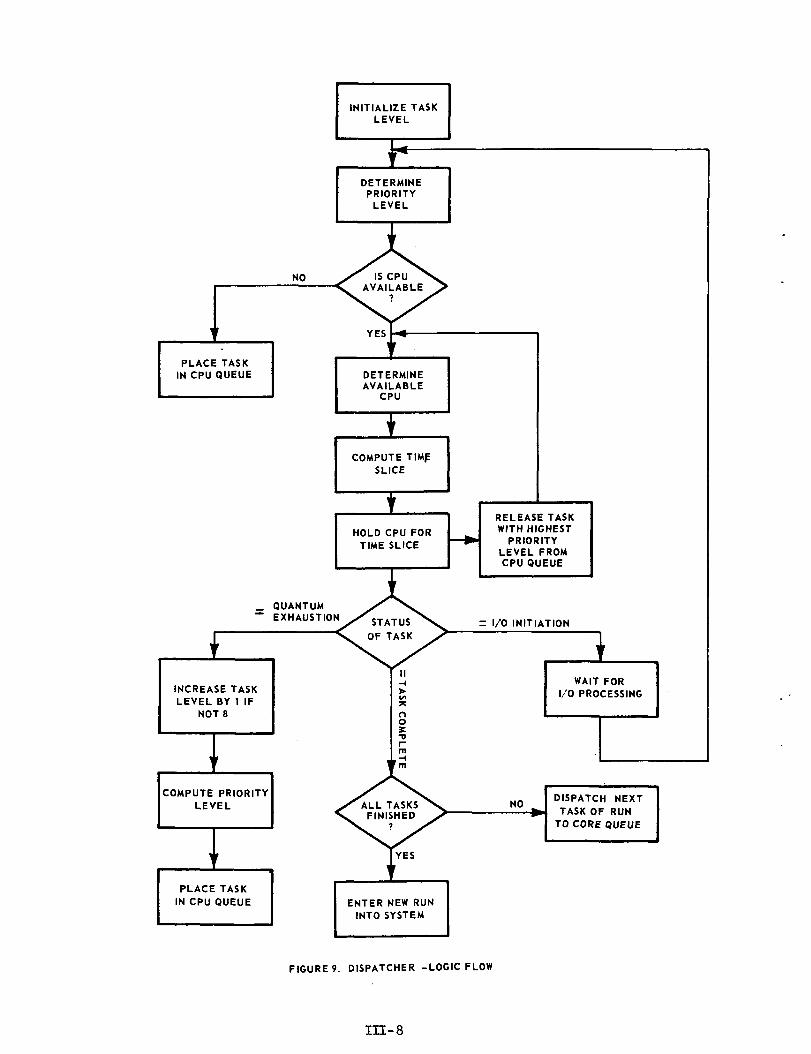
The Dispatcher module in the simulator performs a triplefunction in determining:
1) which CPU will be allocated to a particular task,
2) which of three events will terminate the task's currenttenure on the CPU, and
3) the duration of the time slice.
The three events that can terminate a time slice are:
(a) completion of a time quantum,
(b) initiation of an I/O request by the task, or
(c) completion of the task's CPU time requirements.
If (a) is the case, the task will utilize the assigned CPU forthe appropriate time quantum, and then reenter the CPU queue at a switchlist level one greater than before (up to a maximum level of 8). In thecase of event (b) the task will remain in execution until the I/O initiationand then enter a statistically determined I/O subsystem queue. Upon accessto the subsystem the task utilizes it for a statistically determinedamount of service time, and then reenters the CPU queue at the lowestswitch list level for which it is eligible. In the case of event (c), thetask will rui-lut its r; ' •v.ng time on the selected CPU, release the coreassociated with it, and Q^ -ch the next task of the run to the corequeue. When the last task of a run completes, the facilities for that runare released and the run terminates.
The Dispatcher logic flow is illustrated in Figure 9.
III-4
YES
SELECT RUN INHIGHEST PRIORITY
CLASS WITHEARLIEST R.E.S.T.
REQ'D.FACILITIESAVAILABLE
REQ'DFACILITIESAVAILABLE
SELECT NEXT RUNIN HIGHEST
PRIORITY CLASSUNTIL HIGHEST
PRIORITY CLASSHAS BEEN DEPLETED
FIGURE 6. COARSE SCHEDULER- LOGIC FLOW
III-5
CORE ALLOCATION
ALLOCATE I-BANKAND D-BANKREQUESTED.
UPDATE COREMAP
CPU QUEUE
CORE RELEASE
RELEASE CORE
UPDATE
CORE MAP
TFIGURE 7. DYNAMIC ALLOCATOR - LOGIC FLOW
III-6
LEVEL
1
2
3
4
5
6
7
8
TIME QUANTUM(MILLISECONDS)
8
16
32
64
128
256
512
1024
FIGURES DISPATCHER SWITCH LIST
III-7
INITIALIZE TASKLEVEL
DETERMINEPRIORITY
LEVEL
NO
PLACE TASKIN CPU QUEUE DETERMINE
AVAILABLECPU
HOLD CPU FORTIME SLICE
_ QUANTUM— EXHAUSTION
INCREASE TASKLEVEL BY 1 IF
NOT 8
RELEASE TASKWITH HIGHEST
PRIORITYLEVEL FROMCPU QUEUE
= I/O INITIATION
COMPUTE PRIORITYLEVEL
1WAIT FOR
I/O PROCESSING
PLACE TASKIN CPU QUEUE
NO DISPATCH NEXTTASK OF RUN
TO CORE QUEUE
ENTER NEW RUNINTO SYSTEM
FIGURE 9. DISPATCHER -LOGIC FLOW
IH-8
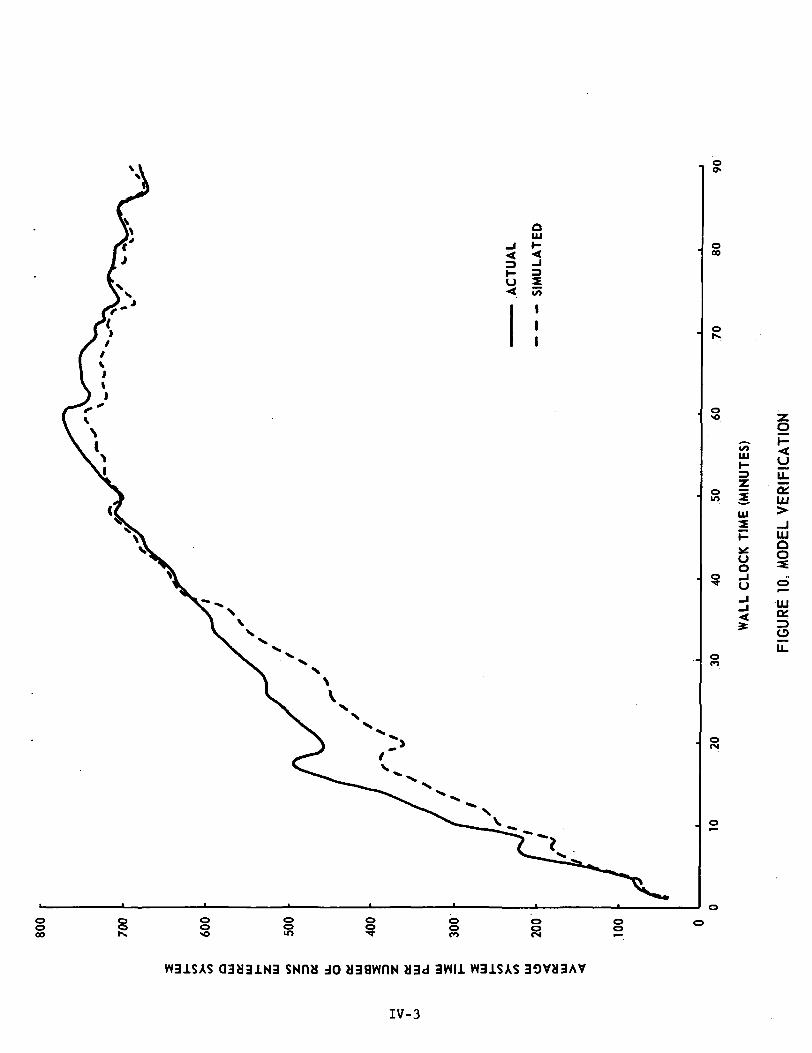
SECTION IV. MODEL VERIFICATION
A. Initial Verification
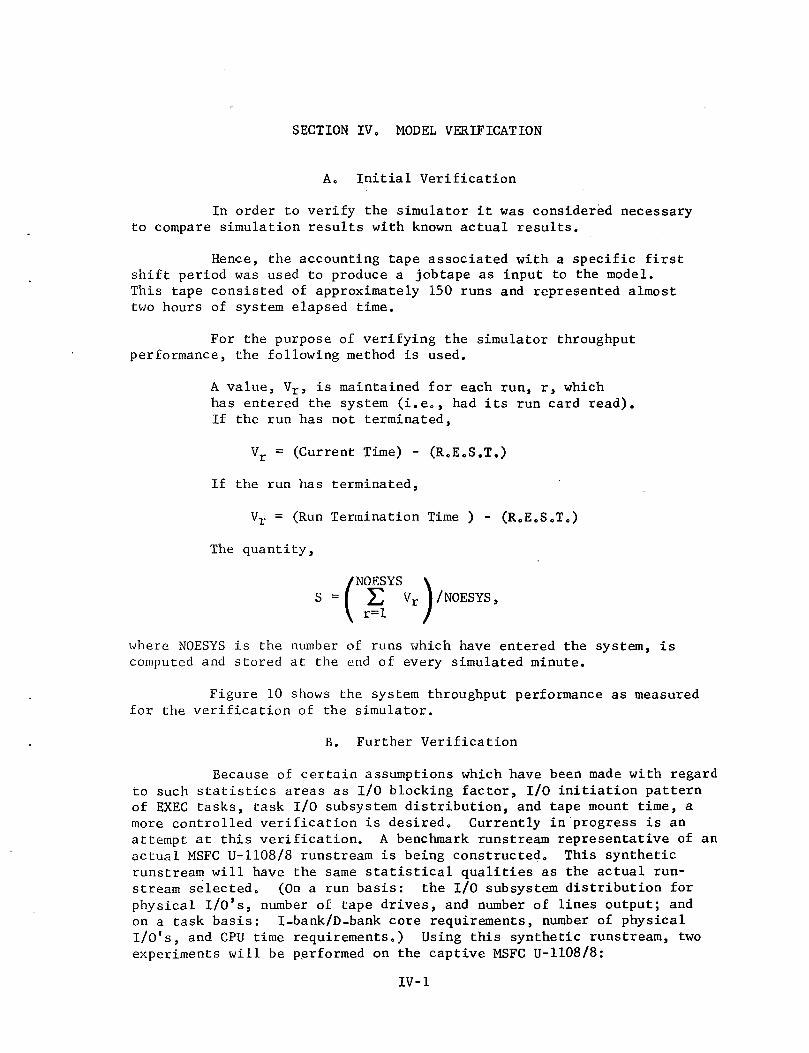
In order to verify the simulator it was considered necessaryto compare simulation results with known actual results.
Hence, the accounting tape associated with a specific firstshift period was used to produce a jobtape as input to the model.This tape consisted of approximately 150 runs and represented almosttwo hours of system elapsed time.
For the purpose of verifying the simulator throughputperformance, the following method is used.
A value, Vr, is maintained for each run, r, whichhas entered the system (i.e., had its run card read).If the run has not terminated,
Vr = (Current Time) - (R.E.S.T.)
If the run has terminated,
Vr = (Run Termination Time ) - (R.E.S.T.)
The quantity,
/NO.RSYS(NOESYS \£ Vr 1/NOESYS,r-1 /
where NOESYS is the number of runs which have entered the system, iscomputed and stored at the end of every simulated minute.
Figure 10 shows the system throughput performance as measuredfor the verification of the simulator.
B. Further Verification
Because of certain assumptions which have been made with regardto such statistics areas as I/O blocking factor, I/O initiation patternof EXEC tasks, task I/O subsystem distribution, and tape mount time, amore controlled verification is desired. Currently in progress is anattempt at this verification. A benchmark runstream representative of anactual MSFC U-1108/8 runstream is being constructed. This syntheticrunstream will have the same statistical qualities as the actual run-stream selected. (On a run basis: the I/O subsystem distribution forphysical I/O's, number of tape drives, and number of lines output; andon a task basis: I-bank/D-bank core requirements, number of physicalI/O's, and CPU time requirements.) Using this synthetic runstream, twoexperiments will be performed on the captive MSFC U-1108/8:
IV-1
1. Normal System
2. Degraded System (one FASTRAND controller will be disabled)
In each case a simulator jobtape will be constructed from thesystem accounting tape statistics accumulated during the experiment andthe experiment simulated. Successful duplication of results will thenconstitute the sought after verification.
IV-2
III
o00
o<o
oinLU2
yLL
o:LU
LUOOu
o -=u 2
o;o
oCO
o<N
Oooo
o•o oCO
VN31SAS dO 3WI1 W31SAS
IV-3
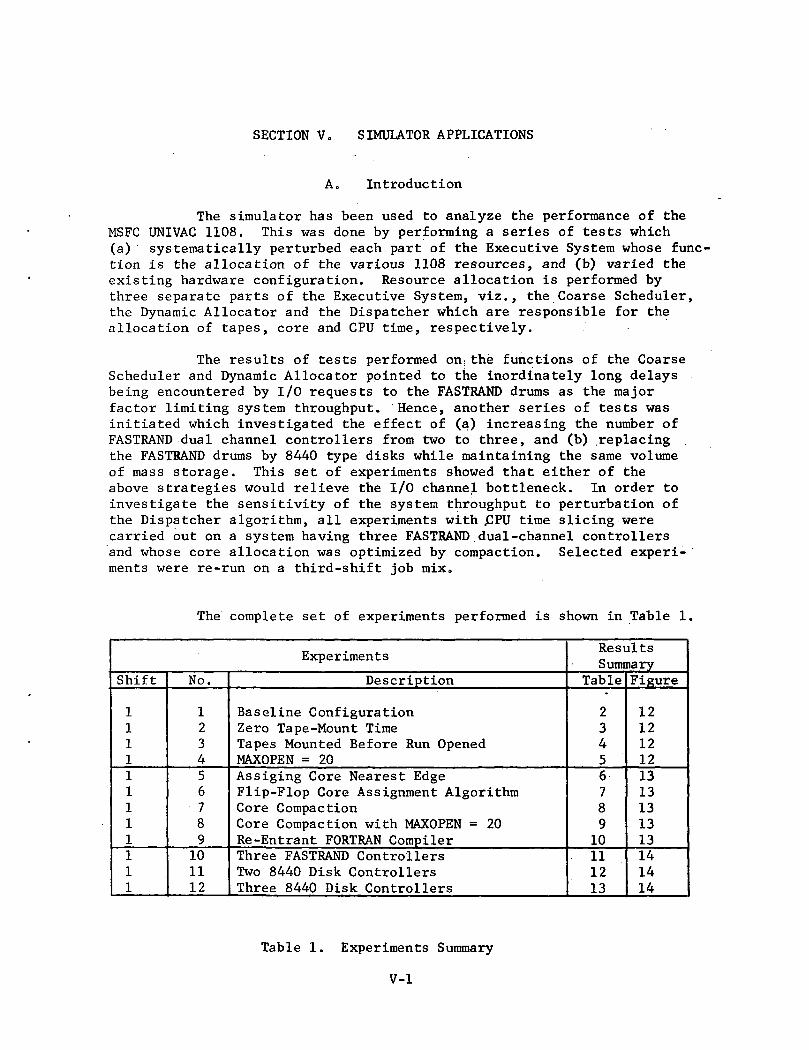
SECTION V. SIMULATOR APPLICATIONS
A. Introduction
The simulator has been used to analyze the performance of theMSFC UNIVAC 1108. This was done by performing a series of tests which(a) systematically perturbed each part of the Executive System whose func-tion is the allocation of the various 1108 resources, and (b) varied theexisting hardware configuration. Resource allocation is performed bythree separate parts of the Executive System, viz., the Coarse Scheduler,the Dynamic Allocator and the Dispatcher which are responsible for theallocation of tapes, core and CPU time, respectively.
The results of tests performed on;the functions of the CoarseScheduler and Dynamic Allocator pointed to the inordinately long delaysbeing encountered by I/O requests to the FASTRAND drums as the majorfactor limiting system throughput. Hence, another series of tests wasinitiated which investigated the effect of (a) increasing the number ofFASTRAND dual channel controllers from two to three, and (b) replacingthe FASTRAND drums by 8440 type disks while maintaining the same volumeof mass storage. This set of experiments showed that either of theabove strategies would relieve the I/O channel bottleneck. In order toinvestigate the sensitivity of the system throughput to perturbation ofthe Dispatcher algorithm, all experiments with .CPU time slicing werecarried out on a system having three FASTRAND dual-channel controllersand whose core allocation was optimized by compaction. Selected experi-ments were re-run on a third-shift job mix.
The complete set of experiments performed is shown in Table 1.
Experiments
Shift
111111111111
No.
123456789101112
Description
Baseline ConfigurationZero Tape-Mount TimeTapes Mounted Before Run OpenedMAXOPEN = 20Assiging Core Nearest EdgeFlip-Flop Core Assignment AlgorithmCore CompactionCore Compaction with MAXOPEN = 20Re -Entrant FORTRAN CompilerThree FASTRAND ControllersTwo 8440 Disk ControllersThree 8440 Disk Controllers
ResultsSummary
Table
2345678910111213
Figure
121212121313131313141414
Table 1. Experiments Summary
V-l
Experiment
Shift
1
1
1
1
1
1
1
1
3333
No.
13
14
15
16
17
18
19
20
21222324
Description
Core Compaction and Three FASTRANDControllers
Core Compaction, Three FASTRANDControllers and MAXOPEN = 20
Core Compaction and Two 8440 DiskControllers
Core Compaction and Three 8440 DiskControllers
Core Compaction, Three FASTRAND Con-trollers and Double-Time Quantum
Core Compaction, Three FASTRAND Con-trollers and Half-Time Quantum
Core Compaction, Three FASTRAND Con-trollers and Time Quantum Terminationon an I/O Operation
Core Compaction, Three FASTRAND Con-trollers and CPU Priority as a Func-tion of I/O Frequency
Baseline ConfigurationZero Tape-Mount TimeCore CompactionThree FASTRAND Controllers
ResultsSummary
Table
14
15
16
17
18
19
20
21
22232425
Figure
15
15
15
15
16
16
16
16
17171717
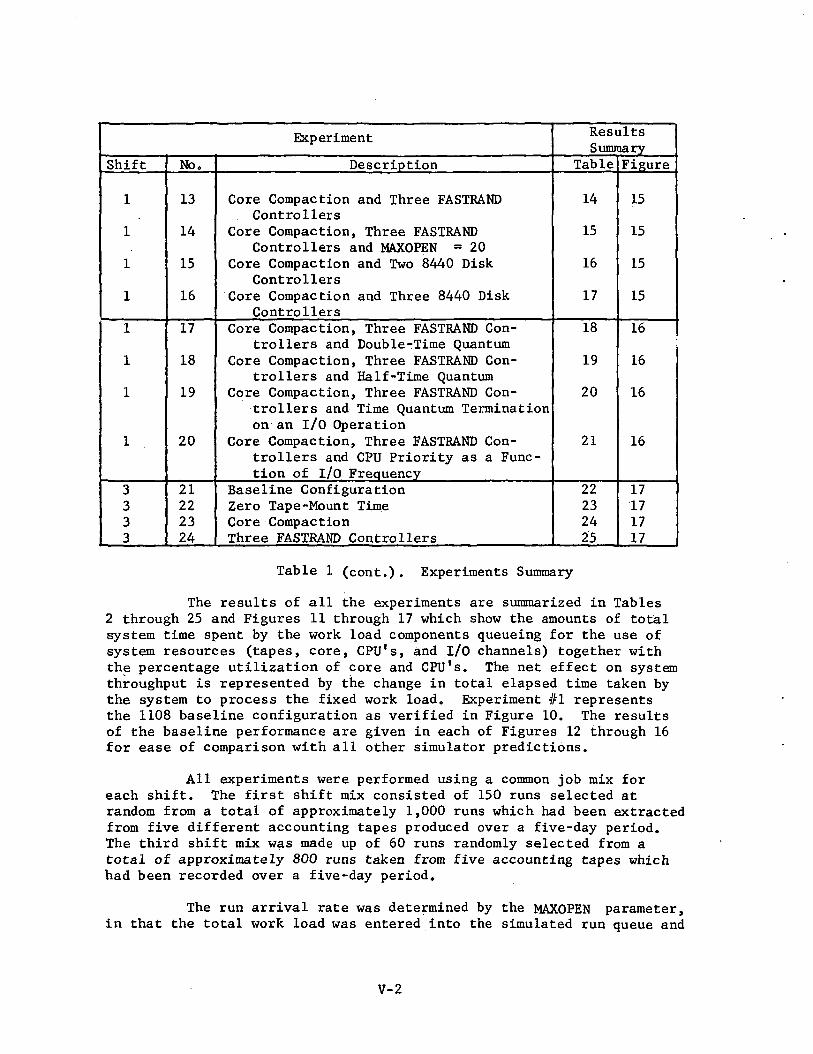
Table 1 (cont.). Experiments Summary
The results of all the experiments are summarized in Tables2 through 25 and Figures 11 through 17 which show the amounts of totalsystem time spent by the work load components queueing for the use ofsystem resources (tapes, core, CPU's, and I/O channels) together withthe percentage utilization of core and CPU's. The net effect on systemthroughput is represented by the change in total elapsed time taken bythe system to process the fixed work load. Experiment #1 representsthe 1108 baseline configuration as verified in Figure 10. The resultsof the baseline performance are given in each of Figures 12 through 16for ease of comparison with all other simulator predictions.
All experiments were performed using a common job mix foreach shift. The first shift mix consisted of 150 runs selected atrandom from a total of approximately 1,000 runs which had been extractedfrom five different accounting tapes produced over a five-day period.The third shift mix was made up of 60 runs randomly selected from atotal of approximately 800 runs taken from five accounting tapes whichhad been recorded over a five-day period.
The run arrival rate was determined by the MAXOPEN parameter,in that the total work load was entered into the simulated run queue and
V-2

runs were extracted from there by the system under the constraint thatthe MAXOPEN limit (held constant at 10) was not exceeded.
The elapsed time given in Tables 2 through 25 refers to thetime which elapses between the total work load entering the simulatedrun queue and the last run terminating.
V-3
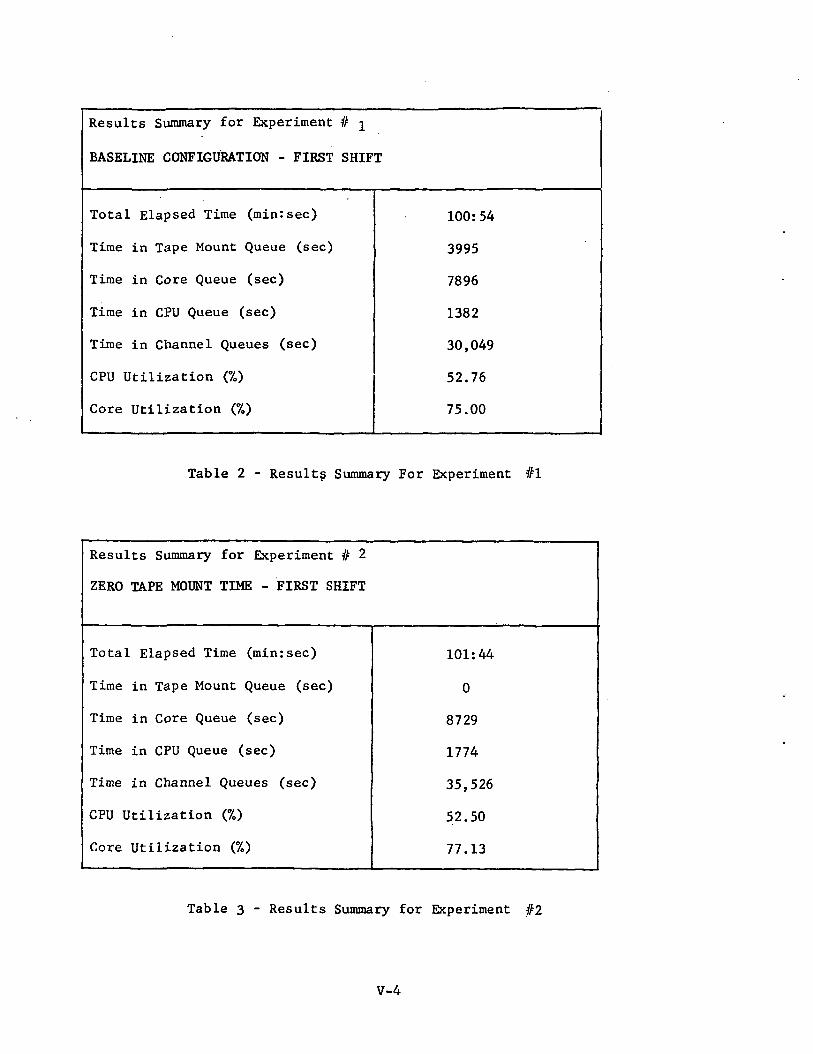
Results Summary for Experiment # ^
BASELINE CONFIGURATION - FIRST SHIFT
Total Elapsed Time (min:sec)
Time in Tape Mount Queue (sec)
Time in Core Queue (sec)
Time in CPU Queue (sec)
Time in Channel Queues (sec)
CPU Utilization (7o)
Core Utilization (78)
100:54
3995
7896
1382
30,049
52.76
75.00
Table 2 - Results Summary For Experiment #1
Results Summary for Experiment # 2
ZERO TAPE MOUNT TIME - FIRST SHIFT
Total Elapsed Time (minrsec)
Time in Tape Mount Queue (sec)
Time in Core Queue (sec)
Time in CPU Queue (sec)
Time in Channel Queues (sec)
CPU Utilization (%)
Core Utilization (%)
101:44
0
8729
1774
35,526
52.50
77.13
Table 3 - Results Summary for Experiment #2
V-4
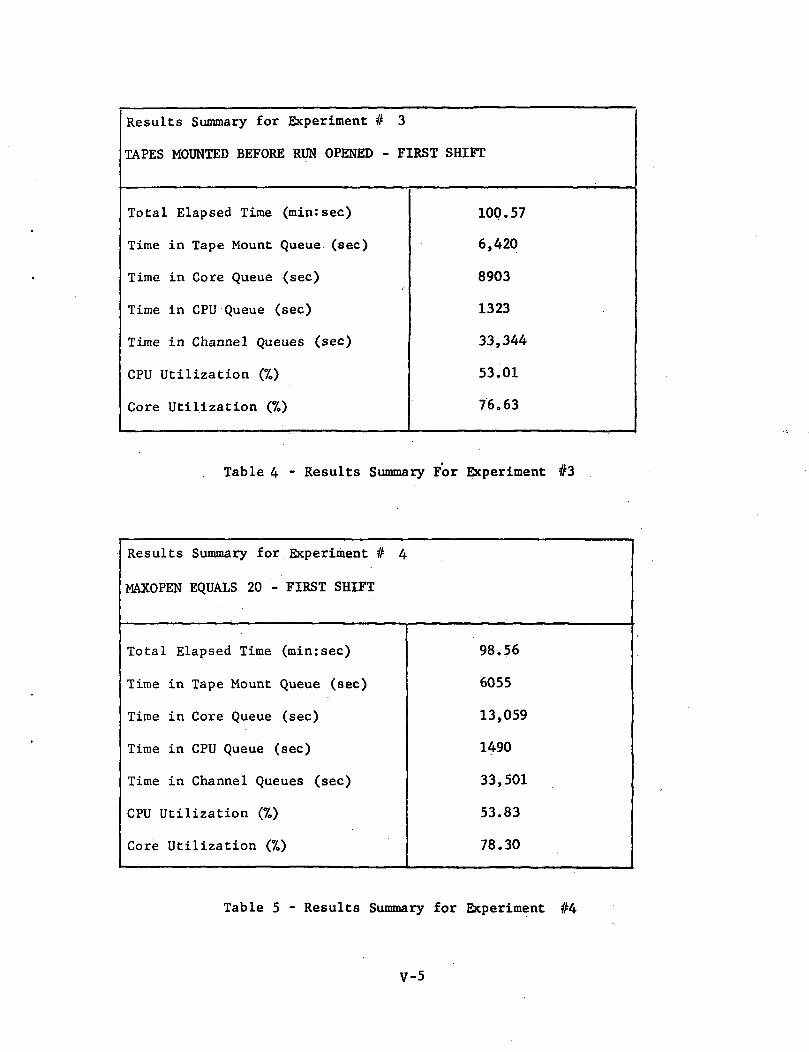
Results Summary for Experiment # 3
TAPES MOUNTED BEFORE RUN OPENED - FIRST SHIFT
Total Elapsed Time (min:sec)
Time in Tape Mount Queue (sec)
Time in Core Queue (sec)
Time in CPU Queue (sec)
Time in Channel Queues (sec)
CPU Utilization (%)
Core Utilization (%)
100.57
6,420
8903
1323
33,344
53.01
76.63
Table 4 - Results Summary For Experiment #3
Results Summary for Experiment # 4
MAXOPEN EQUALS 20 - FIRST SHIFT
Total Elapsed Time (min:sec)
Time in Tape Mount Queue (sec)
Time in Core Queue (sec)
Time in CPU Queue (sec)
Time in Channel Queues (sec)
CPU Utilization (%)
Core Utilization (%)
98.56
6055
13,059
1490
33,501
53.83
78.30
Table 5 - Results Summary for Experiment #4
V-5
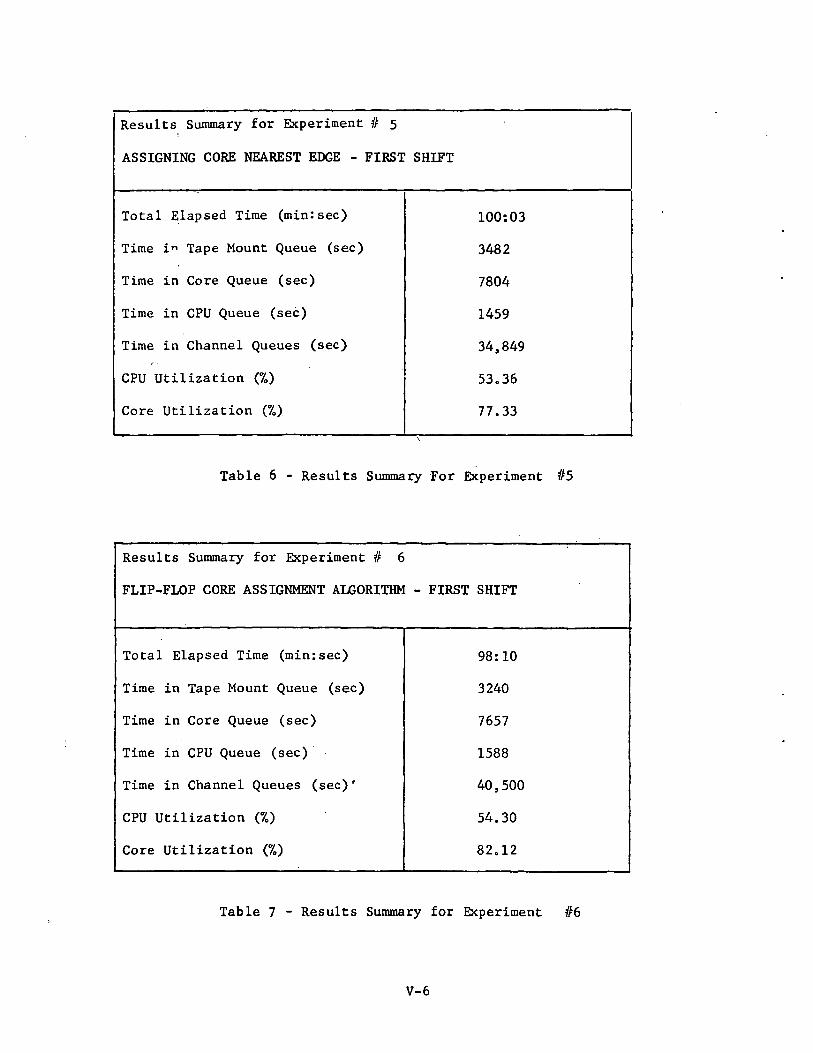
Results Summary for Experiment # 5
ASSIGNING CORE NEAREST EDGE - FIRST SHIFT
Total Elapsed Time (rain:sec)
Time in Tape Mount Queue (sec)
Time in Core Queue (sec)
Time in CPU Queue (sec)
Time in Channel Queues (sec)
CPU Utilization (%)
Core Utilization (%)
100:03
3482
7804
1459
34,849
53,36
77.33
Table 6 - Results Summary For Experiment #5
Results Summary for Experiment # 6
FLIP-FLOP CORE ASSIGNMENT ALGORITHM - FIRST SHIFT
Total Elapsed Time (minrsec)
Time in Tape Mount Queue (sec)
Time in Core Queue (sec)
Time in CPU Queue (sec)
Time in Channel Queues (sec)1"
CPU Utilization (%)
Core Utilization (%)
98:10
3240
7657
1588
40,500
54.30
82.12
Table 7 - Results Summary for Experiment #6
V-6
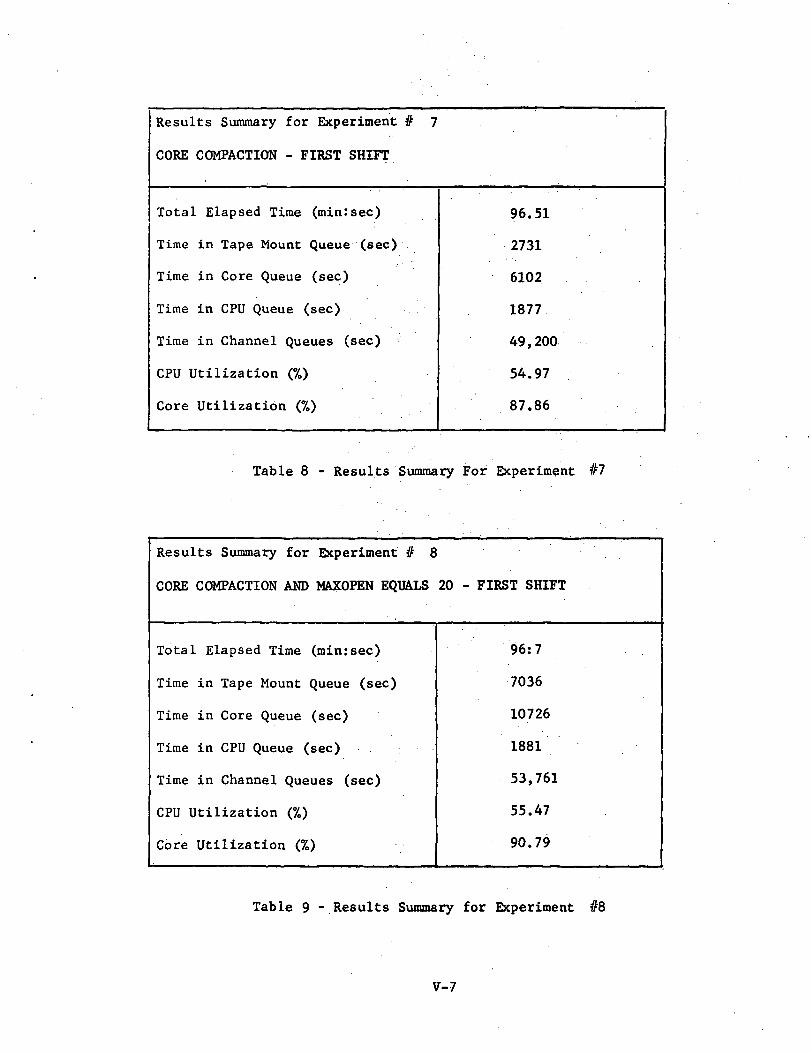
Results Summary for Experiment # 7
CORE COMPACTION - FIRST SHIFT
Total Elapsed Time (minisec)
Time in Tape Mount Queue (sec)
Time in Core Queue (sec)
Time in CPU Queue (sec)
Time in Channel Queues (sec)
CPU Utilization (%)
Core Utilization
96.51
2731
6102
1877
49,200
54.97
87.86
Table 8 - Results Summary For Experiment #7
Results Summary for Experiment #8
CORE COMPACTION AND MAXOPEN EQUALS 20 - FIRST SHIFT
Total Elapsed Time (min:sec)
Time in Tape Mount Queue (sec)
Time in Core Queue (sec)
Time in CPU Queue (sec)
Time in Channel Queues (sec)
CPU Utilization (%)
Core Utilization (%)
96:7
7036
10726
1881
53,761
55.47
90.79
Table 9 -Results Summary for Experiment #8
V-7
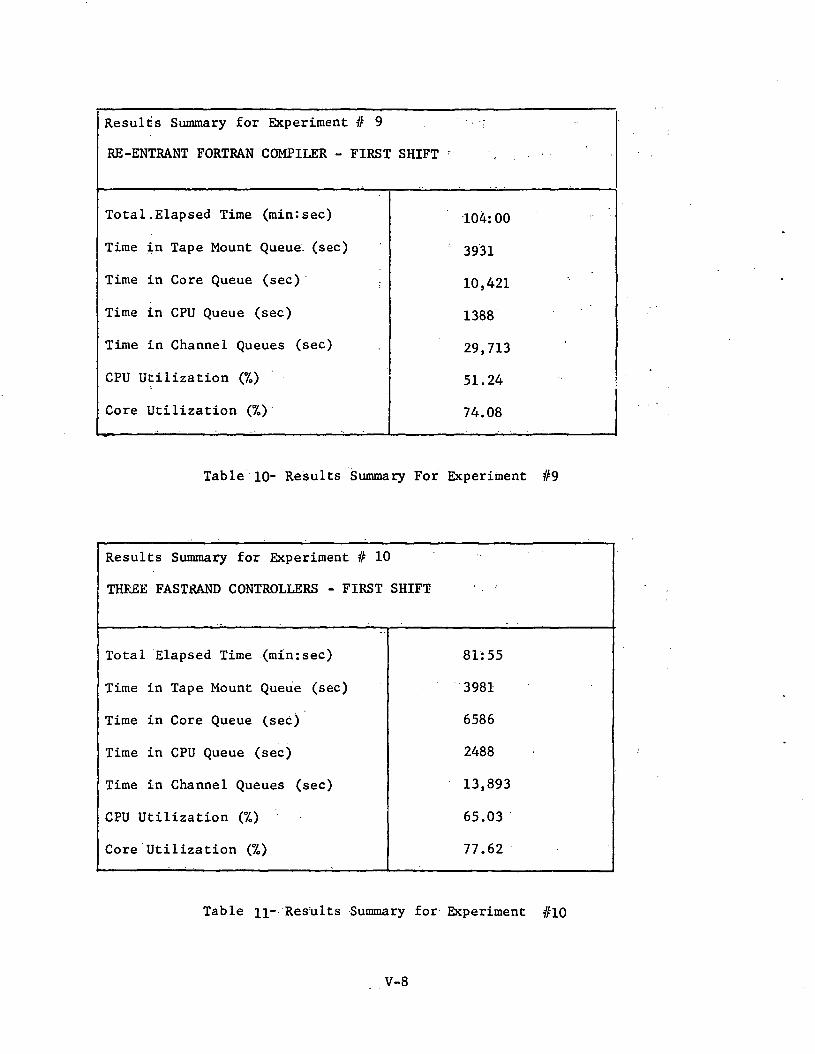
Results Summary for Experiment # 9
RE-ENTRANT FORTRAN COMPILER - FIRST SHIFT
Total .Elapsed Time (min:sec)
Time in Tape Mount Queue, (sec)
Time in Core Queue (sec)
Time in CPU Queue (sec)
Time in Channel Queues (sec)
CPU Utilization (%)
Core Utilization
104:00
3931
10,421
1388
29,713
51.24
74.08
Table 10- Results Summary For Experiment #9
Results Summary for Experiment # 10
THREE FASTRAND CONTROLLERS - FIRST SHIFT
Total Elapsed Time (min:sec)
Time in Tape Mount Queue (sec)
Time in Core Queue (sec)
Time in CPU Queue (sec)
Time in Channel Queues (sec)
CPU Utilization (%) :
Core Utilization (70)
81:55
3981
6586
2488
13,893
65.03
77.62
Table n- Results Summary for Experiment #10
V-8
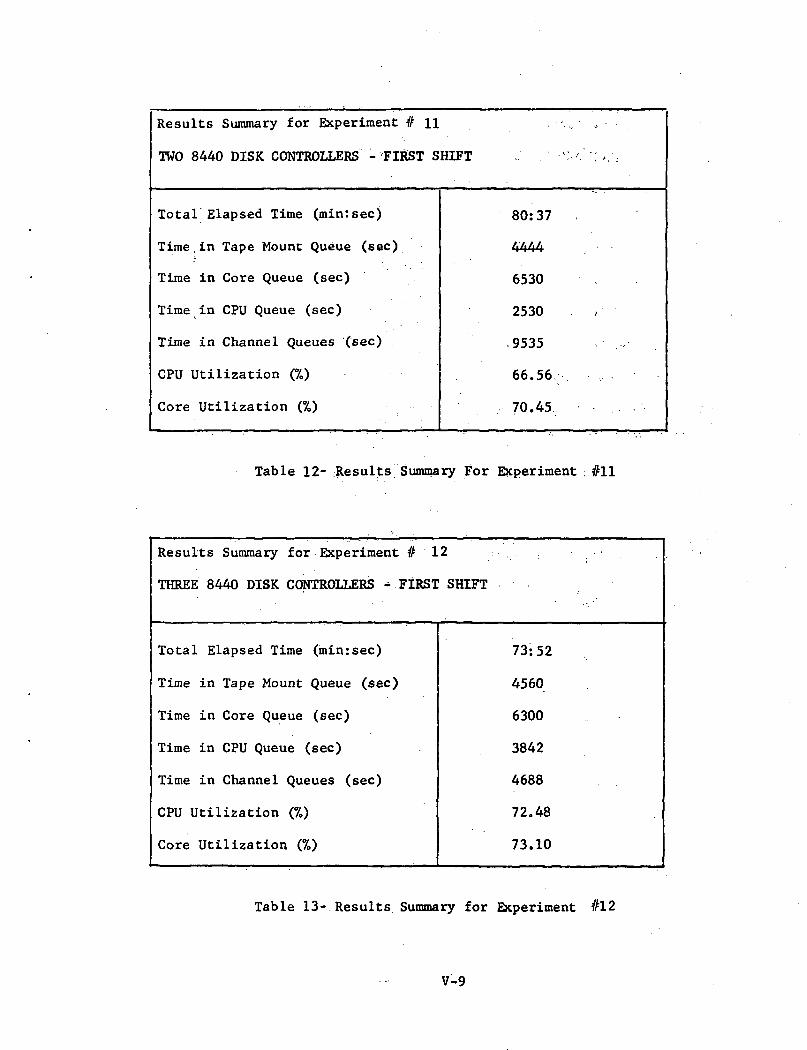
Results Summary for Experiment #11
TWO 8440 DISK CONTROLLERS - 'FIRST SHIFT
Total Elapsed Time (min:sec)
Time.in Tape Mount Queue (sec)
Time in Core Queue (sec)
Time in CPU Queue (sec)
Time in Channel Queues (sec)
CPU Utilization (%)
Core Utilization (%)
80:37
4444
6530
2530
.9535
66.56
70.45
Table 12- Results Summary For Experiment : #11
Results Summary for Experiment # 12
THREE 8440 DISK CONTROLLERS - FIRST SHIFT
Total Elapsed Time (minrsec)
Time in Tape Mount Queue (sec)
Time in Core Queue (sec)
Time in CPU Queue (sec)
Time in Channel Queues (sec)
CPU Utilisation (%)
Core Utilization (%)
73:52
4560
6300
3842
4688
72.48
73.10
Table 13- Results Summary for Experiment #12
V-9
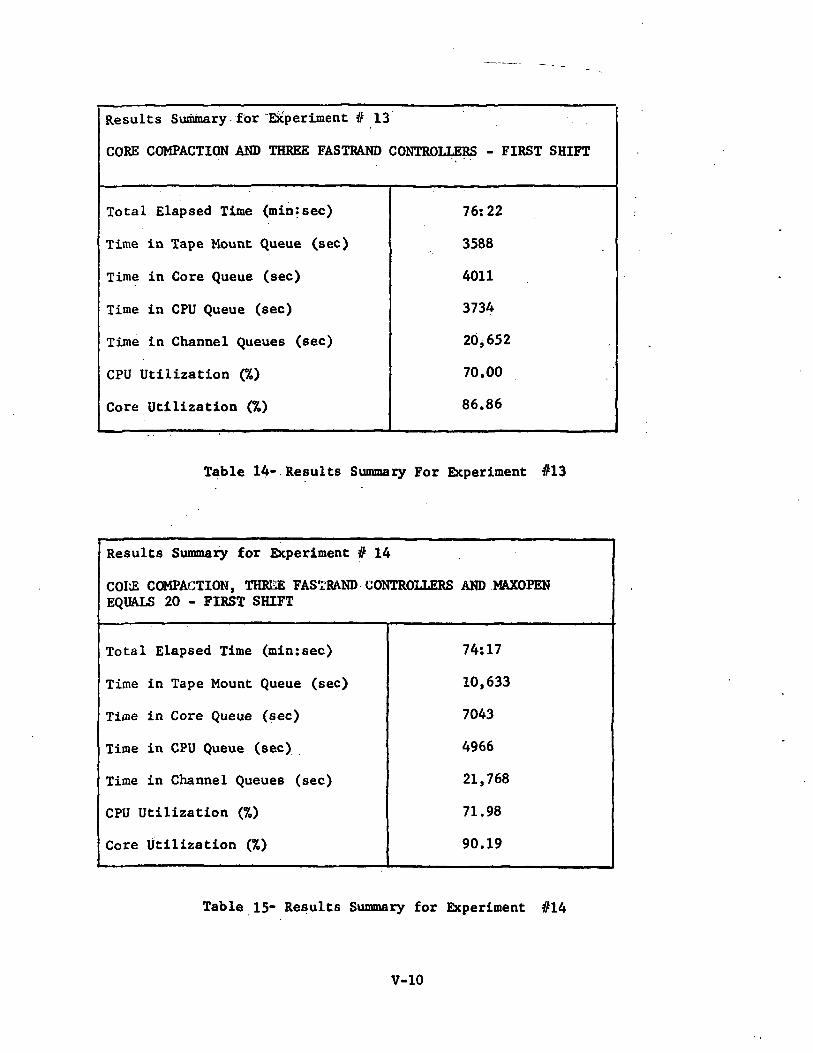
Results Summary for "Experiment #13
CORE COMPACTION AND THREE FASTRAND CONTROLLERS - FIRST SHIFT
Total Elapsed Time (min:sec)
Time in Tape Mount Queue (sec)
Time in Core Queue (sec)
Time in CPU Queue (sec)
Time in Channel Queues (sec)
CPU Utilization (%)
Core Utilization (%)
76: 22
3588
4011
3734
20,652
70.00
86.86
Table 14- Results Summary For Experiment #13
Results Summary for Experiment #14
COMPACTION, THREE FASTRAND CONTROLLERS AND MAXOPENEQUALS 20 - FIRST SHIFT
Total Elapsed Time (min:sec)
Time in Tape Mount Queue (sec)
Time in Core Queue (sec)
Time in CPU Queue (sec)
Time in Channel Queues (sec)
CPU Utilization (%)
Core Utilization (%)
74:17
10,633
7043
4966
21,768
71.98
90.19
Table 15- Results Summary for Experiment #14
V-10
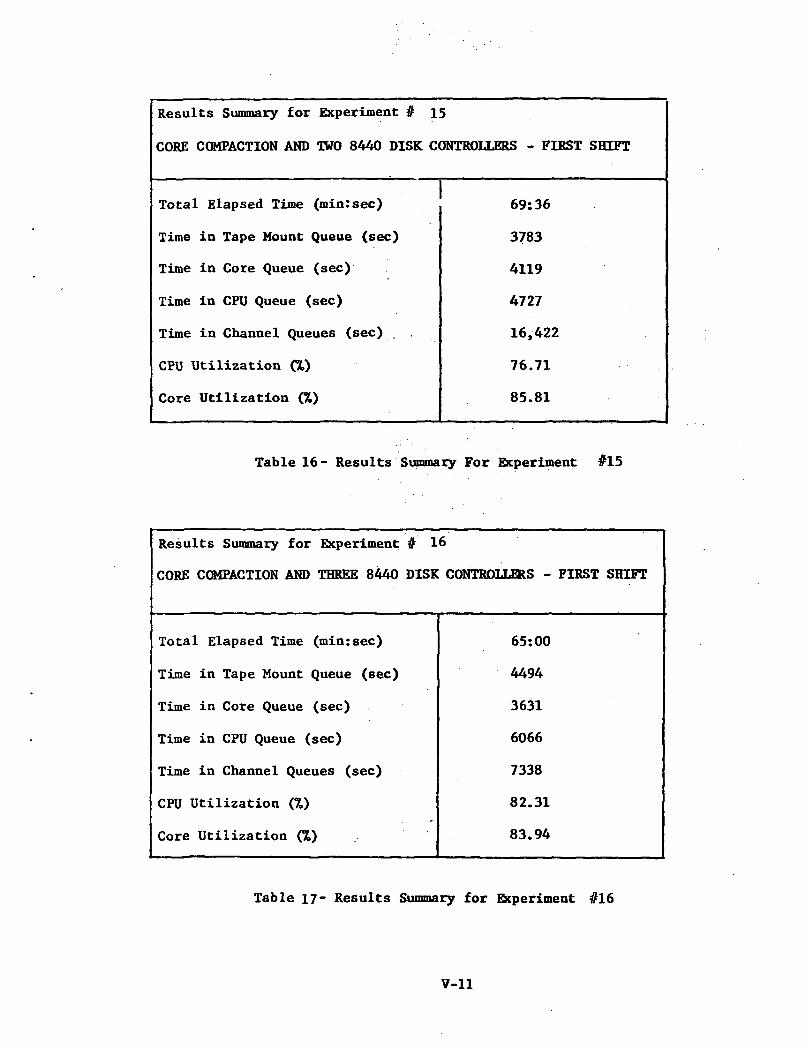
Results Summary for Experiment # 15
CORE COMPACTION AND TWO 8440 DISK CONTROLLERS - FIRST SHIFT
Total Elapsed Time (min:sec)
Time in Tape Mount Queue (sec)
Time in Core Queue (sec)
Time in CPU Queue (sec)
Time in Channel Queues (sec) .
CPU Utilization (%)
Core Utilization (%)
69:36
3783
4119
4727
16,422
76.71
85.81
Table 16- Results Summary For Experiment #15
Results Summary for Experiment # 16
CORE COMPACTION AND THREE 8440 DISK CONTROLLERS - FIRST SHIFT
Total Elapsed Time (minrsec)
Time in Tape Mount Queue (sec)
Time in Core Queue (sec)
Time in CPU Queue (sec)
Time in Channel Queues (sec)
CPU Utilization (%)
Core Utilization (%)
65:00
4494
3631
6066
7338
82.31
83.94
Table 17- Results Summary for Experiment
V-ll
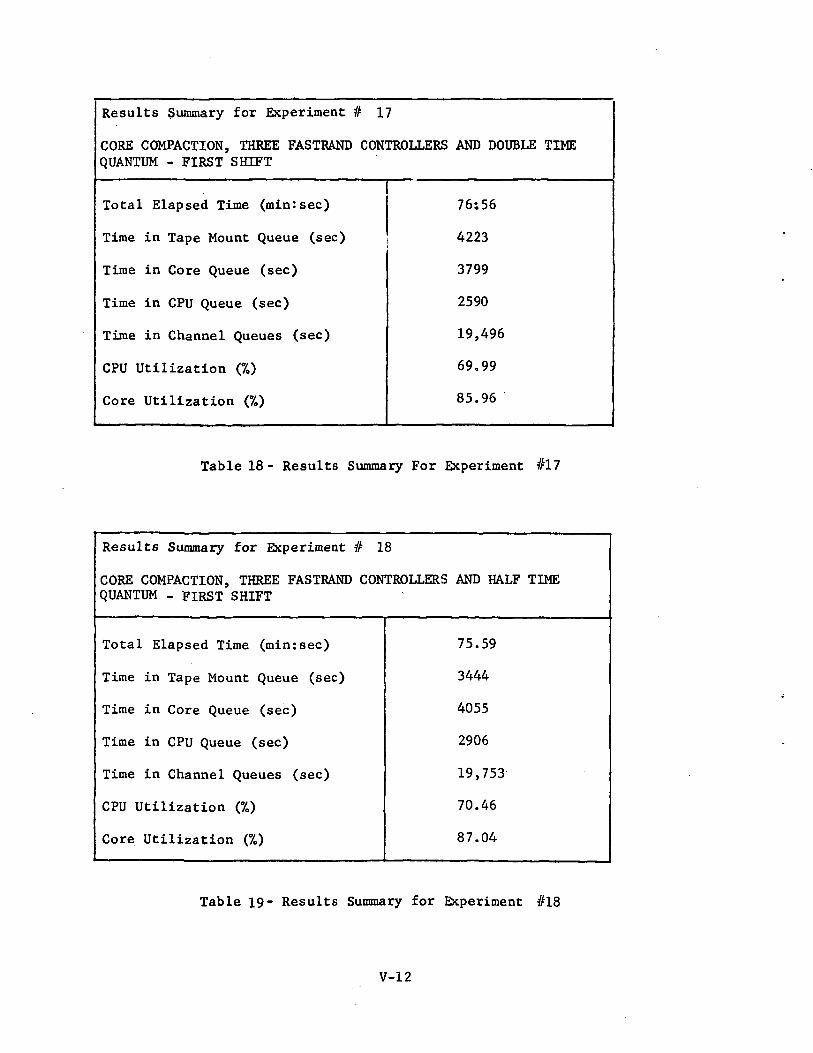
Results Summary for Experiment # 17
CORE COMPACTION, THREE FASTRAND CONTROLLERS AND DOUBLE TIMEQUANTUM - FIRST SHIFT
Total Elapsed Time (min:sec)
Time in Tape Mount Queue (sec)
Time in Core Queue (sec)
Time in CPU Queue (sec)
Time in Channel Queues (sec)
CPU Utilization (%)
Core Utilization (7.)
76:56
4223
3799
2590
19,496
69,99
85.96
Table 18- Results Summary For Experiment #17
Results Summary for Experiment # 18
CORE COMPACTION, THREE FASTRAND CONTROLLERS AND HALF TIMEQUANTUM - FIRST SHIFT
Total Elapsed Time (min:sec)
Time in Tape Mount Queue (sec)
Time in Core Queue (sec)
Time in CPU Queue (sec)
Time in Channel Queues (sec)
CPU Utilization (%)
Core Utilization (7.)
75.59
3444
4055
2906
19,753
70.46
87.04
Table 19- Results Summary for Experiment #18
V-12
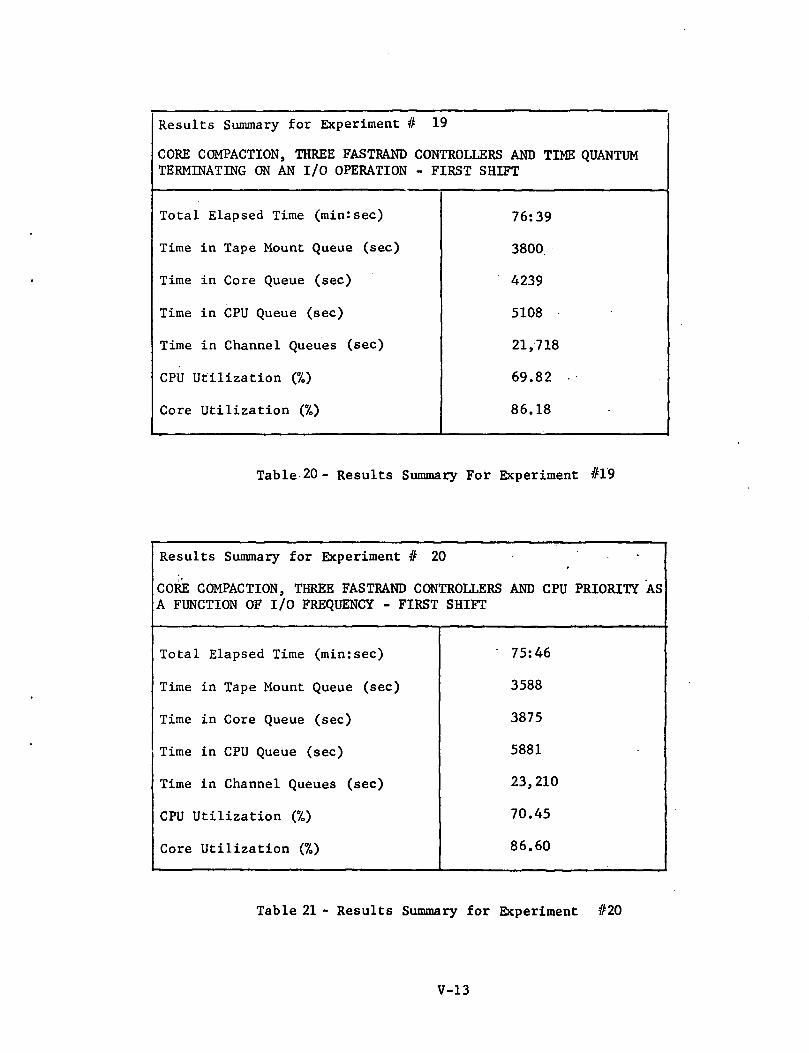
Results Summary for Experiment # 19
CORE COMPACTION, THREE FASTRAND CONTROLLERS AND TIME QUANTUMTERMINATING ON AN I/O OPERATION - FIRST SHIFT
Total Elapsed Time (min:sec)
Time in Tape Mount Queue (sec)
Time in Core Queue (sec)
Time in CPU Queue (sec)
Time in Channel Queues (sec)
CPU Utilization (70)
Core Utilization
76:39
3800
4239
5108
21,718
69.82
86.18
Table 20 - Results Summary For Experiment #19
Results Summary for Experiment #20 •
CORE COMPACTION, THREE FASTRAND CONTROLLERS AND CPU PRIORITY ASA FUNCTION OF I/O FREQUENCY - FIRST SHIFT
Total Elapsed Time (min:sec)
Time in Tape Mount Queue (sec)
Time in Core Queue (sec)
Time in CPU Queue (sec)
Time in Channel Queues (sec)
CPU Utilization (%)
Core Utilization (%)
75:46
3588
3875
5881
23,210
70.45
86.60
Table 21 - Results Summary for Experiment #20
V-13
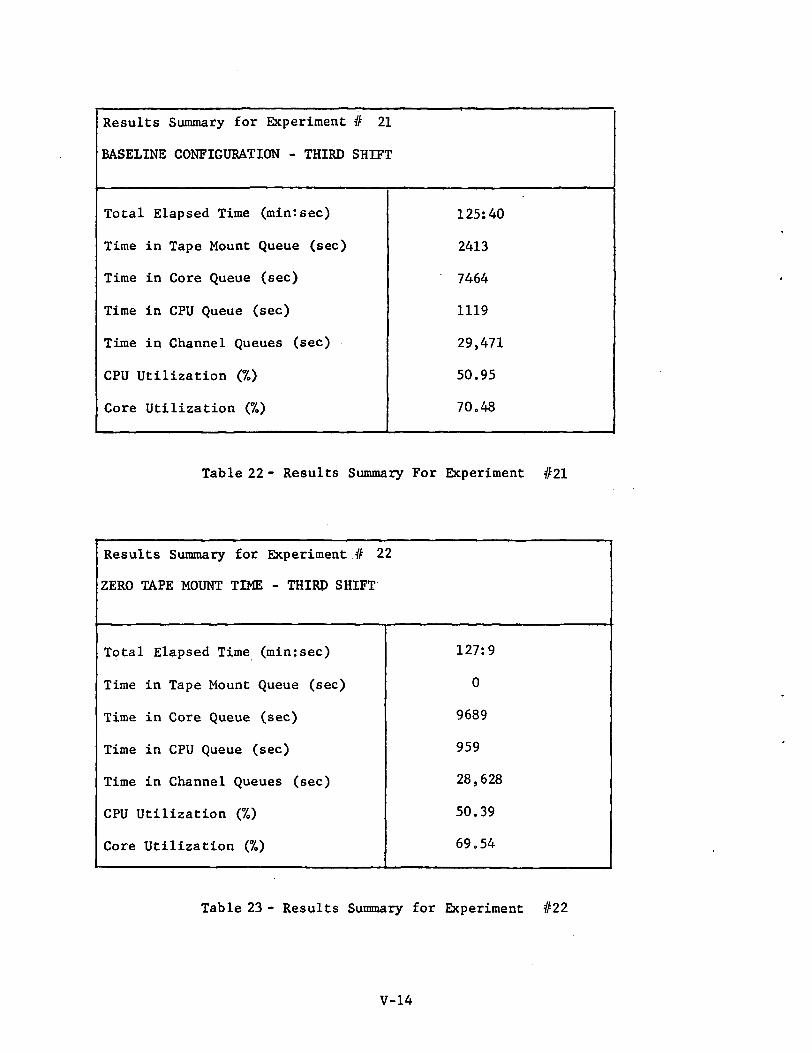
Results Summary for Experiment # 21
BASELINE CONFIGURATION - THIRD SHIFT
Total Elapsed Time (minrsec)
Time in Tape Mount Queue (sec)
Time in Core Queue (sec)
Time in CPU Queue (sec)
Time in Channel Queues (sec)
CPU Utilization (%)
Core Utilization (%)
125:40
2413
7464
1119
29,471
50.95
70.48
Table 22 - Results Summary For Experiment #21
Results Summary for Experiment .# 22
ZERO TAPE MOUNT TIME - THIRD SHIFT
Total Elapsed Time (min:sec)
Time in Tape Mount Queue (sec)
Time in Core Queue (sec)
Time in CPU Queue (sec)
Time in Channel Queues (sec)
CPU Utilization (%)
Core Utilization (%)
127:9
0
9689
959
28,628
50.39
69.54
Table 23 - Results Summary for Experiment #22
V-14
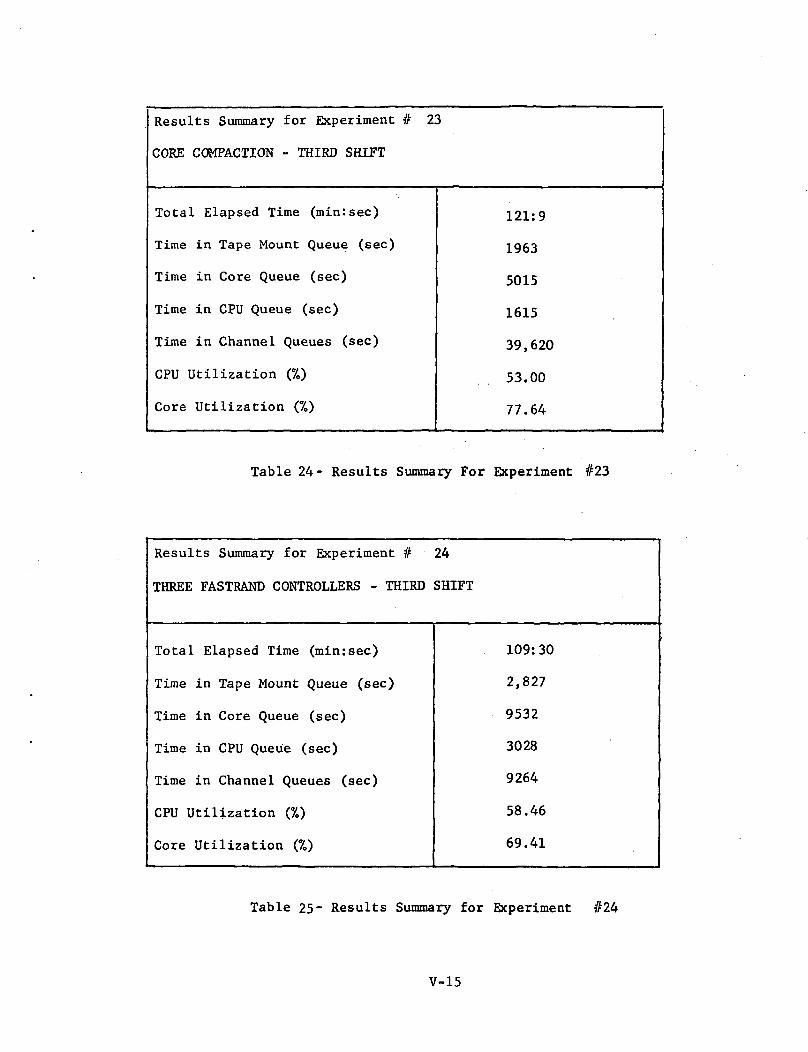
Results Summary for Experiment # 23
CORE COMPACTION - THIRD SHIFT
Total Elapsed Time (rain:sec)
Time in Tape Mount Queue (sec)
Time in Core Queue (sec)
Time in CPU Queue (sec)
Time in Channel Queues (sec)
CPU Utilization (%)
Core Utilization (%)
121:9
1963
5015
1615
39,620
53.00
77.64
Table 24- Results Summary For Experiment #23
Results Summary for Experiment# 24
THREE FASTRAND CONTROLLERS - THIRD SHIFT
Total Elapsed Time (min:sec)
Time in Tape Mount Queue (sec)
Time in Core Queue (sec)
Time in CPU Queue (sec)
Time in Channel Queues (sec)
CPU Utilization (%)
Core Utilization
109:30
2,827
9532
3028
9264
58.46
69.41
Table 25- Results Summary for Experiment #24
V-15
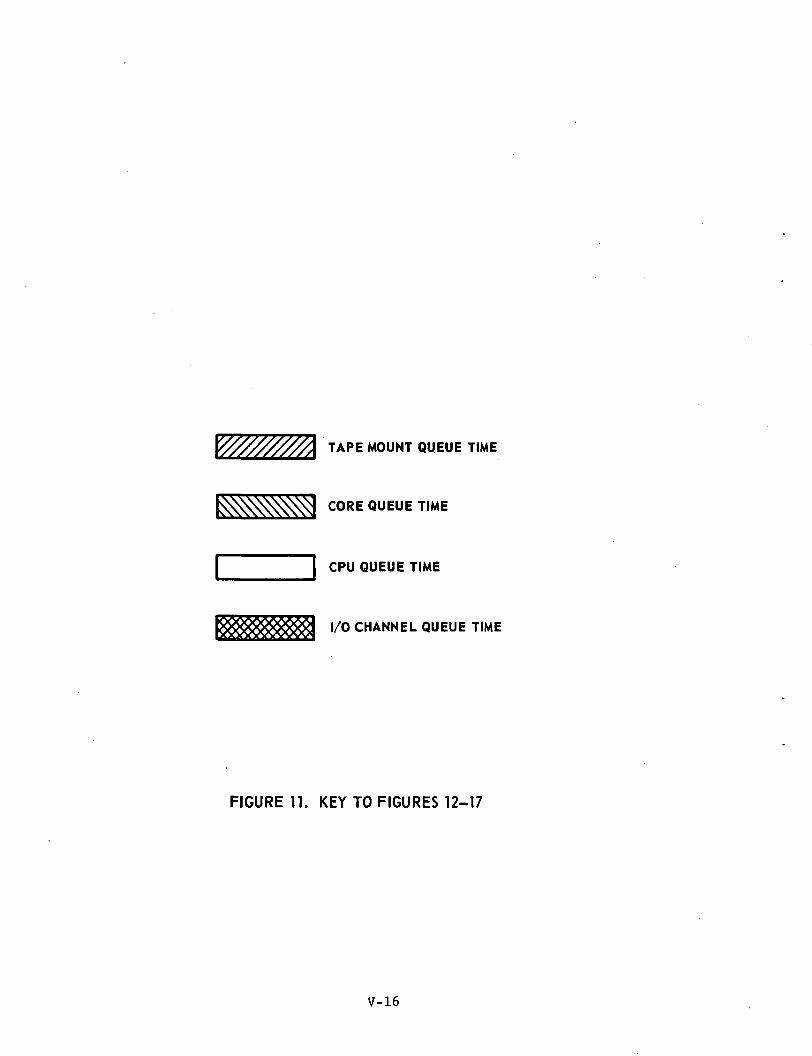
TAPE MOUNT QUEUE TIME
CORE QUEUE TIME
CPU QUEUE TIME
I/O CHANNEL QUEUE TIME
FIGURE 11. KEY TO FIGURES 12-17
V-16
ELAPSEDTIME RELATIVE
TO BASELINE 0
-5
60,000-
40,000-
TOTAL QUEUETIME (SEC)
20,000-
w/m.
A-BASELINE C-TAPES MOUNTED BEFORE RUN OPENED
B-ZERO TAPE MOUNT TIME D-MAX OPEN = 20
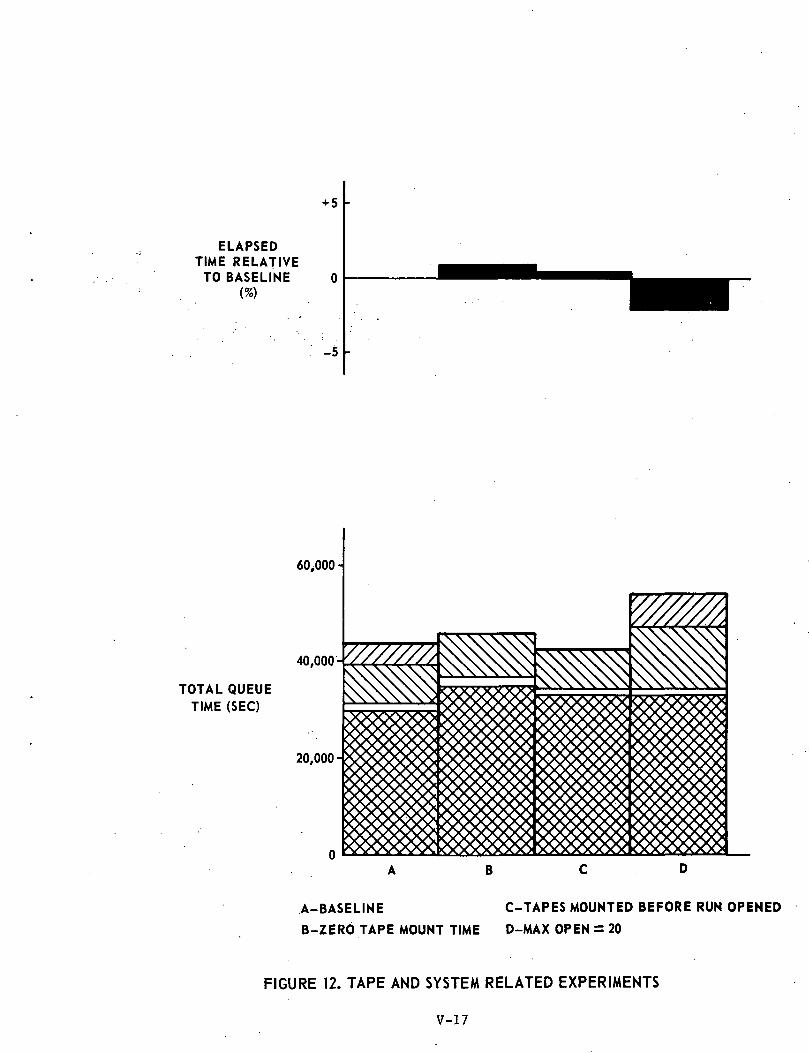
FIGURE 12. TAPE AND SYSTEM RELATED EXPERIMENTS
V-17
ELAPSEDTIME RELATIVETO BASELINE
-5
80,000
60,000
TOTAL QUEUETIME (SEC)
40,000
20,000
A - BASELINEB - ASSIGNING CORE NEAREST EDGEC - FLIP-FLOP CORE ASSIGNMENT ALGORITHM
D - CORE COMPACTIONE - CORE COMPACTION WITH MAX OPEN = 20F - RE-ENTRANT FORTRAN COMPILER
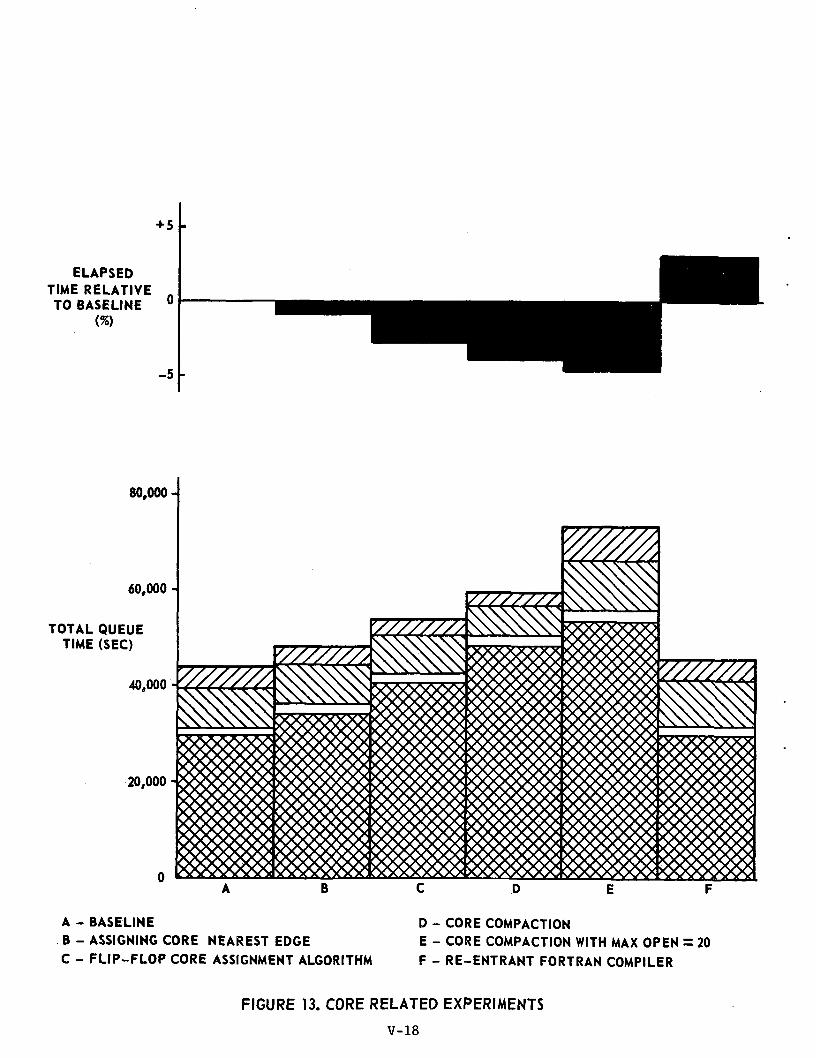
FIGURE 13. CORE RELATED EXPERIMENTS
V-18
ELAPSEDTIME RELATIVE
TO BASELINE
TOTALJJUEUETIMES (SEC)
60,000-
40,000-
20,000
A - BASELINE
B-3 FR CONTROLLERS
C - 2,8440 DISK CONTROLLERS
D - 3,8440 DISK CONTROLLERS
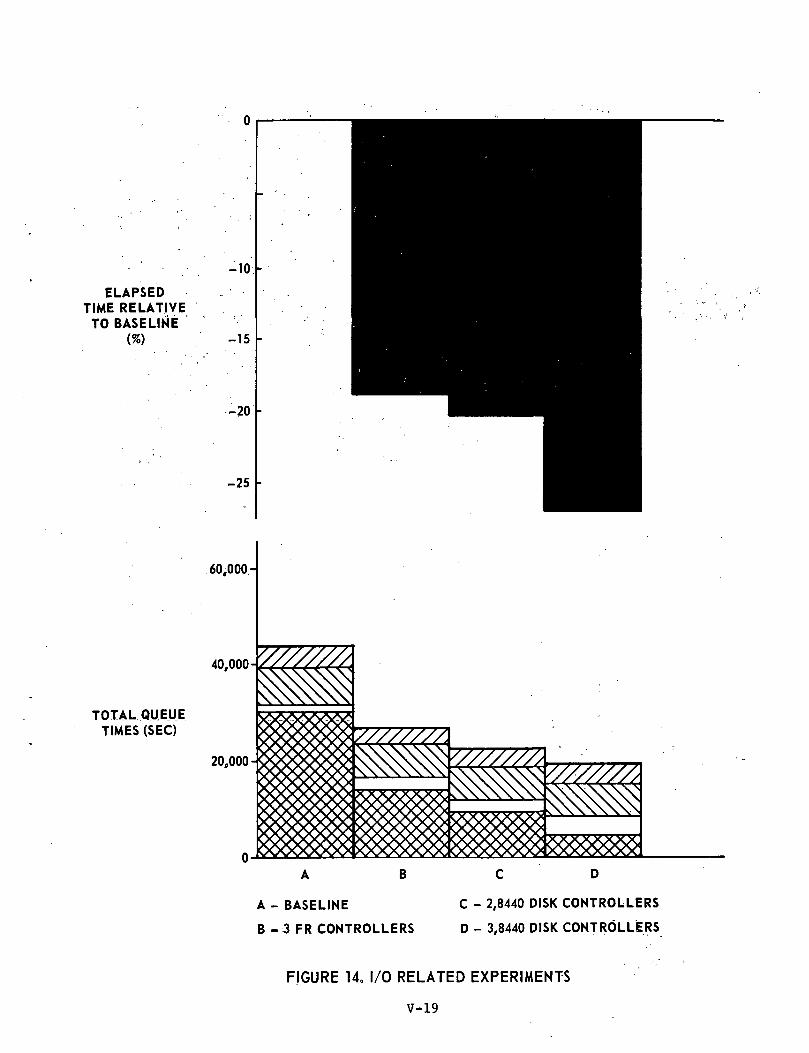
FIGURE 14. I/O RELATED EXPERIMENTS
V-19
ELAPSED TIMERELATIVE TOBASELINE (%)
-35 U
40,000
TOTAL QUEUETIMES (SEC)
20,000
A - BASELINEB - CORE COMPACTION AND 3 FR CONTROLLERSC - CORE COMPACTION, 3 FR CONTROLLERS AND MAX OPEND - CORE COMPACTION AND 2,8440 DISK CONTROLLERSE - CORE COMPACTION AND 3,8440 DISK CONTROLLERS
= 20
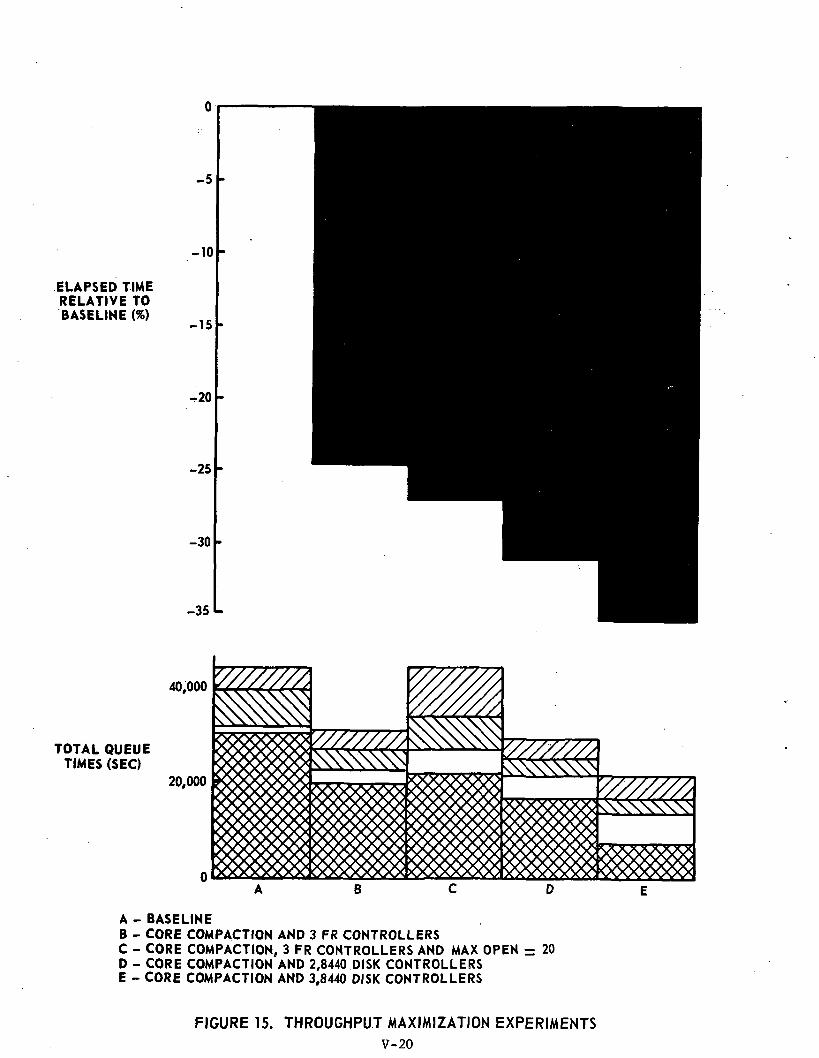
FIGURE 15. THROUGHPUT MAXIMIZATION EXPERIMENTS
V-20
ELAPSED TIMERELATIVE TOBASELINE (%)
-10
-15
-20
-25
60,000
TOTAL QUEUETIME (SEC)
40,000
20,000
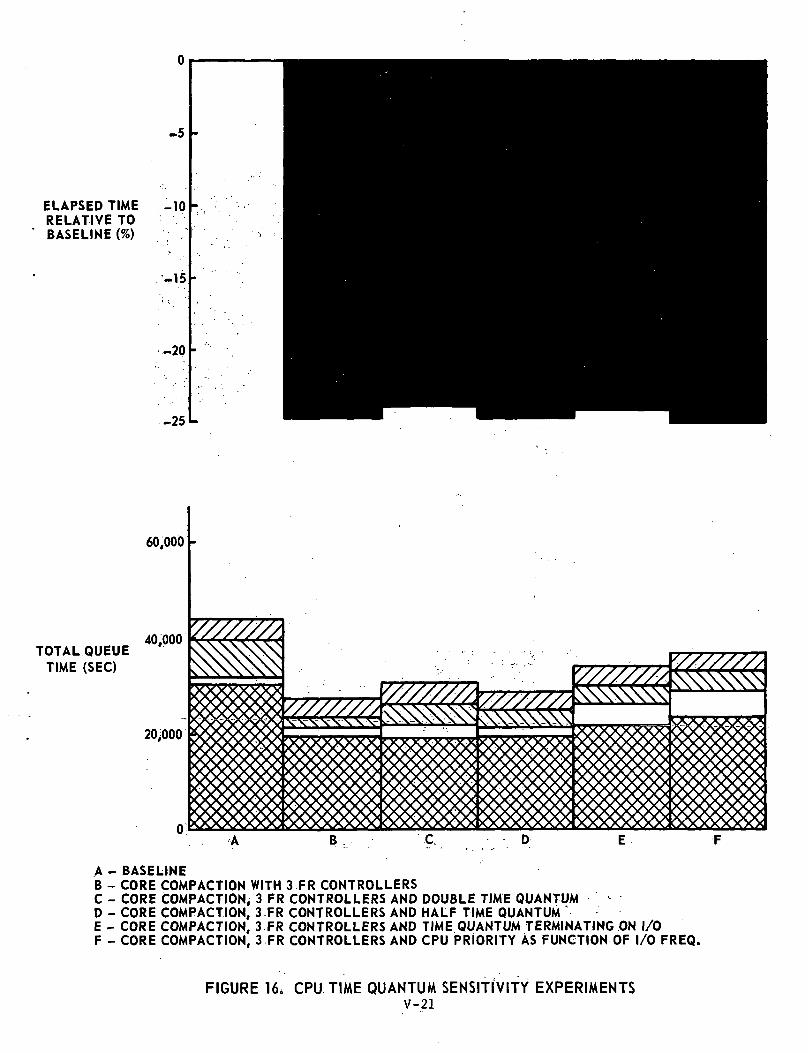
A - BASELINEB - CORE COMPACTION WITH 3 FR CONTROLLERSC - CORE COMPACTION, 3 FR CONTROLLERS AND DOUBLE TIME QUANTUMD - CORE COMPACTION, 3 FR CONTROLLERS AND HALF TIME QUANTUM 'E - CORE COMPACTION, 3 FR CONTROLLERS AND TIME QUANTUM TERMINATING .ON I/OF - CORE COMPACTION, 3 FR CONTROLLERS AND CPU PRIORITY AS FUNCTION OF I/O FREQ.
FIGURE 16, CPU TIME QUANTUM SENSITIVITY EXPERIMENTSV-21
ELAPSED TIMERELATIVE TOBASELINE (%)
TOTAL QUEUETIMES (SEC)
60,000 •
40,000
20.000
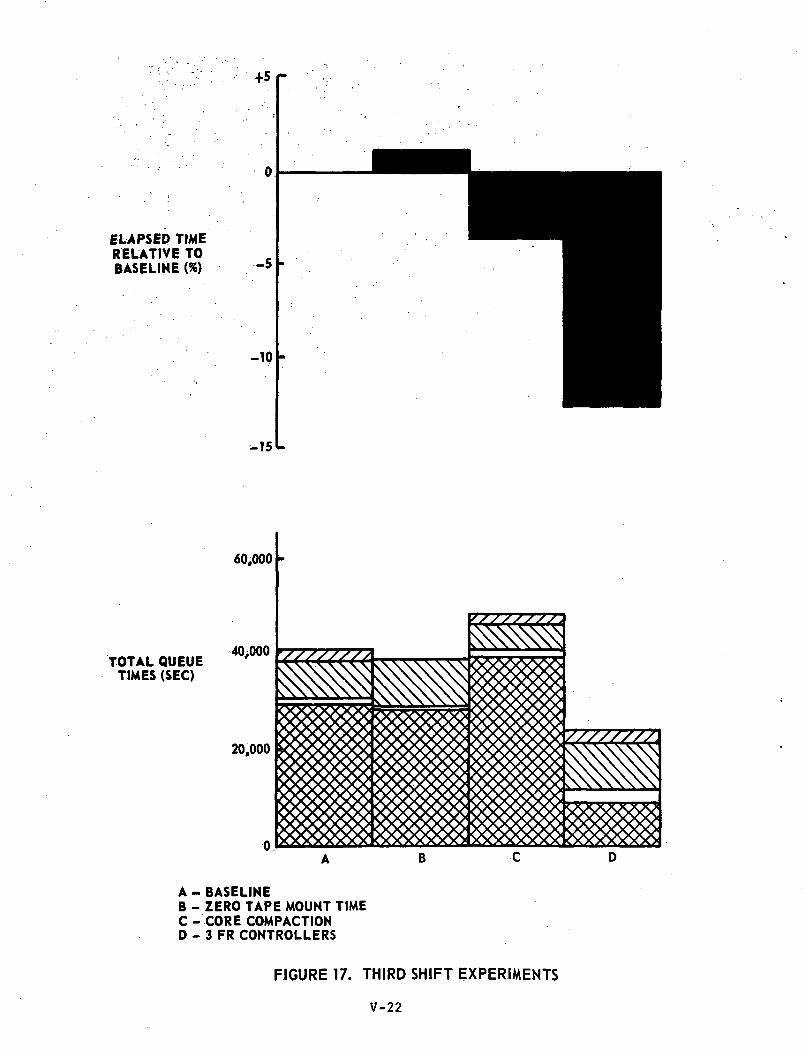
A- BASELINEB - ZERO TAPE MOUNT TIMEC - CORE COMPACTIOND - 3 FR CONTROLLERS
FIGURE 17. THIRD SHIFT EXPERIMENTS
V-22
B. Discussion of Results
TAPE AND SYSTEM REIATED EXPERIMENTS
Experiment #1; Baseline Configuration - First Shift (Ref: Table 2and Figure 12) . "
The total queueing time in the baseline was 43,321 sec;this compares to a total CPU time of 9,582 sec.
Experiment #2; Zero Tape Mount Time (Ref: Table 3 and Figure 12)
This experiment simulated the ultimate in efficiency inmounting tapes, viz., zero time spent in the actual mounting procedure.It can be seen from Figure 12 that although the time spent in the tapemount queue was eliminated, the overall processing time increased because.of the limiting effect of the increased time spent in the channel queues.
r-
Experiment #3; Tapes Mounted Before Run Opened (Ref: Table 4 andFigure 12)
In the operation of the baseline EXEC 8 .operating system, whena run is opened it contributes to the MAXOPEN count. However, if sucha run has a requirement for one or more tape drives, time is requiredto locate and mount the necessary tapes. It can be argued that in such -a situation the total system is not being fully utilized because untila run has its tapes mounted it cannot vie for other system resourcessuch as core and CPU time.
The above experiment simulates the effect of premounting a run'stapes before the run is opened. In this case when a run enters the systemby virtue of satisfying the MAXOPEN criterion, it can immediately becomea candidate for core allocation. This procedure virtually eliminates theeffect of the time spent waiting in the tape mount queue since this activityoccurs in parallel with the processing of core-resident tasks under condi-tions of a fully loaded system with respect to the MAXOPEN criterion.
Although core and CPU utilization increase'd-marginally, throughputwas almost unaffected due to an increase in I/O channel queue time.
Experiment #4; MAXOPEN = 20 (Ref: Table 5 and Figure 12)
The MAXOPEN limit was raised from 10 to 20, reducing the totalelapsed time by almost 2 percent. The degree of improvement was limited,however, by an increase in both the core and I/O channel queue times. .
V-23
CORE RELATED EXPERIMENTS
Experiment #5; Assigning Core Nearest Edge (Ref: Table 6 and Figure 13)
In this experiment the "best fit" algorithm normally used forplacing a task in core is replaced by an algorithm which attempts to keepthe I-bank and D-bank portions of the task separated as much as possible.A task's I-bank is placed in the core gap with smallest beginning addresswhich is large enough to contain it; task D-bank is placed in the appropri-ate gap with largest beginning address. This algorithm attempts to preservea large center gap so that a task having a large core requirement can bequickly accommodated.
Only a marginal improvement in throughput was noted, againaccompanied by an increase in I/O channel queue time.
Experiment #6; Flip-Flop Core Assignment Algorithm (Ref: Table 7 andFigure 13)
From the baseline core allocation algorithm described in SectionIII.B., it can be seen that I-bank is always allocated below and D-bankalways above the center gap. This experiment investigates the effect ofmodifying this algorithm such that the only requirement is that I- andD-bank be on opposite sides of the center gap. This results in a signifi-cant increase in core utilization, but the increase in throughput is lessthan 3 percent, again due mainly to the increase in I/O channel queueingtime.
Experiment #7; Core Compaction (Ref: Table 8 and Figure 13)
In a multiprogramming environment unused core is typicallyfragmented into several separate blocks or gaps. This fragmentation canbe substantially reduced by compacting core; that is, relocating tasks soas to reduce the number of blocks into which unused core is divided. Inthis experiment, the optimum core compaction algorithm is assumed; when acore request is made, those tasks residing in core are relocated so thatall unused core is contained in one gap. This allows utilization of theunused fragments which occur when any of the above algorithms are employed.The overall effect is an increased throughput of over 4 percent owing to anincrease in core utilization from 75 percent in the baseline configurationto 87.86 percent. However, the increased user activity causes more rapidrequests for I/O thereby creating a large increase in I/O channel queueingtimes„
Experiment #8; Core Compaction and MAXOPEN = 20 (Ref: Table 9 andFigure 13)
This experiment achieves a core utilization of 90.79 percentmbut an increase in channel queueing time of almost 80 percent over thebaseline figure restricts the net reduction in processing time to lessthan 5 percent.
V-24
Experiment #9: Re-entrant Fortran Compiler (Ref: Table 10 and Figure 13)
The effect of a re-entrant Fortran compiler was simulated byallowing any concurrent Fortran compile tasks to execute from a common16.38K I-bank. No improvement in throughput was noted. However, coreutilization decreased suggesting that the baseline core allocationalgorithm with a floating center gap was not compatible with the re-entrant compiler,, Further investigation is needed in this area.
I/O RELATED EXPERIMENTS
From the results discussed so far, it is obvious that a bottle-neck exists on the I/O channels» Study of the individual channel queuingstatistics points to the Fastrand subsystems as the location where thelongest queue times are experienced. The following set of experimentsdescribes the effects of increasing the number of Fastrand dual controllersfrom two to three and also of.replacing all Fastrand by a type 8440 disksystem.
An I/O service time of 70 msec, derived from the. Univac THRPUTprogram, was assumed for all Fastrand channels. However, since no such,figure was available for the 8440 disks the following comparative analysiswas performed and an estimated figure of 45 msec arrived at.
i Table 26 compares some of the operating parameters of theFastrand drum and 8440 disk.
Positioning TimeRotational latencyWord transfer rateAverage service time
Fastrand
57 m.sec35 m.sec26,283 per sec70 m.sec
8440 Disk
35 m.sec12o5 m.sec138,888 per sec
?
Table 26. . Fastrand and 8440 Disk Operating Parameters
The disk is assumed to operate in a manner similar to Fastrand,in that there is a lookahead feature which selects from a queue the requestwhich will cause minimum head movement. However, once the head is inposition there is a delay known as rotational latency which is experiencedwhile waiting for the desired record to come under the read or write head.The average value of this delay is given by the time required for thedevice to rotate one-haIf of one revolution.
The average service time Tg is given by the sum of the position-ing time I-, the latency time TL and the data transfer time TD :
V-25
i.e. Ts = Tp+ TL+ TD
hence, Tp = Tg - TL - TD
For the Fastrand drum
Tp = 70 - 35-10
= 25 tn.sec
assuming an average record size of 262 words which would requirea data transfer time of 10 m.sec. This average positioning time of 25 m.secis less than the figure of 57 m.sec quoted in Table 25 and is due to look-ahead being applied to the Fastrand request queue which results in minimumhead movement„
The 45 m.sec service time derived for the 8440 disk consists ofa 262 word transfer time of 109 m.sec, a latency of 12.5 m.sec, and apositioning time of 30.6 m.sec. This positioning time is only marginallyfaster than the figure of 35 rn.sec given in Table 25; however, it isthought to be reasonable because the disks, being faster than the Fastranddrums, will have smaller queue lengths associated with them which will leadto reduced effectiveness of the lookahead algorithm.
Experiment #10; Three Fastrand Controllers
Experiment #11; Two 8440 Disk Controllers
Experiment #12; Three 8440 Disk Controllers
Ref: Tables 11, 12, 13 and Figure 14
These experiments resulted in reduced processing times of 18.8%,20.1% and 26.8% respectively. All are typified by increased CPU utiliza-tion due to the reduction in I/O channel queue times. The greatest improve-ment in throughput is obtained when three 8440 disk controllers are employed.It is of interest to note from Figure 14 that in this case all queues areapproximately equal, i.e. the queueing delays are equally distributed through-out the system. Such a balanced system, having no significant bottlenecks,uses its resources most effectively; hence its throughput is near optimumfor the given set of operating conditions, e.g. a less than optimal coreallocation algorithm.
V-26
THROUGHPUT MAXIMIZATION EXPERIMENTS
Experiment #13; Core Compaction and Three Fastrand Controllers
Experiment #14; Core Compaction, Three Fastrand Controllers andMAXOPEN = 20
Experiment #15; Core Compaction arid Two 8440 Disk Controllers
Experiment #16; Core Compaction and Three 8440 Disk Controllers
Ref: Tables 14, 15, 16, 17 and Figure 15
This set of experiments applied those changes to the systemwhich previous experiments had'indicated were most effective in reducingthe overall processing time for the given jobmix. The most effectivechanges were related to an additional Fastrand controller, replacement ofFastrand by an 8440 disk system, core compaction, and an increase inMAXOPEN.
These experiments resulted in reduced processing times of 24.3%,26.4%, 31.0% and 35.6% due to the increase in core and'CPU utilization overthe previous set of tests. Figure 15 shows that for the first three experimentsof the above set the I/O channel queueing time has again increased and hasdisturbed the balance achieved in Experiment #12. However, this balance wasre-established within the simulator by the addition of another disk controller.
CPU TIME QUANTUM SENSITIVITY EXPERIMENTS
This set of experiments was designed to study the effect of vary-ing the CPU scheduling in an environment of a reduced I/O channel 'bottleneckand an optimum core allocation algorithm. In addition to the original systembaseline configuration, the results of Experiment #13: Core Compaction andThree Fastrand Controllers, is included in Figure 16 for ease of comparison.
Experiment #17; Core Compaction, Three'Fastrand Controllers and DoubleTime Quantum (Ref: Table 18 and Figure 16)
In this experiment, the basic CPU time quantum of 8 m.sec wasdoubled.
No significant effect was noted,
Experiment #18; Core Compaction, Three Fastrand Controllers and Half-Time Quantum (Ref: table 19 and Figure 16)
In this experiment, the basic CPU time quantum of 8 m.sec washalved.
No significant effect was noted.
V-27
Experiment #19; Core Compaction, Three Fastrand Controllers andTime Quantum Terminating on an I/O Operation(Ref: Table 20 and Figure 16)
The effect of allowing a task to hold a CPU until it requestedan I/O operation was studied in this experiment. Run priority was used inplace of the switch list level priority of the previous two tests.
No significant effect was noted.
Experiment #20; Core Compaction, Three Fastrand Controllers andCPU Priority as a Function of I/O Frequency (Ref: Table 21and Figure 16)
In this experiment high CPU priority was given to those taskshaving a large amount of I/O activity.
No significant effect was noted.
CONCLUSION ON CPU TIME QUANTUM SENSITIVITY TESTS
It is to be concluded from this set of experiments that for thesystem configuration and job mix considered, the CPU queue is the leastsignificant (see Figure 16) r.nd hence no advantage can be gained fromusing the CPUs more effi '.•. "'ly.
THIRD SHIFT EXPERIMENTS
A selected set of experiments was performed on the third shiftjob mix. Their results are discussed below and compared with the correspond-ing first shift tests.
Experiment #21; Baseline Configuration - Third Shift (Ref: Table 22 andFigure 17)
The total queueing time was 40,467 sec., and the total CPU time11,525 sec. These figures compare to 43,321 sec and 9,582 sec. respectivelyfor the first shift baseline.
Experiment #22; Zero Tape Mount Time (Ref: Table 23 and Figure 17)
Although the tape mount queue time was eliminated no reductionin overall processing time was observed, due largely to the increase incore queue time,
Experiment #23; Core Compaction (Ref: Table 24 and Figure 17)
In this case the overall effect is an increase in throughput of3.6% due mainly to CPU and core utilization figures of 53.00% and 77.64%respectively compared to the respective baseline figures of 50.95% and70.48%. As was the case when core compaction was applied to the firstshift mix, the increased user activity causes more rapid requests for I/O
V-28
thereby creating an increase in I/O channel queueing times.
Experiment #24: Three Fastrand Controllers (Ref: Table 25 and Figure 17)
This experiment resulted in a significant decrease in I/Oqueueing times, and an increase in CPU utilization as was observed with thefirst shift job mix. In this case the throughput was increased by 12.9%compared with 18.8% for the first shift job mix. This difference may wellbe attributable to the fact that the third shift jobmix consisted of asmaller number of longer running jobs compared to the first shift mix, andhence is more likely to exhibit a larger statistical variation than thefirst shift mix.
V-29
SECTION VI. CONCLUSIONS
It has proved possible to implement a deterministic throughputsimulator of the MSFC U-1108/8 system whose System Throughput Characteristicclosely matches that of the actual system. The simulation to real-timeratio was approximately 4:1 for the tests carried out.
Based on an initial verification, it is concluded that this modelis of sufficient accuracy and efficiency to be of use in determining theeffect, on throughput, of varying (a) the 1108 hardware configuration and(b) the EXEC 8 scheduling algorithms.
A set of experiments has been performed in which both hardwareand executive changes were simulated. The results from these experimentsare the basis for the following recommendations for changes in the presentMSFC UNIVAC 1108 system:
!„ Add another dual channel controller and reconfigure theFASTRAND subsystems into three banks of four units instead ofthe current configuration of two banks of six units,
2. Introduce an executive algorithm for compacting core,
3. Increase the value of the MAXOPEN parameter.
Other combinations of changes showed slightly greater improvement in systemthroughput but these three are the most cost-effective due to the minimalhardware changes. Simulator results show that these changes would increasesystem throughput by more than 20%, with most of the increase coming fromrecommendation 1, Recommendations 2. and 3. alone would not greatly enhancesystem performance and would be effective only if the FASTRAND bottleneckis first removed by recommendation 1.
It is further concluded that the techniques used in the implementa-tion of this simulator may also be applied to other systems, and such modelsmay be used as design tools in determining the optimum hardware/operatingsystem configurations for future computing systems.
VI-1
MSFC—RSA, Ala