(nasa-c-138123) advance developme of a tecbnjue … · center, princeton university, princeton, n....
TRANSCRIPT
(NASa-C-138 12 3) ADVANCE DEVELOPME OF V7-22529
A TECBNjUE FOR CHARACTERIZI1G THEIHERMONECHANICAL PROPEI IES OF THERALLY Uncls
STABLE POLYNERS Final Beport (Princeton U
National Aeronautics and Space Administration
Langley Research Center
Hampton, Virginia 23365
NASA RESEARCH GRANT NGR-001-200
Title: Advanced Development of a Technique for
Characterizing the Thermomechanical
Properties of Thermally Stable Polymers.
Final Report
Princeton University
Polymer Materials Program
Department of Chemical Engineering
Submitted for Publication in Polymer Preprints,
American Chemical Society, Los Angeles Meeting, April 1974
J. K. Gillham
Principal Investigator 609/452-4694
January 1974
https://ntrs.nasa.gov/search.jsp?R=19740014416 2019-03-01T06:26:29+00:00Z

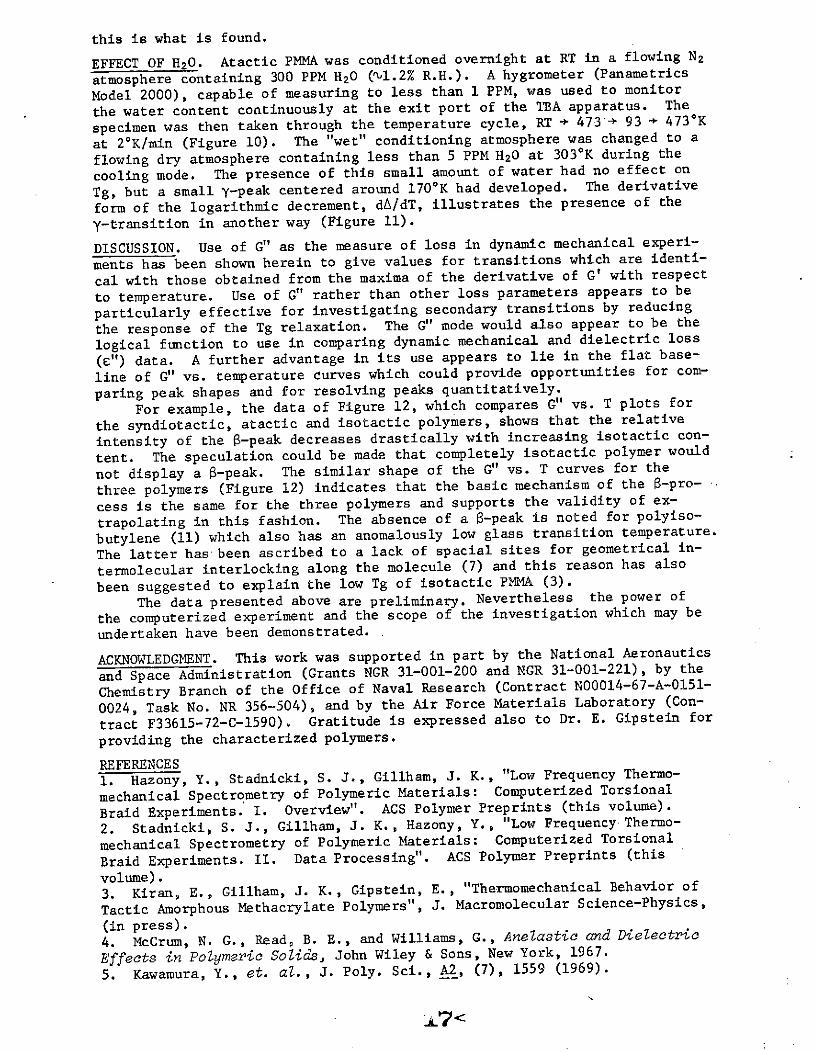
LOW FREQUENCY THERMOMECHANICAL SPECTROMETRYOF POLYMERIC MATERIALS: COMPUTERIZED
TORSIONAL BRAID EXPERIMENTS
I. OverviewII. Data Processing
III. Tactic Polymethylmethacrylates
J. K. Gillham, S. J. Stadnicki, Y. HazonyPolymer Materials Program
Department of Chemical Engineeringand
Computer CenterPrinceton University
Princeton, New Jersey 08540
ABSTRACT
The torsional braid experiment has been interfaced with a
centralized Hierarchical Computing System for data acquisition and
data processing. Such a system, when matched by the appropriate
upgrading of the monitoring techniques, provides high resolution
thermomechanical spectra of rigidity and damping, and their deriva-
tives with respect to temperature.
1<

2<LOW FREQUENCY THERMOMECHANICAL SPECTROMETRY OF POLYMERIC MATERIALS: COM-PUTERIZED TORSIONAL BRAID EXPERIMENTS - I. OVERVIEW. Y. Hazony, ComputerCenter, Princeton University, Princeton, N. J.,,and S. J. Stadnicki and J. K.Gillham, Polymer Materials Program, Department of Chemical Engineering,Princeton University, Princeton, N. J. 08540
INTRODUCTION. Torsional Braid Analysis (TBA), a variant of the torsionalpendulum technique, is a low frequency ("u 1 Hz) dynamic mechanical methodfor determining the thermomechanical spectra of polymers (1). A TBA experi-ment may run over the course of several days and generate more than 1000damped sine waves. Manual data reduction techniques to obtain the frequencyand damping constant for each analog wave, using a stopwatch and graduatedscale or even a strip-chart recorder, are slow and limited in accuracy.
It is because of difficulties in the data acquisition and data reductionprocedures that the torsional pendulum has not developed to the level of be-ing regarded as a thermomechanical spectrometer. The usefulness of the tech-nique has been limited mainly to the monitoring of transition temperaturesand time-temperature hysteresis phenomena. It is apparent that further ex-tension of the scope of research employing the torsional pendulum will re-quire a breakthrough in methodology.
A technological breakthrough will permit a deeper and more extensivestudy of problems, such as: a) Characterization of the thermomechanicalspectra in terms of analytical expressions. Such analytical formulae willintroduce new parameters to better characterize the spectra, and make it pos-sible to resolve the temperature dependent data in terms of contributionsfrom primary and secondary transitions. These developments could lead to abetter understanding of the underlying physics and chemistry of the observedtransformations; b) Comparison of the thermomechanical spectra of systemat-ic series of related polymeric materials. This will allow verification ofthe structural origin of the observed phenomena; c) Time-temperature hyster-esis phenomena. In such experiments the time-temperature cycle may be usedas a well controlled variable in order to sort out the time constants whichcharacterize the kinetics of the physical and/or chemical transformations;d) Non-linear mechanical effects. Inspection of typical dynamic mechanicalresponse curves reveals that the derived parameters are amplitude dependent.Study of the amplitude dependence would provide additional parameters tocharacterize the thermomechanical behavior of polymeric materials; and e)Fre-quency dependence of the response function. It is possible to alter the fre-quency range of measurements by at least an order of magnitude by changingthe specimen geometry and the inertial mass. This will be required to repre-sent the thermomechanical spectra in frequency-independent form.
A factor common to the above experiments is the need for the acquisitionof a large volume of data in a meaningful way. That is, the resolving powerof the sensor system as well as that of the control functions must be suchthat the observed small differences between different experimental sequencesbe significantly larger than the experimental errors. Further, in order tobe able to pursue such experiments, the reduced data must be consulted priorto the termination of the current experiment so that a timely decision withregard to the next step may be made.
The present paper discusses the results of the on-line interface of theTBA experiment to an Hierarchical Computer System for data acquisition, datareduction and control of experimental variables (2). Some experimental re-sults are demonstrated and the data reduction procedures are outlined. Sev-eral modes of presentation of the final computer-reduced data are discussedin an attempt to elucidate possible interrelations between the thermal var-iation of the rigidity and loss parameters.
OVERVIEW OF THE DATA PROCESSING SYSTEM. An important guideline for the im-plementation of a computer network for laboratory application is that thesuccess of a research project in a particular field should not depend on theproficiency of the researcher in computer technology. The experimentalistcan benefit from the advantage of the batch computer with a minimal acquaint-ance with a high-level programming language such as Fortran. The computer
can be used in a rather sophisticated multi-level data reduction operation
without knowledge of the inner workings of the particular computer or of
sophisticated coding in machine or even assembler language. The "non-expert"
use of the batch computer is quite common in theoretical work and in the
present paper such an application with a laboratory TBA experiment is dis-
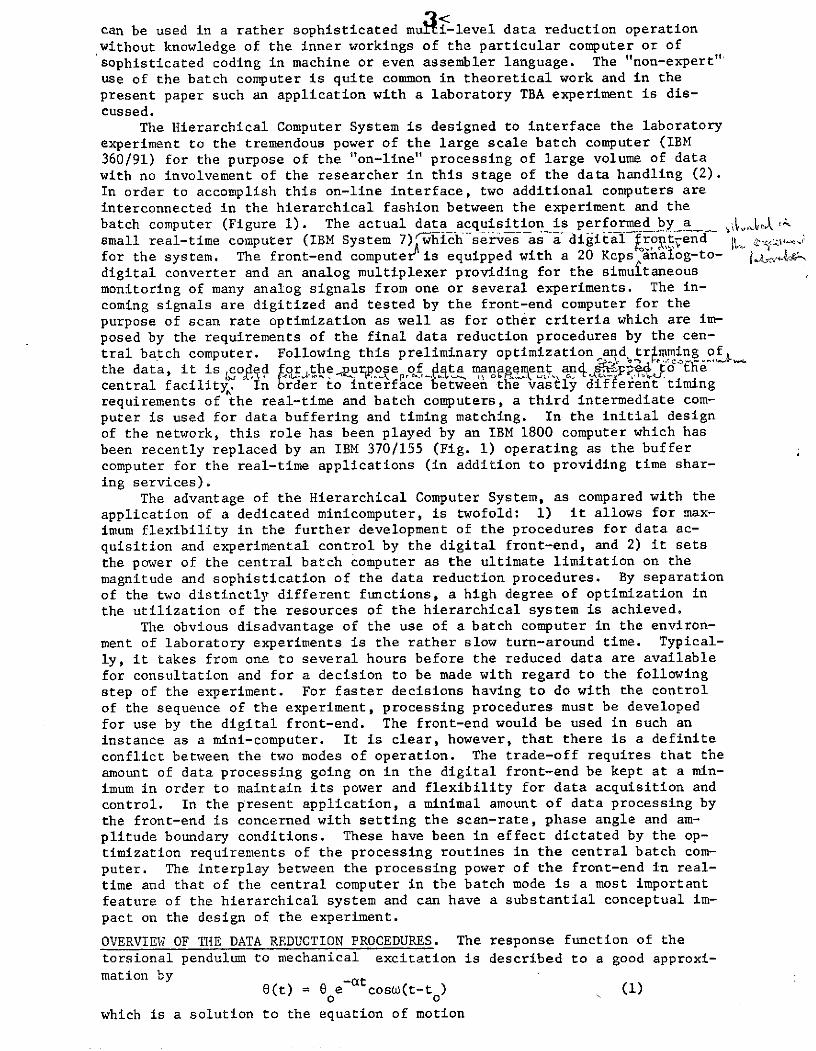
cussed.The Hierarchical Computer System is designed to interface the laboratory
experiment to the tremendous power of the large scale batch computer (IBM
360/91) for the purpose of the "on-line" processing of large volume of data
with no involvement of the researcher in this stage of the data handling (2).
In order to accomplish this on-line interface, two additional computers are
interconnected in the hierarchical fashion between the experiment and the
batch computer (Figure 1). The actual data acquisition is performed by asmall real-time computer (IBM System 7) which serves as a digital rot7end ,zL Jfor the system. The front-end computer is equipped with a 20 Kcps analog-to-digital converter and an analog multiplexer providing for the simuitaneousmonitoring of many analog signals from one or several experiments. The in-
coming signals are digitized and tested by the front-end computer for the
purpose of scan rate optimization as well as for other criteria which are im-
posed by the requirements of the final data reduction procedures by the cen-
tral batch computer. Following this preliminary optimization and tr mming of[the data, it is coded fr.the ~urpose of ta man ement an p to tecentral facility. In brder to interface between te vastly diferent timing
requirements of the real-time and batch computers, a third intermediate com-
puter is used for data buffering and timing matching. In the initial designof the network, this role has been played by an IBM 1800 computer which has
been recently replaced by an IBM 370/155 (Fig. 1) operating as the buffer
computer for the real-time applications (in addition to providing time shar-
ing services).The advantage of the Hierarchical Computer System, as compared with the
application of a dedicated minicomputer, is twofold: 1) it allows for max-
imum flexibility in the further development of the procedures for data ac-
quisition and experimental control by the digital front-end, and 2) it sets
the power of the central batch computer as the ultimate limitation on the
magnitude and sophistication of the data reduction procedures. By separation
of the two distinctly different functions, a high degree of optimization inthe utilization of the resources of the hierarchical system is achieved.
The obvious disadvantage of the use of a batch computer in the environ-
ment of laboratory experiments is the rather slow turn-around time. Typical-
ly, it takes from one to several hours before the reduced data are available
for consultation and for a decision to be made with regard to the followingstep of the experiment. For faster decisions having to do with the control
of the sequence of the experiment, processing procedures must be developedfor use by the digital front-end. The front-end would be used in such aninstance as a mini-computer. It is clear, however, that there is a definite
conflict between the two modes of operation. The trade-off requires that theamount of data processing going on in the digital front-end be kept at a min-
imum in order to maintain its power and flexibility for data acquisition and
control. In the present application, a minimal amount of data processing by
the front-end is concerned with setting the scan-rate, phase angle and am-plitude boundary conditions. These have been in effect dictated by the op-
timization requirements of the processing routines in the central batch com-
puter. The interplay between the processing power of the front-end in real-
time and that of the central computer in the batch mode is a most important
feature of the hierarchical system and can have a substantial conceptual im-
pact on the design of the experiment.
OVERVIEW OF THE DATA REDUCTION PROCEDURES. The response function of the
torsional pendulum to mechanical excitation is described to a good approxi-mation by
ee0(t) = e cosw(t-to) (1)
which is a solution to the equation of motion

S+ 2 a 6 + ( 2 + a2 )6 = 0 (2)
where 6 is the amplitude, a is the damping constant and w is the frequency
in radians/sec. Eqn. 2 may be recast in complex format
0 + (G' + iG")e = 0 (3)
where G' and G" are the in-phase and out-of-phase shear moduli, respectively.
These expressions do not include effects of experimental non-linearity of
transducers and circuits, noise, drift, as well as possible amplitude-depen-
dent terms. Equation 1 is commonly used in the analysis of torsional pendu-
lum data, manually or by dedicated analog and digital systems. This is done
by monitoring the maxima to determine the frequency and the amplitude ratios
to determine the damping constant. In the environment of the batch computer
it is possible to apply universal methods of nonlinear least mean squares
fitting. These are susceptible to generalizations designed to incorporate
in the fitting procedures contributions due to noise, drift and non-lineari-
ties. If the sampling rate is very much faster than the frequency of oscil-
lation it is possible to substitute
j = (j+- jl)/2At (4)and +l
0 = (j - 6 )/2At
S(6j+2+ 06j-20 )/4(At) 2 (5)
into Eqn. 2, resulting in (n-4) linear equations in terms of the n observa-
tions of the amplitude 6. (j = 1....n). These may be solved by standard
methods of linear least imean squares fit for the parameters a and (w2 + 2).
The obvious advantages of the linear procedure is that it does not require
initial estimates, and that it eliminates the need for iterations. An enor-
mous computational simplification is obtained by the elimination of the use
of exponentials and trigonometric expressions (Eqn. 1) in the fitting pro-
cedure.In both cases (Eqns. 1 and 2) the interplay between the use of the com-
putational powers of the digital front-end and the central batch computer
plays a crucial role in the application of the above procedures in a fully
automated mass-production effort of data analysis. The digital front-end
is responsible for the scan-rate optimization over the range of change of the
frequency and loss during a complete experiment. In using Eqn. 2 a faster
scan-rate is employed to ensure the validity of the substitution of the de-
rivatives. The second method (Eqn. 2) provides a straight forward and a more
economical (in computing costs) approach to the data reduction problem than
the first one (Eqn. 1).In order to minimize effects of non-linearity in the behavior of the
pendulum and the optical transducer, the front-end ensures that the data is
being recorded within the correct boundary conditions with respect to the
vibrational amplitude. The front-end also verifies the correct phase rela-
tionship of the data taken (equivalent to setting the to value in Eqn. 1).
This requirement, which has been found necessary empirically, might have to
do with the approximate nature of the correction for the baseline drift as
done by a more generalized version of Eqn. 2 [see part II (3) of this paper].
In the early development of the computerized experimental setup, the
linear least mean squares fitting procedure produced unacceptable scatter in
the thermal variation of the loss parameter. Attempts were made to eliminate
this scatter both by analog filtering (signal conditioning by hardware) and
by digital filtering, the latter being pursued in the batch computer. This
problem was first solved by the digital method using an iterative process to
optimize the sample size with regard to the signal to noise ratio. The op-
timal signal to noise ratio was obtained when the least mean squares analysis
was performed over an integral number of oscillations. The number of data
points used in the analysis was determined by the frequency obtained in theprevious iteration. Typically, the iteration procedure converged after three
4<
5<cycles producing results as shown in Fig. 2. Later, as a result of improve-ments in the data monitoring hardware, the quality of the primary signalshad been upgraded to the point of eliminating the need for digital filtering.This interplay between the analog and digital filtering in the optimizationof the signal-to-noise ratio is another demonstration of the power and flexi-bility of the Hierarchical Computer System for laboratory application.
At the completion of the first level of data analysis (which had beendescribed above), the reduced data is available in the batch computer in theform of the temperature dependence of two variables: the damping constant,a, and the relative in-phase shear modulus, G' = 2 + a2 . This particularpresentation derives from the use of Eqn. 2 in the data reduction procedure.Alternative modes of data presentation may be derived from the use of Eqns.
1 and 3 (Table I). The logarithmic decrement is defined as the natural log-
arithm of the ratio of two successive maxima of the damped cosine function(Eqn. 1). The relative rigidity of the composite specimen is a simplifica-tion of the relative in-phase shear modulus, G' (elastic shear modulus), thetwo parameters being equivalent for low damping values. Absolute values are
not specified for the above parameters because the configuration of the poly-mer-impregnated glass braid precludes precise measurements of dimensions.It is the relative thermal variation of the two parameters which is being
monitored by the TBA technique.In addition to the above forms of data presentation, derivatives of
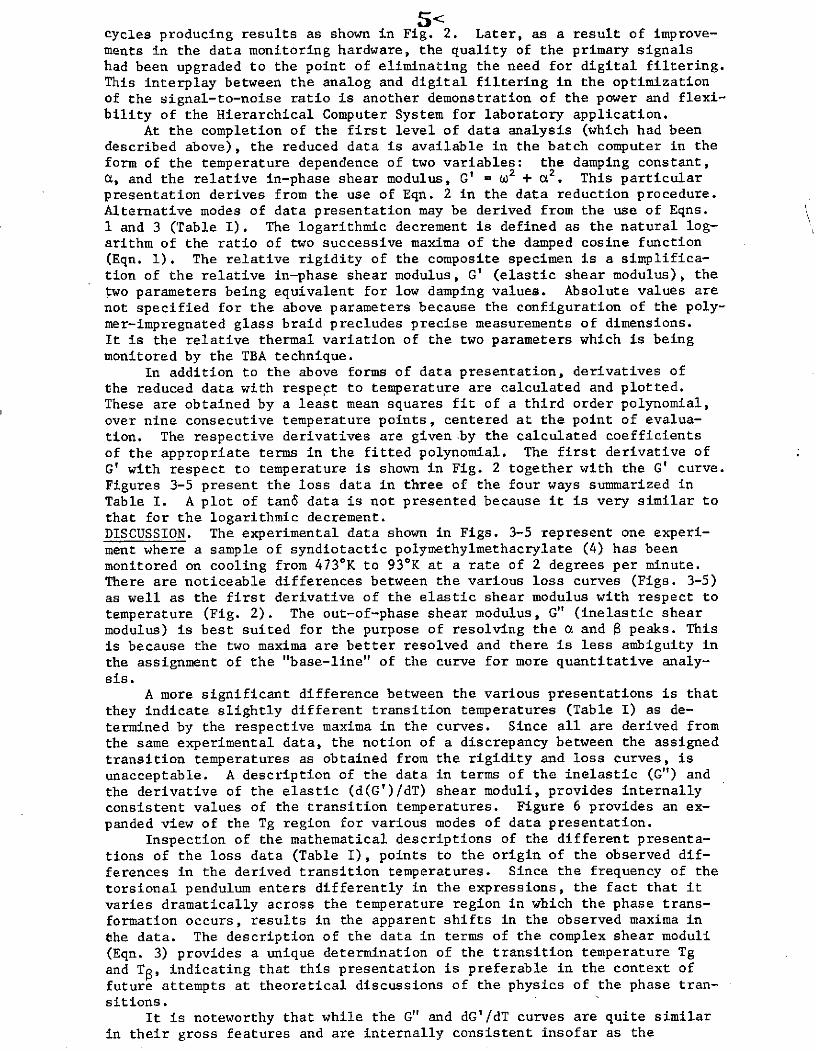
the reduced data with respect to temperature are calculated and plotted.These are obtained by a least mean squares fit of a third order polynomial,over nine consecutive temperature points, centered at the point of evalua-tion. The respective derivatives are given-by the calculated coefficients
of the appropriate terms in the fitted polynomial. The first derivative of
G' with respect to temperature is shown in Fig. 2 together with the G' curve.Figures 3-5 present the loss data in three of the four ways summarized inTable I. A plot of tan6 data is not presented because it is very similar tothat for the logarithmic decrement.DISCUSSION. The experimental data shown in Figs. 3-5 represent one experi-ment where a sample of syndiotactic polymethylmethacrylate (4) has beenmonitored on cooling from 4730 K to 930K at a rate of 2 degrees per minute.There are noticeable differences between the various loss curves (Figs. 3-5)as well as the first derivative of the elastic shear modulus with respect totemperature (Fig. 2). The out-of-phase shear modulus, G" (inelastic shearmodulus) is best suited for the purpose of resolving the a and peaks. This
is because the two maxima are better resolved and there is less ambiguity in
the assignment of the "base-line" of the curve for more quantitative analy-sis.
A more significant difference between the various presentations is thatthey indicate slightly different transition temperatures (Table I) as de-termined by the respective maxima in the curves. Since all are derived fromthe same experimental data, the notion of a discrepancy between the assignedtransition temperatures as obtained from the rigidity and loss curves, isunacceptable. A description of the data in terms of the inelastic (G") andthe derivative of the elastic (d(G')/dT) shear moduli, provides internallyconsistent values of the transition temperatures. Figure 6 provides an ex-panded view of the Tg region for various modes of data presentation.
Inspection of the mathematical descriptions of the different presenta-tions of the loss data (Table I), points to the origin of the observed dif-ferences in the derived transition temperatures. Since the frequency of thetorsional pendulum enters differently in the expressions, the fact that itvaries dramatically across the temperature region in which the phase trans-formation occurs, results in the apparent shifts in the observed maxima inthe data. The description of the data in terms of the complex shear moduli(Eqn. 3) provides a unique determination of the transition temperature Tgand T , indicating that this presentation is preferable in the context offuture attempts at theoretical discussions of the physics of the phase tran-sitions.
It is noteworthy that while the G" and dG'/dT curves are quite similarin their gross features and are internally consistent insofar as the

transition temperatures are concerned, they are substantially different in
the details and contain therefore complementary rather than redundant in-
formation.
REFERENCES1. Gillham, J. K., "Torsional Braid Analysis -- A Semimicro Thermomechanical
Approach to Polymer Characterization", CRC Critical Reviews in Macro-molecular Science , 1, 83 (1972).
2. Hazony, Y., "Hierarchical Computing in Laboratory Experiments: Potential
and Pitfalls", Computer Phys. Comm. 4, 279 (1972).3. Stadnicki, S. J., Gillham, J. K., Hazony, Y., "Low Frequency Thermo-
mechanical Spectrometry of Polymeric Materials: Computerized Torsional
Braid Experiments - II. Data Processing", ACS, Polymer Preprints(this volume).
4. Gillham, J. K., Stadnicki, S. J., Hazony, Y., "Low Frequency Thermo-
mechanical Spectrometry of Polymeric Materials: Computerized Torsional
Braid Experiments - III. Tactic Polymethylmethacrylates", ACS, PolymerPreprints (this volume).
ACKNOWLEDGMENT. This work was supported in part by the National Aeronautics
and Space Administration (Graits NGR 31-001-200 and NGR 31-001-221), by theChemistry Branch of the Office of Naval Research (Contract N00014-67-A-0151-
0024, Task No. NR 356-504) and by the Air Force Materials Laboratory (Con-
tract F33615-72-C-1590). It is our pleasure to thank Messrs. Robert Cassidy
and Peter Olenick of the Princeton University Computer Center for the develop-
ment of the necessary system software and Mr. Colin Bell of the Natural RubberResearch Products Association, U.K., for his contributions in the early stages
of this work.
TABLE I. DIFFERENT MODES OF DATA PRESENTATION -SYNDIOTACTIC PMMA.
Tg, OK T OKA. Rigidity (G')K T,
W2 + a2 399
Relative rigidity = 0 399
2 _ a2 399
B. Loss Parameter
G" = 2a t 399 294
Damping coefficient = a 400 298
Log decrement = A = 2fc/w 403 298
tand = 2aw/(w2 + a2) 403 298
Tg values obtained from dG'/dT; the theoretical basis for the different
rigidity parameters is discussed in, Nielsen, L. E., Mechanical Properties ofPolymers, Chapter 7, Reinhold Publishing Corp., New York, 1965.

TBA AND PYROLYSIS LABORATORY
GCPYROLYZER VAPOR PHASE IR
MASS CHROMATOGRAPH IBMV f360/91
------------ IBM SYSTEM 7DAMPED WAVE I "I I DIGITAL
STBA TEMPERATURE ADC FRONT IB1I END I 370/15
I HUMIDITY LEVEL
DAC
iTBA -
r---- , " REDUCEDTB DATA
FIGURE 1
B-7-
6-+" ++ 4.
6-
S 4
( ++ +
S+4.
0+-+ +
"
7-
2-
DI01FFERENT MODES OF
DATR PRESENTATION200.00 250.00 00.00 350.00 40.00 450.00 500.00
TEMPERATURE.0EG. K
SYNDIOTRCTIC PMMR FIGURE 6

8<
DRY TO 73 DES K ODRY TO 473 DEG K
ORY TO 473 EG"
ttP Cr6-
x B
0- - + :+ 0*
bfh . 7+* 0 - ,+,
Lu F .
C3 Z_*
1 4p
+r
LoI
EXPER[iMENTAL RUN EXPERIMENTAL RUNor 47:63 DEG K ' 473-93 DEG K
~ i*
cl00 lo.po - 2u.0 ao 0.00 40.00 50.00 60i.00,oc 40-u00u. T ,o-m + r2 TEMPERRTUREOEG. KXI ] K×IO1
)
SYNOIOITRCTIC PHMM FIGURE 2 5YNOIOTFRCTIC PHMMAFGR
OR) ,rG 043 DEG K [1•.,Hi T " q73 DEC, i
(r r
a, K /:
t
z - aorr ~
S * *l '
SZ-
i'$ 4.
-EXERPENTRL RUN EXPERIMENTRL RUN
, '-- 73. 3 - 93 IG i
~~~~0.00 40.00 0 0 1(.0 000 30.00 40.00 00.00 60.0000 00 U 30.00 0UO 0.0 SUO TEMF'ERRTURE, OEG. K (K 1
1TEMF- ,-RRT ,RE,OEG. ,. X10 tiO1
r " T , FIGURE 5 ,( T I FIGURE 3
FIGu2 SYNOTALTIC PMMRSYNIEITRTIL PMMR
f;~j 47li3 555; K . SHi TO 73 DES K
I-
I -
I' u2 - -
it I;~ ;-:- i 40r4 P7~ 47FGR
u-n (NL:CTPI TI RM_
LOW FREQUENCY THERDOMECHANICAL SPECTROMETRY OF POLYMERIC MATERIALS:COMPUTERIZED TORSIONAL BRAID EXPERIMENTS - II. DATA PROCESSING. S. J.Stadnicki and J. K. Gillham, Polymer Materials Program, Department of
Chemical Engineering and Y. Hazony, Computer Center, Princeton University,Princeton, N. J. 08540.
INTRODUCTION. The effectiveness of torsional pendulum studies has been
limited due to difficulties in processing large amounts of data. Manual data
reduction techniques, to determine the rigidity and damping for each damped
wave, using a stopwatch and graduated scale, or a strip-chart recorder, are
slow and limited in accuracy. An overview of the Hierarchical Computer Sys-
tem used with a Torsional Braid Analysis (TBA) apparatus for fully automateddata acquisition, reduction, and presentation has been described in Part I
(1-3).The present manuscript deals with data processing.On-line data acquisition and preprocessing are performed by a computer
which is situated in the experimental laboratory. The data reduction pro-
gram which employs a linear least mean squares fit of the data to the dif-
ferential form of the equation of motion, is written in Fortran and is pro-
cessed in a batch computer. An intermediate computer is employed for data
buffering and for matching the time requirements of the batch computer.Evolution of the data reduction scheme is outlined.
INSTRUMENTATION. An IBM System/7 computer is employed in conjunction with a
torsional braid apparatus for on-line data acquisition and preprocessing.At the time of this work, an Hierarchical Computer System was used with the
data transmitted through an IBM 1800 computer (employed for data buffering)and then onto an IBM 360/91 batch computer for data reduction. The final
presentation of the thermomechanical parameters as a function of temperature
is obtained on a Calcomp Plotter. Presently,the data are sent by telecommu-
nication from the System/7 directly to an IBM 370/155 computer which is at-
tached to the IBM 360/91.The capabilities of the present preprocessing facility are as follows:
1. Four digit analog to digital conversion.2. Maximum scan rate of 20,000 samplings per second.3. Running several simultaneous experiments.4. Reduced data transmission directly to the laboratory.5. Real time local control functions.
A summary of the data acquisition and preprocessing characteristics of
the present procedure are as follows:1. A data acquisition rate of 100 points per second (3).
This scan rate is automatically adjusted to acquirea minimum of two complete cycles.
2. Acquisition of approximately 600 raw data points from
each damped wave. (The reduction program at the batchcomputer utilizes all of these to obtain one reduceddata point for each of the frequency and dampingparameters.)
3. Standardization of phase angle and amplitude boundaryconditions of the data to be acquired.
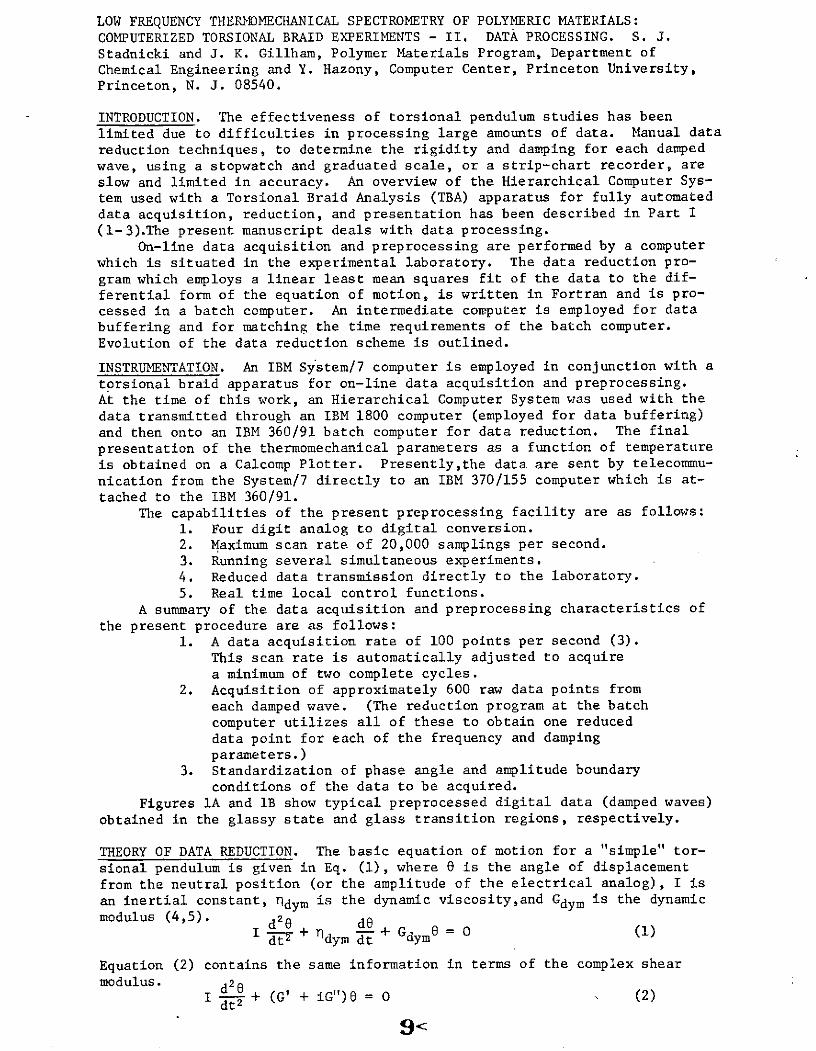
Figures 1A and lB show typical preprocessed digital data (damped waves)obtained in the glassy state and glass transition regions, respectively.
THEORY OF DATA REDUCTION. The basic equation of motion for a "simple" tor-
sional pendulum is given in Eq. (1), where e is the angle of displacement
from the neutral position (or the amplitude of the electrical analog), I isan inertial constant, ndym is the dynamic viscosity,and Gdym is the dynamic
modulus (4,5). d2 de+I dtT + qdym dt dym
Equation (2) contains the same information in terms of the complex shearmodulus. d20
I dt2 + (G' + iG")O = O (2)
9<

The solution to Eq. (1) has the form of an exponentially damped cosine func-
tion0 = O e cos(wt + 0) (3)
witha = fdym/ 2 1
1/2and = [Gdym/I - (dym/21) 2 ]
where a is the damping coefficient and w is the frequency in radians per
second. A phase angle term, 4, has been introduced because of the timing ofthe initiation of data acquisition. Because the TBA specimen has a tendencyto twist, especially during a transition, causing a drift in the baseline,
the equation describing the actual amount of deflection at any point in time
is more closely represented by Eq. (4).
0 = 0 e cos(Wt + ) + t + C (4)o
The differential equation corresponding to Eq. (4) is used in the linear
least mean squares analysis of the digitized data,
d2 + 2cad + (U2 + W2) 0 C(a 2 + w 2) - 2a - 8(a 2 + w2)t = O (5)dt2 dt
which may be simplified to
d2 8 deD = dt-+ A- + A2 + A3t + A = O (6)
where Ai are the parameters fitted by the analysis, and
S= A1/2 1/21/2
= [A 2 - (A1 /2) 2]
(The significance of D will be discussed below.) The derivative values of 0
at any point n were calculated numerically from an extension of Newton's
Forward Formula, which utilizes 5 consecutive points to obtain the first and
second derivatives (6). These derivative formulae are refinements of the
expressions used in Part I of this paper (3) and are given by
de
n = (-n+2 + 8n+1 - 8n- + n-2)/12h (7)
d 2 0(-6 + 160 - 300 + 160 - )/12h 2 (8)
dt2 n+2 n+l n n-l n-2
where h is the step size.
LINEAR LEAST MEANS SQUARES ANALYSIS. The linear least mean squares fitting of
N experimental data to the differential form of the equation of motion in-
volves minimization of the summation,N-2 N-2
S = v 2 (fn - D )2 (9)n=3 n-3
where v 2 are the squares of the approximation errors and f is derived fromn n
the experimental datad
f d + AI n + A + A3tn + A (10)n dt 2 1 dt 2 n 3 n 4
n n
The respective derivatives are defined by Eqns. 7 and 8. t is n divided by
the scan rate. Dn is identically zero by definition (Eqn. g). The limits
of the summation (n = 3 to N - 2) have been dictated by the method for ob-
taining the derivatives. From the requirement that S is minimized, it fol-
lows that,
10<

S = 2 0 v n = 0 (i = 1 to 4) (11)-Ai nA.i n 1
This results in four simultaneous linear equations which may be presented in
matrix notation:
n n n n n 1 n nn n nn n
66 8 I 8 6 6 8t Am = n n
n n n e n n 2 nnn n n n n
n n n 3 nn n n n n
Ot Ot It It 2 A4 - tn n n n nn
n n n n n
The above expression can be solved by a matrix inversion procedure to deter-
mine the values of the coefficients Ai . Al and A2 contain the damping and
frequency parameters (see above).
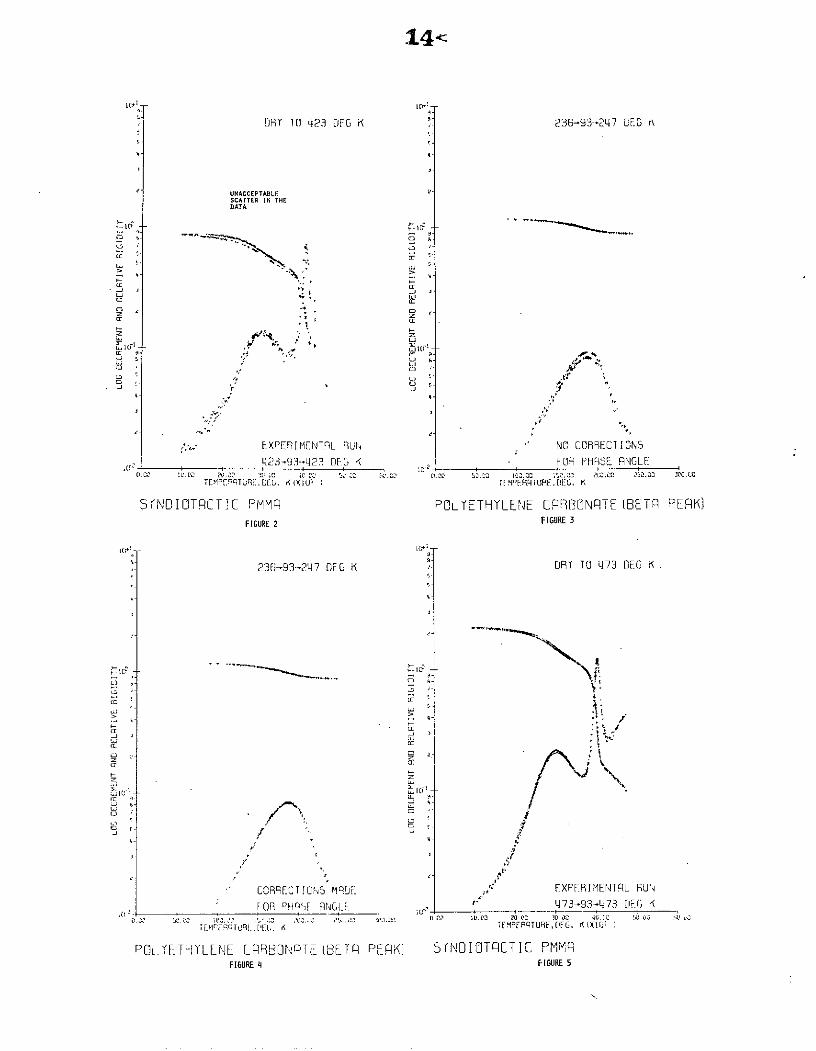
REFINEMENT OF DATA REDUCTION TECHNIQUE. Even with the use of low pass signal
filters (cut-off frequency of 2 Hz), the initial automatic data reduction
technique was found to produce data with unacceptable scatter in the damping,
although the frequency data was acceptable (Figure 2). (The two rigidity
curves in Figure 2 are the consequence of thermohysteresis - see below.) The
first refinement involved truncation of the data so that an integral number
of cycles was analyzed. The excess points were eliminated from further com-
putation. Effectively this is a digital filtering technique which was em-
pirically found to improve the signal-to-noise ratio. Frequency, damping,
and the number of points comprising the maximum number of integral cycles
are determined by an iterative process which typically converges after 3
cycles. Computer simulations have demonstrated that this operation is theo-
retically unnecessary for noise-free data.Once this change had been incorporated into the data reduction program,
the reduced data for the damping appeared to be on two distinct levels (Fig-
ure 3). This phenomenon was traced back to the fact that the incoming data
at the initiation of data storage had either a zero degree or 180 degree
phase angle associated with it, corresponding to a maximum and a minimum in
the oscillations of the analog damped wave. After the data acquisition pro-
gram was modified to accept data only at a phase angle of zero degrees, the
reduced data were on a single curve (Figure 4). Upon even closer examina-
tion, the damping curve showed signs of small discontinuities which were
traced back to the procedure used to adjust for the baseline drift due to
specimen twisting. This corrective action is employed to compensate for the
non-linearity of the response curve of the optical transducer. This instru-
mentation problem has been solved manually (Figure 5) and a technique for
automatic drift compensation is being developed (7). Alternatively,the com-
puter itself can be programmed to compensate for non-linearities which can
be incorporated into the equation of motion. With the increased sensitivity
of the system, it is now essential to control precisely the temperature pro-
gramming as fluctuations in the data are observable in regions in which there
are non-constant rates of temperature change. As an example of the resolu-
tion of the experimental results, a linear expansion of the modulus data
through a secondary transition is presented in Figure 6. The two different
sets of data for decreasing and increasing temperature (thermohysteresis) are
attributed to properties of the polymeric specimen per se, and not to the
methods used in processing the data. This phenomenon will be discussed else-
where (8).
COMMENT. The present system provides a powerful tool for the study of ther-
momechanical properties of polymeric materials and its flexibility allows
for extensive conceptual evolution of the experimental design. While this
report presents preliminary data, further refinements of the system are in
progress. These include upgrading of the TBA instrumentation, refinementof the data reduction procedure, optimization of the data acquisition parame-
ters, as well as development of data analysis techniques for more quantita-tive interpretations of the thermomechanical spectra.
REFERENCES1. Gillham, J. K., "Torsional Braid Analysis -- A Semimicro Thermomechanical
Approach to Polymer Characterization", CRC Critical Reviews in Macro-molecular Science, i, 83 (1972).
2. Hazony, Y., "Hierarchical Computing in Laboratory Experiments: Potential
and Pitfalls", Computer Phys. Comm. 4, 279 (1972).3. Hazony, Y., Stadnicki, S. J., Gillham, J. K., "Low Frequency Thermo-
mechanical Spectrometry of Polymeric Materials - I. Overview", ACS,Polymer Preprints (this volume).
4. Tobolsky, A. V., Properties and Structure of Polymers, Chapter 3, JohnWiley & Sons, Inc., New York, 1962.
5. Nielsen, L. E., Mechanical Properties of Polymers, Chapter 7, ReinholdPublishing Corp., New York, 1965.
6. Lapidus, L., Digital Computation for Chemical Engineers, Chapter 4,McGraw Hill Book Co., Inc., New York, 1962.
7. Bell, C. L. M., unpublished results.8. Gillham, J. K., Stadnicki, S. J., and Hazony, Y., "Low Frequency Thermo-
mechanical Spectrometry of Polymeric Materials - III. Tactic Poly-
methylmethacrylates", ACS, Polymer Preprints (this volume).
ACKNOWLEDGMENT. This work was supported in part by the National Aeronautics
and Space Administration (Grants NGR 31-001-200 and NGR 31-001-221), by the
Chemistry Branch of the Office of Naval Research (Contract N00014-67-A-0151-
0024, Task No. NR 356-504) and by the Air Force Materials Laboratory (Con-
tract F33615-72-C-1590). It is our pleasure to thank Messrs. Robert Cassidy
and Peter Olenick of the Princeton University Computer Center for the develop-
ment of the necessary system software and Mr. Colin Bell of the Natural Rubber
Research Products Association, U.K., for his contributions in the early stages
of this work.
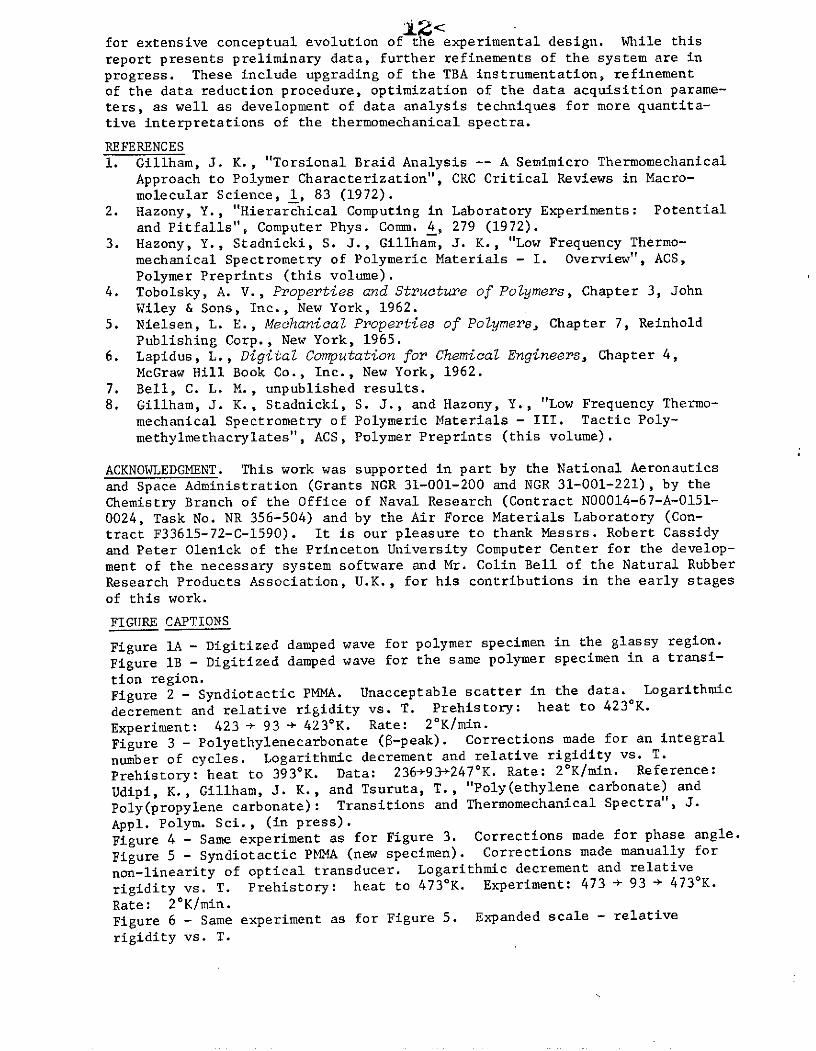
FIGURE CAPTIONS
Figure 1A - Digitized damped wave for polymer specimen in the glassy region.
Figure 1B - Digitized damped wave for the same polymer specimen in a transi-
tion region.
Figure 2 - Syndiotactic PMMA. Unacceptable scatter in the data. Logarithmic
decrement and relative rigidity vs. T. Prehistory: heat to 4230K.
Experiment: 423 + 93 + 423 0K. Rate: 20K/min.
Figure 3 - Polyethylenecarbonate (B-peak). Corrections made for an integral
number of cycles. Logarithmic decrement and relative rigidity vs. T.
Prehistory: heat to 393 0K. Data: 236+93+2470 K. Rate: 20K/min. Reference:
Udipi, K., Gillham, J. K., and Tsuruta, T., "Poly(ethylene carbonate) and
Poly(propylene carbonate): Transitions and Thermomechanical Spectra", J.
Appl. Polym. Sci., (in press).
Figure 4 - Same experiment as for Figure 3. Corrections made for phase angle.
Figure 5 - Syndiotactic PMMA (new specimen). Corrections made manually for
non-linearity of optical transducer. Logarithmic decrement and relative
rigidity vs. T. Prehistory: heat to 473 0K. Experiment: 473 + 93 + 473 0 K.
Rate: 20K/min.
Figure 6 - Same experiment as for Figure 5. Expanded scale - relative
rigidity vs. T.

G; EL
RST[
C SH
ERR
NOOU
LUS-
LINF
RR
SCRL
E'4
5 .0
5!.
o0
55.0
0
80.0
0
85.!0
70.[
!0
75.0
}0
80
.00
85.0
0
90.0
0
5
-.
-.
-U.5
i.
-LI.
Z
[tO
L
. : tS
L
. :5
, O
0
3Z
-f
_ -- ..
..
......
.....
......
....
..
..
..
...
....
Z -
' ,
,-.-
.
.
n
n ,
-
C~
~~
i ..
..
..
..
.. .
..
..
...
...
..
2 -
11
.5
, 2
-..
-.
' -v
:.
r2_
I.
I i
i i
i i
-
C-.-..
.
82I
:-~
t~C
.
C~
.~ .
DRY TO q23 DEG K- 236-93--247 DEG r\
UNACCEPTA1 LESCATTER IN THEDATA
C- w EXPE*9MENTL Uq NU COR9ECTIONS
c
V ' " C;--.
q23-93--q23 DEG K FOR PHRSE ANGLE0 !U. 2b.* 3 .00 4c 10 21 0 0 2 Cc 1 5 0. o
COFRIECTO9S MUE I EXPERENTA irU
a- c---~------, cr
TEM"t TE TURE,[JF.. ( Il(XiJo IFM ERATURE,6EG. K
5NOITRCTIPYE PM T POLETYLEN CRNBONTTETBETRM PERK)FIGURE 2 FIGURE 3
236-93--247 DE' K DRT TO i73 DEG K.
C-,
C
, /
CFRECTOLS !NDE BU EXPCRIMENTIL RUN
L123.9 2 DEN rG . DA P73-93-73 DE NG
T E;i u-£q E R! . [FF. XR qTURE,[,FG. K XItf'
POLYETHTLENE LROI.:LqTE ETFq PERAK: S(ND[TRCTIC PMMTFIGURE FIGURE FIRE 5
LOW FREQUENCY THERMOMECHANICAL SPECTROMETRY OF POLYMERIC MATERIALS:COMPUTERIZED TORSIONAL BRAID EXPERIMENTS. III. TACTIC POLYMETHYLMETHA -CRYLATES. J. K. Gillham, and S. J. Stadnicki, Polymer Materials Program,Department of Chemical Engineering,and Y. Hazony, Computer Center, PrincetonUniversity, Princeton, N. J. 08540
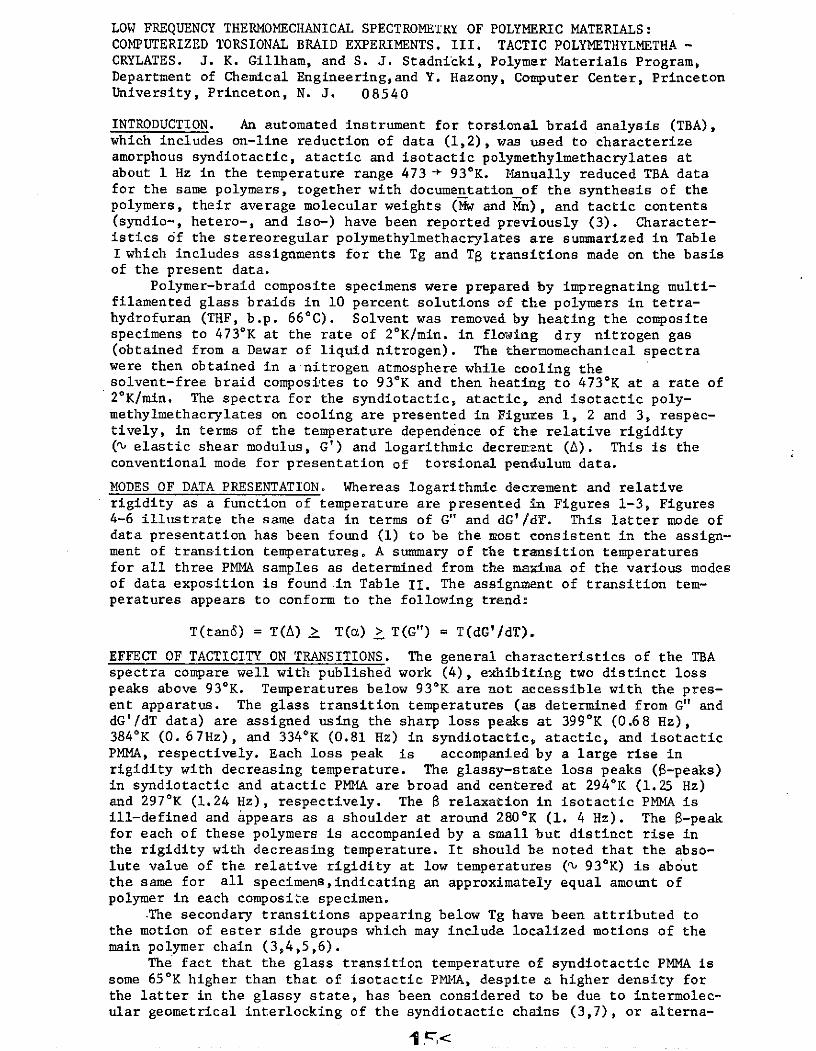
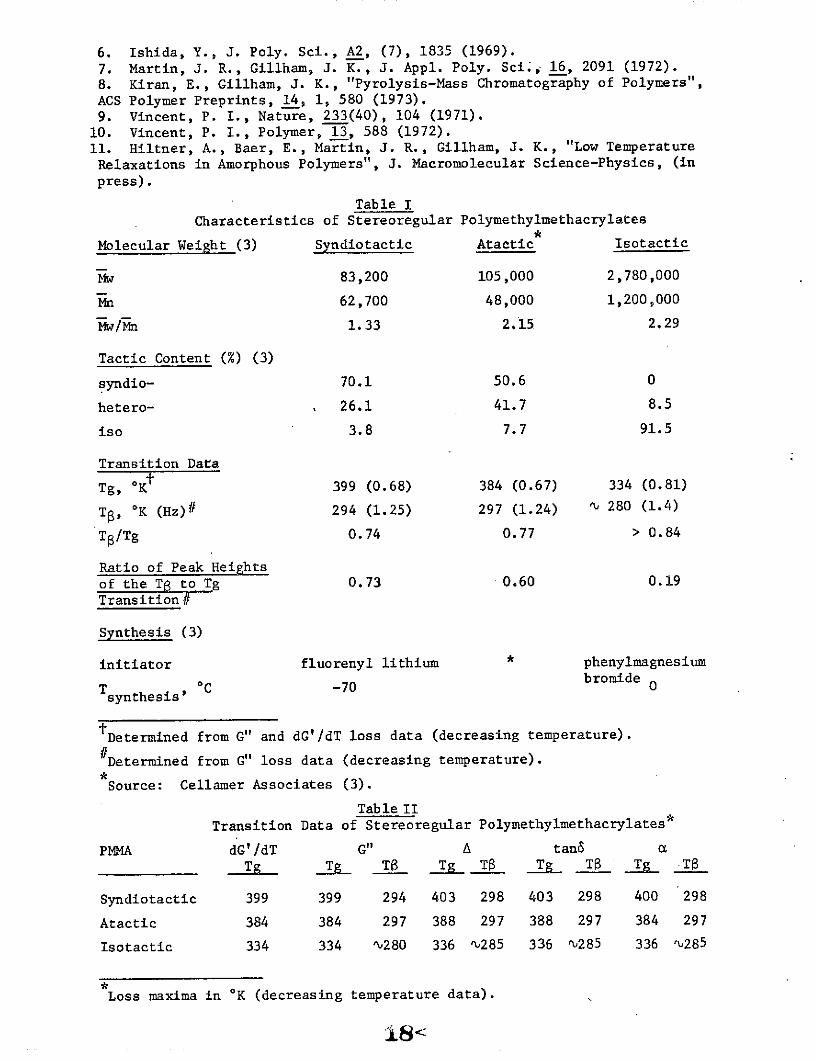
INTRODUCTION. An automated instrument for torsional braid analysis (TBA),which includes on-line reduction of data (1,2), was used to characterizeamorphous syndiotactic, atactic and isotactic polymethylmethacrylates atabout 1 Hz in the temperature range 473 - 930 K. Manually reduced TBA datafor the same polymers, together with documentation of the synthesis of thepolymers, their average molecular weights (Mw and Mn), and tactic contents(syndio-, hetero-, and iso-) have been reported previously (3). Character-istics 6f the stereoregular polymethylmethacrylates are summarized in TableI which includes assignments for the Tg and TB transitions made on the basisof the present data.
Polymer-braid composite specimens were prepared by impregnating multi-filamented glass braids in 10 percent solutions of the polymers in tetra-hydrofuran (THF, b.p. 660C). Solvent was removed by heating the compositespecimens to 473 0K at the rate of 20K/min. in flowing dry nitrogen gas(obtained from a Dewar of liquid nitrogen). The thermomechanical spectrawere then obtained in a-nitrogen atmosphere while cooling thesolvent-free braid composites to 93*K and then heating to 473 0K at a rate of20K/min. The spectra for the syndiotactic, atactic, and isotactic poly-methylmethacrylates on cooling are presented in Figures 1, 2 and 3, respec-tively, in terms of the temperature dependence of the relative rigidity(", elastic shear modulus, G') and logarithmic decrement (A). This is theconventional mode for presentation of torsional pendulum data.
MODES OF DATA PRESENTATION. Whereas logarithmic decrement and relativerigidity as a function of temperature are presented in Figures 1-3, Figures4-6 illustrate the same data in terms of G" and dG'/dT. This latter mode ofdata presentation has been found (1) to be the most consistent in the assign-ment of transition temperatures. A summary of the transition temperaturesfor all three PMMA samples as determined from the maxima of the various modesof data exposition is found in Table II. The assignment of transition tem-peratures appears to conform to the following trend:
T(tan6) = T(A) 2 T(a) > T(G") = T(dG'/dT).
EFFECT OF TACTICITY ON TRANSITIONS. The general characteristics of the TBAspectra compare well with published work (4), exhibiting two distinct losspeaks above 930 K. Temperatures below 930K are not accessible with the pres-ent apparatus. The glass transition temperatures (as determined from G" anddG'/dT data) are assigned using the sharp loss peaks at 399 0K (0.68 Hz),384 0K (0. 67Hz), and 3340 K (0.81 Hz) in syndiotactic, atactic, and isotacticPMMA, respectively. Each loss peak is accompanied by a large rise inrigidity with decreasing temperature. The glassy-state loss peaks (s-peaks)in syndiotactic and atactic PMMA are broad and centered at 294 0K (1.25 Hz)and 2970K (1.24 Hz), respectively. The B relaxation in isotactic PMMA isill-defined and appears as a shoulder at around 2800 K (1. 4 Hz). The $-peakfor each of these polymers is accompanied by a small but distinct rise inthe rigidity with decreasing temperature. It should be noted that the abso-lute value of the relative rigidity at low temperatures (1 930 K) is aboutthe same for all specimens,indicating an approximately equal amount ofpolymer in each composite specimen.
.The secondary transitions appearing below Tg have been attributed tothe motion of ester side groups which may include localized motions of themain polymer chain (3,4,5,6).
The fact that the glass transition temperature of syndiotactic PMMA issome 650 K higher than that of isotactic PMNIA, despite a higher density forthe latter in the glassy state, has been considered to be due to intermolec-ular geometrical interlocking of the syndiotactic chains (3,7), or alterna-
-1 C <

tively to differences in intramolecular chain stiffness (4). It should be
noted that the molecular weight of the isotactic sample is some 30 times
that of both the syndiotactic and atactic forms which, if anything, should
have the effect of raising the glass transition temperature. The influence
of molecular weight on the intensity of the B-peak is not known. The similar-
ity of the thermomechanical spectra of atactic and syndiotactic PMMA was not
unexpected due to the small difference between them in microtacticity con-
tent (50% versus 70% syndiotacticity).
EFFECT OF PREHISTORY. A problem of concern to the mechanical spectroscopistis the determination of the most suitable conditioning variables for specimen
preparation. To obtain the relaxation spectrum of a polymer per se, it is
necessary to prepare the specimen in a manner which removes all occluded
volatiles (e.g., solvent and absorbed moisture) without causing crosslinking
or degradation. Thermogravimetric analysis (TGA), often used to complement
thermomechanical spectroscopy, is employed to determine temperature regions
in which weight loss occurs. A more informative approach determines the
volatile components upon heating by employing a pyrolyzer in series with a
mass chromatograph (8) and an "on-the-fly" infrared spectrophotometer .
Thermogravimetric analysis of isotactic PMMA showed a 1-2% weight loss
in heating to 4730 K after predrying to 4230 K. Mass chromatographic analysis
of the volatile products of hpating in the 433 to 4730K range indicated one
major volatile component having a molecular weight of about 93. Monomer was
not detected until above 5230 K. A check of the synthesis procedure (3)
indicated that petroleum ether (Css and C6s) was used as one of the solvents
for purification and was probably the volatile component in question.
Figure 7 shows the thermomechanical spectra (logarithmic decrement vs.
temperature) of a single specimen of syndiotactic PMMA after preheating first
to 423 0K and then to 473 0K, respectively, at the rate of 20K/min. Plastici-
zation by bound solvent is apparent. The glass transition temperature of
the specimen dried more thoroughly is some 11 degrees higher. The secondary
transition (2980 K) does not appear to have been affected, but the observed
differences in the loss levels at temperatures between TB and Tg and also
at '1100K are attributed to the presence of the small amount of diluent.
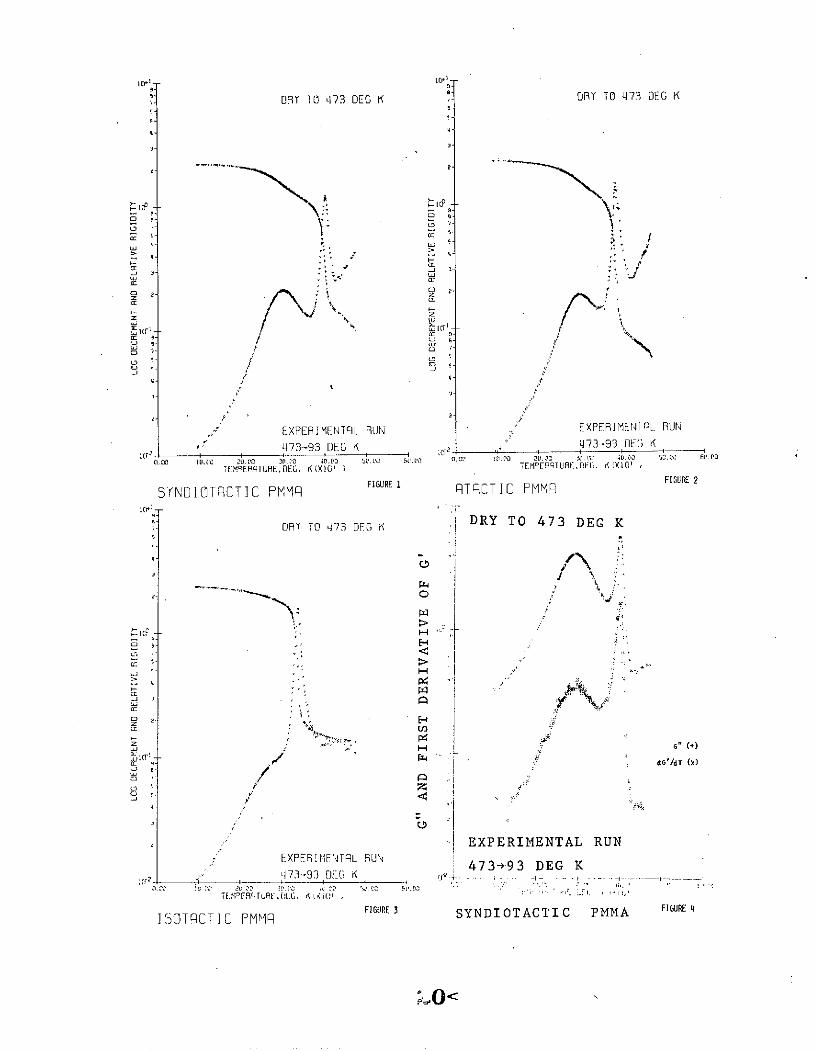
EFFECT OF THERMAL CYCLING. Figure 8 presents the thermomechanical spectra,G" and G' versus temperature for syndiotactic PMMA preheated to 473
0K. Ex-
perimental data is displayed during cooling to 930K and subsequent heating
to 473 0K at 20K/min. The thermohysteresis in the G" loss data at low tem-
peratures may be due either to inaccurate temperature assignment (thermal lag
between the thermocouples and specimen) or to microcracking of the composite
specimen. Correct temperature assignment is indicated at higher temperatures
since the data lie on one curve. Figure 9 illustrates a portion of the
elastic shear modulus curve, G', (shown in Figure 8) on an expanded linear
scale. The irreversibility in the rigidity, upon first cooling to 930K and
then heating, is attributed to microcracking of the composite specimen. The
mechanism leading to these cracks may involve the thermal stresses which
arise from the different coefficients of contraction of the two phases of
the specimen. Polymers with bulky side groups are observed to be susceptible
to cracking (3) probably because there are weaker cohesive forces between
chains, per unit cross-sectional area, than for more compact molecules (9,10). The fracture mechanism may also involve penetration of trace amounts
of water into small pores and its subsequent expansion upon freezing. The
moisture content of the "dry" nitrogen atmosphere was measured to be about
5 PPM which corresponds to a frost point of about 2070K. In a similar
manner, occluded solvent could form voids upon freezing which could be sites
for initiation of cracks. Alternatively, cracks may originate from the stress
applied to initiate pendulum oscillations, particularly at low temperatures
where the side group motions are frozen out. In any case, the loss level
would be expected to be higher after a crack,reflecting an increase in the
ability of the composite specimen to dissipate energy on deformation. In a
like manner, the elastic modulus curve would be expected to be at a lower
level on heating after cracking,indicating a less rigid structure. Indeed,
this is what is found.
EFFECT OF H20. Atactic PMMA was conditioned overnight at RT in a flowing N2
atmosphere containing 300 PPM H20 ('1.2% R.H.). A hygrometer (Panametrics
Model 2000), capable of measuring to less than 1 PPM, was used to monitor
the water content continuously at the exit port of the TBA apparatus. The
specimen was then taken through the temperature cycle, RT + 473,- 93 4 473 0K
at 20K/min (Figure 10). The "wet" conditioning atmosphere was changed to a
flowing dry atmosphere containing less than 5 PPM H20 at 3030 K during the
cooling mode. The presence of this small amount of water had no effect on
Tg, but a small y-peak centered around 1700 K had developed. The derivative
form of the logarithmic decrement, dA/dT, illustrates the presence of the
y-transition in another way (Figure 11).
DISCUSSION. Use of G" as the measure of loss in dynamic mechanical experi-
ments has been shown herein to give values for transitions which are identi-
cal with those obtained from the maxima of the derivative of G' with respect
to temperature. Use of G" rather than other loss parameters appears to be
particularly effective for investigating secondary transitions by reducing
the response of the Tg relaxation. The G" mode would also appear to be the
logical function to use in comparing dynamic mechanical and dielectric loss
(e") data. A further advantage in its use appears to lie in the flat base-
line of G" vs. temperature curves which could provide opportunities for com-
paring peak shapes and for resolving peaks quantitatively.
For example, the data of Figure 12, which compares G" vs. T plots for
the syndiotactic, atactic and isotactic polymers, shows that the relative
intensity of the B-peak decreases drastically with increasing isotactic con-
tent. The speculation could be made that completely isotactic polymer would
not display a B-peak. The similar shape of the G" vs. T curves for the
three polymers (Figure 12) indicates that the basic mechanism of the B-pro-
cess is the same for the three polymers and supports the validity of ex-
trapolating in this fashion. The absence of a s-peak is noted for polyiso-
butylene (11) which also has an anomalously low glass transition temperature.
The latter has been ascribed to a lack of spacial sites for geometrical in-
termolecular interlocking along the molecule (7) and this reason has also
been suggested to explain the low Tg of isotactic PMMA (3).
The data presented above are preliminary. Nevertheless the power of
the computerized experiment and the scope of the investigation which may be
undertaken have been demonstrated.
ACKNOWLEDGMENT. This work was supported in part by the National Aeronautics
and Space Administration (Grants NGR 31-001-200 and NGR 31-001-221), by the
Chemistry Branch of the Office of Naval Research (Contract N00014-67-A-0151-
0024, Task No. NR 356-504), and by the Air Force Materials Laboratory (Con-
tract F33615-72-C-1590). Gratitude is expressed also to Dr. E. Gipstein for
providing the characterized polymers.
REFERENCES1. Hazony, Y., Stadnicki, S. J., Gillham, J. K., "Low Frequency Thermo-
mechanical Spectrometry of Polymeric Materials: Computerized Torsional
Braid Experiments. I. Overview". ACS Polymer Preprints (this volume).
2. Stadnicki, S. J., Gillham, J. K., Hazony, Y., "Low Frequency Thermo-
mechanical Spectrometry of Polymeric Materials: Computerized Torsional
Braid Experiments. II. Data Processing". ACS Polymer Preprints (this
volume).3. Kiran, E., Gillham, J. K., Gipstein, E., "Thermomechanical Behavior of
Tactic Amorphous Methacrylate Polymers", J. Macromolecular Science-Physics,
(in press).4. McCrum, N. G., Read, B. E., and Williams, G., Anelastic and Dielectric
Effects in Polymeric Solids, John Wiley & Sons, New York, 1967.
5. Kawamura, Y., et. al., J. Poly. Sci., A2, (7), 1559 (1969).
6. Ishida, Y., J. Poly. Sci., A2, (7), 1835 (1969).7. Martin, J. R., Gillham, J. K., J. Appl. Poly. Sci.; 16, 2091 (1972).8. Kiran, E., Gillham, J. K., "Pyrolysis-Mass Chromatography of Polymers",ACS Polymer Preprints, 14, 1, 580 (1973).9. Vincent, P. I., Nature, 233(40), 104 (1971).
10. Vincent, P. I., Polymer, 13, 588 (1972).11. Hiltner, A., Baer, E., Martin, J. R., Gillham, J. K., "Low TemperatureRelaxations in Amorphous Polymers", J. Macromolecular Science-Physics, (inpress).
Table ICharacteristics of Stereoregular Polymethylmethacrylates
Molecular Weight (3) Syndiotactic Atactic Isotactic
Mw 83,200 105,000 2,780,000
Mn 62,700 48,000 1,200,000
Mw/Mn 1.33 2.15 2.29
Tactic Content (%) (3)
syndio- 70.1 50.6 0
hetero- 26.1 41.7 8.5
iso 3.8 7.7 91.5
Transition Data
Tg, OK 399 (0.68) 384 (0.67) 334 (0.81)
Tg, OK (Hz)# 294 (1.25) 297 (1.24) " 280 (1.4)
T /Tg 0.74 0.77 > 0.84
Ratio of Peak Heightsof the T6 to Tg 0.73 0.60 0.19
Transition #
Synthesis (3)
initiator fluorenyl lithium * phenylmagnesium
T C -70 bromide 0synthesis'
tDetermined from G" and dG'/dT loss data (decreasing temperature).
#Determined from G" loss data (decreasing temperature).
Source: Cellamer Associates (3).
Table IITransition Data of Stereoregular Polymethylmethacrylates*
PMMA dG'/dT G" A tan6 a
Tg Tg TB rg Ta Tg TB T • TB
Syndiotactic 399 399 294 403 298 403 298 400 298
Atactic 384 384 297 388 297 388 297 384 297
Isotactic 334 334 A280 336 1285 336 n285 336 1285
Loss maxima in 'K (decreasing temperature data).
1i8<

FIGURE CAPTIONS
Figure 1. Syndiotactic PMMA.
Figure 2. tactic PMMA. Logarithmic decrement and relative rigidityvs. T. Prehisotry: heat to 4730 K. Experi-
Figure 3. Isotactic PMMA. ment: 473 + 930 K. Rate: 20K/min.
Figure 4. Syndiotactic PMMA. G" (upper) and dG'/dT (lower) vs. T. Same
Figure 5. Atactic PMMA. Experiments as for Figures 1, 2 and 3,
Figure 6. Isotactic PMMA. respectively.
Figure 7. Syndiotactic PMMA. Effect of thermal prehistory.
Logarithmic decrement vs. T.
Prehistory: heat to 4230K (x) and 4730K (+), (same specimen).
Experiment: cool to 930K. Rate: 20 K/min.
Figure 8. Syndiotactic PMMA. Thermohysteresis.
G" and G' vs. T. Prehistory: heat to 4730K. Experiment:
473 + 93 - 473"K. Rate: 20K/min.
Figure 9. Syndiotactic PMMA. Thermohysteresis.
G' vs. T (linear scale). Same experiment as for Figure 8.
Figure 10. Atactic PMMA. Effect of H20 (300 PPM).
Logarithmic decrement and relative rigidity vs. T. Prehistory:
see text. Experiment: 473 + 93 + 4730K. Rate: 20K/min.
Figure 11. Atactic PMMA. Effect of H0O (300 PPM). Derivative of logarith-
mic decrement vs. T. Same experiment as for Figure 10 using
data for 93 + 4730 K.
Figure 12. Syndiotactic, Atactic and Isotactic PMMA. G" vs. T.
Prehistory: RT + 473. Experiment: 473 + 930 K.
Rate: 20K/min.
19<
DORY TO Lj73 DEG K ORY TO L473 DEG K
i
3 .
or a
m r
0. .. A
FIUR i IGE
r-*- ', 4
mzta: a:
zz
"I > :
.-o I -
'4 2-',:
Cc~
EXRERJMENTCIL BUN EXPFRIMENTPL BUN
0 q73--93 DEG K q Cf 73--93 DEG KSi i "- 0. 10 61. 02
-TEMPRT , EG. KIXI TEM' RTURE 5 . KX MCP
FIGURE 1 FIGURE 2
((p1 DRY TO 473 DEC K
DRY TO q73 DES K
P4N
crrcc:.
": i "i "" ::I- o
C)
- / n !
zI
..'-- -EXPERIMENTAL RUN
.r. E×PFR!MtEqTqL 9UNPRINTRL RU473 93 DEG K
q73"-93 DE! K .,r- . .. , .......
0.DC : .(1' 2q.Z'[ :.['.2 iO 5-P'.£', .£L '.[ ,1 :I.P 5. J L'P
T'F 'ERqTCRER ,(Et;. l(i ' , '' > I
CTCT P FIGURE3 SYNDIOTACTIC PMMA FIGURE 4,)OTqCTIC PMRq
o0<

DRY TO 4"73 DEG K DRY TO 473 DEC K
* /
F I K
'. . w
~(x
V >
G . IG'/dT (X) a: . dG'/dT (X)
crr
0 e''
4- K , ..
E.PRIN UN- ~ EXPERIMENTAL RUNEXPERIMENTL RUN
473-93 DEG K ,473-93 DEG K. ~ ~ ~ ~ ~ ~ ~ ~ 1 iu.LJ: j__o .c,0- M .t 40.'': C,.-' -z ,fl.'. 2cPR1R ,E6 {XD
TEMPERTURE,DEG. KUXIK l TEMPERAIJREDEG. KCX1 UI6)
TCIC eMM FIGURE 5 TCIC PMMR FIGURE 6
K -
EXPERIMENTAL RUNS -RY TOq73 DEG K
423-93°K (X)17393 1 (+)
K L i-
. , -:, , " / 4
3-
S4-
,,,
- , t
, • ~"
-./ EFFECT OF PRElEATING THE-ER- SRIIENTL RON
0 /, TO 423 AND 47 DEG K
.0 . 0.0 0 0 00 5u.0g 6U. c I 0 . O . 13 4U .OZ. rU. 5 l. 0
TEMFERqTUE,1FG. K(XIO ) 4EMiFFqTU RE,E. KXI
FIGURE 7 FIGURE 8
S TP N T I MM
Li K
/YDOTCI EFFEC OF PRE-)IEATINGM
O 43 AD 7
Lj3I3-I7 GGhI~ f
2-I" - i
FIUR 7 IURSYDDPT PMI5rNIDRT[PM
.7- H20 300 PPM
PS
Io
7.
""r
Vt
in Ktr, -
UU
7-
-- 4
ama
Ii EXPERIMENTRL RUNFHEPMO-HYSTEHESIS 373-93-173 DEG K
S.00 IO0.u0 is .o0 200.00 5u.00 -o1. o00 0 3P 00 0. 00 lOD 26.w 0 . Oo .00m . 00 S.00 .00TEMPERRTURF, E,. K TEMPERTURE,DEG. K (XIO I
SNDIRT1 I-v FIGURE 9RTRCTIC PMMR FIGURE 10SNDIOTCTIC r-vA ATACTIC PMMA
9 a
300 PM H20 ORY TO L73 DEG K
SYIlDIOTACTIc
4 •
.+ATACTIC C° --OJ :r
8 ISOTACTIC
ar - ,.-w L I
0 C,u -iM $u-
cc!
t a
EXPERIMqNTRL RUN EXPERIMENTRL RUNa 93-473 EG K 473-93 DEG K
0.0 10.00 20.00 00.00 O.O 50. . 0. 10.00 .0 . 0.00 50.00 60.00TEMPEflRTUREOEGK(XIo TEMPERRTURE,OEG. K(XIO] I
RTRCTIC PMMR A FIGURE i TRCTIC PMMBS FIGURE 12