nas8-11715, part i11 - nasa · nas8-11715, part i11 prepared by ... apollo support department...
TRANSCRIPT

SINGLE PARAMETER TESTING
NAS8-11715, PART I11
Prepared by
J.T. S t e r l i n g
E l e c t r o n i c S i m u l a t i o n U n i t
Gene ra l Electric Company
Apollo Suppor t Department
Daytona Beach, F l o r i d a
65 SIMAR 90/7 ' 1 '
- ,
https://ntrs.nasa.gov/search.jsp?R=19660000758 2018-09-07T13:48:10+00:00Z
TABLE O F CONTENTS
1.0 INTRODUCTION
2.0 SYSTEM D E S C R I P T I O N
3.0 S I N G L E PARAMETER T E S T I N G RESULTS
4 . 0 CONCLUS IONS
BIBLIOGRAPHY
L I S T O F FIGURES
1 Thrust V e c t o r C o n t r o l S y s t e m , N o n - L i n e a r Block D i a g r a m
2 Impulse R e s p o n s e of T h r u s t V e c t o r C o n t r o l System
3 L i n e a r Rnperical Block D i a g r a m
4 The T i m e Sampling T e s t Setup
5 R e s u l t s From t h e T i m e S a m p l i n g T e s t Setup
6 R e s u l t s From t h e T i m e S a m p l i n g T e s t S e t u p
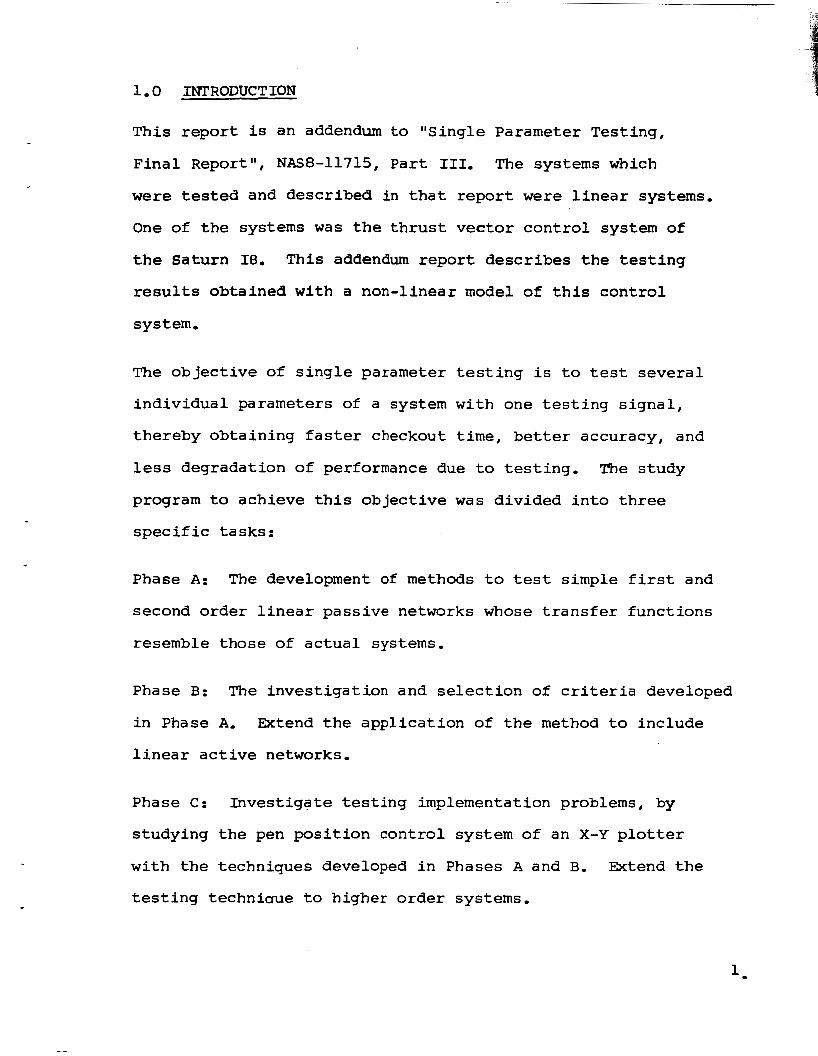
1.0 INTRODUCTION
T h i s r e p o r t i s an addendum to " S i n g l e Pa rame te r T e s t i n g ,
F i n a l Report", NAS8-11715, P a r t 111. The systems which
w e r e tested and described i n t h a t report w e r e l i n e a r systems.
One of t h e systems was the t h r u s t v e c t o r c o n t r o l system of
t h e S a t u r n 16. T h i s addendum report describes t h e t e s t i n g
r e s u l t s o b t a i n e d w i t h a n o n - l i n e a r model of t h i s control
system.
The o b j e c t i v e of s i n g l e pa rame te r t e s t i n g i s t o tes t s e v e r a l
i n d i v i d u a l p a r a m e t e r s of a system w i t h one t e s t i n g s i g n a l ,
thereby o b t a i n i n g f a s t e r checkout t i m e , better accuracy , and
less d e g r a d a t i o n of performance due t o t e s t i n g ,
program t o a c h i e v e t h i s objective was divided i n t o three
specific t a s k s :
The s t u d y
Phase A: The development of methods t o tes t s i m p l e f irst and
second order l i n e a r p a s s i v e ne tworks whose t r a n s f e r f u n c t i o n s
resemble those of a c t u a l sys t ems .
Phase B: The i n v e s t i g a t i o n and s e l e c t i o n of c r i t e r i a deve loped
i n Phase A. Extend t h e a p p l i c a t i o n of t h e method t o i n c l u d e
l i n e a r a c t i v e networks.
Phase C: I n v e s t i g a t e t e s t i n g implementa t ion problems, by
s t u d y i n g t h e pen p o s i t i o n c o n t r o l system of an X-Y p l o t t e r
w i t h t he t e c h n i q u e s deve loped i n Phases A and B.
t e s t i n g techniaue t o higher order systems.
Extend t h e

The results f r o m t h e s e t h r e e phases w e r e reported i n t h e cor-
r e s p o n d i n g phase reports and t h e f i n a l report (Refe rences 1
t h r o u g h 4) . The Phase C e x t e n s i o n t a s k which t h i s addendum
report describes c a n be s t a t e d : Apply t h e developed s i n g l e
p a r a m e t e r t e s t i n g t e c h n i q u e to a n o n - l i n e a r model of t h e t h r u s t
vector c o n t r o l system w h i c h was t h e s i x t h order system studied
i n Phase C.
To b r i e f ly o u t l i n e t h e steps n e c e s s a r y t o implement t h e s i n g l e
p a r a m e t e r t e s t i n g techniau .e :
1.
2,
3 .
4.
Develop a nominal system response . T h i s r e s p o n s e c a n be
de te rmined by the s t a t i s t i c a l measurement of a number of
good systems. Once t h e nominal r e s p o n s e is de te rmined it
c a n be stored on tape.
Develop a s y s t e m model which c a n be used i n t h e deter-
mina t ion of an e s t i m a t o r , G o o d methods a r e a v a i l a b l e
for t h i s system t r a n s f e r fu .nc t ion d e t e r m i n a t i o n .
The e s t i m a t o r i s de termined by a t h e o r e t i c a l method a s
described i n R e f e r e n c e 4 fo r f i r s t and second order t r a n s -
fe r f u n c t i o n s or by expe r imen ta l t e c h n i q u e s for h i g h e r
order systems,
The f o u r t h s tep i s the implementa t ion of t h e t e c h n i q u e
w i t h t h e a c t u a l hardware t o be tested keep ing i n mind
impedance and s i g n a l l e v e l matching c o n s i d e r a t i o n s .
2.

2 . 0 SYSTEM DESCR IPT I O N
- P
3 r i l i ' Q Ri - E3 - '- G4 KaGl - KVG2- A
The s ixth order t h r u s t vector c o n t r o l system which was chosen
for t e s t i n g is described i n Reference 5 , The system uses a
Moog's Model 16-120A dynamic pressure feedback servovalve
and Moog's Model 17-150 a c t u a t o r . A n o n - l i n e a r block d iagram
of t h e system and t h e nominal p a r a m e t e r v a l u e s a r e g i v e n i n
Figure 1. T h i s n o n - l i n e a r system was modeled on t h e a n a l o g
computer and impulsed and t h e r e s p o n s e o b t a i n e d i s shown i n
Figure 2. The r i p p l e w h i c h a p p e a r s on t h e o s c i l l o g r a p h re-
E R
HG5
c o r d i n g i s a r e s u . l t of t h e "d i the r " s i g n a l
= 7,700 + 15,000 (sin 5 0 0 t ) . FL
The l i n e a r e m p e r i c a l block diagram f o r t h e system i s shown
i n Figure 3.
F i g u r e 3
Emperical Block Diagram
3 .

* I --I
lu !A! 3 J
4 6
j r r . .
7
4.

- . . . . . . .
..
Figure 2
I m p u l s e Response of Thrust V e c t o r C o n t r o l S y s t e m

The magnet ic a m p l i f i e r t r a n s f e r f u n c t i o n is
SL
(270, 02 ) 2
The servovalve t r a n s f e r
2(0 .52)S +
270.02 +
func t ion i s
- + 1 314
The a c t u a t o r t r a n s f e r f u n c t i o n is
The reflected l o a d t r a n s f e r f u n c t i o n i s
SL + 2(0,08)S +
(64 , 6 8 ) 2 (64.68)
S2 + 2 ( - 2 5 ) s
(53, 38 )2 (53.38)
- G4 -
+ 1
And t h e l o a d t r a n s f e r f u n c t i o n i s
2 (0 .08 )S + + SL
(64. 68 )2 (64.68)
6.

The overa l l system t r a n s f e r f u n c t i o n i s
S S2 + k21:02 + '1 (302.519 + ') (49,522 49.52
''
- + 2( .528)S + I I S2 1 L 262,73L 262.73
T h i s i s t h e l i n e a r system t r a n s f e r f u n c t i o n which was tested i n
Phase C and reported i n Reference 4,
it r e p r e s e n t s is shown i n F i g u r e 1.
The n o n - l i n e a r model which
7.

3 , 0 SINGLE PARAMETER TESTING RESULTS
Two s i n g l e pa rame te r t e s t i n g t e c h n i q u e s w e r e developed d u r i n g
Phase A, B and C of t h e s tudy , The o n e used t o study t h e non-
l i n e a r t h r u s t vector c o n t r o l system model was t h e t i m e sampling
t e c h n i q u e . T h i s i s s i m i l a r to t h e t e c h n i q u e described i n R e f -
e r e n c e 5. The block d iagram of t h e required tes t setup i s
shown i n F i g u r e 4.
, , Nominal Sample T e s t
S i g n a l I and H o l d
The test s i g n a l for t h i s t i m e sampl ing t e c h n i q u e is formed by
r e c o r d i n g t h e i m p d l s e response of t h e nominal system ( s e e F i g u r e
2 ) on t a p e and t h e n r e v e r s i n g t h e t a p e end-for-end, Thus when
t h e reversed s i g n a l i s fed back i n t o t h e system t h e a c t u a l i m -
p u l s e r e sponse of t h e system is c r o s s - c o r r e l a f e d w i t h t h e de-
sired impulse r e sponse .
C i r c u i t s -
Parameter P r e d i c t i o n
f 4
Figure 4
The Time Sampling T e s t Setu.p
system / -
E s t i m a t o r L
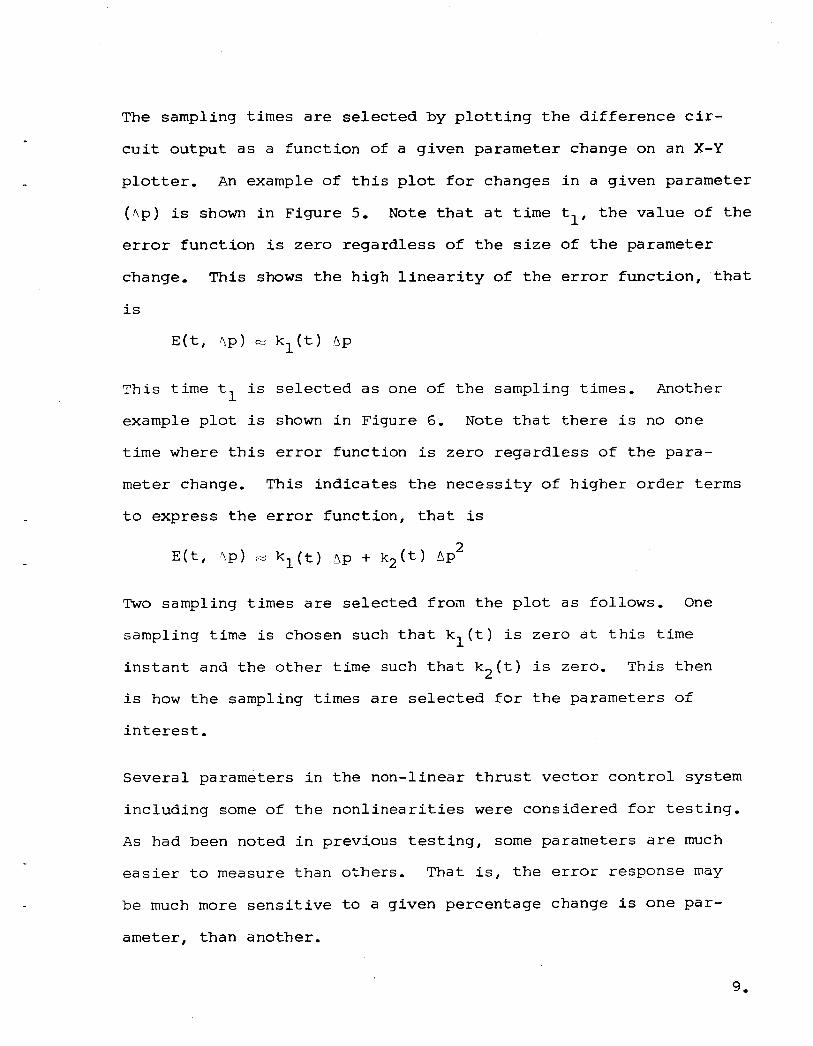
The sampl ing t i m e s a r e selected by p l o t t i n g t h e d i f f e r e n c e c i r -
c u i t output a s a f u n c t i o n of a g i v e n p a r a m e t e r change on a n X-Y
p lo t te r . An example of t h i s plot for changes i n a g i v e n p a r a m e t e r
( 4 p ) i s shown i n F i g u r e 5, N o t e t h a t a t t i m e tl, t h e v a l u e of t h e
error f u n c t i o n i s zero regardless of t h e s i z e of t h e pa rame te r
change. This s h o w s t h e h i g h l i n e a r i t y of t h e error f u n c t i o n , t h a t
i s
T h i s t i m e tl is selected a s one of t h e sampl ing t i m e s .
example p lo t is shown i n F i g u r e 6. N o t e t h a t t h e r e i s no o n e
Another
t i m e where t h i s error f u n c t i o n i s zero r e g a r d l e s s of t h e p a r a -
meter change. T h i s i n d i c a t e s t h e n e c e s s i t y of h i g h e r order t e r m s
t o express t h e error f u n c t i o n , t h a t i s
2 E ( t , IP) FZ k l ( t ) A p + k 2 ( t ) AP
Two sampl ing t i m e s a r e s e l e c t e d f ron t h e p lo t a s f o l l o w s . One
sampl ing t i m e i s chosen su.ch t h a t k l ( t ) i s z e r o a t t h i s t i m e
i n s t a n t and t h e o t h e r t i m e such t h a t k 2 ( t ) i s zero .
i s how t h e sampling t i m e s a re selected for t h e pa rame te r s of
T h i s t h e n
i n t e r e s t .
S e v e r a l pa rame te r s i n t h e non- l inea r t h r u s t vector c o n t r o l s y s t e m
i n c l u d i n g s o m e of t h e n o n l i n e a r i t i e s w e r e c o n s i d e r e d for t e s t i n g .
A s had been n o t e d i n previous t e s t i n g , s o m e pa rame te r s a r e much
e a s i e r t o measure t h a n others. T h a t is , t h e error r e s p o n s e may
be much more s e n s i t i v e t o a g i v e n p e r c e n t a g e change i s o n e p a r -
ame te r , t h a n a n o t h e r .
9.

il .
k W
10.

11.
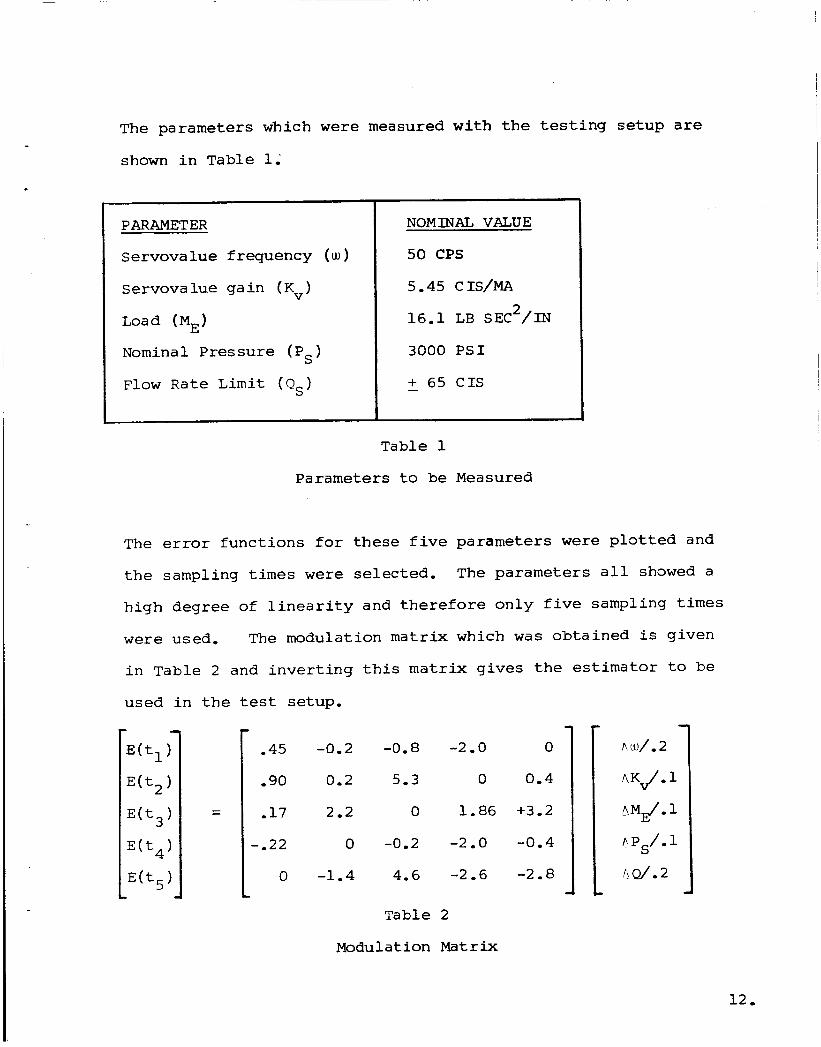
The p a r a m e t e r s w h i c h w e r e measured w i t h t h e t e s t i n g setup a r e
shown i n T a b l e 1.
PARAMETER
Servovalue f r e q u e n c y ( w )
Servova lue g a i n ( Kv)
Load (ME)
Nomina 1 P r e s sure ( Ps )
F l o w R a t e L i m i t ( Q s )
NOMINAL VALUE
50 CPS
5.45 CIS/MA
16.1 LB SEC2/IN
3000 PSI
+ 65 C I S -
T a b l e 1
P a r a m e t e r s t o be Measured
The error f u n c t i o n s f o r these f i v e p a r a m e t e r s w e r e plotted and
t h e s a m p l i n g t i m e s w e r e selected. The p a r a m e t e r s a l l showed a
h i g h degree of l i n e a r i t y a n d t h e r e f o r e o n l y f ive s a m p l i n g t i m e s
w e r e u s e d , The m o d u l a t i o n m a t r i x which was o b t a i n e d i s g i v e n
i n T a b l e 2 and i n v e r t i n g t h i s m a t r i x g i v e s t h e e s t i m a t o r t o be
used i n t h e test setup.
-45 -0.2 -0.8 -2 - 0 0
. 90 0.2 5.3 0 0.4
2.2 0 1.86 +3.2 -17
-022 0 -0.2 -2.0 -0.4
0 -1.4 4.6 -2.6 -2.8
T a b l e 2
Modula t ion Matrix
12 .
The results o b t a i n e d w i t h t h e test setup e s t a b l i s h e d t h a t s i n g l e
p a r a m e t e r t e s t i n g u s i n g t i m e sampl ing c a n be used on n o n - l i n e a r
systems and t h a t some n o n - l i n e a r i t i e s c a n be measured. C e r t a i n
n o n - l i n e a r i t i e s such a s the deadband and t h e 500 rad /sec s i n e
wave i n t h e l o a d p a r t of the n o n - l i n e a r block diagram a c t l i k e
a g a i n change i n t h e loop and t h e r e f o r e can n o t be d i s t i n g u i s h e d
f r o m a g a i n change, The l i m i t i n g a c t i o n on t h e f l o w r a t e (+65CIS)
and t h e c u r r e n t l i m i t a t i o n of 2 16 ma could be measured however.
When t h e l i n e a r m o d e l was tested a s reported i n Refe rence 4, it
was found t h a t the r a n g e over which a c c u r a t e measurements c o u l d
be made was for pa rame te r changes of 2 10%. T h i s r a n g e of 2 10%
remained t h e same for t h e non- l inea r model t e s t i n g . The a v e r a g e
a c c u r a c y of t h e pa rame te r p r e d i c t i o n w i t h t h e l i n e a r model was
t w o t o t h r e e p e r c e n t f o r pa rame te r errors w i t h i n t h e measurement
range. The p a r a m e t e r p r e d i c t i o n w i t h t h e n o n - l i n e a r model can
be made w i t h an a v e r a g e accu racy of t h r e e t o f i v e p e r c e n t , The
r e a s o n for t h e d e c r e a s e i n accu racy was n o t t h e n o n - l i n e a r i t i e s
i n t h e model b u t problems a s s o c i a t e d w i t h t h e i n c r e a s e d complexity
of t h e model. T h i s made it d i f f i c u l t t o o b t a i n a n a c c u r a t e match
between t h e a c t u a l and nominal system w i t h a l l p a r a m e t e r s a t t h e
nominal v a l u e , T h i s matching problem i n c r e a s e s a s t h e complexity
of t h e system i n c r e a s e s .
day t o day a l s o becomes a problem w i t h i n c r e a s i n g complexity,
Small d i f fe rences f r o m run to r u n c a n even be observed and t h e s e
problems led t o t h e measurement i n a c c u r a c i e s . These o b s e r v a t i o n s
a p p l y t o models b u i l t on t h e a n a l o g computer but t h e y w o a l d be
e q u a l l y a p p l i c a b l e t o a c t u a l hardware equipment ,
The a b i l i t y t o r e p e a t a g i v e n r u n f r o m
13.
i -
4 , 0 CONCLUS IONS
This Phase C e x t e n s i o n s t u d y h a s e s t a b l i s h e d t h a t s i n g l e par-
ame te r t e s t i n g u s i n g t i m e sampling can be performed on non-
l i n e a r systems. C e r t a i n n o n - l i n e a r i t i e s can be predicted by
t h i s t e c h n i q u e , The r a n g e o v e r which a c c u r a t e p a r a m e t e r p r e -
d i c t i o n s can be made was t h e same for t h e t e s t i n g of b o t h t h e
l i n e a r and n o n - l i n e a r model of t h e t h r u s t vector control system.
The a c c u r a c y of t h e parameter p r e d i c t i o n was less for t h e non-
l i n e a r system.
system model, however, and n o t t h e f a c t t h a t t h e system con-
t a i n e d n o n - l i n e a r i t i e s , The s y s t e m complexity led to problems
i n matching t h e nonimal system t o t h e a c t u a l system under zero
p a r a m e t e r error c o n d i t i o n s and problems i n d a t a r e p e a t a b i l i t y ,
The r e a s o n f o r t h i s was t h e complex i ty of t h e
14,

c
BIBLIOGRAPHY
1. E. Berger, J. Jackson , " S i n g l e Pa rame te r T e s t i n g " , Phase A Completion Report , November, 1964.
2. E. Berger, J. Jackson , R, Luoma, " S i n g l e Pa rame te r T e s t i n g " , Phase B Completion Report, J anua ry , 1965.
3. E. Berger, J. Jackson , I 'Single Pa rame te r T e s t i n g " , Phase C Q u a r t e r l y Repor t , A p r i l , 1965.
4. E, Bergtr, J. Jackson , J. S t e r l i n g , " S i n g l e Pa rame te r T e s t i n g " , F i n a l Report, August, 1965.
5. F.B. Moore, "SAT-IB Engine P o s i t i o n i n g C o n t r o l Systems Data" , MSFC R-ASTR-NFM-123-65, March, 1965.
6. J, Chorze l , J. Thompson, R. Myers, "System Parameter Measurement Using T r a n s i e n t Response Sampling: Symposium Proceed ings of t h e Automatic Suppor t Systems for Advanced M a i n t a i n a b i l i t y Symposium, 1965.
15.