naruc electric vehicles and performance-based regulation
TRANSCRIPT

NARUC Electric Vehicles and
Performance-Based Regulation
State Working GroupsDECEMBER MEETING
DECEMBER 15, 2020

Welcome
Moderator: Commissioner Bocanegra, Illinois
Panelists
• Megan Anderson, Regulatory Assistance Project
• Ed Burgess, Vehicle Grid Integration Council
• Raghusimha Sudhakara, Con Edison

AGENDA (Eastern Time)
3:00 PM Welcome and Introductions (5 minutes) • Agenda review
• Roll call, by state
3:05 PM Presentation and Q&A: Regulatory Assistance Project (15 minutes) Megan Anderson, from the Regulatory Assistance Project will provide an
overview of opportunities for PBR in transportation electrification, and
discuss RAP’s Metrics to Measure Effectiveness of Electric Vehicle Grid Integration
report.
3:20 PM Presentation and Q&A: Vehicle Grid Integration Council (15 minutes) • Ed Burgess, Policy Director of the Vehicle Grid Integration Council, will
discuss a case study from National Grid and lessons from California.
3:35 PM Presentation and Q&A: ConEdison (15 minutes) Raghudimha Sudhakara, Director of Demonstration Projects and Energy
Efficiency Strategic Channel Engagement at Con Edison will discuss the utility’s experiences and lessons with PIMs for EVs in New York.
3:50 PM Q&A (10 minutes) • Speakers will take additional questions from working group members
4:00 PM Closed Door Discussion (28 minutes) • Working group members will discuss their own views and the actions their
states have taken to date.
4:28 PM Next Steps and Announcements (2 minutes)
4:30 PM Adjourn

Roll Call – Read from Webinar
EV and PBR Working Group MembersStates:
Arizona
California
Colorado
Connecticut
Delaware
District of Columbia
Florida
Georgia
Hawaii
Illinois
Kentucky
Maryland
Massachusetts
Michigan
Minnesota
Missouri
Nevada
New Jersey
New York
North Carolina
Ohio
Oregon
Pennsylvania
Puerto Rico
Rhode Island
South Dakota
Texas
Utah
Vermont
Washington
Wisconsin
National/Federal Partners:
NARUC
NRRI
U.S. DOE
National Labs
U.S. EPA

Megan Anderson
Associate
Regulatory Assistance Project (RAP)®
Taos, New Mexico +1 802 498 0736
raponline.org
December 15, 2020
NARUC Webinar: PBR for Transportation Electrification
Using PBR for Electric Vehicle Grid Integration

1 EV Opportunities and Challenges

Regulatory Assistance Project (RAP)®
• Transportation sector is the largest share of
greenhouse gas emissions in the U.S. (28%)
• Light duty vehicles make up a large share (59%)
• Medium and heavy-duty trucks (23%)
• Total = 82%
• Electrifying vehicles could address ~ 23% of U.S.
GHG emissions if aligned with clean charging
opportunities
7
Electrifying vehicles = emissions reductions

Regulatory Assistance Project (RAP)®
• 1,000 miles/month @ 25 mph average = 40 hours
• Driven: 40 hours/month
• Charging: 40 hours/month
• Parked: 680 hours/month
8
EV Charging Opportunity
Challenge: How do we align those charging hours (and maybe even parked hours) with efficient or optimized grid operations?

Regulatory Assistance Project (RAP)®
• EVs offer a new flexible load that can be
integrated into the electric system in a way that
maximizes benefits for both EV users and grid
operators.
• But if not well aligned, EVs can exacerbate peak,
increasing costs and emissions
• So how do we ensure that EVs are integrated to
benefit the grid?
9
Aligning the EV opportunity

Performance-Based Regulation
10
Regulatory Assistance Project (RAP)®
• A means by which regulators can align utility
incentives with policy-mandated goals (improved
reliability, deployment of DERs, EE, and EVs)
• Stands in contrast to traditional cost-of-service
regulation, where incentive for utility is to increase rate
of return by increasing sales and investments
Performance-Based Regulation (PBR)
11
Regulatory Assistance Project (RAP)®
• Good things that are not profitable for the utility that don’t
get done (Non-wires Solutions, aggregated DERs)
• Bad things that are profitable to the utility that should be
prevented (Gold-plating physical assets)
• Bad incentives not easily seen (Deferring expenses like
tree trimming, customer care, underserved communities)
12
PBR May Help Overcome Bad Outcomes

Regulatory Assistance Project (RAP)®
• Guiding goals
• Understand Current Incentives
• Develop Measurable performance criteria
• Metrics
• Outcomes
Performance-Based Regulation Steps

Regulatory Assistance Project (RAP)®
Photo: Heidi Sandstrom
Set Guiding Goals
Examples:
• Make/keep energy affordable for customers
• Increase efficient EV charger deployment

Understand Current Incentives

Regulatory Assistance Project (RAP)® 16
Examples:
• Declining customer bills
Develop Measurable Criteria

Regulatory Assistance Project (RAP)®
Photo: Shirley Niv Marton
Establish Metrics
Example:
• 2% reduction in average monthly residential bills
• 5% improvement in SAIFI from baseline value

Applying PBR to EV Integration 3

Regulatory Assistance Project (RAP)®
• What are the carbon and pollution reduction goals
of the jurisdiction?
• What is the goal of supporting EV build-out? (to
serve customers, EV opportunities in underserved
communities, grid stability?)
• What education and outreach activities are most
helpful for agencies, utilities, car dealerships, car
manufacturers and other entities?
Questions regulators can ask when thinking about PBR and EVs

Regulatory Assistance Project (RAP)®
1. Circuits and feeders with excess seasonal or year-round
daytime capacity to accommodate charging load at peak.
2. The elasticity of demand for on-peak charging versus off-
peak charging by charger installation use (residential,
commercial/retail, commercial/fleet, municipal/fleet).
3. Average and median utility/ratepayer cost for installation
of charging infrastructure by charger installation use as
well as by charger and charging station.
4. Utilization of chargers by charger, charging station and
charger installation use.
20
Useful Data

Regulatory Assistance Project (RAP)®
1. Build understanding of EV charging costs,
benefits and consumer savings
2. Encourage the development of EV infrastructure
while controlling costs
3. Use existing grid resources to integrate EV load
to maximize net benefits to all ratepayers
21
EV PBR Goals - Examples

Regulatory Assistance Project (RAP)® 22
Goal 1: Build understanding of EV charging costs, benefits and consumer savings

Regulatory Assistance Project (RAP)® 23
Goal 2: Encourage the development of EV infrastructure while controlling costs

Regulatory Assistance Project (RAP)® 24
Goal 3: Use existing grid resources to integrate EV load to max. net benefits to all ratepayers

Regulatory Assistance Project (RAP)®
Metrics to Measure the Effectiveness of Electric Vehicle Grid Integration
Next-Generation Performance-Based Regulation: Volume 1 (Introduction—
Global Lessons for Success)
Next-Generation Performance-Based Regulation: Volume 2 (Primer—Essential
Elements of Design and Implementation)
Next-Generation Performance-Based Regulation: Volume 3 (Innovative
Examples from Around the World)
Performance Incentives for Cost-Effective Distribution System Investments
Protecting Customers from Utility Information System and Technology Failures
25
RAP Resources

Megan Anderson
Associate
Regulatory Assistance Project (RAP)®
+1 802 498 0736
raponline.org
Taos, New Mexico
About RAPThe Regulatory Assistance Project (RAP)® is an independent, non-
partisan, non-governmental organization dedicated to accelerating the
transition to a clean, reliable, and efficient energy future.
Learn more about our work at raponline.org
Regulatory Assistance Project (RAP)®
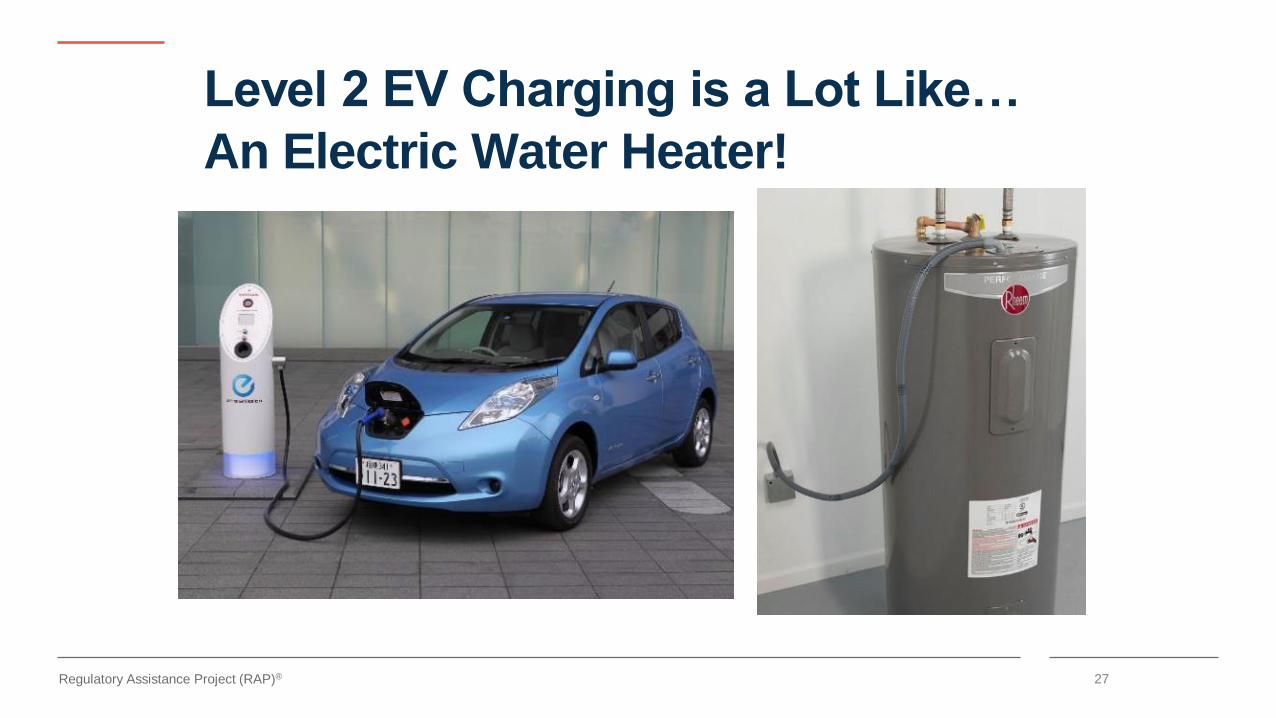
Level 2 EV Charging is a Lot Like…
27
An Electric Water Heater!

Regulatory Assistance Project (RAP)®
Water Heater
• 4.4 – 5.5 kW
• 2,000 – 4,000
kWh/year
• Can avoid morning and
early evening peak
charging
• Tank usually covers a
full day’s supply
28
Electric Vehicle
• 3.3 – 6.6 kW
• 2,000 – 4,000
kWh/year
• Can avoid morning
and early evening
peak charging
• Batteries likely equal
a full day’s supply
Really!
Regulatory Assistance Project (RAP)®
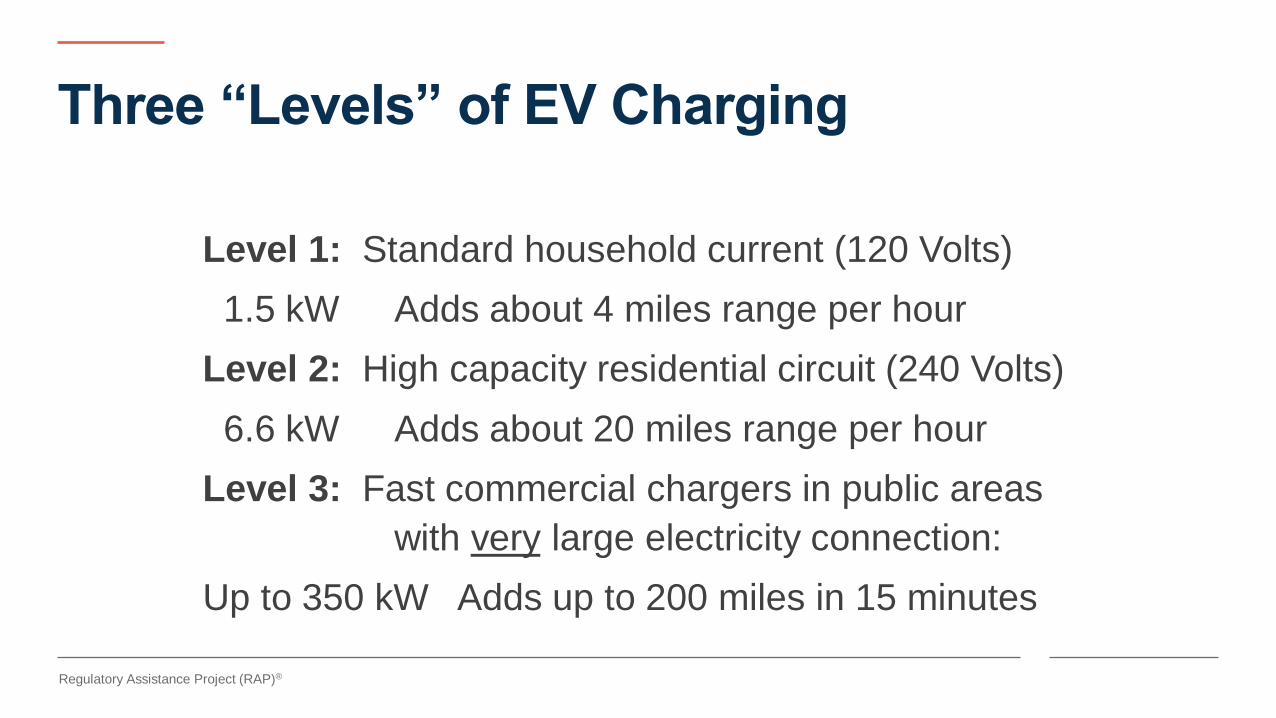
Three “Levels” of EV Charging
Level 1: Standard household current (120 Volts)
1.5 kW Adds about 4 miles range per hour
Level 2: High capacity residential circuit (240 Volts)
6.6 kW Adds about 20 miles range per hour
Level 3: Fast commercial chargers in public areas
with very large electricity connection:
Up to 350 kW Adds up to 200 miles in 15 minutes


▪
▪

▪
▪
▪
▪
▪
▪
▪

▪
▪
▪
▪
▪
▪
▪
▪
▪

▪
▪
▪
▪
▪
▪
▪
▪
▪
▪
▪
▪

▪
▪
▪
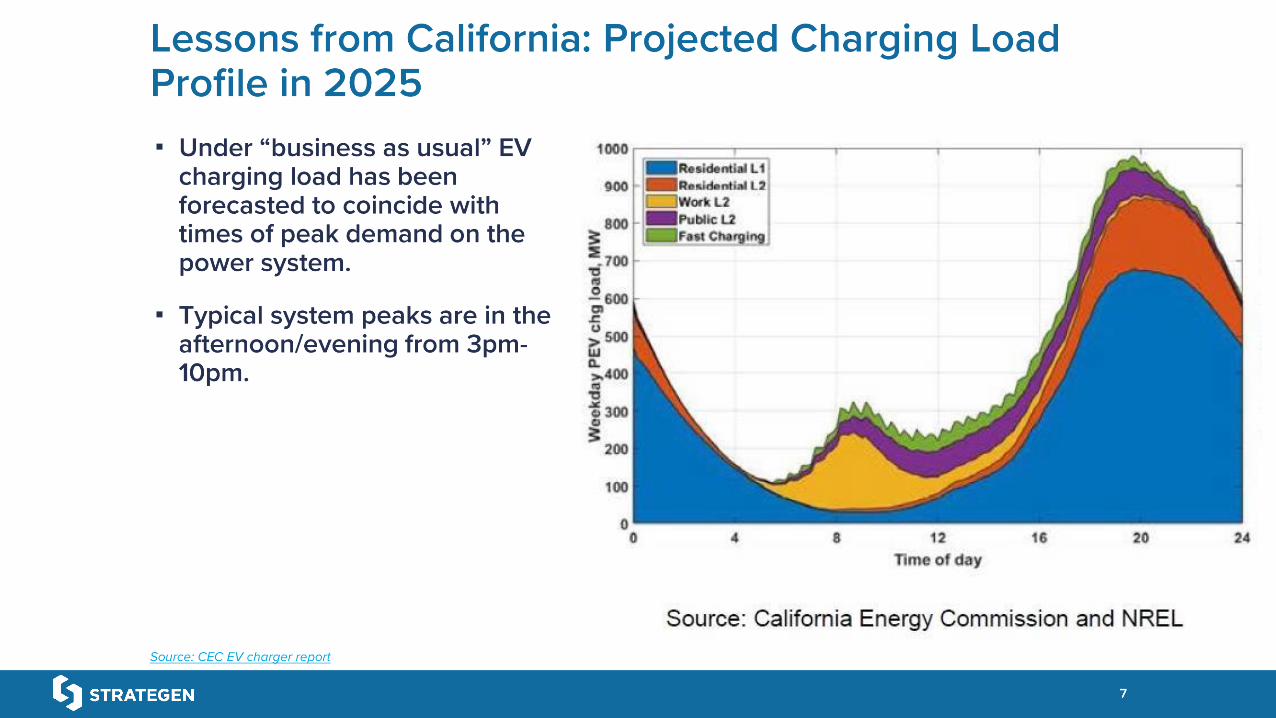
▪ California’s GVI Working Group Final Report: Institute
performance-based ratemaking… to encourage more
efficient EV-related distribution build-out.” 6/30/30
https://gridworks.org/initiatives/vehicle-grid-integrationwg/


•
•
•
•
•
•
•
•
•
•
•

41
December 2020
Raghu Sudhakara
Performance-Based Regulation for Clean Transportation

42
Performance-Based Regulation (PBR)
Energy
Efficiency
Distributed
Energy
Non-
Traditional
Alternatives
GHG
Emissions
Reduction
Renewable
Energy
Energy
Storage
Peak
Reduction
Electric
Vehicles
Equity and
Inclusion• PBR can encourage:
• Policy achievements
• Market enablement
• Innovation and efficiency
• Enterprise-wide focus at utility
• Customer benefits
• Performance incentives drive higher
achievement, for example in energy
efficiency*
* - See American Council for an Energy-Efficient Economy – Snapshot of Energy Efficiency Performance Incentives for Electric Utilities (December 2018)

Evolution of PBR
43
Societal Value for Customers
Meaningful Opportunity for Utilities
Policy achievement smartly
EAMs at a level sufficient to motivate and drive utilities to achieve by changing behavior
EAMs’ targets at a level that requires significant effort but within the realm of achievability
EAMs are designed to boost societal benefits for customers above business-as-usual
EAMs not over-broad so that utility unable to influence result or not so narrow as to hamper innovation
EAMs that incent annually but accommodate multi-year goals recognizing practical execution realities
EAMs that change incrementally so institutional ability is built for achievement
PBR as applied through EAMs* have evolved to provide societal value and drive achievement
* - Earnings Adjustment Mechanisms, the New York approach to PBR that awards basis points on utility rate base for demonstrated policy focus area achievements

Sustained enterprise-wide focus
Innovation fast-tracking
Process re-design
Organizational design
Talent commitment
44
Con Edison Experience: EAM Fostered Utility Achievement
• Unprecedented growth in energy
efficiency and related peak savings
• After EAMs* were adopted:
• Energy efficiency achievement
tripled while costs for each MWh
of savings dropped ~25%
• Peak savings quadrupled while
costs for each MW of savings
dropped ~35%
• >$400 million of new net benefits
were created for customers

PBR To Drive Achievement in Clean Transport
45
POLICY ALIGNMENT
Drive desirable policy outcomes
Avoid conflict with other policy goals
E.g. EV Rates with Peak Reduction EAM
EXECUTION ALIGNMENT
EAM design informed by executability
EAM design driving practical efficiency
E.g. EV EAM recognizing trajectory
ATTRIBUTES
PROGRAM BASED
EAM: “Share the Savings”
Metric: 30% of savings below budget
Incentive: Up to 15 BPS
OUTCOME BASED
CURRENT EAMs
EV regulation framework should be aligned with policy objectives and execution
Appropriate Design:
• Well-defined objective
• Measurable, avoiding counterfactuals
• “Stretch” but attainable
• Stable over time
• Time based but adaptable
EAM: Beneficial Electrification
Metric: GHG Redn. by EVs, Heat Pumps
Incentive: Up to 10 BPS

Peer Discussion – Commissioners and
Commission Staff Only
Questions?
Raise your hand to ask a question or type a question
into the question box

Peer Discussion – Commissioners and
Commission Staff Only
Facilitator
EV Working Group Chair Maria Bocanegra and Illinois Commerce Commission Staff

Discussion Questions
1. How has/could the unique demographics of your jurisdictions (customer size, access to markets, etc.) potentially influence EVs
and PBR for EVs?

Discussion Questions
1. How has/could the unique demographics of your jurisdictions (customer size, access to markets, etc.) potentially influence EVs
and PBR for EVs?
2. Which stakeholders (“usual suspects” and non-traditional) have engaged in PBR? EVs?
Have PUCs convened stakeholders (for example, conducted a workshop) on PBR and/or EVs?
What have stakeholders said?
3. What are the core expectations (minimum requirements) of utilities in EV adoption? How can you incentivize the utility to act
beyond minimum requirements and penalize when it has not met minimum requirements?
How does the commission ensure it is not rewarding the utility for standard operations (what it is already obligated to do
and meeting)?
4. How might PBR for EVs impact the financial health of the utility (such as credit ratings, earned returned on equity, etc.)? What
are the impacts of PBR for EVs on the financial health of the customer and equality and equity?
What modeling should a regulator look for in both cases?
5. What resources do your commissions use to analyze and build capacity on PBR and EVs? What experts evaluate performance
metrics?

Announcements
Registration Open for the Winter Policy Summit: February 4,5 and 8-11, 2021
Presentations and recordings of past EVSWG events
EVSWG Listserv: [email protected]
PBRSWG Listserv: [email protected]