naosite: nagasaki university's academic output site · 1 maturation-associated changes in...
TRANSCRIPT

This document is downloaded at: 2017-12-21T12:35:21Z
Title Maturation-associated changes in toxicity of the pufferfish Takifugupoecilonotus.
Author(s) Ikeda, Koichi; Emoto, Yu; Tatsuno, Ryuhei; Wang, Jun Jie; Ngy,Laymithuna; Taniyama, Shigeto; Takatani, Tomohiro; Arakawa, Osamu
Citation Toxicon, 55(2-3), pp.289-297; 2010
Issue Date 2010-02
URL http://hdl.handle.net/10069/22220
Right Copyright (c) 2009 Elsevier Inc. All rights reserved.
NAOSITE: Nagasaki University's Academic Output SITE
http://naosite.lb.nagasaki-u.ac.jp

1
Maturation-associated changes in toxicity of the pufferfish Takifugu poecilonotus
Koichi Ikedaa, Yu Emotoa, Ryohei Tatsunoa, Jun Jie Wanga, Laymithuna Ngyc, Shigeto,
Taniyamaa, Tomohiro Takatanib, Osamu Arakawab,*
aGraduate School of Science and Technology, Nagasaki University, Nagasaki 852-8521,
Japan bFaculty of Fisheries, Nagasaki University, Nagasaki 852-8521, Japan cDepartment of Environmental Impact Assessment, Ministry of Environment, Phnom Penh,
Cambodia
*Corresponding author. Tel./fax: +81 95 819 2844.
E-mail address: [email protected] (O. Arakawa)

2
Abstract
From October 2006 to December 2007, wild specimens of the pufferfish Takifugu
poecilonotus (93 females, 45 males) were collected from the Ariake Sea. Tissue toxicity was
examined by mouse bioassay, and tetrodotoxin (TTX) content in the blood plasma by
enzyme-linked immunosorbent assay. The relationship between toxicity and maturation was
investigated based on changes in the gonadosomatic index: December-March in females and
November-March in males, the ‘maturation period’; April, ‘just after spawning’; and the other
months, the ‘ordinary period’. Toxicity of both sexes was high throughout the year, but
sharply declined in April. In all tissues examined (skin, liver, and ovary) other than testis,
toxicity exceeded 1000 MU/g or 10,000 MU/individual in many individuals. Seasonal profiles
of tissue toxicity differed markedly between sexes. In females, liver toxicity was high during
the ordinary period, and ovary toxicity was high during the maturation period. In males, little
maturation-associated change in the toxin distribution was observed. Plasma TTX levels were
similar between the sexes (1.59-15.1 MU/ml), and fluctuated largely throughout the year
without corresponding changes in tissue toxicity. The percentage of TTX binding to high
molecular-weight substances in the plasma varied in association with maturation; the binding
ratio fluctuated at relatively low levels during the ordinary period, and stabilized at a high
level during the maturation period.
Keywords: Pufferfish; Takifugu poecilonotus; tetrodotoxin; enzyme-linked immunosorbent
assay (ELISA); gonadosomatic index (GSI); maturation

3
1. Introduction
Many marine pufferfish of the family Tetraodontidae possess a potent neurotoxin,
tetrodotoxin (TTX). In toxic species inhabiting Japanese coastal waters, the liver and ovary
usually have strong toxicity, whereas the muscle and testis are weakly toxic or non-toxic
(Noguchi and Arakawa, 2008), indicating sexual differences in pufferfish toxicity, and that
maturation may affect toxin kinetics in the pufferfish body. TTX is originally produced by
marine bacteria and distributes over a wide variety of animals, including pufferfish, gobies,
blue-ringed octopuses, carnivorous gastropods, starfish, toxic crabs, horseshoe crabs, flat
worms, and ribbon worms (Miyazawa and Noguchi, 2001). TTX is exogenous in pufferfish
and is derived from the food chain that consists of these TTX-bearers (Noguchi and Arakawa,
2008). The transfer, accumulation, and elimination mechanisms of TTX taken up into the
pufferfish body via food organisms remain unclear. Various types of toxin administration
experiments performed with pufferfish have revealed important information on uptake and
inter-tissue transfer of TTX in the pufferfish body (Matsui et al., 1981, Watabe et al., 1987,
Yamamori et al., 2004, Honda et al., 2005, Kono et al., 2008, Ikeda et al., 2009). In these
experiments, however, non-matured, non-toxic cultured fish were used, and the influence of
aging or maturation was not considered. Although TTX-binding proteins have been found in
the blood plasma of toxic pufferfish (Matsui et al., 2000; Yotsu-Yamashita et al., 2001), and
may be involved in the transportation mechanism, little information is available on their
distribution, seasonal variation, or functions other than TTX binding. In our studies to clarify
the roles of TTX-binding high molecular-weight substances in the accumulation mechanisms
of TTX in pufferfish and the effect of maturation, we collected the pufferfish Takifugu
poecilonotus periodically from the Ariake Sea and investigated maturation-associated changes
in tissue toxicity, as well as the amount and forms of TTX in the blood plasma.
2. Materials and methods
2.1. Pufferfish specimens
From October 2006 to December 2007, wild specimens of the pufferfish T.
poecilonotus (93 females and 45 males) (Table 1) were collected from the Ariake Sea (off
Minamishimabara, Nagasaki Prefecture, Japan), and transported live to the laboratory of
Nagasaki University. After blood was withdrawn from the portal vein using a syringe

4
precoated with sodium heparin, each fish was dissected to obtain the skin, liver, and gonads
(ovary/testis), which were then extracted with 0.1% acetic acid according to the official
guidelines of the Japan Food Hygiene Association (2005), and analyzed with a toxicity assay
using mice.
2.2. Assessment of gonadosomatic index (GSI)
GSI (%) of each fish was calculated from its gonad weight (GW) and body weight
(BW) using the following equation: GSI = 100 x GW/BW.
2.3. Toxicity assay
Toxicity of each tissue extract from T. poecilonotus was determined by a mouse
bioassay according to the official guidelines of the Japan Food Hygiene Association (2005).
Lethal potency was expressed in mouse units (MU), where 1 MU was defined as the amount
of toxin required to kill a 20-g male ddY strain mouse within 30 min after intraperitoneal
administration.
2.4. Quantification of TTX in blood plasma
The blood collected from each fish was centrifuged at 6000 g for 7 min (4˚C), and the
blood plasma obtained (200 µl) was ultrafiltered through a Microcon YM-50 membrane
(cut-off 50,000 Da, Amicon). Phosphate buffered saline (10mM, 200µl) was added to the
residue, and the mixture was ultrafiltered again through the same membrane. The operation
was repeated one more time. The combined supernatant (low molecular-weight fraction) and
the residue (high molecular-weight fraction) contain free TTX molecules (designated f-TTX)
and the TTX molecules binding to high molecular-weight substances (designated b-TTX),
respectively (Matsui et al., 2000). The low molecular-weight fraction was directly submitted
to an enzyme-linked immunosorbent assay (ELISA) to determine the amount of f-TTX. To
cut the binding between TTX and high molecular-weight substances, 0.1% acetic acid (400
µl) was added to the high molecular-weight fraction (Yamamori, 2002), and then the mixture
was submitted to ELISA to quantify the amount of b-TTX. Preliminary experiments
demonstrated that 0.1% acetic acid or TTX-binding substances in the high molecular-weight
fraction did not affect the ELISA results (data not shown).

5
ELISA was performed according to the previously reported method (Ngy et al., 2008)
using a monoclonal anti-TTX antibody developed by Kawatsu et al. (1997). The amount of
TTX (ng) determined by ELISA was converted to MU based on the specific toxicity of TTX
(220 ng/MU). The sum of f-TTX and b-TTX was considered as the total TTX amount in
plasma (designated p-TTX), and the percentage of b-TTX in p-TTX (designated the binding
ratio) was calculated using the following equation:
Binding ratio = 100 x b-TTX/(f-TTX + b-TTX) = 100 x b-TTX/p-TTX
2.5. Statistical analysis
One-way analysis of variance (ANOVA) was applied to the toxicity data (both in MU/g
and MU/individual) of each tissue, the amount of TTX in the plasma (f-TTX, b-TTX, and
p-TTX), and the binding ratio. Tukey-Kramer post hoc test was used to determine significant
differences between females and males, and/or the ordinary period and maturation period
when ANOVA detected significant differences (p<0.05). Student’s t-test was also applied to
the data as appropriate.
3. Results
3.1. Seasonal changes in the gonadosomatic index (GSI)
Seasonal changes in GSI are shown in Fig. 1. In female specimens, GSI began to
increase in December, peaked (average ± SD: 15.5 ± 3.4%) in March, and then decreased
abruptly in April, except for one brooding fish. In male specimens, GSI began to increase 1
month earlier than females in November, reached a maximum (12. 7 ± 1.2%) in January, and
gradually decreased thereafter till April. Based on the results, we considered
December-March in females and November-March in males as the ‘maturation period’, April
as ‘just after spawning’, and the other months as the ‘ordinary period’, and used this seasonal
classification to investigate the relationship between toxicity and maturation, as described
below.
3.2. Seasonal changes in toxicity per gram of each tissue
3.2.1. Females

6
Seasonal changes in the toxicity (MU/g) of each tissue in the female specimens are
shown in Fig. 2. All tissues on the whole showed very high toxicity; the mean toxicity score
exceeded 1000 MU/g in 4 of 12 months in the skin, 5 of 12 months in the liver, and 500 MU/g
in 6 of 12 months in the ovary. Especially in the liver, the score exceeded 3000 MU/g in June
and August.
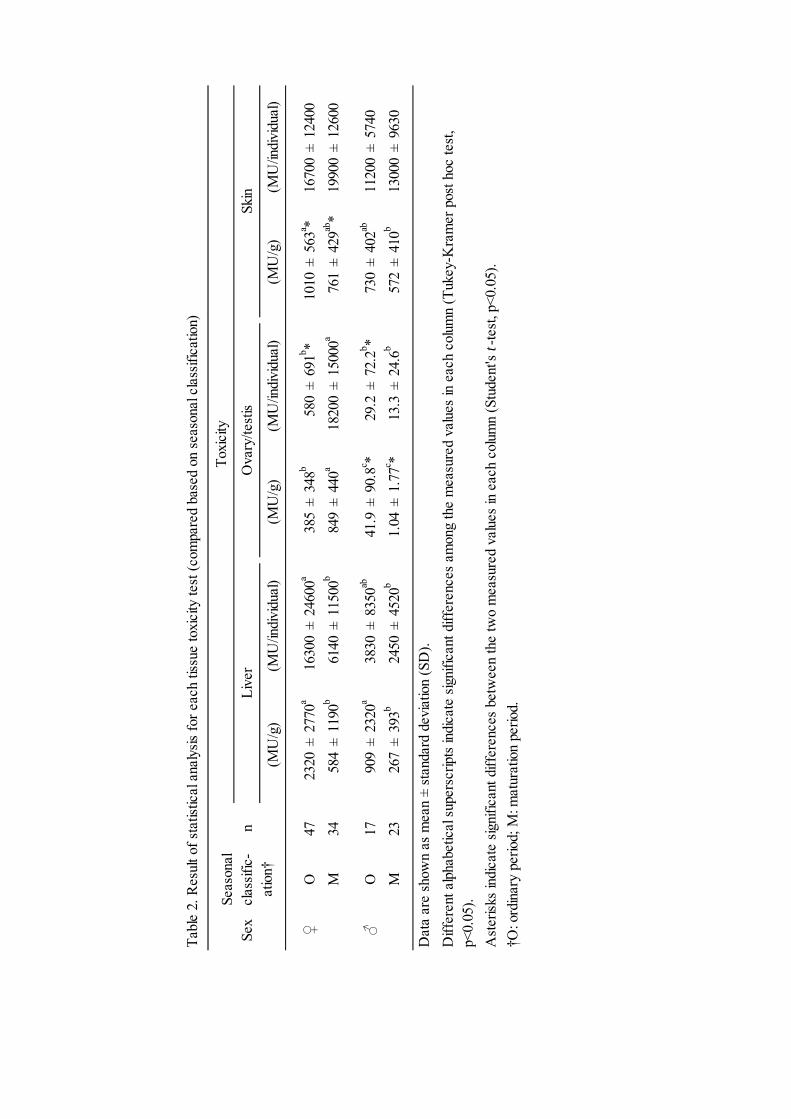
Toxicity of each tissue exhibited a change associated with maturation, i.e., it was
significantly higher (Tukey-Kramer post hoc test, p<0.05) in the liver during the ordinary
period than during the maturation period, and vice versa in the ovary (Fig. 2 and Table 2).
Skin toxicity in general was maintained at high levels throughout the year, but also fell
significantly (Student’s t-test, p<0.05) during the maturation period, though the fluctuation
range was much smaller than that of liver toxicity (Fig. 2 and Table 2). In all three tissues,
toxicity declined markedly just after spawning in April (Fig. 2).
3.2.2. Males
Seasonal changes in the toxicity (MU/g) of each tissue in the male specimens are
shown in Fig. 3. As a whole, the skin showed high toxicity throughout the year; the mean
toxicity score, although significantly lower (Student’s t-test, p<0.05) than that in the females
(Table 3), exceeded 500 MU/g in 8 of 12 months. The liver toxicity score, which was also
significantly lower (Student’s t-test, p<0.05) than that in the females (Table 3), was
exceptionally high (~5000 MU/g) in June, but less than 300 MU/g in 8 of 12 months. The
testis toxicity was usually very low; the mean score was less than 10 MU/g except for June,
August, and September.
Like females, males also showed a decline in toxicity in April (Fig. 3). Although
decreases in the liver and skin toxicity during the maturation period was also observed in the
male specimens, the degree looked smaller than that in the females. Testis toxicity was
significantly higher (Student’s t-test, p<0.05) during the ordinary period than during the
maturation period (Fig. 3 and Table 2).
3.3. Seasonal changes in toxicity per each individual tissue and plasma TTX content
3.3.1. Female
7
Seasonal changes in toxicity (MU/individual) in each tissue, and in the plasma TTX
content in female specimens are shown in Fig. 4. The skin toxicity level was similar to the
sum of ovary and liver toxicity levels, both of which (skin toxicity and sum of ovary and liver
toxicity) fluctuated up and down with approximately 30,000 to 40,000 MU/individual as the
upper limit.
The maturation-associated change in liver and ovary toxicity described in section 3.2.1
became more distinct when observed as toxicity per individual, i.e., liver toxicity was high
and ovary toxicity very limited during the ordinary period, whereas during the maturation
period, liver toxicity largely decreased, and ovary toxicity increased remarkably as the GSI
increased [all these changes are statistically significant (Tukey-Kramer post hoc test, p<0.05)
(Table 2)]. This rise, however, depended on the increase in the ovary mass, and the toxin
concentration did not largely change during the maturation period, or gradually increased
during the ordinary period (Fig. 2). When observed as toxicity per individual, all three tissues
also showed a marked decline in toxicity just after spawning in April (Fig. 4).
The plasma TTX content (p-TTX = b-TTX + f-TTX) ranged between 1.75 to 15.1
MU/ml, the levels being much lower than that in the other three tissues. Although p-TTX was
significantly higher (Student’s t-test, p<0.05) in the ordinary period than in the maturation
period, it generally showed large fluctuations throughout the year, which did not clearly
correspond to changes in tissue toxicity; even the decline just after spawning in April was not
observed in the plasma TTX (Fig. 4 and Table 4). b-TTX remained at a certain level
irrespective of maturation, but the binding ratio, which fluctuated within relatively low levels
during the ordinary period, was stabilized at a high level as f-TTX decreased during the
maturation period (Figs. 4). The changes of both binding ratio and f-TTX were statistically
significant (Tukey-Kramer post hoc test, p<0.05) (Table 4).
3.3.2. Male
Seasonal changes in toxicity (MU/individual) of each tissue and in plasma TTX in
males are shown in Fig. 5. Skin toxicity largely exceeded that of the other tissues, except for
June, in which the liver toxicity was extremely high. As a whole, the tissue toxicities of males
were significantly lower (Student’s t-test, p<0.05) than those of females; the level of liver,
gonad, and skin toxicity was about 1/4, 1/400, and 1/1.5 that of the female specimens,
respectively (Table 3).
The toxicity of each tissue again declined in April (Fig. 5). No other

8
maturation-associated change, however, was observed, and there were some months in which
liver toxicity increased during the maturation period (Fig. 5 and Table 2).
Plasma TTX (1.59-13.5 MU/ml) levels were almost the same between males and
females, and fluctuated independently of the degree of maturation (Fig. 5 and Table 4). The
binding ratio, however, showed a very similar fluctuation pattern to that in females; low
during the ordinary period and high during the maturation period (Fig. 5 and Table 4).
4. Discussion
Seasonal changes in the GSI (Fig. 1) suggest that maturation of female T. poecilonotus
inhabiting the Ariake Sea occurs during December-March and that of males occurs during
November-March, and spawning occurs during March-April. The pufferfish T. rubripes that
live in the Ariake Sea as their spawning ground also spawn from the second half of March to
May at the entrance of the sea (Takita and Intong, 1991).
The toxicity of the Ariake specimens, both females and males of T. poecilonotus, was
very high throughout the year, except that it sharply declined just after spawning in April
(Figs. 2-5). In all tissues other than testis, toxicity in many individuals exceeded 1000 MU/g
or 10,000 MU/individual. Compared with males, toxicity was generally higher in females,
partly because testes, unlike ovaries, cannot actively accumulate TTX, and testis toxicity is
much lower than that of ovary (Figs. 2-5, Table 2 and 3). Skin, liver, and ovary are strongly
toxic (generally greater than 1000 MU/g), whereas muscle and testes are also weakly toxic in
the T. poecilonotus specimens collected from the Pacific coast of the Tohoku Region, the
Japan Sea, the Seto Inland Sea, and coastal waters of the Oita Prefecture (Kodama et al., 1984,
Endo, 1984, Fuchi et al., 1999).
The seasonal profile of tissue toxicity was markedly different between females and
males. In females, liver toxicity was high during the ordinary period, and that of ovary was
high during the maturation period (Fig. 2 and Table 2). This finding suggests that ‘turnover of
toxins’ occurs between the liver and ovary (Fig. 4 and Table 2). Skin toxicity also decreased
slightly during maturation period (Fig. 2 and Table 2). Therefore, it is presumed that the TTX
absorbed from toxic food organisms into the pufferfish body is transferred mainly to the liver
and skin during the ordinary period, but is actively transported and accumulated into the
ovary during the maturation period. Matsumoto/Nagashima et al. demonstrated that the liver
tissue of T. rubripes is equipped with a specific TTX-uptake mechanism (Nagashima et al.,
2003, Matsumoto et al., 2005, 2007), and using a pharmacokinetic model showed that TTX

9
introduced into the pufferfish body is rapidly taken up into the liver via the blood (Matsumoto
et al., 2008a, 2008b). We also found that TTX administered intramuscularly to non-toxic
cultured specimens of T. rubripes was transferred first into the liver and then the skin via the
blood (Ikeda et al., 2009). A similar result was obtained in oral administration experiments
(Kono et al., 2008), suggesting that, under natural conditions as well, pufferfish take up most
of the ingested TTX into the liver first. During the ordinary period, some of the TTX taken up
into the liver is gradually transferred to the skin, where it accumulates in the basal cells and/or
TTX-bearing secretory glands or cells (succiform cells) of the epithelia (Kodama et al., 1986,
Tanu et al., 2002, Mahmud et al., 2003a, 2003b), and is excreted by external stimuli under
certain circumstances (Kodama et al., 1985, Saito et al., 1985). During the maturation period,
the toxin transfer to the skin decreases somewhat, and most of the TTX taken up into the liver
would be transported to the ovary, presumably with the precursors of yolk proteins that are
synthesized in the liver (Wallace, 1985, Specker and Sullivan, 1994). The majority of the
toxin kinetics after uptake into the liver, however, remains still unclear, and further detailed
investigations, such as an approach using the model of Matsumoto et al. (2008a, 2008b) are
needed to clarify this point.
Jang and Yotsu-Yamashita (2006) examined the distribution of TTX and its analogs
among the tissues of Takifugu (Fugu) pardalis, and claimed that the ratio of 4,9-anhydroTTX
and 4-Cysteinyl TTX to TTX in the liver was significantly higher than that of other tissues
during the maturation period. Therefore, conversion of TTX into such almost non-toxic
analogs might be another possible cause of decline in liver toxicity during the maturation
period. To elucidate this point, investigations on the maturation-associated change in toxin
profile of T. poecilonotus are now in progress.
In males, maturation-associated changes in the toxin distribution in the body were not
clearly observed. Unlike ovaries, testes do not actively take up TTX. Therefore, even during
the maturation period, as well as during the ordinary period, the TTX taken up into the liver is
transferred mainly to the skin, and only a small portion to the testis.
In both females and males, the binding ratio of plasma TTX was low during the
ordinary period, and high during the maturation period (Figs. 4, 5, and Table 4), suggesting
that quantity, species, and/or activity of TTX-binding high molecular-weight substances are
increased during the maturation period, which might be involved in the transportation of TTX
from the liver to ovary. Alternatively, that b-TTX remained at a certain level irrespective of
maturation, but free TTX decreased during the maturation period (Figs. 4, 5, and Table 4). In
this view, the decreased portion of f-TTX is thought to correspond to the increased ovary

10
toxicity. Although not conclusive, we lean toward the former possibility, because it is unlikely
that most of f-TTX is specifically taken up only into the ovary, and because free TTX has
nowhere to go in males during the maturation period in the latter hypothesis. TTX-binding
proteins have been isolated from the blood plasma of marine pufferfish (Matsui et al., 2000;
Yotsu-Yamashita et al., 2001), and may be involved in the transportation mechanism. The
relationship between the binding ratio and these proteins or other high molecular-weight
substances, especially those that appear with maturation remains to be elucidated. Further
studies are in progress.
Acknowledgements
We would like to express sincere thanks to Dr. Kentaro Kawatsu and Dr. Yonekazu
Hamano of Osaka Prefectural Institute of Public Health, Japan, for providing the anti-TTX
antibody. This work was partly supported by Grant-in-aids from the Ministry of Education,
Culture, Sports, Science, and Technology, and the Ministry of Health, Labour and Welfare,
Japan.
Conflict of interest
The authors declare that there are no conflicts of interest.
References
Endo, R., 1984. Toxicological studies on puffer fishes: comparison of toxicities on the various
species. J. Toxicol. Sci. 9, Suppl. I, 1-11.
Fuchi, Y., Hoashi, K., Akaeda, H., Makino, Y., Noguchi, T., 1999. Toxicity of two species of
puffer fish, Takifugu pardalis (“higanfugu”) and Takifugu poecilonotus (“komonfugu”)
inhabiting the Kunisaki Coast, Oita Prefecture. J. Food Hyg. Soc. Jpn. 40, 80-89.
Honda, S., Arakawa, O., Takatani, T., Tachibana, K., Yagi, M., Tanigawa, A., Noguchi, T.,
2005. Toxification of cultured puffer fish Takifugu rubripes by feeding on
tetrodotoxin-containing diet. Nippon Suisan Gakk. 71, 815-820.
Ikeda, K., Murakami, Y., Emoto, Y., Ngy, L., Taniyama, S., Yagi, M., Takatani, T., Arakawa,
O., 2009. Transfer profile of intramuscularly administered tetrodotoxin to non-toxic
cultured specimens of the pufferfish Takifugu rubripes. Toxicon 53, 99-103.

11
Jang, J., Yotsu-Yamashita, M., 2006. Distribution of tetrodotoxin, saxitoxin, and their analogs
among tissues of puffer fish Fugu pardalis. Toxicon 48, 980-987.
Japan Food Hygiene Association, 2005. Puffer toxin. In: Environmental Health Bureau,
Ministry of Health and Welfare, (Ed.), Shokuhin Eisei Kensa Shishin (Manual for
Methods for Food Sanitation Testing), Tokyo, pp. 661-673.
Kawatsu, K., Hamano, Y., Yoda, T., Terano, Y., Shibata, T., 1997. Rapid and highly sensitive
enzyme immunoassay for quantitative determination of tetrodotoxin. Jpn. J. Med. Sci.
Biol. 50, 133-150.
Kodama M., Ogata, T., Kawamukai, K., Oshima, Y., Yasumoto, T., 1984. Toxicity of muscle
and other organs of five species of puffer collected from the Pacific coast of Tohoku
area of Japan. Bull. Jpn. Soc. Sci. Fish. 50, 703-706.
Kodama, M., Ogata, T, Sato, S., 1985. External secretion of tetrodotoxin from puffer fishes
stimulated by electric shock. Mar. Biol. 87, 199-203.
Kodama, M., Sato, S., Ogata, T., Suzuki, Y., Kaneko, T., Aida, K., 1986. Tetrodotoxin
secreting glands in the skin of puffer fishes. Toxicon 24, 819-829.
Kono, M., Matsui, T., Furukawa, K., Yotsu-Yamashita, M., Yamamori, K., 2008.
Accumulation of tetrodotoxin and 4,9-anhydrotetrodotoxin in cultured juvenile
kusafugu Fugu niphobles by dietary administration of natural toxic komonfugu Fugu
poecilonotus liver. Toxicon 51, 1269-1273
Mahmud, Y., Okada, K., Takatani, T., Kawatsu, K., Hamano, Y., Arakawa, O., Noguchi, T.,
2003a. Intra-tissue distribution of tetrodotoxin in two marine puffers Takifugu
vermicularis and Chelonodon patoca. Toxicon 41, 13-18.
Mahmud, Y., Arakawa, O., Ichinose, A., Tanu, M.B., Takatani, T., Tsuruda, K., Kawatsu, K.,
Hamano, Y., Noguchi, T., 2003b. Intracellular visualization of tetrodotoxin (TTX) in the
skin of a puffer Tetraodon nigroviridis by immunoenzymatic technique. Toxicon 41,
605-611.
Matsui, T., Hamada, S., Konosu, S., 1981. Difference in accumulation of puffer fish toxin and
crystalline tetrodotoxin in the puffer fish, Fugu rubripes rubripes. Bull. Jpn. Soc. Sci.
Fish. 47, 535-537.
Matsui, T., Yamamori, K., Furukawa, K., Kono, M., 2000. Purification and some properties of
a tetrodotoxin binding protein from the blood plasma of kusafugu, Takifugu niphobles.
Toxicon 38, 463-468.
Matsumoto, T., Nagashima, Y., Takayama, K., Shimakura, K., Shiomi, K., 2005. Difference
between tetrodotoxin and saxitoxin in accumulation in puffer fish Takifugu rubripes

12
liver tissue slices. Fish Physiol. Biochem. 31, 95-100.
Matsumoto, T., Nagashima, Y., Kusuhara, H., Sugiyama, Y., Ishizaki, S., Shimakura, K.,
Shiomi, K., 2007. Involvement of carrier-mediated transport system in uptake of
tetrodotoxin into liver tissue slices of puffer fish Takifugu rubripes. Toxicon 50,
173-179.
Matsumoto, T., Nagashima, Y., Kusuhara, H., Ishizaki, S., Shimakura, K., Shiomi, K., 2008a.
Pharmacokinetics of tetrodotoxin in puffer fish Takifugu rubripes by a single
administration technique. Toxicon 51, 1051-1059.
Matsumoto, T., Nagashima, Y., Kusuhara, H., Ishizaki, S., Shimakura, K., Shiomi, K., 2008b.
Evaluation of hepatic uptake clearance of tetrodotoxin in the puffer fish Takifugu
rubripes. Toxicon 52, 369-374.
Miyazawa, K., Noguchi, T., 2001. Distribution and origin of tetrodotoxin. J. Toxicol.-Toxin
Rev. 20, 11-33.
Nagashima, Y., Toyoda, M., Hasobe, M., Shimakura, K., Shiomi, K., 2003. In vitro
accumulation of tetrodotoxin in pufferfish liver tissue slices. Toxicon 41, 569-574.
Ngy, L., Tada, K., Yu, C.-F., Takatani, T., Arakawa, O., 2008. Occurrence of paralytic shellfish
toxins in Cambodian Mekong pufferfish Tetraodon turgidus: selective toxin
accumulation in the skin. Toxicon 51, 280-288.
Noguchi, T., Arakawa, O., 2008. Tetrodotoxin - Distribution and accumulation in aquatic
organisms, and cases of human intoxication. Marine Drugs 6, 220-242.
Saito, T., Noguchi, T., Harada, T., Murata, O., Hashimoto, K., 1985. Tetrodotoxin as a
biological defense agent for puffers. Nippon Suisan Gakk. 51, 1175-1180.
Specker, J.L., Sullivan, C.V., 1994. Vitellogenesis in fishes: status and perspectives. In:
Perspectives in Comparative Endocrinology, National Research Council of Canada, pp.
304-315.
Takita, T., Intong, S., 1991. Ecological studies on young puffers Takifugu rubripes and T.
xanthopterus in Ariake Sound. Nippon Suisan Gakk. 57, 1883-1889.
Tanu, M.B., Mahmud, Y., Takatani, T., Kawatsu, K., Hamano, Y., Arakawa, O., Noguchi, T.,
2002. Localization of tetrodotoxin in the skin of a brackishwater puffer Tetraodon
steindachneri on the basis of immunohistological study. Toxicon 40, 103-106.
Wallace, R. A., 1985. Vitellogenesis and oocyte growth in nonmammalian vertebrates. In:
Developmental Biology, vol. 1, Plenum Press, New York, pp. 127-177.
Watabe, S., Sato, Y., Nakaya, M., Nogawa, N., Oohashi, K., Noguchi, T., Morikawa, N.,
Hashimoto, K., 1987. Distribution of tritiated tetrodotoxin administrated

13
intraperitoneally to pufferfish. Toxicon 25, 1283-1289.
Yamamori, K., 2002. Natural forms of tetrodotoxin in puffer fish. Nippon Suisan Gakk. 68,
922-923.
Yamamori, K., Kono, M., Furukawa, K., Matsui, T., 2004. The toxification of juvenile
cultured kusafugu Takifugu niphobles by oral administration of crystalline tetrodotoxin.
J. Food Hyg. Soc. Jpn. 45, 73-75.
Yotsu-Yamashita, M., Sugimoto, A., Terakawa, T., Shoji, Y., Miyazawa, T., Yasumoto, T.,
2001. Purification, characterization, and cDNA cloning of a novel soluble saxitoxin and
tetrodotoxin binding protein from plasma of the puffer fish, Fugu pardalis. Eur. J.
Biochem. 268, 5937–5946.

14
Figure captions
Fig. 1. Seasonal changes in the gonadosomatic index (GSI) in female (upper) and male
(lower) specimens of T. poecilonotus. Data are shown by individual values (symbols) and
mean of each month (bend of sequential line). White, light gray, and gray zones indicate
‘ordinary period’, ‘maturation period’, and ‘just after spawning’, respectively (common in all
figures).
Fig. 2. Seasonal changes in the toxicity (MU/g) of skin (upper), ovary (middle), and liver
(lower) in the female specimens of T. poecilonotus. Data are shown by mean (column) and
standard deviation (SD, error bar) of each month.
Fig.3. Seasonal changes in the toxicity (MU/g) of skin (upper), testis (middle), and liver
(lower) in the male specimens of T. poecilonotus. Data are shown by mean (column) and SD
(error bar) of each month.
Fig. 4. Seasonal changes in the toxicity (MU/individual) of the skin (upper) and ovary/liver
with GSI (middle), and in the TTX amount of blood plasma (lower) in the female specimens
of T. poecilonotus. The sum of free TTX (f-TTX) and TTX binding to high molecular-weight
substances (b-TTX) was considered as a total TTX amount in plasma (p-TTX), and the
percentage of b-TTX in p-TTX was calculated as the binding ratio. Data are shown by mean
of each month (column or symbol on sequential line). Error bars (SD) for data other than the
binding ratio are omitted to avoid confusion.
Fig. 5. Seasonal changes in the toxicity (MU/individual) of the skin (upper) and testis/liver
with GSI (middle), and in the plasma TTX content in male specimens of T. poecilonotus.
Refer to the caption of Fig. 4 for the meaning of b-TTX, f-TTX, and binding ratio. Data are
shown by mean of each month (column or symbol on sequential line). Error bars (SD) for
data other than the binding ratio are omitted to avoid confusion.

Oct
Nov Dec Jan
Feb
Mar
Apr
Jun
Aug Se
pO
ctD
ec
GSI
(%)
25
20
15
10
5
0
FemaleG
SI (%
)
20
15
10
5
0
Male
2006 2007
Fig. 1. GSI

10000
5000
0
2000
1500
1000
500
0
2000
1500
1000
500
0
Skin
Ovary
Liver
Oct
Nov Dec Jan
Feb
Mar
Apr
Jun
Aug Se
pO
ctD
ec
Toxi
city
(MU
/g)
Toxi
city
(MU
/g)
Toxi
city
(MU
/g)
2006 2007
Fig. 2. Female

10000
5000
0
400
300
200
100
0
2000
1500
1000
500
0
Skin
Testis
Liver
Oct
Nov Dec Jan
Feb
Mar
Apr
Jun
Aug Se
pO
ctD
ec
Toxi
city
(MU
/g)
Toxi
city
(MU
/g)
Toxi
city
(MU
/g)
2006 2007
Fig. 3. Male

2006 2007
Oct
Nov Dec Jan
Feb
Mar
Apr
Jun
Aug Se
pO
ctD
ec
40000
30000
20000
10000
0
40000
30000
20000
10000
0Toxi
city
(MU
/indi
vidu
al)
Toxi
city
(MU
/indi
vidu
al)
GSI (%
)
20
15
10
5
0
16
12
8
4
0TTX
amou
nt in
pla
sma
(MU
/ml)
Binding ratio (%
)
100
50
0
Skin
OvaryLiverGSI
b-TTX f-TTX Binding ratio
Fig. 4. Female

Oct
Nov Dec Jan
Feb
Mar
Apr
Jun
Aug Se
pO
ctD
ec
20000
10000
0
15
10
5
0
GSI (%
)To
xici
ty (M
U/in
divi
dual
)TT
X am
ount
in p
lasm
a(M
U/m
l)B
inding ratio (%)
100
50
0
20000
10000
0Toxi
city
(MU
/indi
vidu
al)
16
12
8
4
0
Skin
TestisLiverGSI
b-TTX f-TTX Binding ratio
2006 2007 Fig. 5. Male

2006 Oct ♀ 1 198 24 12♂ 3 211 24 10
Nov ♀ 3 273 30 16♂ 3 227 26 14 13
Dec ♀ 2 176 21♂ 3 210 21 21
2007 Jan ♀ 8 278 31 16 19♂ 3 248 25 31
Feb ♀ 10 267 29 13 31♂ 6 280 32 15 34
Mar ♀ 8 243 22 39♂ 3 126 14 13
Apr ♀ 12 121 15♂ 5 113 16
Jun ♀ 17 124 15♂ 2 143 18
Aug ♀ 7 156 17♂ 3 155 19
Sep ♀ 8 121 13♂ 4 116 13
Oct ♀ 11 146 16♂ 5 123 15
Dec ♀ 6 194 22♂ 5 166 18
(g)Gonad
(g)
Sex
(g)Skin(g)
Mean tissue weight
monthCollection
Table 1. Specification of T . poecilonotus specimens
Liver
0.9
4.1
1.4
4.0
4.8
3.3
0.9
8.5
Number ofspecimens
9.29.4
8.8
9.23.94.1
2.0
6.24.56.5
2.2
1.1
1.2
3.7
0.51.41.36.6
8.95.3
Mean bodyweight
4.74.46.58.7
3.4
♀O
4723
20±
2770
a16
300
±24
600a
385
±34
8b58
0±
691b *
1010
±56
3a *16
700
±12
400
M34
584
±11
90b
6140
±11
500b
849
±44
0a18
200
±15
000a
761
±42
9ab*
1990
0±
1260
0
♂O
1790
9±
2320
a38
30±
8350
ab41
.9±
90.8
c *29
.2±
72.2
b *73
0±
402ab
1120
0±
5740
M23
267
±39
3b24
50±
4520
b1.
04±
1.77
c *13
.3±
24.6
b57
2±
410b
1300
0±
9630
†O: o
rdin
ary
perio
d; M
: mat
urat
ion
perio
d.
Tabl
e 2.
Res
ult o
f sta
tistic
al a
naly
sis fo
r eac
h tis
sue
toxi
city
test
(com
pare
d ba
sed
on s
easo
nal c
lass
ifica
tion)
Sex
(MU
/g)
(MU
/g)
Live
rn
Seas
onal
clas
sific
-at
ion†
Skin
(MU
/g)
Toxi
city
Dat
a ar
e sh
own
as m
ean
± st
anda
rd d
evia
tion
(SD
).D
iffer
ent a
lpha
betic
al s
uper
scrip
ts in
dica
te s
igni
fican
t diff
eren
ces
amon
g th
e m
easu
red
valu
es in
eac
h co
lum
n (T
ukey
-Kra
mer
pos
t hoc
test
,p<
0.05
).A
ster
isks
indi
cate
sig
nific
ant d
iffer
ence
s be
twee
n th
e tw
o m
easu
red
valu
es in
eac
h co
lum
n (S
tude
nt's
t-te
st, p
<0.0
5).
(MU
/indi
vidu
al)
(MU
/indi
vidu
al)
Ova
ry/te
stis
(MU
/indi
vidu
al)

♀93
1410
±22
90*
1060
0±
1970
0*51
8±
454*
7080
±12
400*
809
±55
0*16
100
±12
800*
♂45
485
±14
60*
2710
±60
70*
16.1
±58
.2*
18.0
±47
.8*
585
±41
6*11
100
±83
00*
Tabl
e 3.
Res
ult o
f sta
tistic
al a
naly
sis fo
r eac
h tis
sue
toxi
city
test
(ind
epen
dent
of s
easo
nal c
lass
ifica
tion)
Sex
nTo
xici
tyLi
ver
Ova
ry/te
stis
Skin
(MU
/g)
(MU
/indi
vidu
al)
Ast
erisk
s in
dica
te s
igni
fican
t diff
eren
ces
betw
een
the
two
mea
sure
d va
lues
in e
ach
colu
mn
(Stu
dent
's t-
test
, p<0
.05)
.
(MU
/g)
(MU
/indi
vidu
al)
(MU
/g)
(MU
/indi
vidu
al)
Dat
a ar
e sh
own
as m
ean
± SD
.

♀O
479.
80±
10.4
5*5.
25±
6.29
a4.
55±
5.90
52.2
±27
.8b
M34
5.45
±5.
71*
0.55
±0.
65b
4.90
±5.
3487
.7±
10.6
a
♂O
1710
.37
±6.
856.
19±
5.79
a4.
18±
2.28
47.5
±26
.1b
M23
7.78
±6.
451.
00±
1.28
b6.
78±
6.21
84.0
±15
.2a
Ast
erisk
s in
dica
te s
igni
fican
t diff
eren
ces
betw
een
the
two
mea
sure
d va
lues
in e
ach
colu
mn
(Stu
dent
's t-
test
,p<
0.05
).†O
: ord
inar
y pe
riod;
M: m
atur
atio
n pe
riod.
(MU
/ml)
(MU
/ml)
Diff
eren
t alp
habe
tical
sup
ersc
ripts
indi
cate
sig
nific
ant d
iffer
ence
s am
ong
the
mea
sure
d va
lues
in e
ach
colu
mn
(Tuk
ey-K
ram
er p
ost h
oc te
st, p
<0.0
5).
Dat
a ar
e sh
own
as m
ean
± SD
.
Tabl
e 4.
Res
ult o
f sta
tistic
al a
naly
sis fo
r the
am
ount
of T
TX in
pla
sma
and
bind
ing
ratio
Sex
Seas
onal
clas
sific
-at
ion†
n
TTX
am
ount
Bin
ding
ratio
(%)
p-TT
Xf-
TTX
b-TT
X(M
U/m
l)