nanpao resins chemical group 4766 tt 1q19 results presentation presentation_quarterly... · nanpao...
TRANSCRIPT

NanPao Resins Chemical Group 4766 TT
1Q19 Results Presentation
Integrity v Teamwork v Innovation v Efficiency
May 2019

0%
4%
8%
12%
16%
0%
10%
20%
30%
40%
3Q16 4Q16 1Q17 2Q17 3Q17 4Q17 1Q18 2Q18 3Q18 4Q18 1Q19
Quarterly Margin Trend
Gross Margin (LHS) Operating Margin (RHS) Net Margin (RHS)
0%
4%
8%
12%
16%
0
900
1,800
2,700
3,600
4,500
3Q16 4Q16 1Q172Q17 3Q17 4Q17 1Q18 2Q183Q18 4Q18 1Q19
Quarterly Revenue Trend
Revenue Growth(YoY)
NT$M
• 1Q19 revenue was NT$3.7bn, up 7% YoY. It was the 5th straight quarter of 7% or greater growth in our top line. • Both gross and operating margins have been trending up since 2Q18. 1Q19 gross margin was 25.7% vs. 22.3%
in 1Q18. 1Q19 operating margin was 7.0% versus 3.6% in 1Q18. • Contributing factors to margin improvement have been top line growth, product price increases, a strong US$ vs
the NT$ & the RMB, and a flattening in raw materials costs.
Source: TEJ and CIQ*Note:Quarterly data is unavailable prior to 3Q16.
Revenue & Margin Trend
2
-60%
-40%
-20%
0%
20%
40%
0
0.9
1.8
2.7
3.6
4.5
3Q16 4Q16 1Q17 2Q17 3Q17 4Q17 1Q18 2Q18 3Q18 4Q18 1Q19
EPS - Basic
EPS(LHS) YoY(RHS)
NT$
-60%
-35%
-10%
15%
40%
65%
0
135
270
405
540
3Q16 4Q16 1Q17 2Q17 3Q17 4Q17 1Q18 2Q18 3Q18 4Q18 1Q19
Earnings & Growth Trend
Operating Profit Net Income to parent Net Income Growth(YoY)
NT$M
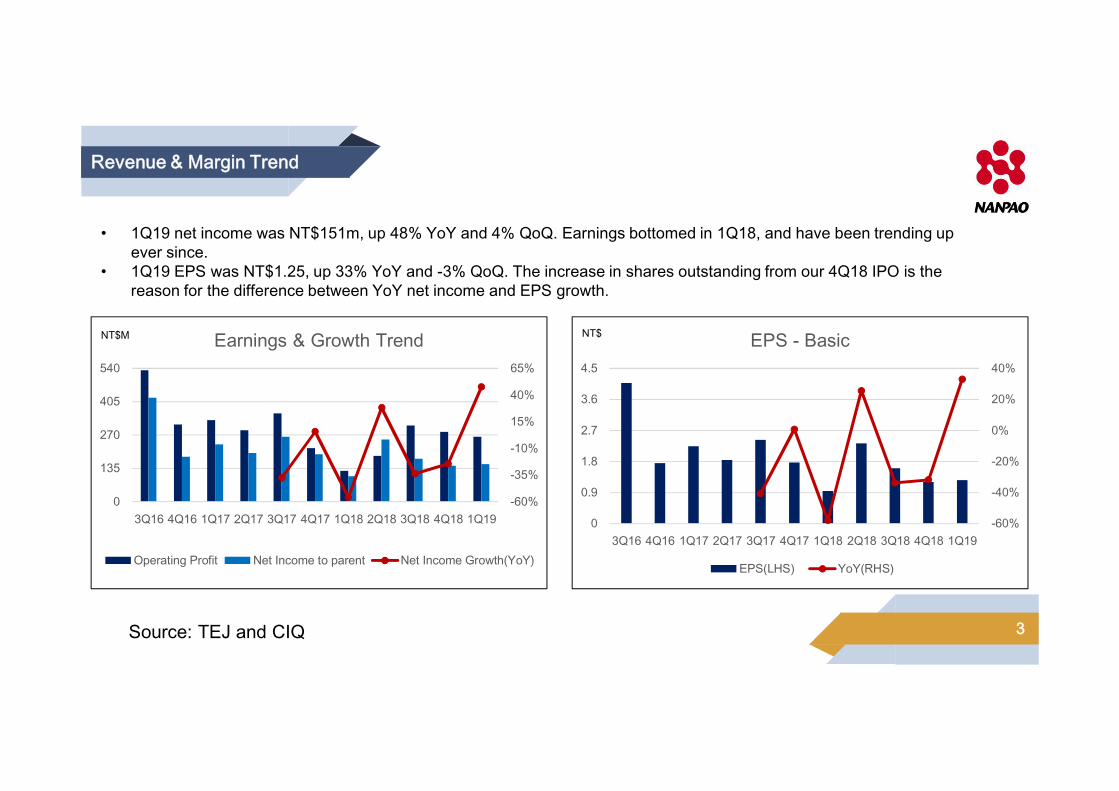
• 1Q19 net income was NT$151m, up 48% YoY and 4% QoQ. Earnings bottomed in 1Q18, and have been trending up ever since.
• 1Q19 EPS was NT$1.25, up 33% YoY and -3% QoQ. The increase in shares outstanding from our 4Q18 IPO is the reason for the difference between YoY net income and EPS growth.
Source: TEJ and CIQ
Revenue & Margin Trend
3

• Sales revenue in April, 2019 was NT$1.464 billion, annual growth rate was 11%.• Sales revenue in May, 2019 was NT$1.498 billion, annual growth rate was 4%, the revenue hit a record high.• Total revenue in April and May, 2019 was NT$2.962 billion, annual growth rate was 8%.• Total revenue from January through May of 2019 was NT$6.724 billion, annual growth rate was 7%, achieves 4
consecutive months of growth despite flat revenue growth in January, 2019.
Source: TEJ
Monthly Revenue Growth Trend
4

Sales Mix
40% Footwear
28% Specialty
1Q18 By Business Unit
21% Growth
11% Coatings
1Q19 By Business Unit
42% Footwear
29% Specialty
18% Growth
11% Coatings
5

Sales Mix
1Q19 by Plant Location
34% Mainland of China
22% Taiwan
22% Vietnam
12% Australia
10% SE Asia Ex-VNM
1Q18 by Plant Location
34% Mainland of China
24% Taiwan
19% Vietnam
14% Australia
9% SE Asia Ex-VNM 6

2019 Outlook
Key contributors to top line growth are likely to be footwear adhesives and non-woven adhesives.
Moderation in raw material prices and price hikes achieved since 2H18 should positively affect 2019 profitability.
We are optimistic that carbon fiber composite and other new products from our R&D pipeline will contribute to our top and bottom line growth over the next few years.
7

Income - QuarterlyConsolidated Statements of
NT$ million 1Q19 4Q18 1Q18Net Revenue 3,748 4,266 3,507Gross Profit 965 1,055 784
Gross Margin 25.8% 24.7% 22.3%Operating Expenses (702) (773) (659)
SG&A percent of Sales 18.7% 18.1% 18.8%Operating Income 263 283 125
Operating Margin 7.0% 6.6% 3.6%Net Non-Operating Income (Loss) 1 7 (24)Pre-Tax Income 264 290 101Income Tax Expense (96) (130) 7 Minority Interest (17) (15) (6)Net Income to Parent 151 145 102
Net Margin 4.0% 3.4% 2.9%EPS (NT$) 1.25 1.29 0.94
ROE – not annualized 1.6% 1.6% 1.2%Depreciation 92 82 72CAPEX 123 302 99
Q-Q (%) Y-Y (%)-12% 7%
-9% 23%
-9% 7%
-7% 110%
-9% 161%
4% 48%
-3% 33%
8

Consolidated Balance Sheet
NT$ million2019/3/31 2018/12/31 2018/3/31
$ % $ % $ %Cash and Cash Equivalents 4,184 24% 3,875 22% 4,005 24%Notes and Accounts Receivable, Net 3,422 19% 3,764 22% 3,135 19%Inventories 2,300 13% 2,347 13% 2,457 15%Other Current Assets 646 4% 683 4% 582 4%Long-term Investments 1,544 9% 1,574 9% 1,916 11%Fixed Assets 3,964 22% 3,960 23% 3,371 20%Other Long-term Assets 1,624 9% 1,160 7% 1,189 7%TOTAL ASSETS 17,684 100% 17,363 100% 16,655 100%Current Liabilities 4,439 25% 4,705 27% 4,474 27%Long-term Debt 1,381 8% 1,392 8% 1,597 9%Other Non-Current Liabilities 1,372 8% 911 5% 949 6%TOTAL LIABILITIES 7,192 41% 7,008 40% 7,020 42%Common Stock 1,206 1,206 1,086TOTAL EQUITY 10,492 59% 10,355 60% 9,635 58%Book Value per Share (NT$) 80.8 79.9 82.3Current Ratio ( Current Assets / Current Liabilities) 238% 227% 227%
Net Cash (Debt) to Equity 12% 9% 9%9

R&D Focus
Disclaimer
•The information contained in this confidential document ("Presentation") has been prepared by Nanpao Resins Chemical Group (the "Company"). It has not been fully verified and is subject to material updating, revision and further amendment. While the information contained herein has been prepared in good faith, neither the Company nor any of its shareholders, directors, officers, agents, employees or advisers gives, has given or has authority to give, any representations or warranties (express or implied) as to, or in relation to, the accuracy, reliability or completeness of the information in this Presentation, or any revision or supplement thereof, or of any other written or oral information made or to be made available to any interested party or its advisers (all such information being referred to as "Information") and liability therefore is expressly disclaimed. Accordingly, neither the Company nor any of its shareholders, directors, officers, agents, employees or advisers takes any responsibility for, or will accept any liability whether direct or indirect, express or implied, contractual, tortious, statutory or otherwise, in respect of, the accuracy or completeness or injury of the Information or for any of the opinions contained herein or for any errors, omissions or misstatements or for any loss, howsoever arising, from the use of this Presentation or the information.
•Neither the issue of this Presentation nor any part of its contents is to be taken as any form of commitment on the part of the Company to proceed with any transaction and the right is reserved by the Company to terminate any discussions or negotiations with any prospective investors. In no circumstances will the Company be responsible for any costs, losses or expenses incurred in connection with any appraisal or investigation of the Company. In furnishing this Presentation, the Company does not undertake or agree to any obligation to provide the recipient with access to any additional information or to update this Presentation or to correct any inaccuracies in, or omissions from, this Presentation which may become apparent.
•This Presentation should not be considered as the giving of investment advice by the Company or any of its shareholders, directors, officers, agents, employees or advisers. Each party to whom this Presentation is made available must make its own independent assessment of the Company after making such investigations and taking such advice as may be deemed necessary. In particular, any estimates or projections or opinions contained herein necessarily involve significant elements of subjective judgment, analysis and assumptions and each recipient should satisfy itself in relation to such matters.
•This Presentation includes certain statements that may be deemed “forward-looking statements”. All statements in this discussion, other than statements of historical facts, that address future activities and events or developments that the Company expects, are forward-looking statements. Although the Company believes the expectations expressed in such forward-looking statements are based on reasonable assumptions, such statements are not guarantees of future performance and actual results or developments may differ materially from those in the forward-looking statements. Factors that could cause actual results to differ materially from those in forward-looking statements include market prices, continued availability of capital and financing, general economic, market or business conditions and other unforeseen events. Prospective Investors are cautioned that any such statements are not guarantees of future performance and that actual results or developments may differ materially from those projected in forward-looking statements.
10

Thank You!Our Website: www.nanpao.com
11