nanoparticle formation, measurement and capture in … · nanoparticle formation, measurement and...
TRANSCRIPT

Aerosol & Air Quality Research Lab (AAQRL) Aerosol & Air Quality Research Lab (AAQRL)
Nanoparticle Formation, Measurement and Capture in Coal Combustion
Systems
Pratim Biswas The Lucy and Stanley Lopata Professor He Jing, Sameer Patel, Zhichao Li
Dept. of Energy, Environ. & Chemical Engineering Washington University in St., Louis
19th ETH Conference Combustion Generated Nanoparticles Zurich, Switzerland
June 29, 2015

Aerosol & Air Quality Research Lab (AAQRL)
NSF, NIH, DOE Consortium for Clean Coal Utilization MAGEEP (McDonnell Academy Global Energy & Env. Partnership)
MAGEEP
Acknowledgements
Results of work by Graduate Students in AAQRL, Washington University in St. Louis
NNIN – A NSF NANOTECHNOLOGY NETWORK

Aerosol & Air Quality Research Lab (AAQRL)
NP PARTICLE & PRECURSOR
SOURCES
PRIMARY NP
CONTROL TECHNOLOGY
Life Cycle of Inadvertently Produced Nanoparticles
CLIMATE &
HEALTH EFFECTS nucleation in atmosphere
molecules
SECONDARY NP

Aerosol & Air Quality Research Lab (AAQRL)
Outline of Presentation
COAL COMBUSTION - Formation of NP & Role of
Precursors - Size Distributions of NP - Inorganic and Organic Species - Charging of Coal Combustion NP
CONTROL TECHNOLOGY (ESPs) - Penetration through ESPs - Improvement of Collection Eff by Photoionizer - Role of Pressure on Charging and Capture
ULTRA FINE PARTICLES &
MOLECULAR PRECURSORS
NPs &
PRECURSORS

Combustion in O2-CO2 Environment • Affects Flame Temperature • Affects Volatilization Rates (Formation of Suboxides)
Oxy-Coal Combustion System
Adapted from Jordal, Anheden, Yan, Stromber,( Sweden)
PRESSURIZED

Aerosol & Air Quality Research Lab (AAQRL)
DROP TUBE FURNACE REACTOR EARLY STAGE COMBUSTION / PYROLYSIS
• SIZE DISTRIBUTION EVOLUTION • AEROSOL MASS SPECTROMETRY
Detailed Understanding of Particle Formation

Aerosol & Air Quality Research Lab (AAQRL) Aerosol & Air Quality Research Lab (AAQRL)
• Workhorse Electrical Mobility Measurement (SMPS, NanoDMA: ~ 10 nm)
• Low size resolution CPCs (can count ~ 1 nm) • Fast DMAs (down to sub 1 nm) [Anal. Chem., 86:
7523-7529 (2014); J. of Aerosol Sci., 71(1): 52-64 (2014)] • Portable Size Distribution Measurement: Nanoscan,
PAMS, DISCmini • Time of Flight Mass Spectrometers [Atmos. Chem. &
Phys., 13(2): 3345-3377 (2013) ]
• Tandem DMA – Mass Spectrometers • LIBS, LII – Composition Analysis • Bring to bear Nanomaterials Characterization Tools
(BET, AFM, HRTEM, SEM, XRD, Raman, etc)
INSTRUMENTATION ENABLES NP STUDIES

Aerosol & Air Quality Research Lab (AAQRL)
Fine Particles(Submicrometer Aerosol)
Coarse ParticlesChar burning
Coalesce and Fragmentation
Vol
atile
Met
al
Vap
oriz
atio
n
De-volatilization
coal
Vap
oriz
atio
n
Scav
engi
ng
Fragmentation
and Attrition
Vap
oriz
atio
n vi
a re
duct
ion-
oxid
atio
n re
actio
n.e.
g. S
iO2+
CO
SiO
+CO
2
Gas Phase Chemical ReactionNucleation
Condensation
Molecules
Coagulation
Vaporization rateof mineral matters strong function of
particle temperature
e.g. Na, Hg, Pb
e.g. Ca, Se.g. SiO2
CO2 Environment Affects Flame Temperature
CO2 Environment Affects Vaporization Rates (Formation of Sub Oxide)
MECHANISTIC PATHWAY OF PARTICLE FORMATION DURING OXY-COAL COMBUSTION
Energy and Fuels, 20 (6), 2357-2363, 2006

Aerosol & Air Quality Research Lab (AAQRL)
When AIR is replaced by 20%O2+80%CO2: Geometric mean particle size decreases from 40 nm to 29 nm Total number concentration decreases from 6.4 x10⁴ to 3.9 x10⁴
No effects on particle shape
Oxy-Coal vs Air Combustion: Air vs. 21%O2+79%CO2
Fine / Coarse = 0.97
Fine / Coarse = 0.4
AIR
O2+CO2
40 nm 29 nm
)()(25.0)()1( sMOgMOOgnMO →↔+−
)(2)()1()()( gCOgnMOgCOsnMO +−↔+
O2
CO
CO2
Coal
O2
CO
CO2
Coal
•High CO2 conc. delays vaporization via reduction of metal oxide
Dp (nm)10 100 1000
dN/ d
log
Dp
(#/c
m3 )
103
104
105
106
Air 20% O2-80%CO2
•High CO2 conc. delays devolatilization process due to thermophysical properties of N2 and CO2 •Flame temperature higher in Air (2311 K) vs CO2/O2 (1722 K) - Cp: N2=20.78 kJ/kmol-ºC, CO2 = 58.84 kJ/kmol-ºC - DO2/N2= 1.7x10⁻⁴ m2/s; DO2/CO2 = 1.3x10⁻⁴ m2/s
22
5.2COOAIR AshCoarse
AshterSubmicromeAshCoarse
AshterSubmicrome
−
=
Energy and Fuels, 20 (6), 2357-2363, 2006

Fine Particles(Submicrometer Aerosol)
Coarse ParticlesChar burning
Coalesce and Fragmentation
Vol
atile
Met
al
Vap
oriz
atio
n
De-volatilization
coal
Vap
oriz
atio
n
Scav
engi
ng
Fragmentation
and Attrition
Vap
oriz
atio
n vi
a re
duct
ion-
oxid
atio
n re
actio
n.e.
g. S
iO2+
CO
SiO
+CO
2
Gas Phase Chemical ReactionNucleation
Condensation
Molecules
Coagulation
Vaporization rateof mineral matters strong function of
particle temperature
e.g. Na, Hg, Pb
e.g. Ca, Se.g. SiO2
CO2 Environment Affects Vaporization Rates (Formation of Sub Oxide)
CO2 Environment Affects Flame Temperature
Pathway of Particle Formation: Organic & Inorganic
Wang, Biswas et al. Atmospheric Chemistry & Physics, 13(2): 3345-3377 (2013)
* Volatiles (organics) are released * Small fraction is associated with Inorganic ash constituents * Prevents from complete oxidation & released into atmosphere

Aerosol & Air Quality Research Lab (AAQRL)
0 100 200 300 400 500 6000.00
0.04
0.08
0.12
0.16
0.20
0.24
Mas
s Co
ncen
tratio
n (µ
g/m
3 )
Oxygen/Coal Ratio (Gas Composition): 10.0 (Air) 9.0 (10% N2 + 90% Air) 8.0 (20% N2 + 80% Air) 6.0 (40% N2 + 60% Air)
m/z
Adding More N2, lowering O2 concentration
Wang, Biswas et al. Atmospheric Chemistry & Physics, 13(2): 3345-3377 (2013)
ORGANIC CONSTITUENTS IN NP FROM COAL
Contrary trend (consistent with Hypothesis) Oxygen increase results in more Organic Aerosol Constituents
OXYGEN / COAL RATIO
9
10
8
6

Aerosol & Air Quality Research Lab (AAQRL)
0 50 100 1500.00
0.05
0.10
0.15
69
Mas
s C
once
ntra
tion
(µg/
m3 )
Pyrolysis: PRB Coal
41
43
55
5751 67
1158183 91
107
2729
0 50 100 1500.0
0.1
0.2
0.3
0.4(b)
Mass-to-charge Ratio (m/z)
Combustion: PRB Coal
41
43
5557
69
67 818391 115107
28
(a)
20 25 30 35 40 45
20 25 30 35 40 45
2
Sig
nal I
nten
sity
(A. U
.)
PRB Combustion
1 34 5
6
7
89
10
(b)
PRB Pyrolysis
12
34
5
67
8 9 10
Retention Time (min)
(a)
AMS and TAG-GC ANALYSIS AMS TAG-MS
Both cases: non-aromatic hydrocarbons carboxylic acids and aromatics
Wang, Biswas: Proc.Combustion Institute , 35, 2347-2354 2 (2015).
Oxygenated
Aromatics

Aerosol & Air Quality Research Lab (AAQRL) Aerosol & Air Quality Research Lab (AAQRL)
Chemical Composition of Particles: Coal Combustion
Air firing (Test 3) Oxy (40% O2, Test 4) Oxy (50% O2, Test 5)
0
20
40
60
80
100
120
140
BC: 0
270 KW
Mas
s Co
ncen
tratio
n in
Flu
e G
as (µ
g/m
3 )
Combustion Condition
Organic Carbon (OC) Black Carbon (BC)
400 KW
270 KWBCBC: 0 BC
Carbon in Fine Particles
Fe S Si Ca Zn Ba Cu P Ti K0
1000
2000
3000
4000
5000
Mas
s Co
ncen
tratio
n (µ
g/m
3 )
Element
Air firing (Test 3) 40% O2 (Test 4) 50% O2 (Test 5)
Elemental Analysis Inorganic Constituents of Ash Dominate NPs
Organic Carbon & Brown Carbon Exceeds Black Carbon in NPs

Aerosol & Air Quality Research Lab (AAQRL)
ESPS: How good are they to remove NPs ?
CONTROL TECHNOLOGY (ESPs) - Penetration through ESPs - Improvement of Collection Eff - Co-Pollutant Removal
NPs &
PRECURSORS
Image from: Powerspan Corpn.

Aerosol & Air Quality Research Lab (AAQRL)
Kr-85 Radioactive Source
Air
CO2
N2
O2
Condensation Particle Counter
Differential Mobility Analyzer
Collison Nebulizer
Mass Flow Controllers
Po-210 Radioactive Source
Diffusion Dryer
Charged Particle Remover
High Voltage Sources
Ammeter
Electrostatic Precipitator
Air
N2
O2
Ammeter
CO2 Differential Mobility Analyzer
Condensation Particle Counter
Condensation Particle Counter
Coal Combustor
Po-210 Radioactive Source
Electrostatic Precipitator
Coal Feeder
Mass Flow Controllers
High Voltage Sources
Sets II & IV
Sets I & III
Figure 1
CAPTURE CHARACTERISTICS IN THE ESP

Aerosol & Air Quality Research Lab (AAQRL)
Particle Diameter [nm]10 100
Char
ge F
ract
ion
0.0
0.1
0.2
0.3
0.4
0.5
Figure 2
CHARGED FRACTION OF COAL COMBUSTION PARTICLES
Fraction of +1 and -1 charged particles Legend: Air (-1), Air (+1), 20%O2-80%CO2 (-1), 20%O2-80%CO2 (+1), 50%O2-50%CO2 (-1), 50%O2-50%CO2 (+1). Equilibrium lines: Weidensohler, 1988. Solid Line (-1), Dashed Line (+1).
AIR 20%O2-80%CO2 50%O2-50%CO2
PARTICLE SIZE (nm)

Aerosol & Air Quality Research Lab (AAQRL) Applied Voltage [kV]
7.0 7.5 8.0 8.5 9.0 9.5 10.0
Cur
rent
[ µA
]
5
10
15
20
25
30
Figure 3a
AIR
50 O2-50 N2
N2
CO2
20 O2-80 CO2
50 O2 50 CO2
30 O2 70 CO2
CORONA INITIATION VOLTAGE (POSITIVE VOLTAGES) (LARGER WHEN CO2 CONCENTRATIONS ARE HIGHER
Suriyawong et al. / Fuel 87 (2008) 673–682

Aerosol & Air Quality Research Lab (AAQRL) Aerosol & Air Quality Research Lab (AAQRL)
( ( , , , )) ( , 1) ( , 1, , ) ( , ) ( , , , )
( , 1) ( , 1, , ) ( , ) ( , , , )
( , 1) ( , 1, , ) ( , ) ( , , , )
ion ion
ion ion
n v q x t v q N n v q x t v q N n v q x tt
v q N n v q x t v q N n v q x t
v q n v q x t v q n v q x t
β β
β β
α α
γ
+ + + +
− − − −
+ +
∂= − − −
∂+ + + −
+ − − −
+
2
,
0
( , 1) ( , 1, , ) ( , ) ( , , , ) ( , , , )
( , , , ) ( , ) ( , , , ) ( )( ) ( ) ( , , , )
1 ( ', ') ( ', , ,2
ext p
v s q s
s
v q n v q x t v q n v q x t n v q x t u
n v q x t u v q n v q x t v u u D v n v q x t
v v v n v s x t
γ
τ
β
+ +
∞−
=−∞
− − − − ∇ ⋅
− ∇ ⋅ + ∇ ⋅ ∇ ⋅ + ∇
+ −∑ ∫
,
0
) ( ', , , ) '
( , , , ) ( , ') ( ', , , ) 'q s
s
n v v q s x t dv
n v q x t v v n v s x t dvβ∞ ∞
=−∞
− −
− ∑ ∫
Comprehensive Charging Model: Apply to ESP 2
2 /
0
exp( ( ) / )( , )1 exp( ( ) / ) exp( ( / ) / )d
4
ion B
aion
B Bion
c U k Tv qcU k T U a y k T yD a
δ
πθ δ δβθ δδ
±±
±
±
−=
+ − ∫2
( , ) ( ( , ))mc
I av q K h v qhπα υυ
+ = − Φ
22 ( , ) 4( , ) exp( )
B
v q av q BTk T e
πγ + Φ= −
Attachment coefficient
Photoelectric yield coefficient
Thermionic yield coefficient
Spatio-temporal number concentration of particles with size (volume) v and q elementary charges at location and time t x
Jiang, Lee, Biswas: J. of Electrostatics,65, 209-220, 2007.

Aerosol & Air Quality Research Lab (AAQRL)
Particle Diameter [nm]6 7 8 9 20 30 40 50 60 70 80 90 20010 100
Pene
trat
ion
20
30
40
50
60708090
10
100
Figure 8
Condition 1 Condition 2
Condition 4
Condition 3
AIR
O2-CO2 (high ion concentration)
O2-CO2 (low ion concentration)
O2-CO2 (intermediate ion concentration)
PENETRATION AS A FUNCTION OF SIZE
Suriyawong, et al. Fuel, 673-682, 2008 Zhuang, Biswas:J. Electrostatics, 245-260,2000
UFPs are not Captured Efficiently in ESPs. Difficult to charge large fraction

Aerosol & Air Quality Research Lab (AAQRL)
SOFT X-RAY ENHANCED CORONA SYSTEM ENHANCES NANOMETER SIZE PARTICLE CAPTURE
Biswas P., Namiki N. & Kulkarni P. US Patent 6,861,036
Zhuang Y., Kim Y.J., Lee T.G., Biswas P.: "Experimental and Theoretical Studies of Ultra-Fine Particle Behavior in Electrostatic Precipitators", J. of Electrostatics, 48, 245-260, 2000.
Soft X-ray emitter
hν Photoemission of electrode surface
Discharge Electrode (DE) Collecting electrode of ESP
e hν
Unipolar ion atmosphere due to corona around DE
Diffusion charging
Particle
Free ion Bipolar ion atmosphere created by photoionization of gas molecules
hν
e Photoionization of particle
hν Particle
e
e
e e
SXC – ESP: ENHANCES NP CAPTURE

Aerosol & Air Quality Research Lab (AAQRL)
Time (min)
0 3 6 9 12 15 18 21 24 27 30
Parti
cle
num
ber c
once
ntra
tion
(#/c
m3 )
105
106
107 Average charge per particle (unit electron charge)
0.00
0.05
0.10
0.15
0.20
0.25
0.30
0.35
0.40
Vol
tage
,V=0
kV
X-r
ay O
FF
V=0
kV
X-r
ay O
NV=0 kVX-ray OFF
V=1
0 kV
X-r
ay O
FF
V=10 kVX-ray ON
V=0 kVX-ray OFF
V=10 kVX-ray OFF
SXC-ESP COLLECTION EFFICIENCY
Kulkarni P., Namiki N., Otani Y. and Biswas P.: "Charging of particles in unipolar coronas irradiated in-situ soft X-rays: Enhancement of Capture Efficiency of Ultrafine Particles", J. Aerosol Sci., 33 (9), 1279-1298, 2002.

Aerosol & Air Quality Research Lab (AAQRL) 22
Capture efficiency at different particle diameters from 10 –225nm (Q=10 lpm).
Particle Diameter [nm]20 30 40 50 60 70 80 90 20010 100
Cap
ture
Eff
icie
ncy
[-]
0.0
0.2
0.4
0.6
0.8
1.0
3kV, X-ray off 3kV, X-ray on 6kV, X-ray off 6 kV, X-ray on 8 kV, X-ray off 8 kV, X-ray on
Uncharged fraction
Corona + soft x-ray On
SXC OFF
SXC ON
Aerosol & Air Quality Research Lab (AAQRL) Aerosol & Air Quality Research Lab (AAQRL)
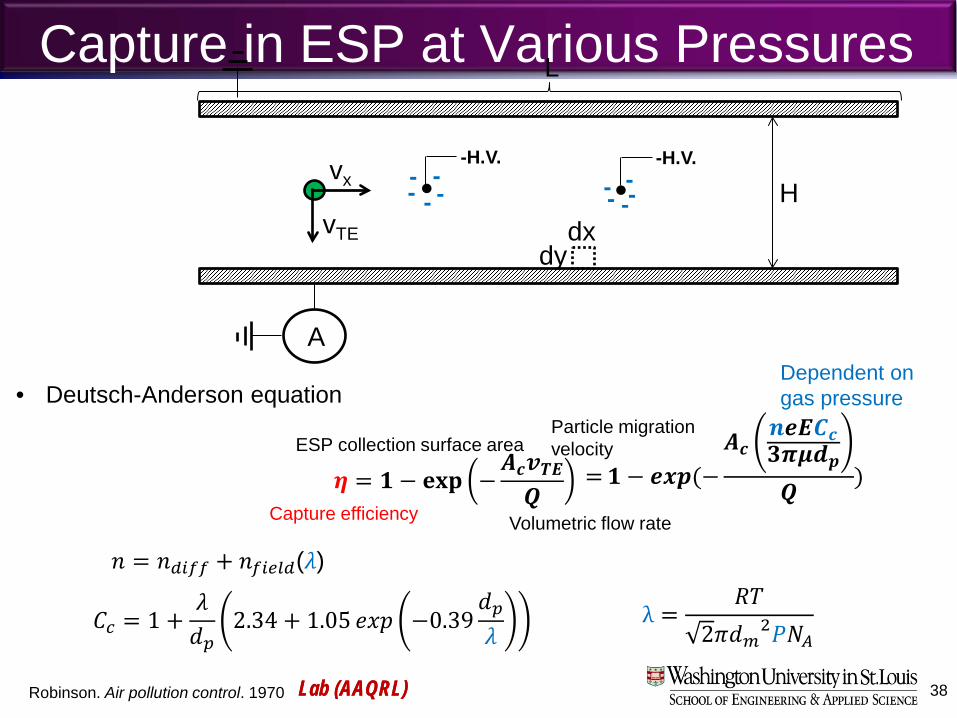
Capture in ESP at Various Pressures
-H.V. -H.V. - - - -
- - - - - -
38
A
vx
vTE dx dy
H
L
• Deutsch-Anderson equation
𝜼𝜼 = 𝟏𝟏 − 𝐞𝐞𝐞𝐞𝐞𝐞 −𝑨𝑨𝒄𝒄𝒗𝒗𝑻𝑻𝑻𝑻𝑸𝑸
Capture efficiency Volumetric flow rate
Particle migration velocity ESP collection surface area
𝐶𝐶𝑐𝑐 = 1 +𝜆𝜆𝑑𝑑𝑝𝑝
2.34 + 1.05 𝑒𝑒𝑒𝑒𝑒𝑒 −0.39𝑑𝑑𝑝𝑝𝜆𝜆
𝑛𝑛 = 𝑛𝑛𝑑𝑑𝑑𝑑𝑑𝑑𝑑𝑑 + 𝑛𝑛𝑑𝑑𝑑𝑑𝑓𝑓𝑓𝑓𝑑𝑑(𝜆𝜆)
λ =𝑅𝑅𝑅𝑅
2𝜋𝜋𝑑𝑑𝑚𝑚2𝑃𝑃𝑁𝑁𝐴𝐴
Dependent on gas pressure
=𝟏𝟏 − 𝒆𝒆𝒆𝒆𝒆𝒆(−𝑨𝑨𝒄𝒄
𝒏𝒏𝒆𝒆𝑻𝑻𝑪𝑪𝒄𝒄𝟑𝟑𝟑𝟑𝟑𝟑𝒅𝒅𝒆𝒆𝑸𝑸 )
Robinson. Air pollution control. 1970

Aerosol & Air Quality Research Lab (AAQRL) Aerosol & Air Quality Research Lab (AAQRL)
Fine Particle Capture in a Pressurized ESP
V-I Characteristics
1 atm
2 atm
3 atm
Application of pressurized ESP
Gas cleaning for • Pressurized combustion • Coal/biomass gasification
Benchtop pressurized ESP

Aerosol & Air Quality Research Lab (AAQRL) Aerosol & Air Quality Research Lab (AAQRL)
Fine Particle Capture in a Pressurized ESP
Current controlled
Voltage controlled
Challenging aerosols: NaCl Particles
Higher pressure Higher collection efficiency Due to combined effect of Slower particle migration and Higher filed intensity
Positive Voltage
Positive Voltage Negative Voltage
Negative Voltage
Higher pressure Lower collection efficiency Due to Lower ion concentration
1 atm
1 atm
1 atm
1 atm
2 atm 2 atm
2 atm 2 atm
3 atm 3 atm
3 atm
3 atm
Aerosol & Air Quality Research Lab (AAQRL) Aerosol & Air Quality Research Lab (AAQRL)
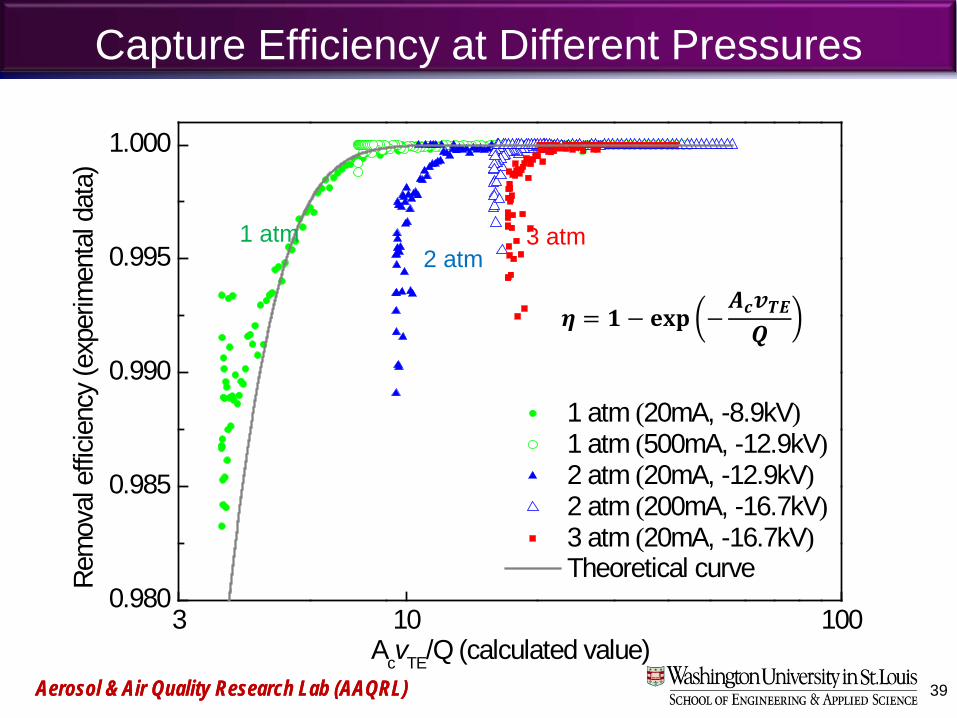
3 10 1000.980
0.985
0.990
0.995
1.000
1 atm (20mA, -8.9kV) 1 atm (500mA, -12.9kV) 2 atm (20mA, -12.9kV) 2 atm (200mA, -16.7kV) 3 atm (20mA, -16.7kV) Theoretical curve
Re
mov
al e
fficie
ncy
(exp
erim
enta
l dat
a)
AcvTE/Q (calculated value)
1 atm 2 atm
3 atm
39
𝜼𝜼 = 𝟏𝟏 − 𝐞𝐞𝐞𝐞𝐞𝐞 −𝑨𝑨𝒄𝒄𝒗𝒗𝑻𝑻𝑻𝑻𝑸𝑸
Capture Efficiency at Different Pressures

Aerosol & Air Quality Research Lab (AAQRL) Aerosol & Air Quality Research Lab (AAQRL)
3 10 1000.980
0.985
0.990
0.995
1.000
1 atm (20mA, -8.9kV) 1 atm (500mA, -12.9kV) 2 atm (20mA, -12.9kV) 2 atm (200mA, -16.7kV) 3 atm (20mA, -16.7kV) Theoretical curveRe
mov
al e
fficie
ncy
(exp
erim
enta
l dat
a)
(AcvTE/Q)modi (calculated values)40
Modified Capture Efficiency Equation
𝜼𝜼 = 𝟏𝟏 − 𝐞𝐞𝐞𝐞𝐞𝐞 −𝑨𝑨𝒄𝒄𝒗𝒗𝑻𝑻𝑻𝑻𝑸𝑸 × 𝒇𝒇 𝑷𝑷

Aerosol & Air Quality Research Lab (AAQRL)
SUMMARY • Detailed source and control technology studies for NP
are essential • New instrumentation enables detailed studies which will
help tackle potential NP problem (design new systems) • Timing for NP study due to changing energy source mix is
now • Coal combustion aerosols complex: cannot ignore organic
constituents (related to inorganic constituents) • Performance of ESP can be improved by using photo-
ionizer charging systems • Effect of pressure on charging NPs and capture efficiency
elucidated