nanoparticle-based test measures overall propensity for calci
TRANSCRIPT
CLINICAL RESEARCH www.jasn.org
Nanoparticle-Based Test Measures Overall Propensityfor Calcification in Serum
Andreas Pasch,*† Stefan Farese,*† Steffen Gräber,* Johanna Wald,‡ Walter Richtering,‡
Jürgen Floege,§ and Willi Jahnen-Dechent*
*Helmholtz Institute for Biomedical Engineering, Biointerface Laboratory, ‡Institute for Physical Chemistry, and§Department of Nephrology, Rheinisch-Westfälische Technische Hochschule (RWTH), Aachen, Germany; and†Department of Nephrology and Hypertension, University Hospital and University of Bern, Inselspital, Bern,Switzerland
ABSTRACTVascular and soft tissue calcification contributes to cardiovascular morbidity and mortality in both thegeneral population and CKD. Because calcium and phosphate serum concentrations are near supersatu-ration, the balance of inhibitors and promoters critically influences the development of calcification. Anassay that measures the overall propensity for calcification to occur in serum may have clinical use. Here,we describe a nanoparticle-based assay that detects, in the presence of artificially elevated calcium andphosphate concentrations, the spontaneous transformation of spherical colloidal primary calciproteinparticles (CPPs) to elongate crystalline secondary CPPs. We used characteristics of this transition to de-scribe the intrinsic capacity of serum to inhibit the precipitation of calcium andphosphate. Using this assay,we found that both the sera of mice deficient in fetuin-A, a serum protein that inhibits calcification, and thesera of patients on hemodialysis have reduced intrinsic properties to inhibit calcification. In summary, wedeveloped a nanoparticle-based test that measures the overall propensity for calcification in serum. Theclinical use of the test requires evaluation in a prospective study.
J Am Soc Nephrol 23: 1744–1752, 2012. doi: 10.1681/ASN.2012030240
Calcification is the final step of both physiologicand pathologic mineralization.1 Given that calciumand phosphate concentrations are close to super-saturation and therefore, metastable inmost tissuesand body fluids,2,3 calcification is imminentthroughout the body. Under physiologic condi-tions, however, calcium and phosphate only min-eralize in bones and teeth, whereas soft tissuenormally does not calcify. This indicates that bio-mineralization is a tightly regulated, site-specificprocess.1 Pathologic states perturbing this regula-tion lead to soft tissue and vascular calcifications,and the resulting cardiovascular diseases have be-come the leading cause of death and a major chal-lenge for healthcare systems worldwide.4,5
We and others have identified the serum proteinfetuin-A as a major systemic inhibitor of calcifica-tion.6–9 Together with additional blood components,fetuin-A prevents the supersaturated calcium andphosphate fromprecipitating by forming soluble col-loidal protein–mineral nanoparticles. Calcification
takes place when this humoral line of defense, in-herent in small molecules (particularly pyrophos-phate and magnesium) and proteins (particularlyfetuin-A and albumin), is overwhelmed. Accord-ingly, it has been shown that in the presence offetuin-A, calcium and phosphate, even under super-saturated conditions, do not directly precipitate ascrystalline hydroxyapatite [Ca10(PO4)6(OH)2]. In-stead, they form soluble colloidal particles, whichhave been termed calciprotein particles (CPPs).10,11
The initially formed primary CPPs spontaneously
Received March 7, 2012. Accepted June 28, 2012.
Published online ahead of print. Publication date available atwww.jasn.org.
Correspondence: Dr. Andreas Pasch, Department of Nephrol-ogy and Hypertension, University Hospital and University of Bern,Inselspital, 3010 Bern, Switzerland. Email: [email protected]
Copyright © 2012 by the American Society of Nephrology
1744 ISSN : 1046-6673/2310-1744 J Am Soc Nephrol 23: 1744–1752, 2012
convert to secondary CPPs in a transitional ripening step, whichtakes place in a timed and coordinatedmanner. This transition isassociated with a change in shape and an increase in particlediameter.11 We reasoned that this sequence of events might like-wise occur in complex biological fluids and that the character-istics of this step might reflect the intrinsic inhibitory capacityof a given fluid to prevent calcium and phosphate from precip-itating.We, therefore, sought to establish a reliable and clinicallyapplicable artificial test system capable of measuring this con-version step in serum, both in a reasonable number of samplesand within a reasonable time frame.
Here, we present a label-free 96-well plate-based assay,which measures the conversion of primary to secondary CPPsby detecting the time-resolved changes of laser light scattering(nephelometry) associatedwith it.Applying this assay,we showthe impact of various variables on its performance, characterizethe resulting particles, and provide data obtained with serafrom humans and fetuin-A–deficient mice.
RESULTS
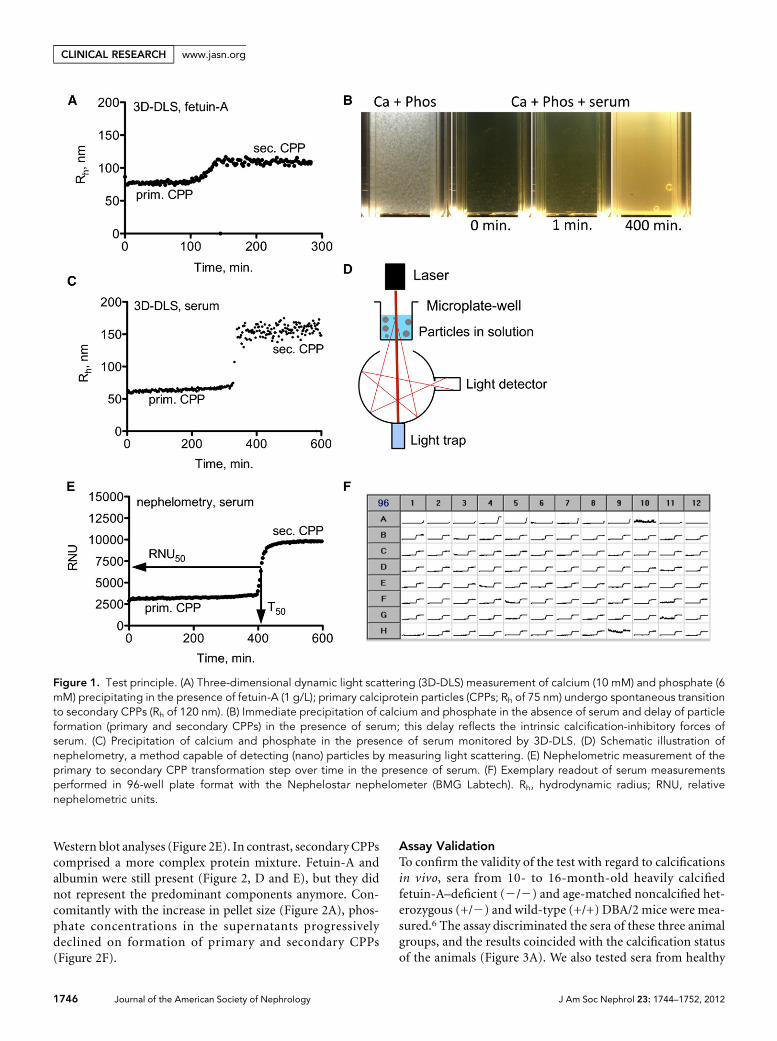
Test PrincipleUsing three-dimensional cross-correlation dynamic light scat-tering (3D-DLS), primary CPPs (hydrodynamic radius Rh ofabout 75 nm) and their spontaneous transformation to sec-ondary CPPs (Rh of about 120 nm) were studied in an artificialsolution containing fetuin-A, calcium, and phosphate(Figure 1A).10 When calcium and phosphate solutions weremixed in the absence of fetuin-A, a coarse whitish precipitateimmediately formed (Figure 1B). In contrast, when calciumand phosphate were mixed in the presence of serum, the ini-tially clear solution turned slightly turbid within about 1 min-ute, and it was distinctly more turbid after about 400 minutes(Figure 1B). Given these clearly visible changes, we reasonedthat this turbidity change might represent CPPs generated inthe presence of human serum similar to the CPP formationpreviously observed in fetuin-A–containing test solutions.
When applying 3D-DLS to serum-containing solutions, theresulting readout (Figure 1C) was indeed comparable with thereadout obtained with the artificial fetuin-A–containing solu-tion (Figure 1A). Primary CPPs (Rh of about 60 nm) under-went spontaneous conversion to secondary CPPs (Rh of about150 nm), albeit with more time lag than in simple fetuin-Asolutions. Given the different transition times, we deduced thatthe delay of the conversion step reflected the stabilityof primary CPPs and that measuring this step provides an es-timate of the calcification inhibitory potency inherent in se-rum.
Because 3D-DLS is not widely available and can measureonly a single sample at a time, we aimed to establish a morepractical and broadly applicable alternative assay for the det-ection of the transition step. Nephelometry is based on thesame principles as dynamic light scattering and quantifies theamount of laser light scatter in turbid solutions (Figure 1D).
Accordingly, the transition step was also detectable by time-resolved nephelometry (Figure 1E). We used an automatedlaser-based microplate nephelometer (Nephelostar; BMGLabtech) to analyze the primary to secondary CPP transforma-tion in serum in 96-well plates (Figure 1F).
To this end, we analyzed precipitation times in the pres-ence of different calcium and phosphate concentrations andthe presence or absence of albumin or serum (SupplementalFigure 1). Higher temperatures accelerated precipitation,whereas serum (Supplemental Figure 1, G–I) or albumin(Supplemental Figure 1, D–F) delayed precipitation. Otherthan temperature, precipitation strongly depended on pH(Supplemental Figure 2A).
Given the high precipitation variability under the initiallychosen conditions, the initially selected Tris buffer was exc-hanged for the less temperature-sensitive Hepes buffer (Sup-plemental Figure 2, B and C), and 10 mM calcium and 6 mMphosphate were chosen to achievemineral ion supersaturation(Supplemental Figure 3A).
Furthermore, the addition of 140 mM NaCl abolishedinstabilities of the assay attributable to ionic strength fluctua-tions (data not shown), the use of a high precision pipe-tting device minimized the influence of pipetting error(Supplemental Figure 3B), and pH adjustment by the add-ition of a fixed amount of 10 M NaOH solution instead ofindividual titrations minimized pH fluctuations (Supplemen-tal Figure 3C).
The optimized assay (Supplemental Figure 3D) contains80 ml serum in a total assay volume of 200 ml, and it isperformed at 37°C and pH 7.40 (measured at 37°C) (Supple-mental Figure 3E). To allow for void volume for spiking ex-periments, 20 ml 140 mM NaCl was routinely included intothe standard test (Supplemental Figure 3E). The solutionswere mixed in the following order: 20 ml saline, 80 ml serum,50 ml phosphate, and 50 ml calcium solution. Routine analysisof data (96 samples at 200 measurements per sample and3 minutes apart = 600 minutes per measurement run) wasperformed using Excel and GraphPad prism software to yieldnonlinear regression curves, allowing the determination of theone-half maximal transition time (T50) and the one-half max-imal relative nephelometric units (RNU50) (Figure 1E).
Characterization of ParticlesCentrifugation of the solutions shown in Figure 1B resulted inthe pellets shown in Figure 2A. Solutions containing primaryCPPs yielded a smooth and translucent pellet, whereas secon-dary CPPs yielded a coarse whitish pellet (Figure 2A). Scan-ning and transmission electron microscopy imaging showedspherical colloidal primary (Figure 2B) and elongate spindle-shaped crystalline secondary (Figure 2C) CPPs. The variabilityof primary CPP diameters contrasts the uniform diametersdetermined by 3D-DLS, and it is probably caused by the non-uniformmechanical disaggregation of pelleted primary CPPs.Primary CPPs mainly contain fetuin-A and albumin, whichwas shown by Coomassie blue protein stain (Figure 2D) and
J Am Soc Nephrol 23: 1744–1752, 2012 Serum Calcification Test 1745
www.jasn.org CLINICAL RESEARCH
Western blot analyses (Figure 2E). In contrast, secondary CPPscomprised a more complex protein mixture. Fetuin-A andalbumin were still present (Figure 2, D and E), but they didnot represent the predominant components anymore. Con-comitantly with the increase in pellet size (Figure 2A), phos-phate concentrations in the supernatants progressivelydeclined on formation of primary and secondary CPPs(Figure 2F).
Assay ValidationTo confirm the validity of the test with regard to calcificationsin vivo, sera from 10- to 16-month-old heavily calcifiedfetuin-A–deficient (2/2) and age-matched noncalcified het-erozygous (+/2) and wild-type (+/+) DBA/2 mice were mea-sured.6 The assay discriminated the sera of these three animalgroups, and the results coincided with the calcification statusof the animals (Figure 3A). We also tested sera from healthy
Figure 1. Test principle. (A) Three-dimensional dynamic light scattering (3D-DLS) measurement of calcium (10 mM) and phosphate (6mM) precipitating in the presence of fetuin-A (1 g/L); primary calciprotein particles (CPPs; Rh of 75 nm) undergo spontaneous transitionto secondary CPPs (Rh of 120 nm). (B) Immediate precipitation of calcium and phosphate in the absence of serum and delay of particleformation (primary and secondary CPPs) in the presence of serum; this delay reflects the intrinsic calcification-inhibitory forces ofserum. (C) Precipitation of calcium and phosphate in the presence of serum monitored by 3D-DLS. (D) Schematic illustration ofnephelometry, a method capable of detecting (nano) particles by measuring light scattering. (E) Nephelometric measurement of theprimary to secondary CPP transformation step over time in the presence of serum. (F) Exemplary readout of serum measurementsperformed in 96-well plate format with the Nephelostar nephelometer (BMG Labtech). Rh, hydrodynamic radius; RNU, relativenephelometric units.
1746 Journal of the American Society of Nephrology J Am Soc Nephrol 23: 1744–1752, 2012
CLINICAL RESEARCH www.jasn.org

volunteers and hemodialysis patients. Patients on hemodial-ysis are known to exhibit an increased risk for acceleratedvascular and soft tissue calcifications.12,13 Again, the test dis-criminated the calcification-prone from the noncalcification-prone individuals (i.e., the hemodialysis patients fromthe healthy volunteers [Figure 3B]), indicating that the testreflects calcification propensity in serum.
Influence of Calcification Inhibitorsand Promotors on Assay ResultsFetuin-A concentrations are known to belower in serum of hemodialysis patientsthan serum from healthy individuals.14We,therefore, tested the impact of serum-derived proteins and small molecules15,16
on the performance of the assay by spikingthe assay with fetuin-A, albumin, lyso-zyme, calcium, phosphate, or magnesium.An inhibitory effect was detectable onlywhen fetuin-Awas spiked into the samplesin the absence of serum (Figure 4A). Incontrast, all tested compounds had a pro-nounced effect when they were spikedinto the assay in the presence of serum(Figure 4B), with fetuin-A, albumin, and
magnesium exhibiting calcification-inhibitory propertiesand lysozyme, phosphate, and calcium exhibiting calcifica-tion-promoting properties. The effect of calcium was rela-tively weak. For direct comparison, the RNU50 and T50 valuesfrom Figure 4B were combined in Figure 4C.
Fetuin-A had intrinsic precipitation-inhibiting properties(Supplemental Figure 4A), whichwere augmented by albumin
Figure 2. Particle characterization. (A) Pellets after sharp centrifugation (16,0003g for 120 minutes at 20°C) of the solutions shown inFigure 1A. (B) Scattering electron microscopy (SEM) and transmission electron microscopy (TEM) of primary CPPs. (C) SEM and TEM ofsecondary CPPs. (D) Coomassie blue stain of protein contents of primary and secondary CPPs. (E) Albumin and fetuin-A Western blotsof primary and secondary CPPs. (F) Decrease of phosphate concentrations from supernatant solution on formation of primary andsecondary CPPs. Scale bars, 1 mm for SEM in B and C; 500 nm for TEM in B and C.
Figure 3. Serum measurements. (A) Nephelometry assay using sera from adult 10- to16-month-old noncalcifying wild-type DBA/2 mice (green), noncalcifying heterozygousfetuin-A+/2 knockout mice having half-normal serum fetuin-A (red), and heavily cal-cifying fetuin-A–deficient homozygous fetuin-A2/2 knockout mice (black). (B) Neph-elometry assay with sera from 20 hemodialysis patients (black) and 20 healthy vol-unteers (green).
J Am Soc Nephrol 23: 1744–1752, 2012 Serum Calcification Test 1747
www.jasn.org CLINICAL RESEARCH

(Supplemental Figure 4E). In contrast, albumin had no in-trinsic inhibitory effect (Supplemental Figure 4B), but the ad-dition of increasing amounts of fetuin-A to albumin againyielded a synergistic inhibitory effect in our test (Supplemen-tal Figure 4F). Serum fetuin-A concentrations of hemodialysispatients (Figure 3B) correlated well with the RNU50
(P,0.001) and T50 (P=0.04) values in our test (SupplementalFigure 5).
DISCUSSION
To the best of our knowledge, we presenthere the first potentially widely applicabletechnique with a reasonable throughputcapacity for measuring extraosseous calcifi-cation propensity. Our test increases super-saturation of serum by adding Ca (10 mM)andphosphate (6mM).The specific effect ofsupersaturation depends on the intrinsicconcentrations of fetuin-A, albumin, phos-phate, etc. in a given serum.As ageneral rule,the higher the calcium and phosphate su-persaturation, the lower the T50 value andthe higher the RNU50 value. This rule ap-plies to sera from hemodialysis patients andhealthy volunteers alike. RNU50 largely de-pends on the protein (fetuin-A or albumin)content of the CPPs with some contributionof phosphate. T50 largely depends on Mgand phosphate with some contribution offetuin-A and albumin. A low T50 is, there-fore, often associated with a high RNU50
and vice versa. A universal RNU50 to T50
ratio cannot, however, be determined, be-cause both variables depend on different—albeit overlapping—determinants.
When analyzing serum obtained fromfetuin-A–deficient mice or humans on he-modialysis, the test discriminates calcified(i.e., fetuin-A deficient) from noncalcifiedmice and calcification-prone (i.e., hemod-ialysis patients) from healthy individuals(Figure 3). These observations indicatethat the test indeed quantifies the inhibi-tory potency of calcification.
The test principle is based on the de-tection of a spontaneous transitional rip-ening step fromprimary to secondaryCPPsdetected by time-resolved nephelometry(Figure 5). The use of supraphysiologic cal-cium and phosphate concentrations atphysiologic temperature accelerates thisprocess. In contrast, when occurring inthe presence of lower calcium and phos-phate concentrations at room temperature,CPP formation progresses only over weeks
to months.8,9,17 Under the established conditions, the 96-wellformat along with a measurement time of 10 hours allows themeasurement of about 200 samples/d.
Calcium and phosphate readily assemble and form a crys-talline precipitate in the absence of proteins (Figure 1B). Thisprocess is delayed and proceeds in a stepwise fashion in thepresence of serum, a complex blend of proteins and smallmolecules (Figure 1, C and E). Here, as a first step, spherical
Figure 4. Impact of selected serum components on test readout. (A) Nephelometryassay in the absence of serum. Spiking with fetuin-A delayed the transition fromprimary to secondary CPPs. and decreased RNU. NaCl indicates a reference pre-cipitation curve without spiking. (B) Nephelometry assay in the presence of serum.Note that fetuin-A, albumin, and magnesium inhibited and lysozyme, phosphate,and calcium promoted precipitation. The red, nonspiked reference curve is thepooled serum from healthy volunteers. (C) Alternative presentation of T50 and RNU50
values taken from Figure 4B. Minerals mainly influence T50, whereas proteins in-fluence both T50 and RNU50. Quantities spiked in A and B: fetuin-A: 0.0625, 0.125,0.25, 0.375, and 0.5 g/L (normal serum concentration is about 0.5 g/L); albumin:3.125, 6.25, 12.5, 25, and 50 g/L (normal serum concentration is 35–52 g/L); lyso-zyme: 3.125, 6.25, 12.5, 25, and 50 g/L (normally not present in serum); Ca2+: 0.25,0.75, 1.0, 1.5, and 2.0 mmol/L (normal serum concentration is 2.1–2.55 mmol/L);PO4: 0.25, 0.75, 1.0, 1.5, and 2.0 mmol/L (normal serum concentration is 0.84–1.45mmol/L); Mg2+: 0.25, 0.5, and 0.75 mmol/L (normal serum concentration is 0.75–1.0mmol/L).
1748 Journal of the American Society of Nephrology J Am Soc Nephrol 23: 1744–1752, 2012
CLINICAL RESEARCH www.jasn.org
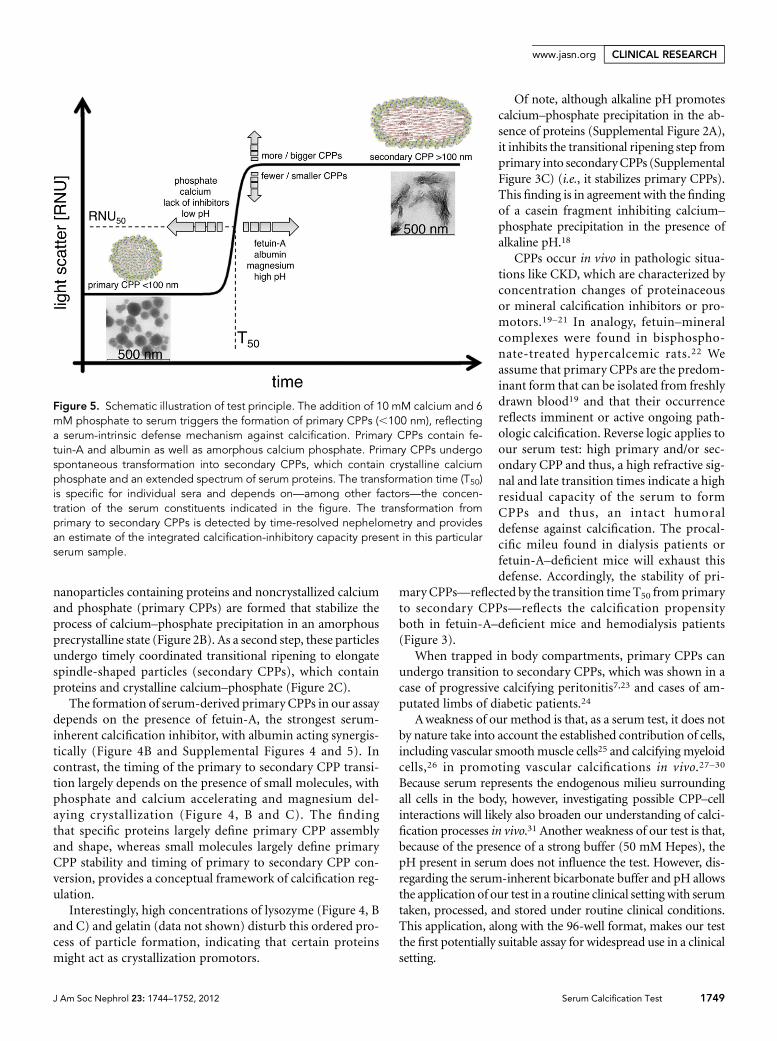
nanoparticles containing proteins and noncrystallized calciumand phosphate (primary CPPs) are formed that stabilize theprocess of calcium–phosphate precipitation in an amorphousprecrystalline state (Figure 2B). As a second step, these particlesundergo timely coordinated transitional ripening to elongatespindle-shaped particles (secondary CPPs), which containproteins and crystalline calcium–phosphate (Figure 2C).
The formation of serum-derived primary CPPs in our assaydepends on the presence of fetuin-A, the strongest serum-inherent calcification inhibitor, with albumin acting synergis-tically (Figure 4B and Supplemental Figures 4 and 5). Incontrast, the timing of the primary to secondary CPP transi-tion largely depends on the presence of small molecules, withphosphate and calcium accelerating and magnesium del-aying crystallization (Figure 4, B and C). The findingthat specific proteins largely define primary CPP assemblyand shape, whereas small molecules largely define primaryCPP stability and timing of primary to secondary CPP con-version, provides a conceptual framework of calcification reg-ulation.
Interestingly, high concentrations of lysozyme (Figure 4, Band C) and gelatin (data not shown) disturb this ordered pro-cess of particle formation, indicating that certain proteinsmight act as crystallization promotors.
Of note, although alkaline pH promotescalcium–phosphate precipitation in the ab-sence of proteins (Supplemental Figure 2A),it inhibits the transitional ripening step fromprimary into secondaryCPPs (SupplementalFigure 3C) (i.e., it stabilizes primary CPPs).This finding is in agreement with the findingof a casein fragment inhibiting calcium–
phosphate precipitation in the presence ofalkaline pH.18
CPPs occur in vivo in pathologic situa-tions like CKD, which are characterized byconcentration changes of proteinaceousor mineral calcification inhibitors or pro-motors.19–21 In analogy, fetuin–mineralcomplexes were found in bisphospho-nate-treated hypercalcemic rats.22 Weassume that primary CPPs are the predom-inant form that can be isolated from freshlydrawn blood19 and that their occurrencereflects imminent or active ongoing path-ologic calcification. Reverse logic applies toour serum test: high primary and/or sec-ondary CPP and thus, a high refractive sig-nal and late transition times indicate a highresidual capacity of the serum to formCPPs and thus, an intact humoraldefense against calcification. The procal-cific mileu found in dialysis patients orfetuin-A–deficient mice will exhaust thisdefense. Accordingly, the stability of pri-
mary CPPs—reflected by the transition time T50 from primaryto secondary CPPs—reflects the calcification propensityboth in fetuin-A–deficient mice and hemodialysis patients(Figure 3).
When trapped in body compartments, primary CPPs canundergo transition to secondary CPPs, which was shown in acase of progressive calcifying peritonitis7,23 and cases of am-putated limbs of diabetic patients.24
Aweakness of our method is that, as a serum test, it does notby nature take into account the established contribution of cells,including vascular smoothmuscle cells25 and calcifying myeloidcells,26 in promoting vascular calcifications in vivo.27–30
Because serum represents the endogenous milieu surroundingall cells in the body, however, investigating possible CPP–cellinteractions will likely also broaden our understanding of calci-fication processes in vivo.31 Another weakness of our test is that,because of the presence of a strong buffer (50 mM Hepes), thepH present in serum does not influence the test. However, dis-regarding the serum-inherent bicarbonate buffer and pH allowsthe application of our test in a routine clinical setting with serumtaken, processed, and stored under routine clinical conditions.This application, along with the 96-well format, makes our testthe first potentially suitable assay for widespread use in a clinicalsetting.
Figure 5. Schematic illustration of test principle. The addition of 10 mM calcium and 6mM phosphate to serum triggers the formation of primary CPPs (,100 nm), reflectinga serum-intrinsic defense mechanism against calcification. Primary CPPs contain fe-tuin-A and albumin as well as amorphous calcium phosphate. Primary CPPs undergospontaneous transformation into secondary CPPs, which contain crystalline calciumphosphate and an extended spectrum of serum proteins. The transformation time (T50)is specific for individual sera and depends on—among other factors—the concen-tration of the serum constituents indicated in the figure. The transformation fromprimary to secondary CPPs is detected by time-resolved nephelometry and providesan estimate of the integrated calcification-inhibitory capacity present in this particularserum sample.
J Am Soc Nephrol 23: 1744–1752, 2012 Serum Calcification Test 1749
www.jasn.org CLINICAL RESEARCH

In summary, we present a novel 96-well nephelometer-based assay, which measures calcification risk in serum. Giventhe relevance of calcifications for patient morbidity andmortality, it may be a useful tool for the investigation ofbiomineralization-related issues in both routine clinical use aswell as clinical and basic research.
CONCISE METHODS
Sampling and Preparation of Serum SamplesSerum samples from venous blood were obtained from 20 hemodi-
alysis patients and 20 healthy volunteers who had given written
consent. Mouse sera from 10- to 16-week-old DBA/2 fetuin-A–
deficient, heterozygous, and wild-type mice6 were prepared by car-
diac puncture at the time of sacrifice. All blood samples were clotted
at room temperature for 30 minutes and spun at 20003g for 10 mi-
nutes at room temperature to separate serum from blood cells. The
serum was frozen and stored at 270°C until further use. For the
measurements, samples were thawed at room temperature and
centrifuged at 10,0003g for 30 minutes at room temperature to
remove potential calcification nidi (cryoprecipitates).
Devices, Plastic Materials, and ChemicalsThe Nephelostar nephelometer was from BMG Labtech (Offenburg,
Germany), and theLiquidator96bench-toppipetting systemwas from
Mettler Toledo GmbH (Giessen, Germany); 96-well plates were from
Brand GmbH (Wertheim, Germany), and 96-well plastic covers were
from Carl Roth GmbH (Karlsruhe, Germany). All chemicals (NaCl,
Tris, Hepes, CaCl2, NaH2PO4,Na2HPO4, andNaOH)were purchased
from AppliChem (Darmstadt, Germany) in proanalysis-grade qual-
ity. Fetal calf fetuin-A and human albumin were purchased from
Sigma and Roth, respectively, and chicken egg white-derived lyso-
zyme was purchased from Applichem; after dissolving in 140 mM
NaCl, fetuin-A and lysozyme were dialyzed against a large volume of
140 mM NaCl to remove excess salt ions brought into the solutions
from the protein lyophilisates. Protein concentrations weremeasured
with the Pierce BCA Protein Assay Kit from Thermo Scientific, with
bovine serum albumin as a standard.
3D-DLSThe high particle density leads to a turbidity of the investigated
samples. This finding comes along with multiple scattering, which
prevents particle characterization by dynamic light scattering
methods. Hence, a 3D-DLS setup was used. Measurements were
performed using a standard light-scattering device (ALV GmbH,
Langen, Germany) with a He-Ne laser (632.8 nm, 25 mW, Type
LGTC 685-35, JDS Uniphase; KOHERAS GmbH), two avalanche
photodiodes (Type SPCM-AQR-13-FC; Perkin Elmer), and an ALV
7002 correlator. The scattered light was detected at 90° geometry.
Temperature control was ensured by using an external thermostat
equipped with a Pt-100 temperature sensor. The hydrodynamic
radius Rh was calculated from second-order cumulant fits by the
Stokes–Einstein equation. Measurements were performed in
2-minute intervals.
Nephelometer AssayStock solution 1 was NaCl solution: 140 mM NaCl. Stock solution 2
was calcium solution: 40 mM CaCl2+100 mMHepes+140 mMNaCl
pH-adjusted with 10 M NaOH to 7.40 at 37°C. Stock solution 3 was
phosphate solution: 19.44 mM Na2HPO4+4.56 mM NaH2PO4+100
mM Hepes+140 mM NaCl pH-adjusted with 10 M NaOH to 7.40 at
37°C. For preparation of 96-well plates, all solutions were prewarmed
to 34.5°C in a thermoconstant room, where all pipetting steps were
performed with the Liquidator96 bench-top pipetting system
using a set of new pipetting tips for every pipetting step. These pipet-
ting steps were performed in the following order: (1) NaCl solution:
20 ml/well, (2) serum: 80 ml/well, (3) shaking for 1 minute, (4) phos-
phate solution: 50 ml/well, (5) shaking for 1 minute, and (6) calcium
solution: 50ml/well and shaking for 1minute. Air bubbles in the wells
were disintegratedwith a pocket lighter, and the 96wells were covered
with a ThinSeal adhesive sealing film for microplates. Because line A
of the 96-well plate often showed unreliable results, it was generally
not used (compare with Figure 1F). Assay conditions and Nephelos-
tar settings were measurement in a thermoconstant room at 34.5°C
with the internal radiation of the Nephelostar device turned off. This
led to an internal measurement temperature of 36.5°C to 37°C. The
Nephelostar was operated and controlled through the Nephelostar
provider’s Galaxy software on a Windows computer platform. The
assay was performed for 200 cycles with 1.5-seconds measurement
time per well and a position delay of 0.1 seconds in horizontal plate
reading mode, adding up to a cycle time of 180 seconds per cycle for
our standard assay. This assay adds up to a total assay run time of
10 hours per assay. For some measurements, the cycle time was ex-
tended to 360 or 540 seconds, which adds up to assay times of 20 and
30 hours, respectively. The gain and laser adjustment was set at 90%
required value, gain 50 with a laser beam focus of 1.5 mm, and laser
intensity of 50%. After completion of the run, data were transferred
to Excel and transposed from lines into columns. Data columns were
copied into the GraphPad Prism program to generate an XY graph.
Data were then processed by calculating nonlinear regression in the
log(agonist) vs. response–variable slope (four parameters) mode us-
ing the robust fit fitting method. The resulting values obtained for T50
and RNU50 were further processed as required.
Protein Detection and Quantification MethodsFor quantification of proteins in solutions, the Pierce BCA Protein
Assay Kit was used according to the manufacturer’s instructions. BSA
(2 mg/ml; Pierce) was used as a standard. Western blots were per-
formed according to standard protocols with SDS-PAGE (4%–12%),
with 1 mg protein or 0.4 mg pure fetuin-A or albumin loaded per lane.
The following primary antibodies against fetuin-A and albumin were
used: polyclonal rabbit anti-human fetuin-A antiserum 5359
(H. Haupt, Bering) and mouse anti-human albumin (1:2500, catalog
number 0300–0080; AbD Serotec). For fluorescence detection, the
following horseradish peroxidase-coupled secondary antibodies were
used: swine anti-rabbit IgG (1:5000, catalog number P0217; Dako) and
rabbit anti-mouse IgG (1:2000, catalog number P0260; Dako). Protein
stains were performedwith the Imperial Protein Stain according to the
manufacturer’s instructions (Thermo Scientific); 6.0 mg total protein
or 2.5 mg pure fetuin-A or albumin was loaded per lane.
1750 Journal of the American Society of Nephrology J Am Soc Nephrol 23: 1744–1752, 2012
CLINICAL RESEARCH www.jasn.org

Electron MicroscopyPrimary and secondary CPPs were prepared at room temperature as
described in Nephelometer Assay.
For transmission electronmicroscopy, 10ml samples were applied
onto Formvar (polyvinyl formal) -coated nickel grids (Plano,Wetzlar,
Germany). The grids were dried at room temperature, and the CPPs
were visualized without staining. For scanning electron microscopy,
10-ml samples were applied onto slides, dried at room temperature,
coated with gold (7 nm), and visualized using a Philips XL.
ACKNOWLEDGMENTS
A.P. was supported by a personal grant from the European Renal
Association—European Dialysis and Transplantation Association.
Parts of this project were supported by the excellence initiative of the
German federal and state governments.
DISCLOSURESNone.
REFERENCES
1. Jahnen-DechentW, Heiss A, Schäfer C, Ketteler M: Fetuin-A regulationof calcified matrix metabolism. Circ Res 108: 1494–1509, 2011
2. Sandin K, Hegbrant J, Kloo L: A theoretical investigation of the super-saturation of basic calcium phosphate in serum of dialysis patients.J Appl Biomater Biomech 4: 80–86, 2006
3. Thurgood LA, Ryall RL: Proteomic analysis of proteins selectivelyassociated with hydroxyapatite, brushite, and uric acid crystals pre-cipitated from human urine. J Proteome Res 9: 5402–5412, 2010
4. Yusuf S, Reddy S, Ounpuu S, Anand S: Global burden of cardiovasculardiseases: Part I: General considerations, the epidemiologic transition,risk factors, and impact of urbanization. Circulation 104: 2746–2753,2001
5. Blacher J, Guerin AP, Pannier B, Marchais SJ, London GM: Arterialcalcifications, arterial stiffness, and cardiovascular risk in end-stagerenal disease. Hypertension 38: 938–942, 2001
6. Schafer C, Heiss A, Schwarz A, Westenfeld R, Ketteler M, Floege J,Muller-Esterl W, Schinke T, Jahnen-Dechent W: The serum proteinalpha 2-Heremans-Schmid glycoprotein/fetuin-A is a systemicallyacting inhibitor of ectopic calcification. J Clin Invest 112: 357–366,2003
7. Heiss A, Eckert T, Aretz A, Richtering W, van Dorp W, Schäfer C,Jahnen-Dechent W: Hierarchical role of fetuin-A and acidic serumproteins in the formation and stabilization of calcium phosphateparticles. J Biol Chem 283: 14815–14825, 2008
8. Young JD, Martel J, Young D, Young A, Hung CM, Young L, Chao YJ,Young J, Wu CY: Characterization of granulations of calcium andapatite in serum as pleomorphic mineralo-protein complexes and asprecursors of putative nanobacteria. PLoS One 4: e5421, 2009
9. Young JD, Martel J, Young L, Wu CY, Young A, Young D: Putativenanobacteria represent physiological remnants and culture by-productsof normal calcium homeostasis. PLoS One 4: e4417, 2009
10. Heiss A, DuChesne A, Denecke B, Grötzinger J, Yamamoto K, Renné T,Jahnen-Dechent W: Structural basis of calcification inhibition by alpha2-HS glycoprotein/fetuin-A. Formation of colloidal calciprotein particles.J Biol Chem 278: 13333–13341, 2003
11. Wald J, Wiese S, Eckert T, Jahnen-Dechent W, Richtering W, Heiss A:Formation and stability kinetics of calcium phosphate–fetuin-A colloi-dal particles probed by time-resolved dynamic light scattering. SoftMatter 7: 2869–2874, 2011
12. GoodmanWG,Goldin J, Kuizon BD, Yoon C, Gales B, Sider D,Wang Y,Chung J, Emerick A,Greaser L, Elashoff RM, Salusky IB: Coronary-arterycalcification in young adults with end-stage renal disease who areundergoing dialysis. N Engl J Med 342: 1478–1483, 2000
13. Oh J, Wunsch R, Turzer M, Bahner M, Raggi P, Querfeld U, Mehls O,Schaefer F: Advanced coronary and carotid arteriopathy in youngadults with childhood-onset chronic renal failure.Circulation 106: 100–105, 2002
14. Ketteler M, Bongartz P, Westenfeld R, Wildberger JE, Mahnken AH,Böhm R, Metzger T, Wanner C, Jahnen-Dechent W, Floege J: Associ-ation of low fetuin-A (AHSG) concentrations in serum with cardiovas-cular mortality in patients on dialysis: A cross-sectional study. Lancet361: 827–833, 2003
15. Wilson JW, Werness PG, Smith LH: Inhibitors of crystal growth ofhydroxyapatite: A constant composition approach. J Urol 134: 1255–1258, 1985
16. Schlieper G, Westenfeld R, Brandenburg V, Ketteler M: Inhibitors ofcalcification in blood and urine. Semin Dial 20: 113–121, 2007
17. Wu CY, Martel J, Young D, Young JD: Fetuin-A/albumin-mineralcomplexes resembling serum calcium granules and putative nano-bacteria: Demonstration of a dual inhibition-seeding concept. PLoSOne 4: e8058, 2009
18. Reeves RE, Latour NG: Calcium phosphate sequestering phospho-peptide from casein. Science 128: 472, 1958
19. Fraikin JL, Teesalu T, McKenney CM, Ruoslahti E, Cleland AN: A high-throughput label-free nanoparticle analyser. Nat Nanotechnol 6: 308–313, 2011
20. Smith ER, Ford ML, Tomlinson LA, Rajkumar C, McMahon LP, Holt SG:Phosphorylated fetuin-A-containing calciprotein particles are associ-ated with aortic stiffness and a procalcific milieu in patients with pre-dialysis CKD. Nephrol Dial Transplant 27: 1957–1966, 2012
21. Hamano T,Matsui I, Mikami S, Tomida K, Fujii N, Imai E, Rakugi H, IsakaY: Fetuin-mineral complex reflects extraosseous calcification stress inCKD. J Am Soc Nephrol 21: 1998–2007, 2010
22. Price PA, Nguyen TM, Williamson MK: Biochemical characterization ofthe serum fetuin-mineral complex. J Biol Chem 278: 22153–22160,2003
23. Olde Loohuis KM, Jahnen-Dechent W, van Dorp W: The case: Milkyascites is not always chylous. Kidney Int 77: 77–78, 2010
24. Ghadially FN: As you like it, Part 3: A critique and historical review ofcalcification as seen with the electron microscope. Ultrastruct Pathol25: 243–267, 2001
25. Byon CH, Sun Y, Chen J, Yuan K, Mao X, Heath JM, Anderson PG,Tintut Y, Demer LL, Wang D, Chen Y: Runx2-upregulated receptoractivator of nuclear factor kB ligand in calcifying smooth muscle cellspromotes migration and osteoclastic differentiation of macrophages.Arterioscler Thromb Vasc Biol 31: 1387–1396, 2011
26. Fadini GP, Albiero M, Menegazzo L, Boscaro E, Vigili de KreutzenbergS, Agostini C, Cabrelle A, Binotto G, Rattazzi M, Bertacco E, BertorelleR, Biasini L, Mion M, Plebani M, Ceolotto G, Angelini A, Castellani C,Menegolo M, Grego F, Dimmeler S, Seeger F, Zeiher A, Tiengo A,Avogaro A: Widespread increase in myeloid calcifying cells contrib-utes to ectopic vascular calcification in type 2 diabetes. Circ Res 108:1112–1121, 2011
27. Reynolds JL, Skepper JN, McNair R, Kasama T, Gupta K,Weissberg PL,Jahnen-Dechent W, Shanahan CM: Multifunctional roles for serumprotein fetuin-a in inhibition of human vascular smooth muscle cellcalcification. J Am Soc Nephrol 16: 2920–2930, 2005
28. Reynolds JL, Joannides AJ, Skepper JN, McNair R, Schurgers LJ,Proudfoot D, Jahnen-DechentW,Weissberg PL, ShanahanCM:Humanvascular smooth muscle cells undergo vesicle-mediated calcification in
J Am Soc Nephrol 23: 1744–1752, 2012 Serum Calcification Test 1751
www.jasn.org CLINICAL RESEARCH

response to changes in extracellular calcium and phosphate concen-trations: A potential mechanism for accelerated vascular calcification inESRD. J Am Soc Nephrol 15: 2857–2867, 2004
29. Speer MY, Yang HY, Brabb T, Leaf E, Look A, Lin WL, Frutkin A, Dichek D,Giachelli CM: Smooth muscle cells give rise to osteochondrogenic pre-cursors and chondrocytes in calcifying arteries.Circ Res 104: 733–741, 2009
30. Pasch A, Schaffner T, Huynh-Do U, Frey BM, Frey FJ, Farese S:Sodium thiosulfate prevents vascular calcifications in uremic rats.Kidney Int 74: 1444–1453, 2008
31. Chen NX, O’Neill KD, Chen X, Duan D, Wang E, Sturek MS, EdwardsJM,Moe SM: Fetuin-A uptake in bovine vascular smooth muscle cells iscalcium dependent and mediated by annexins. Am J Physiol RenalPhysiol 292: F599–F606, 2007
This article contains supplemental material online at http://jasn.asnjournals.org/lookup/suppl/doi:10.1681/ASN.2012030240/-/DCSupplemental.
1752 Journal of the American Society of Nephrology J Am Soc Nephrol 23: 1744–1752, 2012
CLINICAL RESEARCH www.jasn.org