nano vna your antenna stethoscope k3eui barry
TRANSCRIPT

Nano VNA – Your Antenna Stethoscope k3eui Barry
What can you conclude about the health of your heart with a stethoscope?
What can you conclude about the health of your
antenna with a Nano VNA?
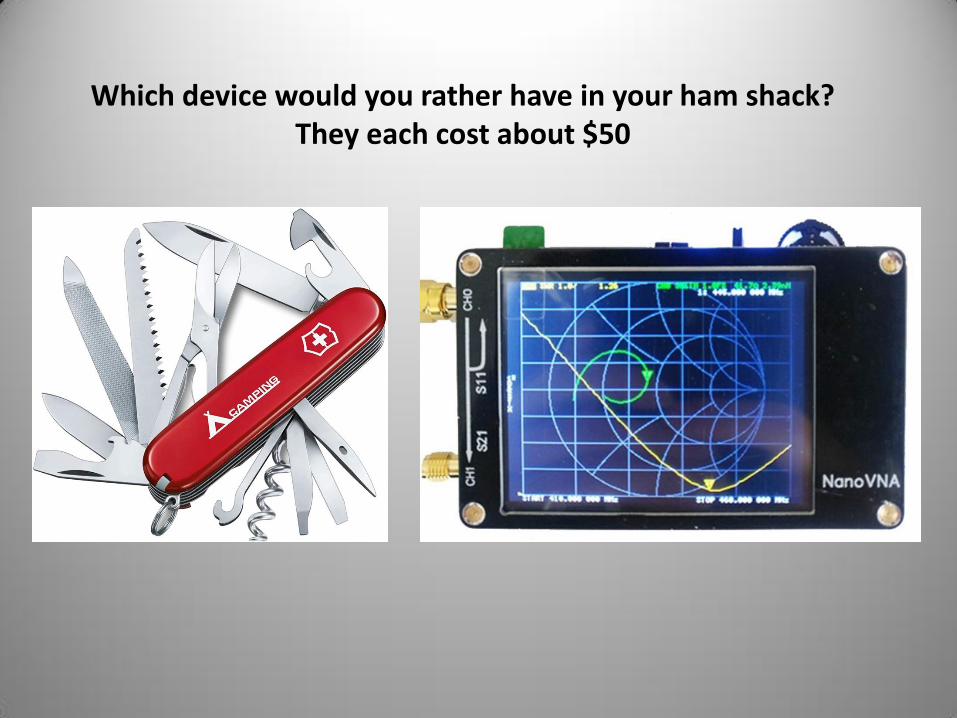
Which device would you rather have in your ham shack? They each cost about $50
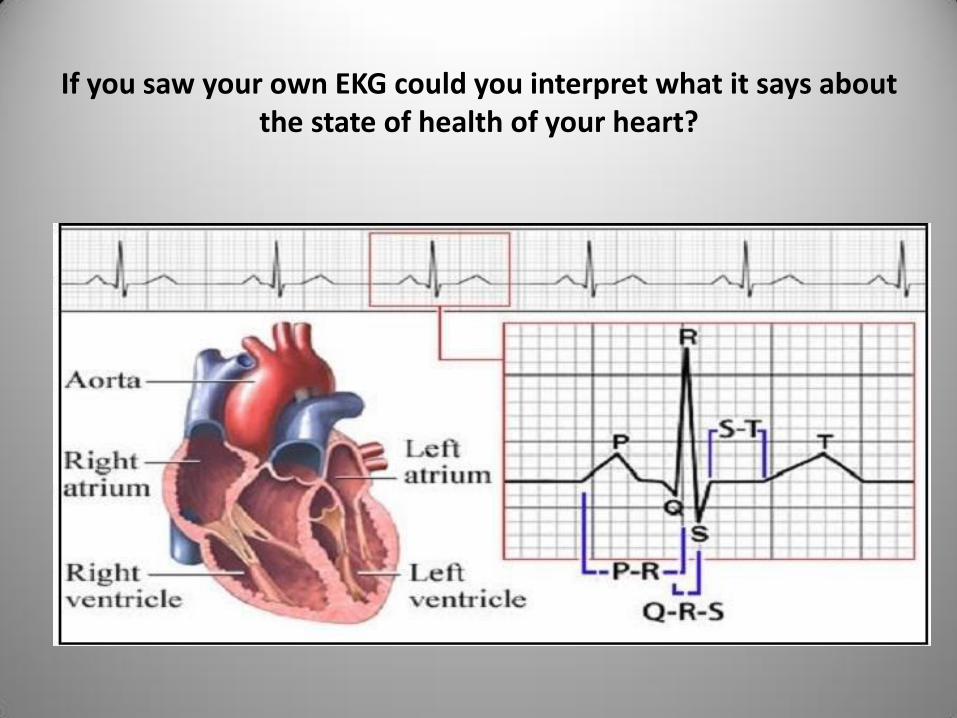
If you saw your own EKG could you interpret what it says about the state of health of your heart?

If you saw this Smith Chart of your 80m antenna would you know how to interpret it correctly?

Would you know what this PHASE graph is revealing about the antenna’s resonance?

On this Resistance (BLUE) and Reactance (RED) graph On what frequency would you expect this antenna to work best?

Goals of this presentation
Learn why a Nano VNA can be a
useful tool in your toolbox

How is a VNA like an active SONAR?

The VNA sends a pulse of RF out on a feedline and measures the V(forward) and V(reflected)
at various frequencies (both magnitude and phase)

Flow Chart: Vector Network Analyzer

The “high-end” Vector Network Analyzers

Can you afford this beauty? 10 MHz to 20 GHz Four ports and 9 graphs in color

Some practical uses for a VNA
Check out bandpass and band stop filters
Check out long lines of coax for attenuation
Check out your antenna system

Check out the bandpass of a “low-pass” filter using BOTH ports of the VNA
Drake: 52 ohm, 80 dB attenuation above 41 MHz

Under the Hood of the Low-Pass filter

Low-pass filter - to attenuate “harmonics” above 30 MHz to avoid TVI in VHF/UHF bands
(television interference)

Measure Cable Length and Attenuation
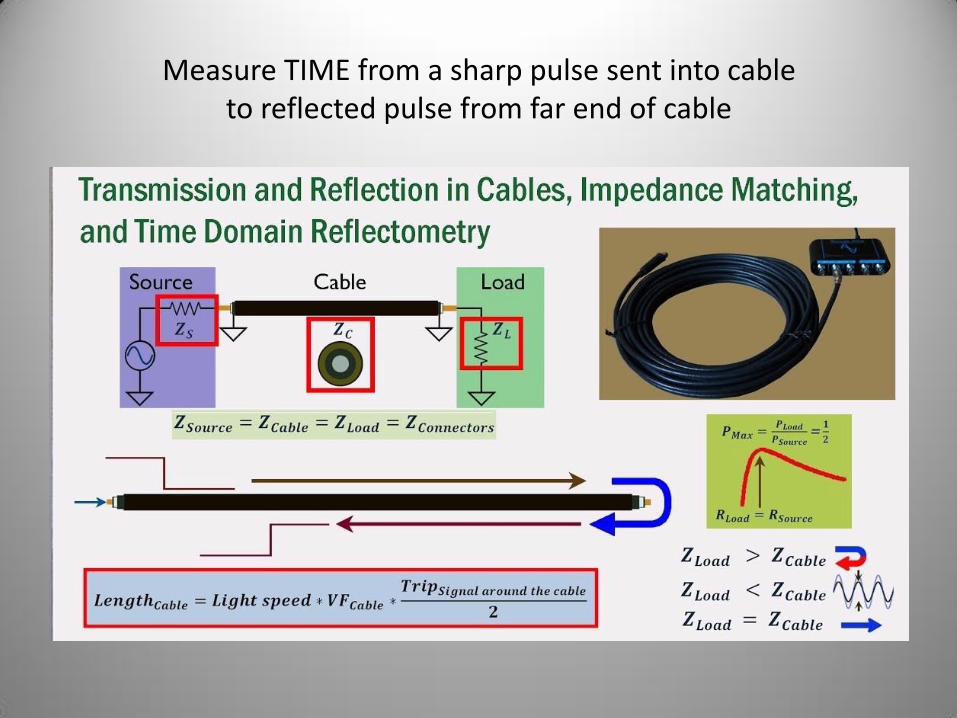
Measure TIME from a sharp pulse sent into cable to reflected pulse from far end of cable

TDR display: Belden RG8X cable (VF = 0.82) Determine coax LENGTH from time and check for breaks in cable

Measure the attenuation (dB loss) of the cable from 0.1 to 100 MHz as a “sweep” graph note: -3 dB (50% power loss) at 50 MHz

Two or Three band TRAP dipole Check how well TRAPS are isolating different bands

Traps act as HIGH-IMPEDANCE parallel resonant LC circuit to isolate two bands in one antenna
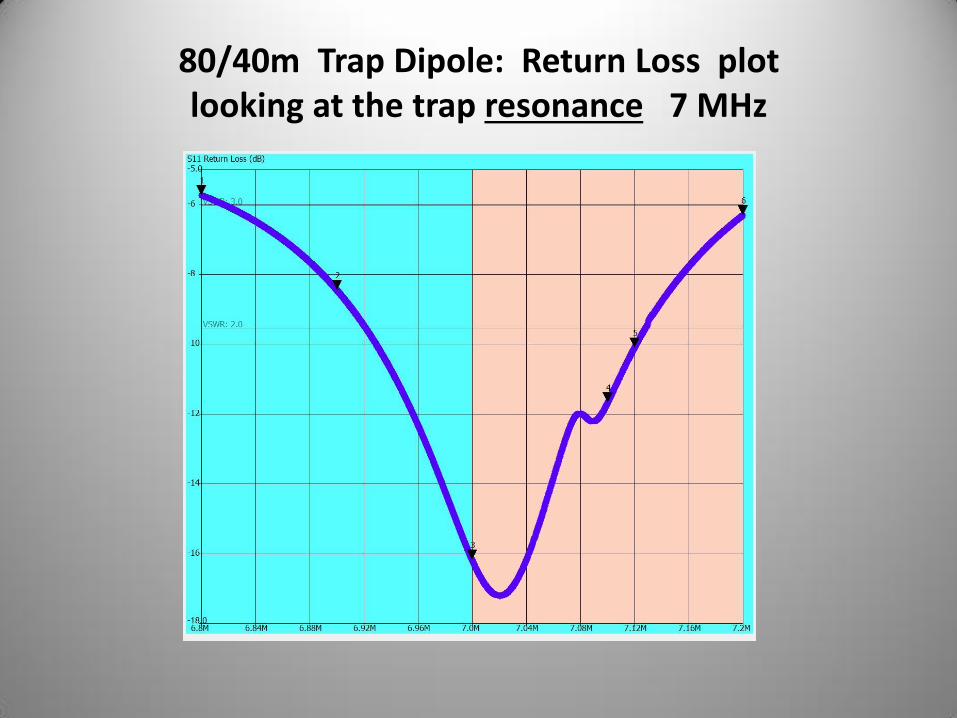
80/40m Trap Dipole: Return Loss plot looking at the trap resonance 7 MHz

This is designed as a “dual-band” 80/40m dipole Resonance (SWR) check on both 80m and 40m

What instruments can we use to analyze our antennas?

Antenna Analyzers come in various sizes, shapes, displays, and COST

RF POWER and SWR meters What do they share in common?
What do they NOT measure?

Why would I want a VNA to analyze my antenna?

Enter the Nano VNA instrument USB connectivity

Antenna Characteristics that a VNA can measure or calculate
Resistance R (ohms)
Reactance X (ohms)
Impedance Z (ohms)
Phase θ (degrees)
Reflection Coefficient (ρ)
RETURN LOSS (dB)
SWR
Smith Chart

Two “ports”: Ch 0 and Ch 1 4 traces in 4 colors, touch screen

Measurement limit of 101 data points internal battery for field work
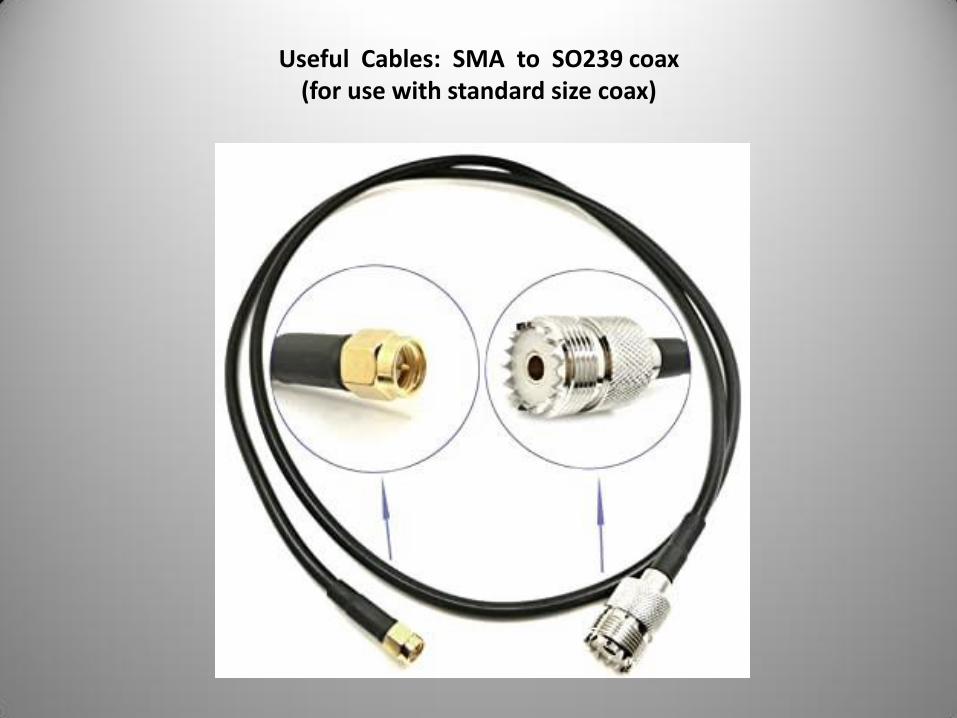
Useful Cables: SMA to SO239 coax (for use with standard size coax)

Nano VNA Saver software much easier to use by computer control

Important Parameter Definitions
Reflection coefficient = V (reflected) / V (forward)
Γ (gamma) = a complex number
absolute value |gamma| = ρ (rho)
0 < ρ < 1
RETURN LOSS (dB) = - 20 log (ρ) usually written as a positive number since log (ρ) is <0
SWR = ( 1 + ρ ) / ( 1 – ρ ) = V(max) / V (min)

REFLECTION Parameters (Agilent Tech great resource)


USB connections to computer and battery charger

Computer Control Settings
Com Port select
Frequency Range Select Markers
Sweep resolution ENHANCED
Additional CAL points SAVE and RETRIEVE files Display setup of GRAPHS

Choose Graphs to display (up to 6) Colors, etc.

Do a calibration first Calibration “assistant”
take min of 101 readings
SHORT OPEN LOAD
THROUGH two ports ISOLATION two ports
SAVE CAL files
You can use up to 5000
data points to plot

First Step: CALIBRATE VNA over a frequency range (MHz) Calibration standards included as SMA connectors
Short, Open, Load (50-ohm), and Through
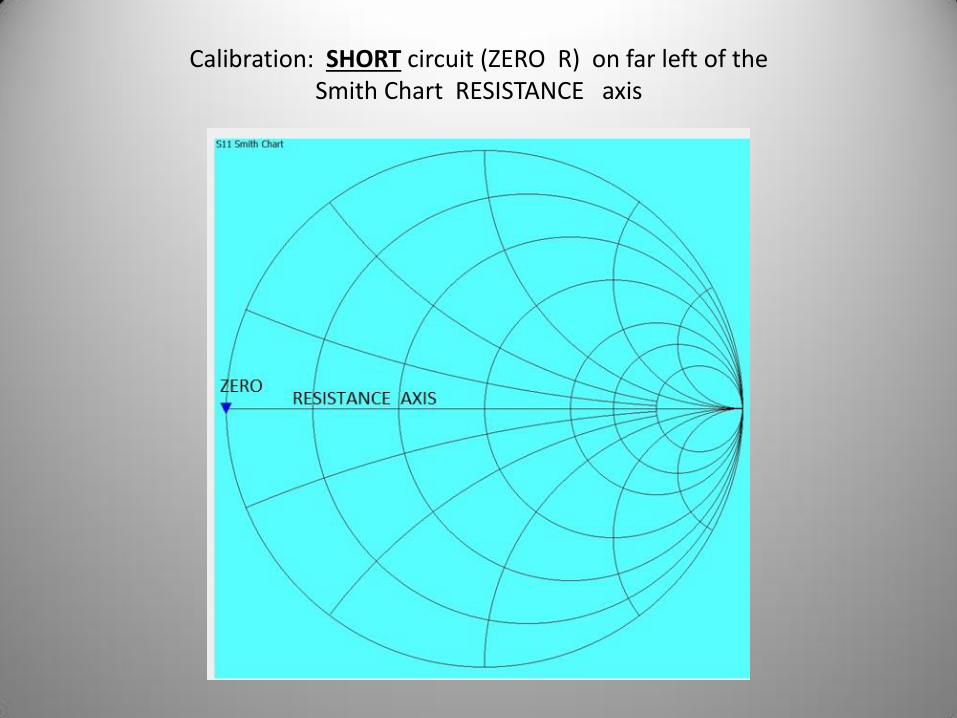
Calibration: SHORT circuit (ZERO R) on far left of the Smith Chart RESISTANCE axis

Calibration: OPEN circuit (infinite R) on far right of the RESISTANCE axis

Calibration: 50-ohm LOAD (prime center) middle of the RESISTANCE scale: normalized to 1.0

You can also CALIBRATE the device on its own (small) screen: limit of 101 data points
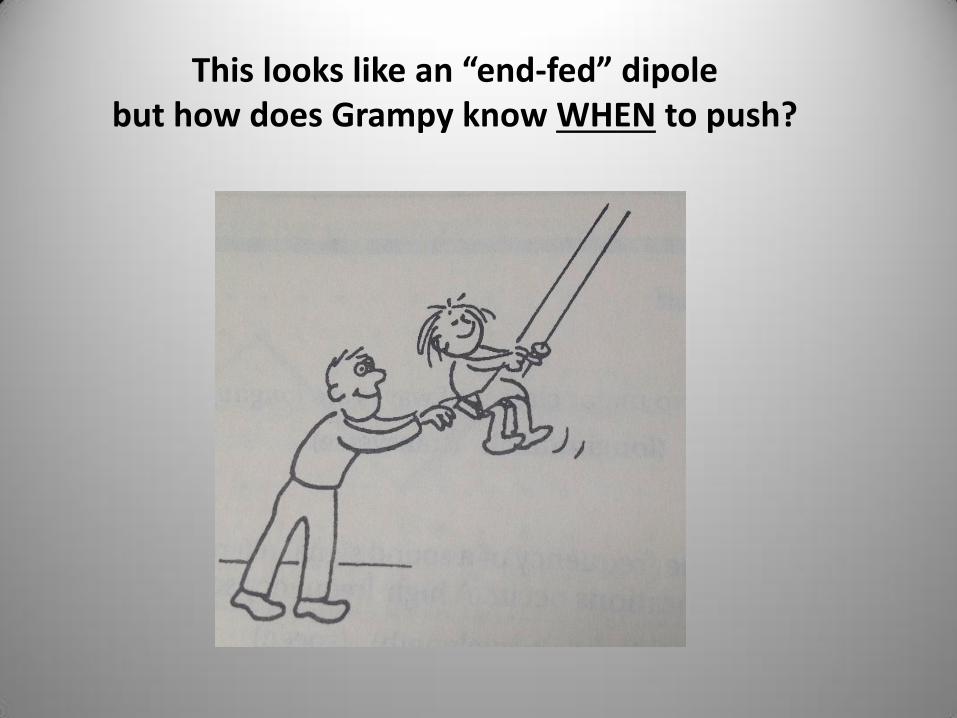
This looks like an “end-fed” dipole but how does Grampy know WHEN to push?

Even young kids know this
“Grampy, please push in-phase with my natural swinging to increase my amplitude”

Antennas work the same way
The input “push” from the feed line needs to be
in-phase with the natural vibrations of current in the antenna conductors
We call this “resonance”
Can the Nano VNA determine resonance frequencies?

What happens if Grampy pushes too soon? too late?
These will make grandchild quite unhappy!

At resonance the current and the voltage are IN-PHASE at the feed line connection
and maximum current occurs in the antenna

• Below resonance: the dipole is too short and the current leads the driving voltage (capacitive reactance)
• Above resonance: the dipole is too long, and the current lags the driving voltage (inductive reactance)
ELI the ICE man L = inductance C = capacitance
I = current E = voltage (emf)

Off resonance a dipole now shows REACTANCE (phase errors)
and behaves like a series RLC circuit

Resonance will make your grandkids happy so CANCEL that antenna REACTANCE

How can my antenna analyzer tell me if my antenna is “resonant” ?

If SWR meter at feedline/antenna junction reads 2:1 What will SWR meter 2 read closer to shack?

REALLY important concept
We are measuring the FORWARD and REFLECTED voltages recorded by the VNA in the shack and NOT AT THE ANTENNA So what?

Feed Line alters impedance measured at different locations from antenna
As you change the LENGTH of feed line
The magnitude of voltage and current changes
The impedance (R and X) changes
The PHASE changes
But
The SWR does not change
(other than small attenuation changes)

The measured RESISTANCE, REACTANCE, IMPEDANCE and RESONANT FREQUENCY of the antenna system will not be the same in the shack and at the antenna …. UNLESS
the feed line is ½ λ or an integer multiple of ½ λ
or the antenna and feed line are a perfect 1:1 match with zero attenuation

HOWEVER assuming very low-loss feed line
and that the shield is not part of the antenna
The REFLECTION COEFFICIENT, RETURN LOSS, and the measured SWR will be (almost) the same value in the shack and at the antenna itself, regardless of the length of feed line.
The SWR does not change
with a small change in feed line length

If we are clever
we can take measurements with the VNA
in the shack
And calculate what these measurements
would be if taken at the antenna

10 meter Vertical: 100 ft RG213 50-ohm feed line Smith Chart and SWR measured in shack

10 meter Vertical with 6 feet extra 50-ohm coax (1/4 wave) Smith Chart has “rotated” 180 degrees (different impedance)
but SWR of each marker has not changed

Resistance R and Reactance X changes with feed line LENGTH Values ROTATE 180 degrees with every ¼ wave feed line
But SWR (distance to Bull’s Eye) remains constant

Take a deep breath We are now entering into the
SMITH CHART realm
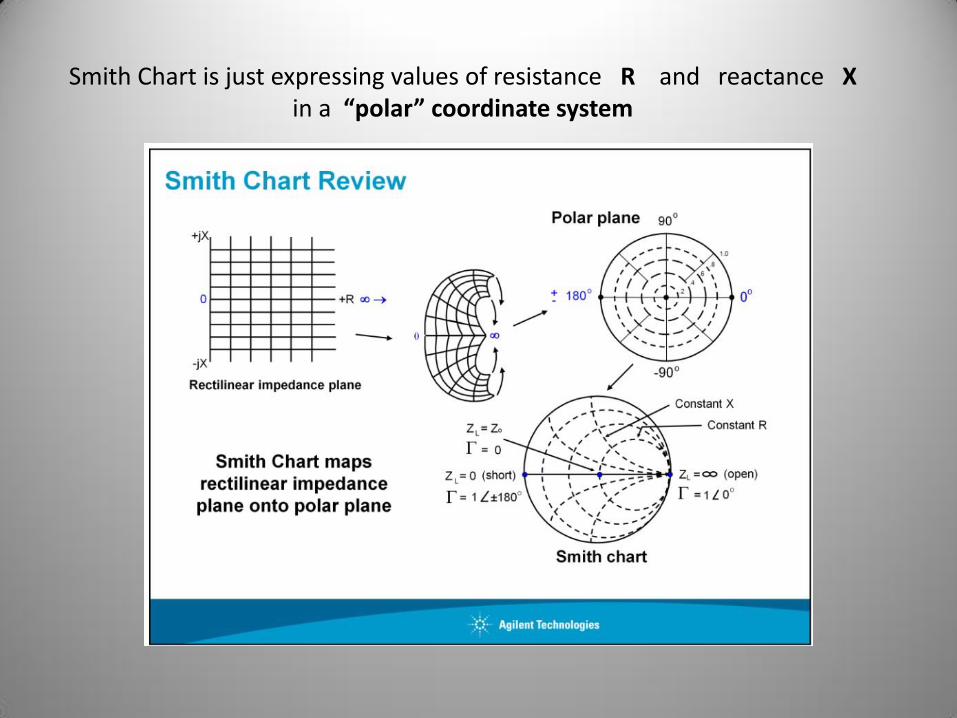
Smith Chart is just expressing values of resistance R and reactance X in a “polar” coordinate system

Resistance values are plotted on the horizontal axis on a non-linear scale Usually 50 ohms is plotted at dead-center (Bull’s Eye)

Resistance Circles

Reactance Circles
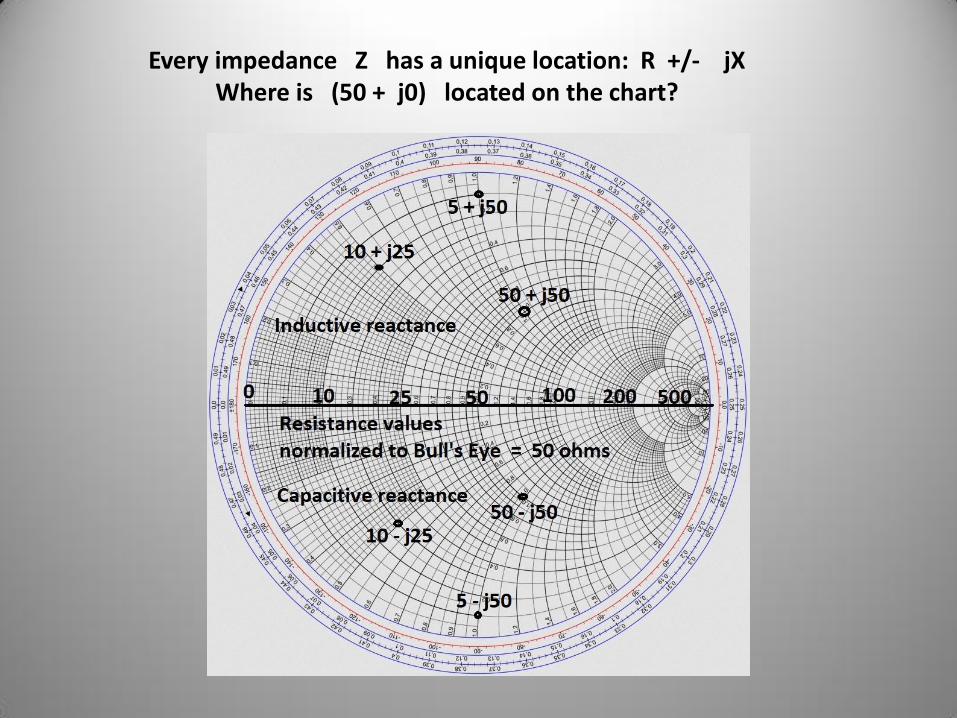
Every impedance Z has a unique location: R +/- jX Where is (50 + j0) located on the chart?
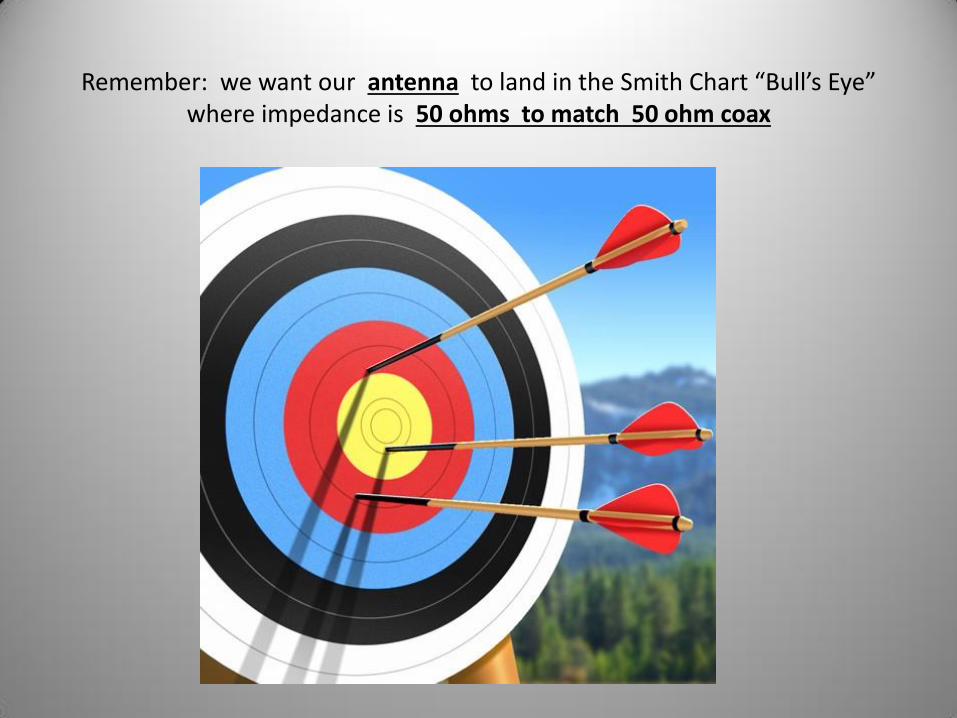
Remember: we want our antenna to land in the Smith Chart “Bull’s Eye” where impedance is 50 ohms to match 50 ohm coax

Smith Chart (think DART BOARD) reflection coefficient ρ = 0 and SWR = 1:1
Bull’s Eye = perfect match to 50 ohms with zero reflected power

If 20% of incident voltage is reflected ρ = 0.20 and SWR = 1.5:1
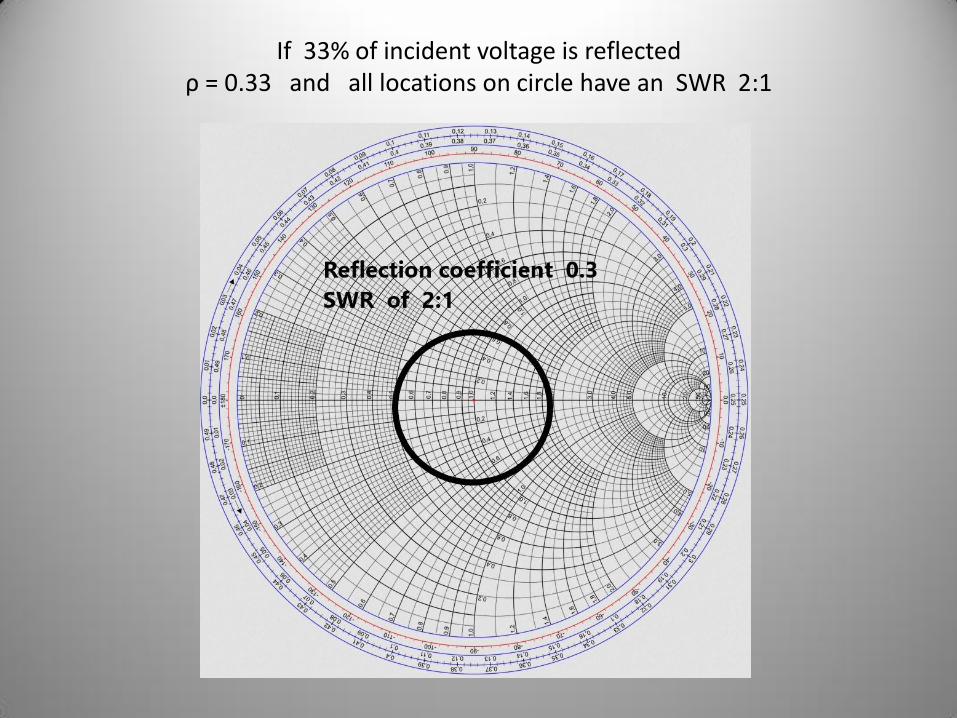
If 33% of incident voltage is reflected ρ = 0.33 and all locations on circle have an SWR 2:1

If 50% of incident voltage is reflected ρ = 0.50 and SWR = 3:1
==> 25% radio’s power is “reflected” and RIG is UNHAPPY
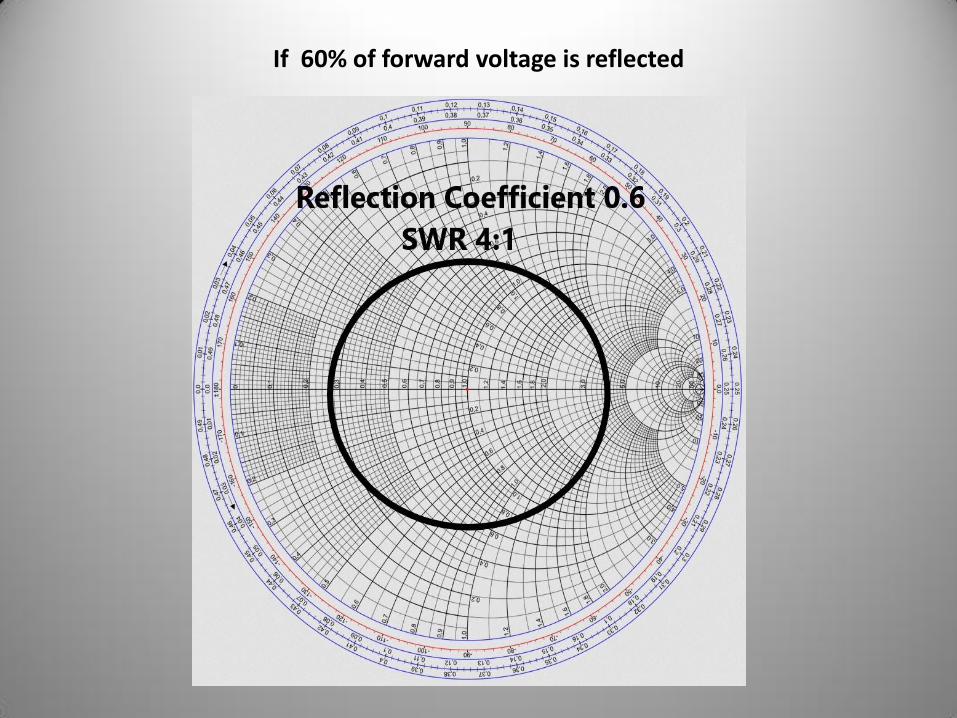
If 60% of forward voltage is reflected
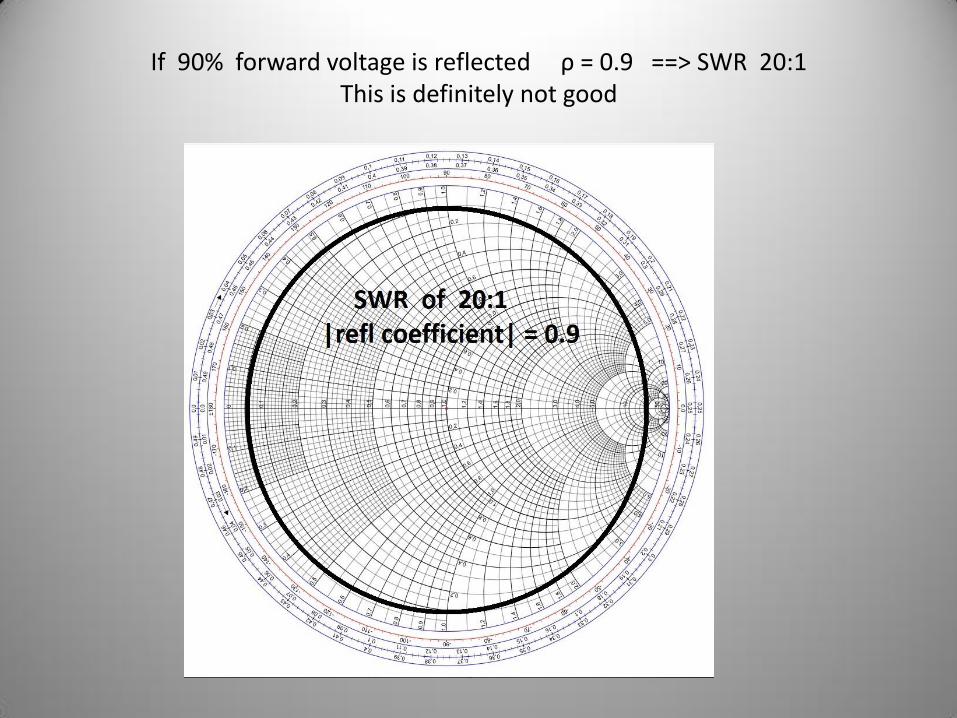
If 90% forward voltage is reflected ρ = 0.9 ==> SWR 20:1 This is definitely not good

What is the SWR with ρ = 1 and 100% voltage is reflected?

QUIZ: Where is this antenna resonant ?

QUIZ: Where is the SWR lowest?

Let’s put the Nano VNA to work testing real antennas S11 = Signal goes out Ch0 and returns to same port

135 feet long 80 meter Inverted V antenna center fed with 150 ft RG213 (50 ohm) and W2DU current balun
What are the resonant frequencies of this antenna?

Reflection coefficient S11 and SWR plot VERY low SWR at 3.6 MHz
Note resonant odd “harmonics” are not in ham bands

80m Dipole measured from my SHACK: 3.5 to 4.0 MHz note where the SWR of 2.0 is on Smith Chart
What is the PHASE graph revealing?
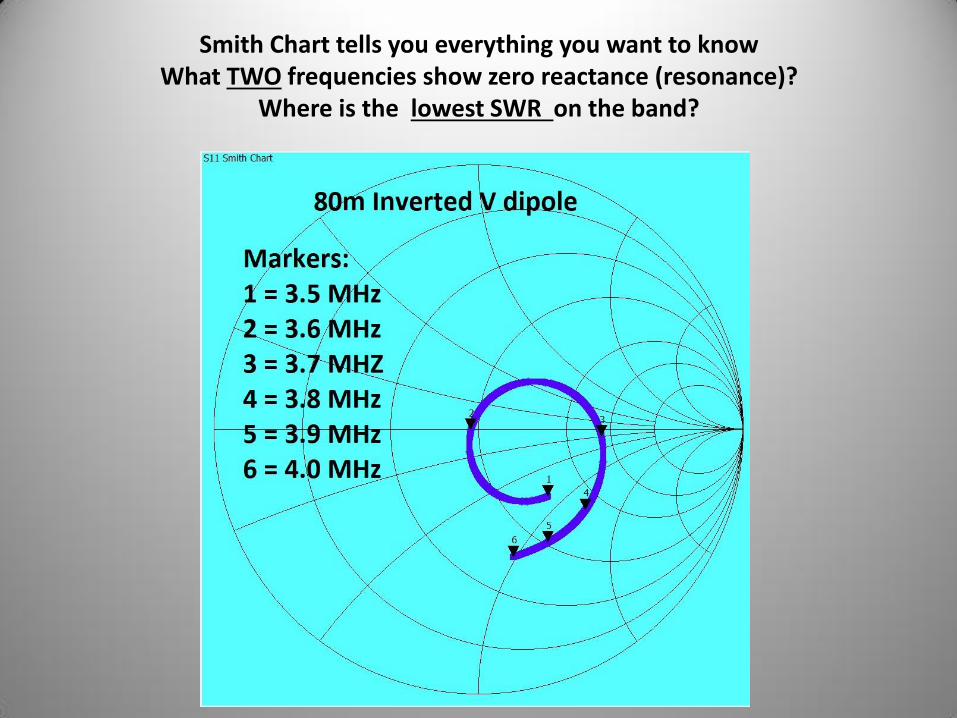
Smith Chart tells you everything you want to know What TWO frequencies show zero reactance (resonance)?
Where is the lowest SWR on the band?
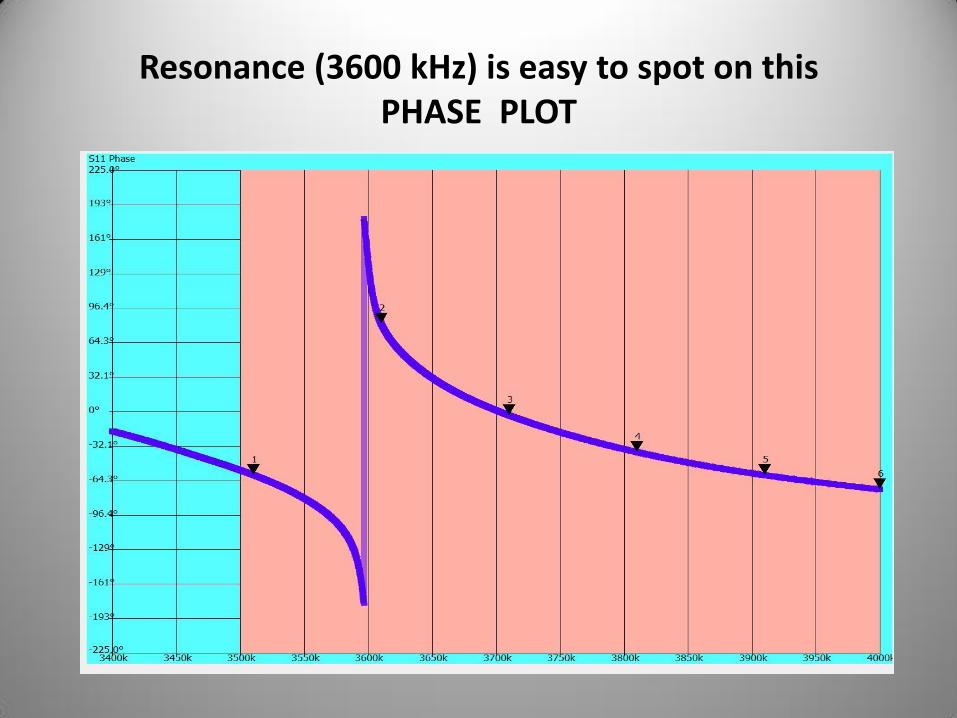
Resonance (3600 kHz) is easy to spot on this PHASE PLOT

Can I QSY to the PHONE portion of band Marker # 5? Ooops…. I see the SWR = 3:1 at 3900 kHz

I want to operate this dipole on the ENTIRE 80 m band But the SWR is way too high at the low/high end of band

• Below resonance: the dipole is too short and the current leads the driving voltage (capacitive reactance)
• Above resonance: the dipole is too long the current lags the driving voltage (inductive reactance)
Do I have to shorten the antenna to operate at 3900 kHz?

Think like GRAMPY maybe there is a simple solution: how to cancel REACTANCE?

Tune out reactance in your shack

Matching Network (antenna tuner) allows rig to “see” 50 ohm load and ρ = 0
Have we changed the SWR right AT the antenna?

Tune out the REACTANCE in the shack by introducing a “conjugate impedance” in your antenna tuner
(R + jX is matched by R – jX)
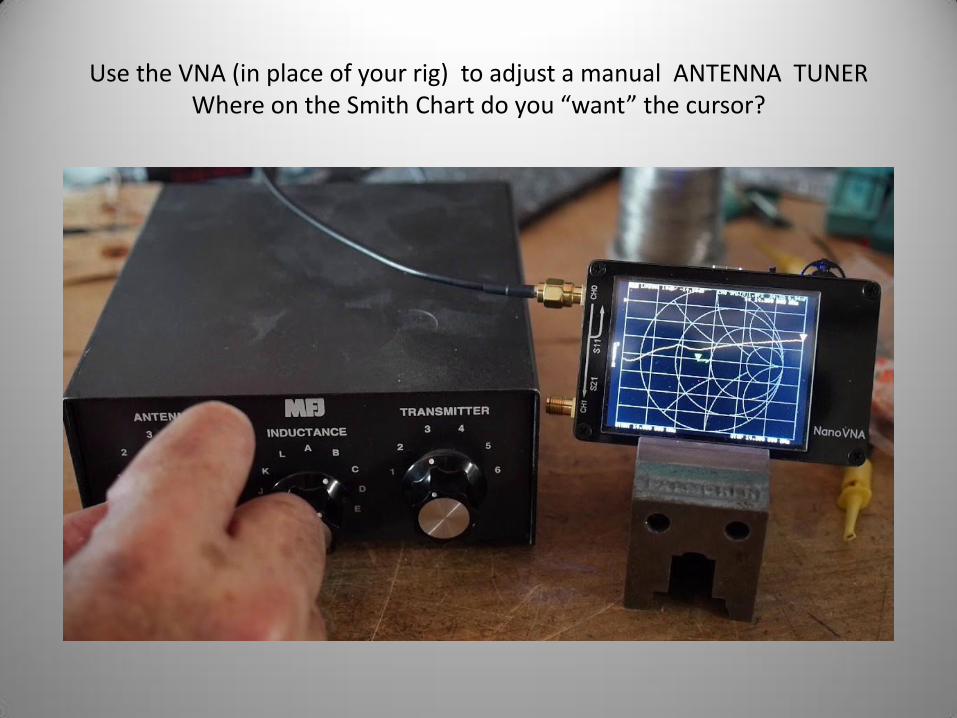
Use the VNA (in place of your rig) to adjust a manual ANTENNA TUNER Where on the Smith Chart do you “want” the cursor?
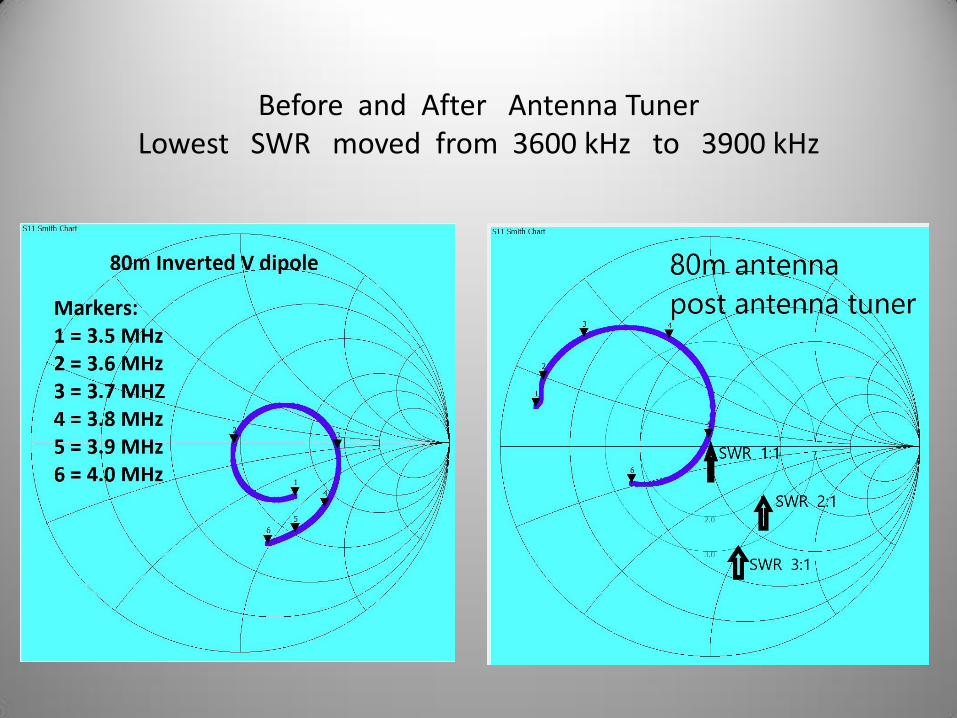
Before and After Antenna Tuner Lowest SWR moved from 3600 kHz to 3900 kHz

Same 80m antenna but now “retuned” to 3900 kHz (PHONE) by an antenna tuner in the shack
Note the rotated Smith Chart impedance graph and note the new lowest SWR frequency is 3900 kHz
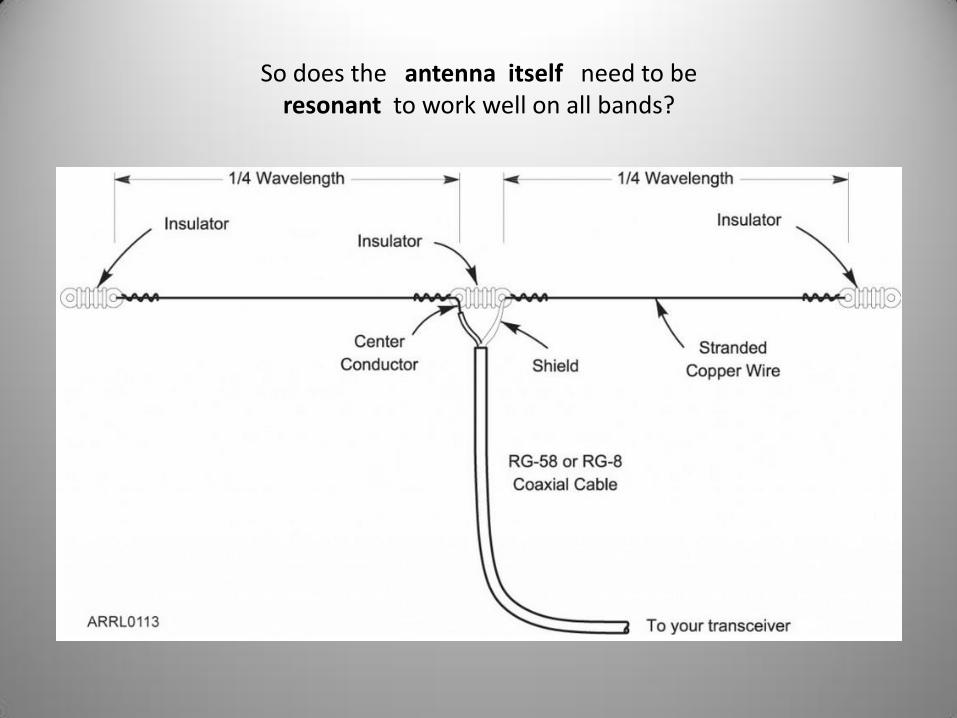
So does the antenna itself need to be resonant to work well on all bands?

The “tuner” allows the rig to see 50 ohms Z on ALL BANDS But has the SWR changed on the ladder line to the antenna?

130 ft Center Fed dipole with Low-Loss BALANCED 450 ohm Ladder Line
can work on all HF bands with TUNER in the shack WHERE is the SWR low in this image?

This “random” length non-resonant wire can work well on many HF frequencies with some help from an antenna “tuner”
What exactly is the antenna tuner “tuning”?

Now don’t you wish you owned one of these devices?