nano composites paper
TRANSCRIPT

A. ZandiatashbarGraduate Research Assistant
Student Mem. ASME
R. C. Picu1
Professor
Fellow ASME
e-mail: [email protected]
N. KoratkarProfessor
Department of Mechanical,
Aerospace and Nuclear Engineering,
Rensselaer Polytechnic Institute,
Troy, NY 12180
Mechanical Behaviorof Epoxy-Graphene PlateletsNanocompositesVarious aspects of the mechanical behavior of epoxy-based nanocomposites with gra- phene platelets (GPL) as additives are discussed in this article. The monotonic loadingresponse indicates that at elevated temperatures, the elastic modulus and the yield stressare significantly improved in the composite as compared to neat epoxy. The activationenergy for creep is smaller in neat epoxy, which indicates that the composite creeps less,especially at elevated temperatures and higher stresses. The composites also exhibit larger fracture toughness. When subjected to cyclic loading, fatigue crack growth rate issmaller in the composite relative to neat epoxy. This reduction is important by at least anorder of magnitude at all stress intensity factor amplitudes. Optimal property improvementsin the monotonic, cyclic, and fracture behaviors are obtained for very low filling fraction of approximately 0.1 wt. %. Similar differences in the mechanical behavior are observed whenthe composite is probed on the local scale by nanoindentation. [DOI: 10.1115/1.4006499]
1 Introduction
Polymer nanocomposites received significant attention over thelast decade due to multiple experimental observations that signifi-cant enhancement of mechanical properties can be obtained by theaddition of small volume fractions of nanoscale additives [1,2]. Itwas seen that the polymers filled with only few percent volumefraction of functionalized nanoparticles have significantly larger strength and ductility than the corresponding neat material [ 3].When carbon nanotube (CNT) additives are used, enhanced prop-erties are obtained at even smaller filling fractions, below 1 wt. %[4 – 7].
Graphene has emerged recently as a promising new nanoscalefiller material [8,9]. However, due to the cost of producing largequantities of monolayer graphene as well as issues related to their stability in powder form and during processing, the nanocompo-sites research community has employed primarily GPL [1]. Theseare thin plates, each containing several graphene sheets. The pla-telets have in-plane dimensions about 2 orders of magnitude larger than the thickness, large in-plane stiffness and relatively a lowbending stiffness. In many cases, these contain a large concentra-tion of defects which reduce, to some extent, the stiffness andstrength of fillers, but facilitate functionalization and bonding tothe polymeric matrix.
The GPL has been used to reinforce various polymers, bothcross-linked, such as epoxy [10], and uncross-linked, such asPMMA [11]. The effect of filling varies significantly as a functionof the filling fraction, the functionalization of the filler surface,dispersion and distribution of fillers in the matrix. Generally, anecessary (but insufficient) condition for obtaining enhanced com-posite properties is to reach proper filler dispersion. If this condi-tion is achieved, a very small filler volume fraction may besufficient. The nature of the filler-matrix interface is also of im-portance; weak interfaces promote cavitation, which in turnenhances the material ductility. As in regular composites withmicroscale fillers, strong filler-matrix adhesion is required for strength improvements. Fracture toughness is enhanced for inter-mediate values of the interface strength.
This work addresses various aspects of the mechanical behavior of epoxy filled with GPL. Epoxy is an important technologicalmaterial with applications ranging from adhesives used in civilengineering and the microelectronic industry, to matrix materialfor composite helicopter blades. In all these applications strengthand toughness, and in particular fatigue resistance, are crucial. Wehave studied both the monotonic and cyclic loading response of epoxy-GPL composites, at room and elevated temperatures(below the glass transition temperature) [12]. Creep deformationwas also studied, as it is important, for example, in civil engineer-ing applications of epoxy. We have shown that when fillers areproperly dispersed in the matrix, 0.1 wt. % GPL is sufficient tolead to optimal mechanical properties. In this article, we reviewfatigue, creep, and fracture toughness results obtained for this sys-tem. New results on the monotonic and nanoindentation behavior of epoxy-GPL are presented, completing the characterization of this class of materials.
The article is organized as follows: the materials and methodsused for preparation and characterization are presented in Sec. 2;Sec. 3 is divided in subsections addressing the characterization of the filler dispersion in the matrix, monotonic test results, creep,fracture, and fatigue behavior, as well as a comparison with thenanoscale material response obtained by nanoindentation. Theconclusions are presented in Sec. 4.
2 Materials and Methods
Bulk quantities of graphene platelets were prepared by rapidthermal exfoliation of graphite oxide at a heating rate greater than2000 C/min [12]. Graphite oxide was obtained by oxidizinggraphite flakes in a solution of nitric acid, sulfuric acid, and potas-sium chlorate for about 96 h [9,13]. For thermal exfoliation,graphite oxide was placed in a quartz tube, which was sealed atone end and closed by using a rubber stopper at the other end. Anargon inlet was embedded through the stopper, and the samplewas flushed by argon for 10 min. Then, the tube is inserted in atube furnace (79300, Thermo Fisher Scientific, Inc., USA) pre-heated to 1050C and held there for about 30 s. Grapheneobtained by this method was in the form of GPL [12].
The GPLs were dispersed in acetone (100 ml of acetone to 0.1g of GPL) using a sonicator at high amplitude (Sonics VibracellVC 750, Sonics and Materials, Inc., USA), for 1.5 h. The epoxyresin (System 2000 Epoxy Resin, Fibreglast, Inc., USA) was
1Corresponding author.Contributed by the Materials Division of ASME for publication in the J OURNAL OF
ENGINEERING MATERIALS AND TECHNOLOGY. Manuscript received October 16, 2011;final manuscript received January 7, 2012; published online May 16, 2012. Assoc.Editor: Xin-Lin Gao.
Journal of Engineering Materials and Technology JULY 2012, Vol. 134 / 031011-1CopyrightVC 2012 by ASME
Downloaded From: http://materialstechnology.asmedigitalcollection.asme.org/ on 04/25/2013 Terms of Use: http://asme.org/terms

added to the mixture and sonicated following the same procedurefor another 1.5 h. Next, the acetone was evaporated by heating themixture on a magnetic stir plate using a Teflon-coated magneticbar for 3 h at 70 C. The mixture was placed in a vacuum chamber for 12 h at 70 C to ensure that all the acetone has been removed.After allowing the GPL/epoxy resin slurry to cool down to roomtemperature, a low viscosity curing agent (2120 Epoxy Hardener,Fibreglast, Inc., USA) was added and mixed using a high speedshear mixer (ARE-250, Thinky, Japan) for 4 min at 2000 rpm.The mixture was again placed in a vacuum chamber for degassingfor approximately 30 min. Finally, the mixture was poured intosilicone molds and was cured at room temperature and 90 psipressure for 24 h, followed by 4 h of postcure at 90 C.
The samples were used for mechanical testing which was per-formed with a standard material testing machine (MTS-858, MTSSystems Corp., MN, USA) fitted with an environmental chamber.Monotonic, creep, and fatigue tests were performed with the samemachine. To evaluate the composite’s performance under fatigueconditions, dynamic crack propagation tests on compact tensionsamples were conducted following ASTM E647 standard.
Nanoindentation was performed using a NanoTestVR
550 (MicroMaterials Ltd., Wrexham, UK) on nanocomposite thin films. Thefilm material was obtained by a procedure similar to that describedabove, except that the mixture was spun on a Si wafer before cur-ing. The curing process was similar to that for bulk specimens.
3 Results and Discussion
3.1 Nanofiller Size Distribution and Dispersion. Nano-composite properties depend strongly on the quality of dispersionof fillers in the polymeric matrix. The dispersion is achieved dur-ing the mixing process; it is considered that the cross-linking pro-cess introduces no bias in this measure. Figure 1(a) shows animage of the fracture surface of a composite with 0.1 wt. % GPL.The image shows that the sample preparation procedure describedin Sec. 2 leads to good filler dispersion. However, not all fillersare of the same size, since GPL clustering in the powder beforemixing is pronounced. The probability distribution function of inclusion sizes was determined by processing images of fracturesurfaces and using the line intercept method (ASTM E112). Thedistribution is shown in Fig. 1(b) for two composites with 0.1 and
0.5 wt. % GPL. The distribution for the composite with larger fill-ing fraction is shifted to larger values of the variable, indicatingthat a larger degree of GPL clustering takes place. Some GPLclusters are also present in the 0.1 wt. % sample, but the mean of that distribution is at 1 lm, i.e., most inclusions are submicron insize and likely few-layer graphene platelets. This suggests thatbetter mixing is obtained at lower filling fractions, and that largeclusters of GPL are present for filling fractions larger than approx-imately 0.5 wt. %. Since interactions within a cluster are rather weak (van der Waals), these inclusions have low strength andmodulus and are expected to lead to worse mechanical propertiesof the composite relative to materials with low filling and evenrelative to neat epoxy. This effect is confirmed experimentally, asdiscussed below.
3.2 Uniaxial Monotonic Testing. Monotonic uniaxial tensiletesting was performed using dog-bone samples. Figure 2(a) showsstress–strain curves for neat epoxy and two composites, with 0.1and 0.2 wt. %. Tests were performed at room temperature and at40 C, 55 C, and 70 C.
At room temperature, the curves corresponding to the threematerials are close to each other. The stiffness increases slightly,mostly proportional to the volume fraction of inclusions. Note thatthe relationship between weight and volume fraction in this sys-tem is 1 wt. % ¼ 1.12 vol. % [10]. The yield stress is slightlylarger in composites relative to the neat epoxy, but the differenceis marginally larger than the variability expected from sample tosample and experimental uncertainties. The curves reach a maxi-mum at a strain of about 4%. Note that previous studies [ 10,12]have indicated 20–30% to increase in modulus and strength of epoxies at GPL loading fractions of ~0.1 wt. % at room tempera-ture. These differences may arise due to the variation in the prop-erties of the GPL used (e.g., defect density, thickness, etc.).
Significant changes in the stress–strain curve are observed asthe temperature increases. As expected, the 0.2% yield stressdecreases and ductility (strain at failure) increases. However, thedecrease is more pronounced in neat epoxy. Figure 2(b) shows themagnitude of the yield stress of the composite relative to that of neat epoxy as a function of temperature. The relative magnitude isevaluated as ðrcomp
y À repoxy y Þ=repoxy
y and is given in Fig. 2(b) inpercentage. Note the significant increase of this measure as the
Fig. 1 (a ) SEM micrograph of a fracture surface of the 0.1 wt. % epoxy-GPL nanocomposite after failure. The inset shows aregion of the main image at higher magnification. The inclusions can be easily distinguished from the river pattern features,as indicated in the inset. (b ) Probability distribution function of inclusion size in 0.1 and 0.5 wt. % epoxy-GPL nanocompo-sites obtained by image processing of fracture surface micrographs [ 14].
031011-2 / Vol. 134, JULY 2012 Transactions of the ASME
Downloaded From: http://materialstechnology.asmedigitalcollection.asme.org/ on 04/25/2013 Terms of Use: http://asme.org/terms

temperature increases. It is also noted that the 0.1 wt. % compos-ite provides better performance than the composite with 0.2 wt. %GPL. This is also observed and discussed in Sec. 3.4 in connectionwith fracture toughness.
Increasing temperature also leads to a dramatic decrease of theapparent Young’s modulus, with the drop being much more pro-nounced in neat epoxy. Although the modulus is expected todecrease with increasing temperature, the significant variationobserved here is likely an effect of the pronounced transient creepat elevated temperatures, as discussed in Sec. 3.3.
An interesting observation is that as the temperature increases,the strain hardening increases in all materials. This is againstexpectations based on the behavior of most engineering materials.A strong strain hardening promotes stable plastic flow, enhancedductility and toughness. Also interestingly, the strain hardeningrate is almost a constant of strain at all temperatures. Very little (if any) necking is observed in these materials at all temperaturesconsidered. The three materials have the same strain hardeningrate at given temperature.
It is appropriate to discuss these observations while taking intoaccount the difference between the test temperature and the glasstransition temperature, T g. T g was measured using differentialscanning calorimetry for neat epoxy and nanocomposites of 0.1,0.3, and 0.5 wt. % GPL. The values range between 73 and 79 Cfor all these materials. While the mean values of T g seem toincrease with the filler content, the experimental noise is rather large (62 C) and a clear correlation cannot be established. How-ever, the observations in Fig. 2, i.e., the faster softening of neat ep-oxy, cannot be explained based on the small difference of T gbetween the various materials, primarily because this argument pre-dicts the opposite trend relative to the experiment. At given temper-ature, the nanocomposite is closer to its T g than unfilled epoxy.Note that the degradation temperature of epoxy is above 170 C.
The strain rate sensitivity of the three materials was measuredby performing two monotonic tension tests at strain rates 10À5 sÀ1
and 10À4 sÀ1, i.e., with a strain rate differential of 10, and at roomtemperature. The strain rate sensitivity is positive and increaseswith strain. At the peak stress (4% strain), the strain rate sensitiv-ity parameter is m ¼ 0.057. The parameter is evaluated asm ¼ ðlogðr1=r2ÞÞ=ðlogð _e1= _e2ÞÞ, with the two values of the stress,r1 and r2, being measured at same strain and at the two strainrates, _e1 and _e2.
3.3 Creep. Creep tests were performed with nominal stressesof 20 and 40 MPa at room temperature, in separate experiments
[14]. These stress levels represent 35% and 70% of the yieldstress, respectively. The load was increased fast and then heldconstant. The creep strain was recorded for 36 h. No necking or significant variation of the specimen cross-sectional area wasobserved during the test, so the effective stress is that prescribedthroughout the entire test. Figure 3 shows the creep strain (totalstrain minus the elastic strain corresponding to the creep load)versus time for neat epoxy and for the composite with 0.1 wt. %GPL at room temperature and nominal stress of 40 MPa. Testswere performed with composites having higher filling fractions,up to 0.5 wt. %, but the 0.1 wt. % composite exhibited the lowestcreep rate. In fact, the 0.5 wt. % GPL composite exhibits larger creep strains than neat epoxy at all times.
After the transient creep period (which lasts for approximately1 h at this stress), steady state creep sets in and the curve isapproximated by e(t ) $ t 1/ q, Fig. 3. The exponent q is 2.49 for ep-oxy and 4.71 for the nanocomposite, which indicates that, as timeincreases, a smaller creep strain is recorded for the composite.The power law dependence of the creep strain on time can be cap-tured by a fractional viscoelastic model, a model introduced torepresent long tails, power law relaxation of complex liquids andsolids [15]. A power function of this type is usually interpreted as
Fig. 2 (a ) Engineering stress versus engineering strain plots for neat epoxy, 0.1 and 0.2 wt. % epoxy-GPL nanocomposites.Symbols are added to the curve just for labeling. (b ) Relative magnitude of the 0.2% yield stresses of the composite and neatepoxy (computed as ðrcomp
y À repoxyy Þ=ðrepoxy
y Þ), versus temperature. Data for composites with 0.1 and 0.2 wt. % GPL are shown.The nonmonotonic variation of the GPL0.1 curve is expected to be due to the variability from sample to sample. However, theincreasing trend of the measure shown is clear and independent of the measurement noise.
Fig. 3 Log–log plot of creep strain versus time (in seconds) forneat epoxy and 0.1 wt. % epoxy-GPL showing a power law creepcompliance function [14]
Journal of Engineering Materials and Technology JULY 2012, Vol. 134 / 031011-3
Downloaded From: http://materialstechnology.asmedigitalcollection.asme.org/ on 04/25/2013 Terms of Use: http://asme.org/terms
a manifestation of hierarchical relaxation processes taking placein the material.
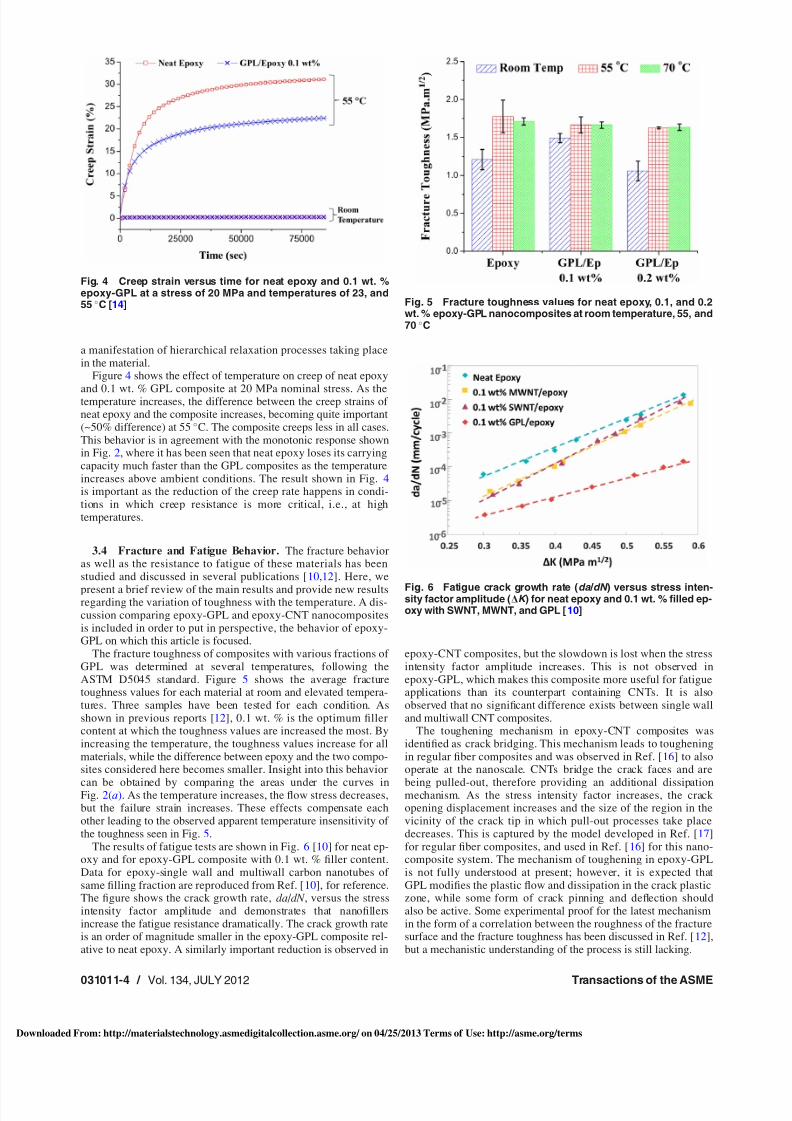
Figure 4 shows the effect of temperature on creep of neat epoxyand 0.1 wt. % GPL composite at 20 MPa nominal stress. As thetemperature increases, the difference between the creep strains of neat epoxy and the composite increases, becoming quite important(~50% difference) at 55 C. The composite creeps less in all cases.This behavior is in agreement with the monotonic response shownin Fig. 2, where it has been seen that neat epoxy loses its carryingcapacity much faster than the GPL composites as the temperatureincreases above ambient conditions. The result shown in Fig. 4is important as the reduction of the creep rate happens in condi-tions in which creep resistance is more critical, i.e., at hightemperatures.
3.4 Fracture and Fatigue Behavior. The fracture behavior as well as the resistance to fatigue of these materials has beenstudied and discussed in several publications [10,12]. Here, wepresent a brief review of the main results and provide new resultsregarding the variation of toughness with the temperature. A dis-cussion comparing epoxy-GPL and epoxy-CNT nanocompositesis included in order to put in perspective, the behavior of epoxy-GPL on which this article is focused.
The fracture toughness of composites with various fractions of GPL was determined at several temperatures, following theASTM D5045 standard. Figure 5 shows the average fracturetoughness values for each material at room and elevated tempera-tures. Three samples have been tested for each condition. Asshown in previous reports [12], 0.1 wt. % is the optimum filler content at which the toughness values are increased the most. Byincreasing the temperature, the toughness values increase for allmaterials, while the difference between epoxy and the two compo-sites considered here becomes smaller. Insight into this behavior can be obtained by comparing the areas under the curves inFig. 2(a). As the temperature increases, the flow stress decreases,but the failure strain increases. These effects compensate eachother leading to the observed apparent temperature insensitivity of the toughness seen in Fig. 5.
The results of fatigue tests are shown in Fig. 6 [10] for neat ep-oxy and for epoxy-GPL composite with 0.1 wt. % filler content.Data for epoxy-single wall and multiwall carbon nanotubes of same filling fraction are reproduced from Ref. [10], for reference.The figure shows the crack growth rate, da / dN , versus the stressintensity factor amplitude and demonstrates that nanofillersincrease the fatigue resistance dramatically. The crack growth rateis an order of magnitude smaller in the epoxy-GPL composite rel-ative to neat epoxy. A similarly important reduction is observed in
epoxy-CNT composites, but the slowdown is lost when the stressintensity factor amplitude increases. This is not observed inepoxy-GPL, which makes this composite more useful for fatigueapplications than its counterpart containing CNTs. It is alsoobserved that no significant difference exists between single walland multiwall CNT composites.
The toughening mechanism in epoxy-CNT composites wasidentified as crack bridging. This mechanism leads to tougheningin regular fiber composites and was observed in Ref. [16] to alsooperate at the nanoscale. CNTs bridge the crack faces and arebeing pulled-out, therefore providing an additional dissipationmechanism. As the stress intensity factor increases, the crackopening displacement increases and the size of the region in thevicinity of the crack tip in which pull-out processes take placedecreases. This is captured by the model developed in Ref. [17]for regular fiber composites, and used in Ref. [16] for this nano-composite system. The mechanism of toughening in epoxy-GPLis not fully understood at present; however, it is expected thatGPL modifies the plastic flow and dissipation in the crack plasticzone, while some form of crack pinning and deflection shouldalso be active. Some experimental proof for the latest mechanismin the form of a correlation between the roughness of the fracturesurface and the fracture toughness has been discussed in Ref. [12],but a mechanistic understanding of the process is still lacking.
Fig. 4 Creep strain versus time for neat epoxy and 0.1 wt. %epoxy-GPL at a stress of 20 MPa and temperatures of 23, and55 C [14] Fig. 5 Fracture toughness values for neat epoxy, 0.1, and 0.2
wt. % epoxy-GPL nanocomposites at room temperature, 55, and70 C
Fig. 6 Fatigue crack growth rate (da / dN ) versus stress inten-sity factor amplitude (DK ) for neat epoxy and 0.1 wt. % filled ep-oxy with SWNT, MWNT, and GPL [ 10]
031011-4 / Vol. 134, JULY 2012 Transactions of the ASME
Downloaded From: http://materialstechnology.asmedigitalcollection.asme.org/ on 04/25/2013 Terms of Use: http://asme.org/terms
The effect of the CNT length and diameter on the crack growthrate under fatigue loading has been discussed in Ref. [18]. It wasshown that the crack growth rate decreases as the CNT diameter decreases and as the length increases. These conclusions are inline with the crack bridging model used in Ref. [16].
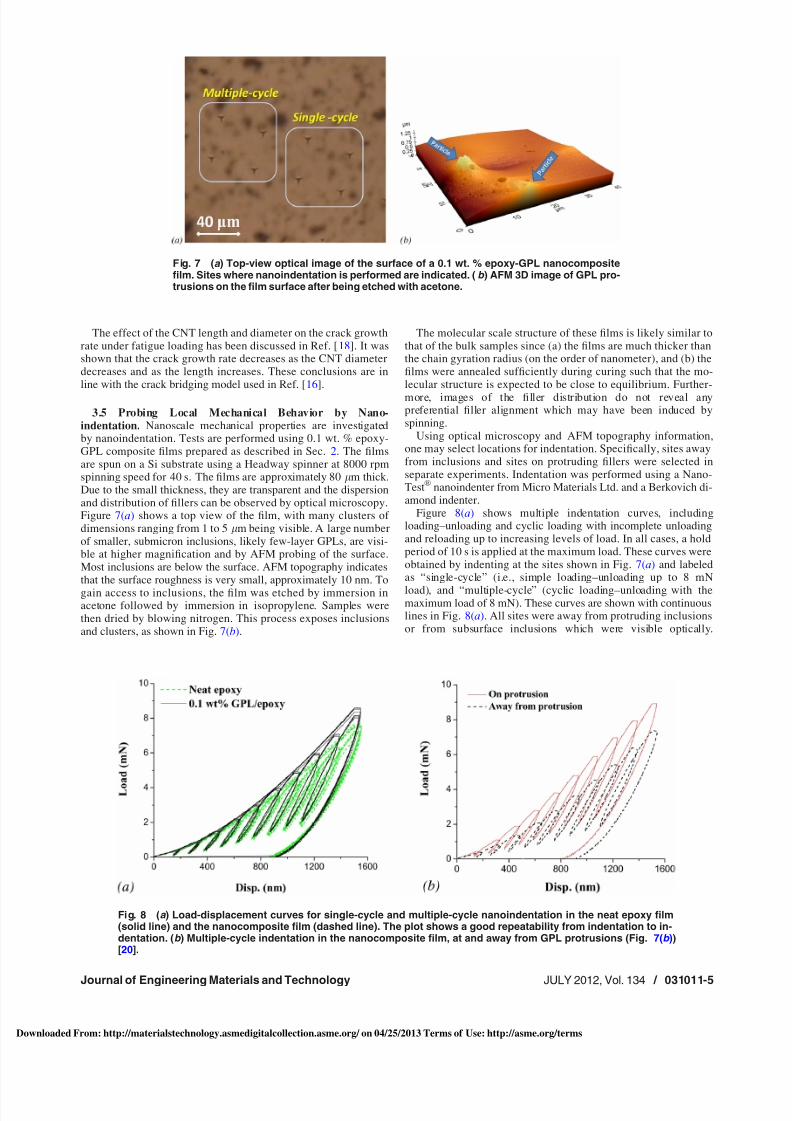
3.5 Probing Local Mechanical Behavior by Nano-indentation. Nanoscale mechanical properties are investigatedby nanoindentation. Tests are performed using 0.1 wt. % epoxy-GPL composite films prepared as described in Sec. 2. The filmsare spun on a Si substrate using a Headway spinner at 8000 rpmspinning speed for 40 s. The films are approximately 80 lm thick.Due to the small thickness, they are transparent and the dispersionand distribution of fillers can be observed by optical microscopy.Figure 7(a) shows a top view of the film, with many clusters of dimensions ranging from 1 to 5 lm being visible. A large number of smaller, submicron inclusions, likely few-layer GPLs, are visi-ble at higher magnification and by AFM probing of the surface.Most inclusions are below the surface. AFM topography indicatesthat the surface roughness is very small, approximately 10 nm. Togain access to inclusions, the film was etched by immersion inacetone followed by immersion in isopropylene. Samples werethen dried by blowing nitrogen. This process exposes inclusionsand clusters, as shown in Fig. 7(b).
The molecular scale structure of these films is likely similar tothat of the bulk samples since (a) the films are much thicker thanthe chain gyration radius (on the order of nanometer), and (b) thefilms were annealed sufficiently during curing such that the mo-lecular structure is expected to be close to equilibrium. Further-more, images of the filler distribution do not reveal anypreferential filler alignment which may have been induced byspinning.
Using optical microscopy and AFM topography information,one may select locations for indentation. Specifically, sites awayfrom inclusions and sites on protruding fillers were selected inseparate experiments. Indentation was performed using a Nano-Test
VRnanoindenter from Micro Materials Ltd. and a Berkovich di-
amond indenter.Figure 8(a) shows multiple indentation curves, including
loading–unloading and cyclic loading with incomplete unloadingand reloading up to increasing levels of load. In all cases, a holdperiod of 10 s is applied at the maximum load. These curves wereobtained by indenting at the sites shown in Fig. 7(a) and labeledas “single-cycle” (i.e., simple loading–unloading up to 8 mNload), and “multiple-cycle” (cyclic loading–unloading with themaximum load of 8 mN). These curves are shown with continuouslines in Fig. 8(a). All sites were away from protruding inclusionsor from subsurface inclusions which were visible optically.
Fig. 7 (a ) Top-view optical image of the surface of a 0.1 wt. % epoxy-GPL nanocompositefilm. Sites where nanoindentation is performed are indicated. ( b ) AFM 3D image of GPL pro-trusions on the film surface after being etched with acetone.
Fig. 8 (a ) Load-displacement curves for single-cycle and multiple-cycle nanoindentation in the neat epoxy film(solid line) and the nanocomposite film (dashed line). The plot shows a good repeatability from indentation to in-dentation. (b ) Multiple-cycle indentation in the nanocomposite film, at and away from GPL protrusions (Fig. 7(b ))[20].
Journal of Engineering Materials and Technology JULY 2012, Vol. 134 / 031011-5
Downloaded From: http://materialstechnology.asmedigitalcollection.asme.org/ on 04/25/2013 Terms of Use: http://asme.org/terms

Hence, the response corresponds to the epoxy matrix. It is seenthat the repeatability (site to site) is very good. The cyclic test isload controlled with displacement limits, and the loading branchesare seen to follow closely the monotonic curves. Some hysteresis,indicating some degree of viscoplasticity is seen.
Figure 8(a) includes cyclic curves obtained with neat epoxysamples prepared under the same conditions. As in the case of thecomposite, the repeatability from site to site is an excellent, and thehysteresis loops and dissipation are similar to those observed in thecomposite. The neat epoxy curves overlap with those of the com-posite at small loads, which indicates that we are probing locallyepoxy which is not modified by the presence of inclusions. As theload and indentation depth increase, the composite appears stiffer.This indicates that, as larger loads are applied and a larger plasticzone develops around the indenter, fillers play a role and increasethe flow stress (see also Fig. 2). Furthermore, the present results donot provide support for the existence of a bonded polymer layer inthese composites. Such a layer with modified mechanical anddielectric properties was postulated to exist in all nanofilled ther-moplastics. The modified macroscopic properties of the nanocom-posite were associated with the percolation of these modifiedlayers. In the materials studied here, the interphase is thought to beless well defined due to the presence of cross-links [ 19].
Figure 8(b) shows cyclic indentation curves obtained by prob-ing on protruding fillers and away from those, in the composite.As expected, the response to indentations on protrusions is muchstiffer than that to indentations elsewhere in the epoxy matrix(these curves are identical to those in Fig. 8(a)).
The local mechanical tests provide results which are in agree-ment with the trends seen macroscopically. Although they do notclarify the mechanism of toughening observed in monotonic andcyclic tests, they indicate that (a) GPLs do not have a long-rangeeffect on the epoxy matrix, as postulated in nanofilled thermoplas-tics, and most of the epoxy in the composite has the same behav-ior as unfilled epoxy, (b) GPLs have a strengthening effect,presumably due to the good bonding with the epoxy matrix (medi-ated by the O and OH groups present on the surface of GPL) [20].
4 Conclusions
A comprehensive analysis of the mechanical behavior of epoxy-GPL nanocomposites is presented. The addition of nanosized GPLincreases the creep resistance and slows down fatigue crack growth.The flow stress of the composite subjected to uniaxial monotonicloading is larger than that of neat epoxy, and the difference increasesas the temperature increases. The strain hardening rate of both neatand filled epoxy increases with increasing temperature. The localmechanical behavior is probed, and it is concluded that GPL do notproduce an interphase with modified mechanical properties, as usu-ally seen in thermoplastics with nanofiller additions. This suggeststhat the improved properties observed especially in the fracturebehavior are primarily due to the interaction of the crack front withindividual fillers or to modified plasticity in the vicinity of the cracktip and not to the percolation of interphase zones.
Acknowledgment
We gratefully acknowledge support from the NSF under GrantNo. CMMI 0900188 and from the ONR under Grant No. N00014-09-1-0928.
References[1] Potts, J. R., Dreyer, D. R., Bielawski, C. W., and Ruoff, R. S., 2011,
“Graphene-Based Polymer Nanocomposites,” Polymer , 52(1), pp. 5–25.[2] Li, B., and Zhong, W.-H., 2011, “Review on Polymer/Graphite Nanoplatelet
Nanocomposites,” J. Mater. Sci., 46(17), pp. 5595–5614.[3] Ash, B. J., Siegel, R. W., and Schadler, L. S., 2004, “Mechanical Behavior of
Alumina/Poly(Methyl Methacrylate) Nanocomposites,” Macromolecules,37(4), pp. 1358–1369.
[4] Coleman, J., Khan, U., Blau, W., and Gun’ko, Y., 2006, “Small But Strong: AReview of the Mechanical Properties of Carbon Nanotubepolymer Composites,” Carbon, 44(9), pp. 1624–1652.
[5] Ajayan, P. M., Schadler, L. S., Giannaris, C., and Rubio, A., 2000, “Single-Walled Carbon Nanotube-Polymer Composites: Strength and Weakness,” AdvMater , 12(10), pp. 750–753.
[6] Schadler, L. S., Giannaris, S. C., and Ajayan, P. M., 1998, “Load Transfer inCarbon Nanotube Epoxy Composites,” Appl. Phys. Lett., 73(26), p. 3842.
[7] Thostenson, E. T., Ren, Z., and Chou, T.-W., 2001, “Advances in the Scienceand Technology of Carbon Nanotubes and Their Composites: A Review,” Com-pos. Sci. Technol., 61(13), pp. 1899–1912.
[8] Stankovich, S., Dikin, D. A., Dommett, G. H. B., Kohlhaas, K. M., Zimney,E. J., Stach, E. A., Piner, R. D., Nguyen, S. T., and Ruoff, R. S., 2006,“Graphene-Based Composite Materials,” Nature (London), 442(7100), pp.282–286.
[9] McAllister, M. J., Li, J.-l., Adamson, D. H., Schniepp, H. C., Abdala, A. A.,Liu, J., Herrera-Alonso, M., Milius, D. L., Car, R., Prud’homme, R. K., andAksay, I. A., 2007, “Single Sheet Functionalized Graphene by Oxidation and
Thermal Expansion of Graphite,” Chem. Mater., 19(18), pp. 4396–4404.[10] Rafiee, M. A., Rafiee, J., Wang, Z., Song, H., Yu, Z.-Z., and Koratkar, N.,
2009, “Enhanced Mechanical Properties of Nanocomposites at Low GrapheneContent,” ACS Nano, 3(12), pp. 3884–3890.
[11] Ramanathan, T., Abdala, A. A., Stankovich, S., Dikin, D. A., Herrera-Alonso,M., Piner, R. D., Adamson, D. H., Schniepp, H. C., Chen, X., Ruoff, R. S.,Nguyen, S. T., Aksay, I. A., Prud’homme, R. K., and Brinson, L. C., 2008,“Functionalized Graphene Sheets for Polymer Nanocomposites,” Nat. Nano-technol., 3(6), pp. 327–331.
[12] Rafiee, M. A., Rafiee, J., Srivastava, I., Wang, Z., Song, H., Yu, Z.-Z., and Kor-atkar, N., 2010, “Fracture and Fatigue in Graphene Nanocomposites,” Small,6(2), pp. 179–183.
[13] Schniepp, H. C., Li, J.-L., McAllister, M. J., Sai, H., Herrera-Alonso, M., Ad-amson, D. H., Prud’homme, R. K., Car, R., Saville, D. A., and Aksay, I. A.,2006, “Functionalized Single Graphene Sheets Derived From Splitting GraphiteOxide,” J. Phys. Chem. B, 110(17), pp. 8535–8539.
[14] Zandiatashbar, A., Picu, C. R., and Koratkar, N., 2012, “Control of EpoxyCreep Using Graphene,” Small, in press. DOI: 10.1002/smll.201102686.
[15] Shames, I. H., and Cozzarelli, F. A., 1997, Elastic and Inelastic Stress Analysis: Revised Printing, Taylor & Francis, Washington, D.C.
[16] Zhang, W., Picu, R. C., and Koratkar, N., 2007, “Suppression of FatigueCrack Growth in Carbon Nanotube Composites,” Appl. Phys. Lett., 91(19),p. 193109.
[17] Erdogan, F., and Joseph, P. F., 1989, “Toughening of Ceramics Through CrackBridging by Ductile Particles,” J. Am. Ceram. Soc., 72(2), pp. 262–270.
[18] Zhang, W., Picu, R. C., and Koratkar, N., 2008, “The Effect of Carbon Nano-tube Dimensions and Dispersion on the Fatigue Behavior of Epoxy Nano-composites,” Nanotechnology, 19(28), p. 285709.
[19] Putz, K. W., Palmeri, M. J., Cohn, R. B., Andrews, R., and Brinson, L. C.,2008, “Effect of Cross-Link Density on Interphase Creation in Polymer Nano-composites,” Macromolecules, 41(18), pp. 6752–6756.
[20] Zandiatashbar, A., Picu, C. R., and Koratkar, N., 2011, “Depth Sensing Indenta-tion of Nanoscale Graphene Platelets in Nanocomposite Thin Films,” Mater.Res. Soc. Symp. Proc., 1312, pp. 1–6.
031011-6 / Vol. 134, JULY 2012 Transactions of the ASME
Downloaded From: http://materialstechnology.asmedigitalcollection.asme.org/ on 04/25/2013 Terms of Use: http://asme.org/terms