nancy gershenfeld senior lecturer, the information school university of washington eat your spinach:...
TRANSCRIPT

Nancy GershenfeldSenior Lecturer, The Information
SchoolUniversity of Washington
Eat Your Spinach:Why Crunching Numbers Can Be Good for You
Workshop Outline
Life in business with statisticsHow businesses use statistics for
decision-makingProving your point: What numbers to
collect?Effective communication of statistics
5/14/20082Crunching Numbers / © Nancy Gershenfeld

My Life in the Business?
Learning from Accountants and Business Analysts (and smart managers)
5/14/20083Crunching Numbers / © Nancy Gershenfeld

Experience Hard WonInformation Broker (FIND/SVP now Guideline)
Analysis of online usageDemographic and consumer product research
Litigation Support (Betts Patterson & Mines Database Management Center) Benchmarking hardware and software
Corporate Library (Microsoft Information Services)MetricsBudget preparation and analysisBusiness planningJustifying everything
5/14/20084Crunching Numbers / © Nancy Gershenfeld

FIND/SVP: Get me more helpWeek One Week
TwoWeek Three
Week Four
QIS llll llll llll llll llll llll llll
Research llll llll
Doc Delivery
llll llll llll llll
Projects llll llll llll llll llll llll
Sales llll ll
Customer SVC
llll lll
Exec Office
llll
Admin llll ll5/14/2008
Crunching Numbers / © Nancy Gershenfeld5

Microsoft : Headcount Request
5/14/2008Crunching Numbers / © Nancy Gershenfeld6

Keys to SuccessSupport your proposal or justification with
numbersMake the presentation easy to understand
at a glanceUnderstand that what worked last year
may not work this yearBe confident in what you conclude from the
statistics (Numbers don’t lie…until the next section,
that is)
5/14/2008Crunching Numbers / © Nancy Gershenfeld7

How Businesses Use Statistics
Decision-making based on the data
5/14/20088Crunching Numbers / © Nancy Gershenfeld

Statistical DataA collection of facts from which conclusions
may be drawn; "statistical data" (from http://wordnet.princeton.edu/perl/webwn?s=data )
Factual information (such as measurements and statistics) used as a basis for reasoning, discussion, or calculation (fromhttp://www.ic.gc.ca/epic/site/stco-levc.nsf/en/h_qw00037e.html )
5/14/2008Crunching Numbers / © Nancy Gershenfeld9

Counting versus AnalyzingNot just a statistic or a numberA number says what isStatistical data provides basis for
assessment
Measurement and Analysis are meaningfulWhat you see in the numbersWhat decisions you make What actions you take
5/14/2008Crunching Numbers / © Nancy Gershenfeld10

An Example: Ski Lift Usage Data
Big Sky Resorthttp://www.bigskyresort.com/Activities/Winter/Mountain-
Stats-and-Trail-Maps.asp
5/14/200811Crunching Numbers / © Nancy Gershenfeld

What Will You See?Allocation of timePercentage usage increasePercentage budget dollars savedTrending shift in user baseTraceable shift in USEMeasurable success of service or online toolCorrelation between online availability and
decreased email requestsJustification for request for additional funds,
people, sources, services
5/14/2008Crunching Numbers / © Nancy Gershenfeld12

What Do The Partners Want?Increased productivity of staffIncreased billingsSuccessful outcomesNew ClientsReturn on Investment (ROI)
Lower costsLarger share of profitsBetter compensation for trained staff
5/14/2008Crunching Numbers / © Nancy Gershenfeld13

General CommentsDecisions based on firm data direct the
course of actionBusinesses do not like to guess (though
they will make forecasts)Decisions made based on hard data are
easier to support (defend)Statistics can be used to prove just about
any pointSee How to Lie with Statistics by Darrell Huff,
originally published in 1954.“Nearly half the doctors surveyed
recommended…”“We can lie with statistics, just as long as we all
tell the same lie.”
5/14/200814Crunching Numbers / © Nancy Gershenfeld

Marketing Decisions
Examples in consumer products
5/14/2008Crunching Numbers / © Nancy Gershenfeld15

Example 1: Movie DVDs in HDTwo standards
HD DVDBlu-Ray
How many copies to produce in each format?
Look at the market dataInstalled base of each format of playerTrend data in sales for the past yearAny patterns in purchases by TYPE of movie
(e.g., action v. drama v. comedy)What happens now that Blu-Ray has won?
5/14/200816Crunching Numbers / © Nancy Gershenfeld

Warner Sides With Blu-ray DVDs, A Clinching Vote for Sony's Format
Brooks Barnes. New York Times. (Late Edition (East Coast)). New York, N.Y.: Jan 5, 2008. pg. C.1
5/14/2008Crunching Numbers / © Nancy Gershenfeld17

Example 2: Retail StoresStarbucks plans to close about 100 U.S.
locations this year Which stores to close in which markets?Look at the store data
High-performing versus low-performing stores
Same-store salesUnder-performing markets (based on
previous forecasts)Any correlation of low-performing stores to
saturation of stores in the market?
5/14/200818Crunching Numbers / © Nancy Gershenfeld

Example 3: Bluetooth phonesIn Washington State, as of July 2008, drivers
who talk on a cell phone without a hands-free device could face a $101 ticket.
Potential run on phones that are Bluetooth headset-capable
Look at the sales data for WA stateAverage “life span” of mobile phone
ownershipPercentage of Bluetooth phones sold in that
average time periodTrends in headset sales
5/14/200819Crunching Numbers / © Nancy Gershenfeld

What to Collect and What to Do With It?
Statistics for library operations, planning and justification
5/14/200820Crunching Numbers / © Nancy Gershenfeld

What Decisions Do You Make?Services to provide
Scope of researchHours of coverage
Purchase of sourcesPrint or online?Scope of access
Renewal of subscriptions, online resourcesRenew or cancel?Renegotiate?
Online ToolsJustify investment in web-based tools?
5/14/200821Crunching Numbers / © Nancy Gershenfeld

How Do Your Make Decisions?Anecdotal evidenceGut reactionsBudget constraintsDirect requests (or mandates)
Make the statistics work for you
5/14/200822Crunching Numbers / © Nancy Gershenfeld

What Do You Want to Know?Who are you working for?
Evenly distributed?Reaching “primary” audience?Nature of requests (quick information, extended
research, business development)
What do you need to do to serve your users?Ongoing requests for different accessOpportunity to disseminate information about your
industry or client’s industry / businessOpportunity to automate certain functionsGoal to shift from “support” to “strategic”
5/14/2008Crunching Numbers / © Nancy Gershenfeld23

Statistical Data to CollectUsage of online sources
Number of unique usersNumber of concurrent usersCorresponding drop in email requests (is there any?)Increase in requests for training?
Research requestsClassify by type, nature, time-frame, customer, clientAverage time per requestAverage time per type of request
5/14/200824Crunching Numbers / © Nancy Gershenfeld

Collecting Statistical DataTime considerationsLook for low-hanging fruit (statistics
automatically collected)Don’t overlook the low-tech method (hash
marks on a piece of paper)Incentives for staff to collect manual dataData mining of online logsTarget meaningful measurement
5/14/2008Crunching Numbers / © Nancy Gershenfeld25

Reporting
Statistics Can Make Your Case
5/14/200826Crunching Numbers / © Nancy Gershenfeld
Examples of Usage Data
Incremental or huge growth in usageIncreasing demand month over month,
year over yearPercentage of work done for billable clients Dollar value of successful business
development
5/14/200827Crunching Numbers / © Nancy Gershenfeld

Objective: Demonstrate Value
Show that billable time continues to growDemonstrate increased value to business
developmentReveal operational activity continues to
drop (and be prepared to explain WHY).
5/14/200828Crunching Numbers / © Nancy Gershenfeld

Report in NarrativeThe Library statistics show we billed 50% of
our time to clients in 2004, 55% in 2005, 63% in 2006 and 67% in 2007.
In 2004, 15% of the time was utilized by Business Development, rising to 19% in 2005, 24% in 2006 and falling slightly to 20% in 2007 after a reduced need for new clientele.
Time devoted to Operations continues to fall, taking up 35% of library staff time in 2004, dropping to 26% in 2005, and down to 13% in 2006 and 2007 after outsourcing tasks.
5/14/200829Crunching Numbers / © Nancy Gershenfeld

Report using Textual Chart
2004 2005 2006 2007
% Billable 50 55 63 67
% Bus Dev 15 19 24 20
% Operations
35 26 13 13
5/14/200830Crunching Numbers / © Nancy Gershenfeld
Increase in billable hours linked directly to outsourcing of operational tasks
Successful 2006 for new client development reduced effort in 2007

Report via Graphics:% Distribution by Type
5/14/200831Crunching Numbers / © Nancy Gershenfeld

Report via Graphics:% Distribution by Year
5/14/200832Crunching Numbers / © Nancy Gershenfeld

A Different Graphic:% Distribution by Year
5/14/200833Crunching Numbers / © Nancy Gershenfeld

Objective: Request More Staff
Prove that staff are overworked Show increased time per projectLink to successful cases
5/14/200834Crunching Numbers / © Nancy Gershenfeld
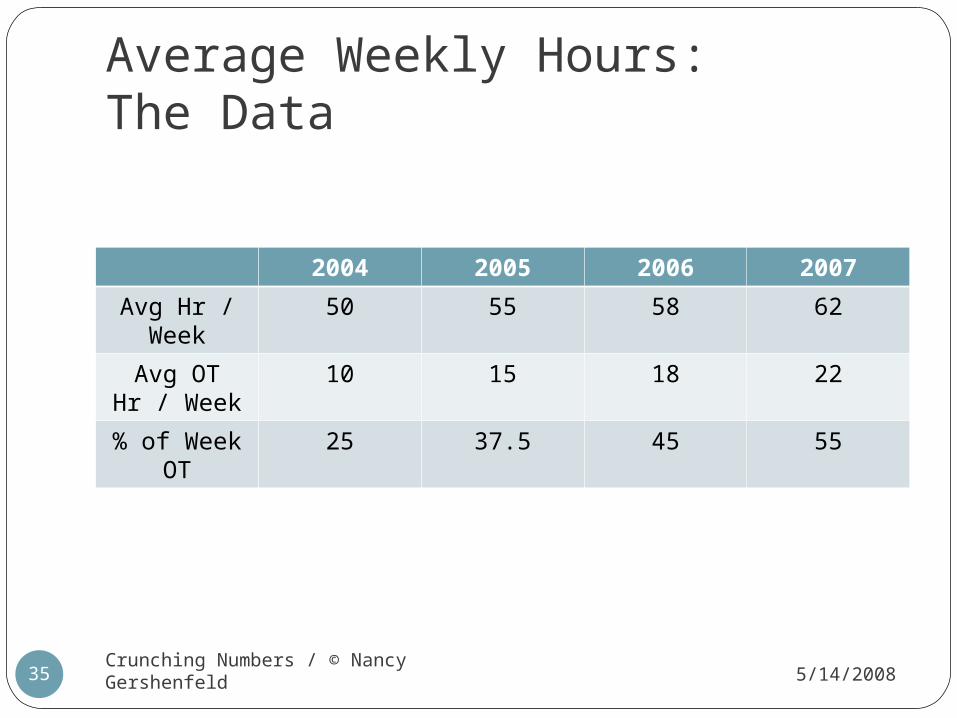
Average Weekly Hours: The Data
2004 2005 2006 2007
Avg Hr / Week
50 55 58 62
Avg OT Hr / Week
10 15 18 22
% of Week OT
25 37.5 45 55
5/14/2008Crunching Numbers / © Nancy Gershenfeld35

Charting the Growth
5/14/2008Crunching Numbers / © Nancy Gershenfeld36

Driving the Point Home
5/14/2008Crunching Numbers / © Nancy Gershenfeld37
Staff averaging 22 hours or 55% of total work week in OT

Time Per Project: The Data
Q1 Q2 Q3 Q4
2005 3.7 3.9 3.9 4.4
2006 4.5 4.7 5.5 5.6
2007 7.0 7.2 7.7 9.0
5/14/2008Crunching Numbers / © Nancy Gershenfeld38

Time Per Project: The Picture
5/14/2008Crunching Numbers / © Nancy Gershenfeld39

Time Per Project: Flip the Picture
5/14/2008Crunching Numbers / © Nancy Gershenfeld40

Successful Cases: The Link
5/14/2008Crunching Numbers / © Nancy Gershenfeld41

Excel is Your FriendExcel can do the math for you (use
formulas)Make the numbers stand outChart wizardsCharting makes it easy to grasp the point in
a glanceDon’t repulse anyone with ugly chartsAdd commentary to reinforce your points
5/14/2008Crunching Numbers / © Nancy Gershenfeld42

Sophisticated Visual Display
5/14/2008Crunching Numbers / © Nancy Gershenfeld43
Information Dashboard Design The Effective Visual Communication of Data By Stephen FewFirst Edition January 2006 Pages: 223 ISBN 10: 0-596-10016-7 | ISBN 13: 9780596100162
http://www.oreilly.com/catalog/9780596100162/
