namic property/casualty compensation surveythe jacobson group is honored to—once again—sponsor...
TRANSCRIPT

2016 NAMIC Property/Casualty Compensation SurveyCompiled by Ward Group
SPONSORED BY
BenefitsIncentives
1500 Job Titles
SalaryTotal Compensation
Pay For Performance Performance Metric
Firm Size Premium Scales
GeographicRegion

2016 NAMIC Property/Casualty Compensation Survey
C O R P O R A T E S P O N S O R I N P A R T N E R S H I P W I T H
The Jacobson Group is the leading global provider of insurance talent. For 45 years, we have been connecting insurance organizations with professionals from the board room to the back room on both a permanent and temporary basis. We offer a variety of solutions including executive search, professional recruiting, emerging talent, RPO, temporary staffing, subject matter experts, and onsite and work-at-home operations support.
Jacobson’s marketplace longevity creates an extensive industry network, a unique insider’s perspective and a reputation for excellence. Regardless of the need or situation, Jacobson is the insurance talent solution.
For more information, visit www.jacobsononline.com.
Ward Group, the insurance solutions division of Aon Hewitt, is the leading provider of benchmarking and best practices studies for the insurance industry. We analyze staff levels, compensation, business practices and expenses for all areas of company operations and help insurers to measure results compared to peer groups, optimize performance and improve profitability. Since 1991, we have performed more than 2,500 operational and compensation benchmarking exercises for companies of all sizes, including more than half of the top 100 U.S. insurance carriers.
Ward Group is part of Aon Hewitt, a business unit of Aon plc (NYSE: AON). For more information, please visit wardinc.com.
2

N A T I O N A L A S S O C I A T I O N O F M U T U A L I N S U R A N C E C O M P A N I E S
NAMIC is the largest property/casualty insurance trade association in the country, with more than 1,400 member companies representing 39 percent of the total market. NAMIC supports regional and local mutual insurance companies on main streets across America and many of the country’s largest national insurers.
NAMIC member companies serve more than 170 million policyholders and write more than $230 billion in annual premiums. Our members account for 54 percent of homeowners, 43 percent of automobile, and 32 percent of the business insurance markets.
Through our advocacy programs we promote public policy solutions that benefit NAMIC member companies and the policyholders they serve and foster greater understanding and recognition of the unique alignment of interests between management and policyholders of mutual companies.
NAMIC HEADQUARTERS NAMIC WASHINGTON OFFICE 3601 Vincennes Road 122 C Street, N.W. Indianapolis, IN 46268 Washington, D.C. 20001 (317) 875-5250 (202) 628-1558
www.NAMIC.org
Special thank you to NAMIC’s Property Casualty Conference Board of Directors for its leadership and support of this project.
Chairman Robert Zak President & CEO Merchants Mutual Insurance Company
Chairman-Elect Michael Wenos, CPCU President Madison Mutual Insurance Company
Immediate Past Chairman Eric Nelson President & CEO Mutual of Enumclaw Insurance Company
Vice Chairman Tim Shauf President & CEO The Commonwell Mutual Insurance Group
Phil Fraim President & CEO Oklahoma Attorneys Mutual Insurance Company
Dave Gross President & CEO SECURA Insurance, A Mutual Company
Dave Kaufman President & CEO Motorists Mutual Insurance Company
R. Douglas Haines President & CEO Buckeye State Mutual Insurance Company
Jeff Wrobel, CPCU President Mutual Assurance Society of Virginia
Jill Wagner President Integrity Mutual Insurance Company
3
Liason to NAMIC Board Marie Jewett President & CEO Co-operative Insurance Companies
Staff Liaison Kristen L. Spriggs Vice President, Member Development NAMIC
2016 NAMIC Property/Casualty Compensation Survey

AN INDUSTRY TRANSFORMEDOnce considered a business buzzword, disruption has transformed into an economic reality. Today, industry disruption is bringing changes to the marketplace that are so all encompassing that they change how we think, behave and do business. This disruption is at once both destructive and creative—displacing existing markets, industries and technologies with something new and more efficient. For mutual companies, the challenge becomes finding the balance between staying true to our mutual roots while improving productivity and increasing profits. More and more, we find ourselves turning to disruptive technology to provide a solution. “Innovate or die” is becoming the reality of today’s business climate.
INSURANCE REIMAGINEDWithin insurance, technological advancements are increasing the opportunity for disruptions while consumer preferences are fueling the demand. These changes are providing us with strategic reflection points—opportunities to embrace change and navigate innovation. The only requirement is that we shift our thinking outside the box. Only those insurers that are ready and willing to challenge and change business models will have the competitive capabilities to sustain growth and keep pace with market expectations.
THE TALENT CONUNDRUMNo longer will a one-size-fits-all approach to talent work for an industry that faces accelerated transformation. Now is the time for us to shake up the industry’s talent and embrace a unique mix of professionals who can think and work in different ways.
Unfortunately, the competition within the industry labor market is reaching a fever pitch. Additionally, we continually lose the war for talent when paired against seemingly more attractive industries like finance, technology and healthcare.
To My Fellow Industry Peers,
The Jacobson Group is honored to—once again—sponsor the 2016 NAMIC Property/Casualty Compensation Survey. With its robust view and insider lens into compensation best practices, this study offers a pivot point from which we can construct a framework for a competitive and real-world strategy. We stand at the cusp of a transformed economy, workforce and workplace. Today’s insurance organizations are faced with a convergence of monumental changes—from the digital revolution, the growth of cyber risk and the permeation of social media—to the onset of disrupters. A mandate for future success is to be aware of and responsive to key disrupters, technical advances and trends that impact our rapidly evolving labor market. We must continue to evolve our thinking, methodology, practices and biases around compensation and its importance. In the new business economy, competitive and innovative compensation is the linchpin in engaging and retaining talent. Truly, WE ARE AN INDUSTRY IN TRANSFORMATION.
INDUSTRY PERSPECTIVE
Diversity is now recognized as a key strategy to promote innovation and improve performance.
Insurance CEOs looking to hire individuals with a
broad range of skills. 81%
Organizations reporting increased business performance with diversity-focused staffing.
85%
Insurance industry disruption is being driven by a number of factors:1
Changes in Industry
Regulation
Changes in Production or
Service Provisions
Changes in Distribution Channels
Changes in Customer Behaviors
Increase in Competitors
88% 64% 69%71%61%
Insurers are utilizing disruptive technology:2
90%
Sharpen Data Analytics
88%
Strengthen Operational Efficiency
81%
Enhance Customer Experience
1. Industry Snapshot: Insurance (2015). PwC. http://www.pwc.com/gx/en/ceo-survey/2015/industry/assets/ceo-survey-2015-industry-snapshot-insurance.pdf.2. 18th Annual Global CEO Survey (2015). PwC. http://www.pwc.com/gx/en/ceo-survey/2015/industry/assets/ceo-survey-2015-indepth-analysis-insurance.pdf.
Managing PartnerThe Jacobson Group
As the competition escalates and organizations search for innovative and talented professionals, compensation is a critical issue and a vital component in being an employer of choice. Of course, we all recognize that dollars are only part of the big compensation picture. Organizations must look beyond the monetary and focus on key lifestyle perks—including flexible scheduling, incentive programs, volunteer opportunities and the distinctive mutual company culture—that are becoming more and more important as ways to personalize a compensation package and to differentiate from the competition both inside and outside the industry. These lifestyle perks are key to engaging and retaining high-level talent across all generations and showcase mutual companies’ proud tradition of service, purpose and distinct value.
I hope you enjoy this informative and insightful study!
4
2 0 1 6 P R O P E R T Y / C A S U A LT Y C O M P E N S A T I O N S U R V E Y

2 0 1 6 P R O P E R T Y / C A S U A LT Y C O M P E N S A T I O N S U R V E Y
Ward Group is pleased to be partnering with NAMIC and The Jacobson Group in conducting this year’s Property/Casualty Compensation Survey. The survey is comprehensive in scope covering the majority of roles within a carrier. Overall, 117 companies participated in this year’s survey, reporting pay data for more than 40,000 employees. The participants spanned a wide scale range and included both mutual and stock companies. Given the robust participation, we were able to deliver results that provide a thorough perspective on pay.
B R O A D M A R K E T T R E N D S
For the first time in over 40 years, the insurance industry experienced three years in a row of underwriting profitability. 2015 marked the third consecutive year with a combined ratio performance under 100. There was a decline in surplus but a growth in investment income over the past year. Return on equity was slightly higher in 2015 compared to 2014, but has remained relatively consistent over the past three years. Similar to the past two years, expense management poses one of the greater challenges to the industry as total expenses remained around 40% and it becomes more and more important to reduce costs.
5
2016 NAMIC Property/Casualty Compensation Survey
O W N E R S H I P
P A R T I C I P A N T P R O F I L ED I R E C T W R I T T E N P R E M I U M ( $ 0 0 0 ’ S )
2 0 1 5 D I R E C T W R I T T E N P R E M I U M G R O W T H
6
2016 NAMIC Property/Casualty Compensation Survey
2 0 1 6 P R O P E R T Y / C A S U A LT Y C O M P E N S A T I O N S U R V E Y
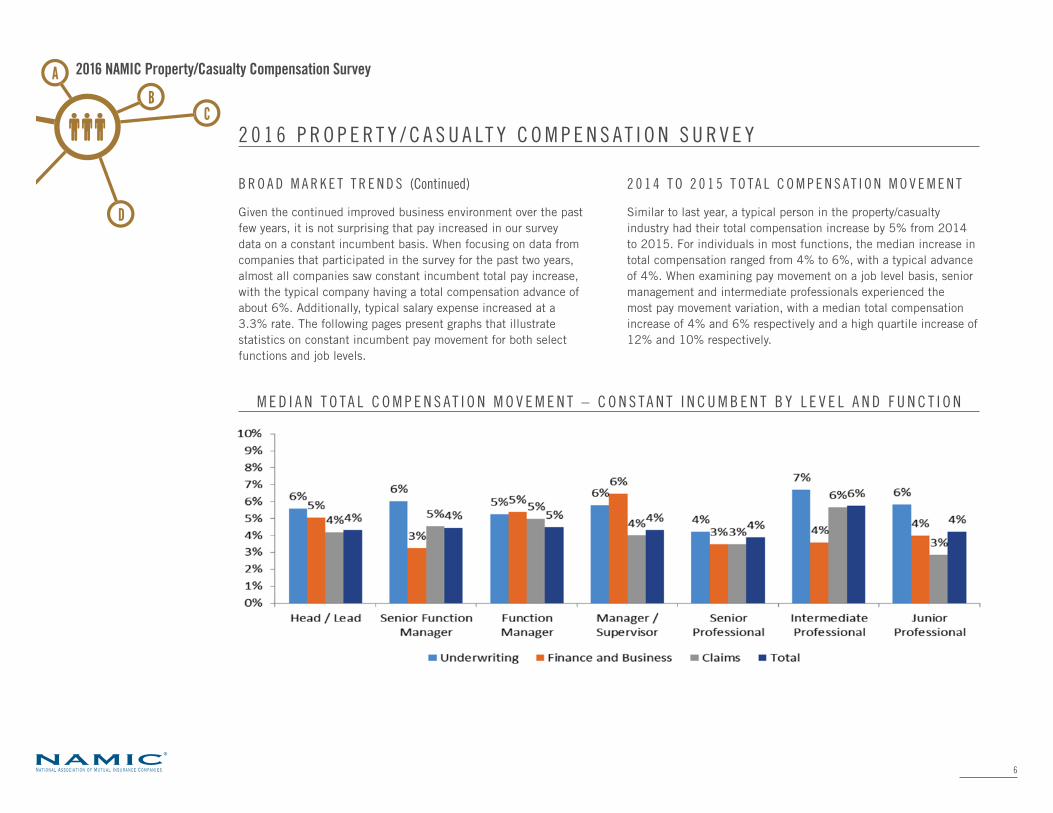
B R O A D M A R K E T T R E N D S (Continued)
Given the continued improved business environment over the past few years, it is not surprising that pay increased in our survey data on a constant incumbent basis. When focusing on data from companies that participated in the survey for the past two years, almost all companies saw constant incumbent total pay increase, with the typical company having a total compensation advance of about 6%. Additionally, typical salary expense increased at a 3.3% rate. The following pages present graphs that illustrate statistics on constant incumbent pay movement for both select functions and job levels.
2 0 1 4 T O 2 0 1 5 T O T A L C O M P E N S A T I O N M O V E M E N T
Similar to last year, a typical person in the property/casualty industry had their total compensation increase by 5% from 2014 to 2015. For individuals in most functions, the median increase in total compensation ranged from 4% to 6%, with a typical advance of 4%. When examining pay movement on a job level basis, senior management and intermediate professionals experienced the most pay movement variation, with a median total compensation increase of 4% and 6% respectively and a high quartile increase of 12% and 10% respectively.
M E D I A N T O T A L C O M P E N S A T I O N M O V E M E N T – C O N S T A N T I N C U M B E N T B Y L E V E L A N D F U N C T I O N
2 0 1 6 P R O P E R T Y / C A S U A LT Y C O M P E N S A T I O N S U R V E Y
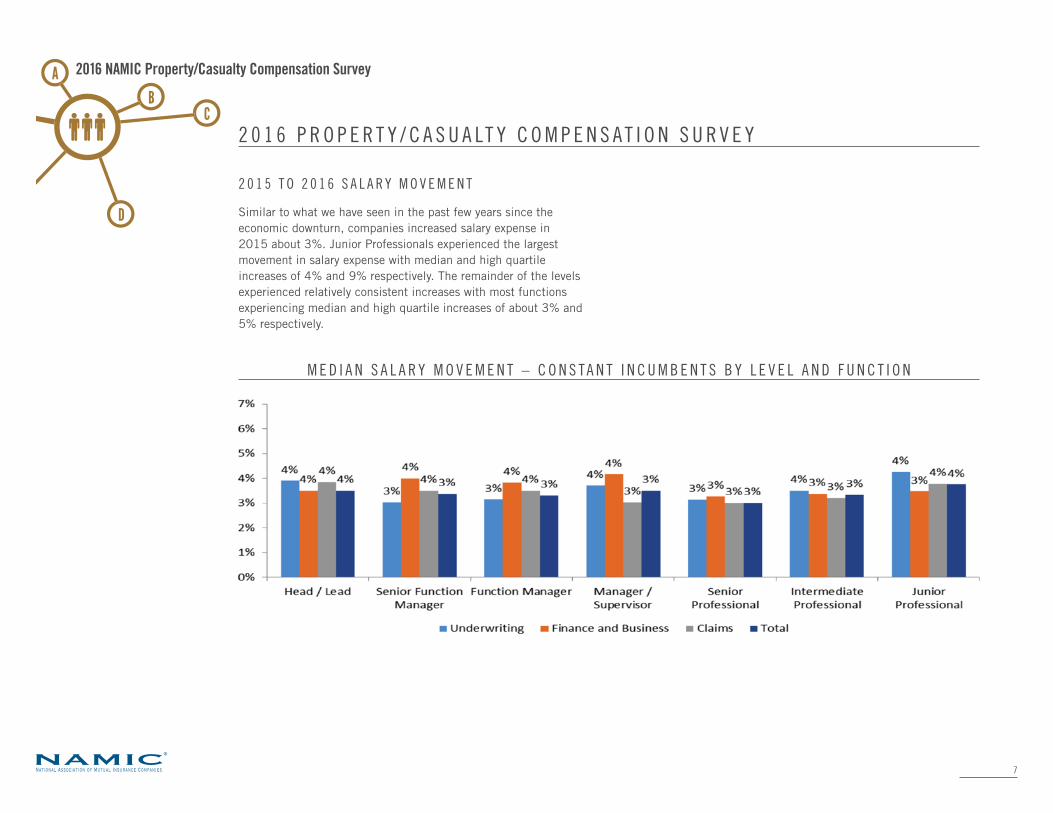
2 0 1 5 T O 2 0 1 6 S A L A R Y M O V E M E N T
Similar to what we have seen in the past few years since the economic downturn, companies increased salary expense in 2015 about 3%. Junior Professionals experienced the largest movement in salary expense with median and high quartile increases of 4% and 9% respectively. The remainder of the levels experienced relatively consistent increases with most functions experiencing median and high quartile increases of about 3% and 5% respectively.
7
2016 NAMIC Property/Casualty Compensation Survey
M E D I A N S A L A R Y M O V E M E N T – C O N S T A N T I N C U M B E N T S B Y L E V E L A N D F U N C T I O N

2 0 1 6 U . S . E X P L A N A T I O N O F S U R V E Y F O R M A T
Compensation levels for each of the positions covered by this year’s survey are summarized on exhibits presenting separate data on salaries, bonuses, total cash incentives, total cash compensation, long-term/deferred awards, and total compensation. Summary statistics for each element of pay are calculated independently; (i.e., they are not necessarily paid by the same organization and when added together typically will not equal total compensation).
Exhibit I contains a sample of a survey results page. Each survey results page in the report covers a single survey position, a combination of specializations at one position level, or a composite of two position levels. For some surveys, specializations for a position level are shown on a summary page covering 2016 salary, 2015 total cash and 2015 total compensation levels.
All data element names and definitions can be found in the 2016 Global Compensation Survey Data Collection Guide. The guide can be found on the Client Portal homepage at https://mclaganonline.com under “Reference Materials” on the home page.
Commonly used data elements in the PDF, Excel, and MDB results include:
• 2015 Salary: Annual salary rate as of July 1, 2015. Data is reflective of full-time equivalents and is reported on an annual basis.
• 2015 Cash Bonus: All cash payments related to 2015 performance year incentive plans (whether paid in 2015 or 2016). Cash Bonus also includes equity or deferred cash awards that vest immediately or within the calendar year that they were granted. Includes deferrals that have a vesting period of less than one year (i.e., 3- or 6-month vesting periods). May be referred to at some firms as their upfront deferral. Prior year deferrals paid out in 2015 and recent
long-term incentive grants (e.g., stock, options, mandatory cash deferrals) are excluded. Statistics include all individuals eligible for a bonus, whether or not they actually received a bonus for 2015 performance. Statistics on bonus levels exclude individuals who were ineligible for a bonus.
• 2015 Commissions: Commissions earned for 2015 performance, whether paid in 2015 or early 2016 (shown only in applicable surveys). Statistics on commission levels exclude individuals who did not receive commissions.
• 2015 Total Cash Incentives: The sum of cash bonus, cash performance fees, and commissions (shown separately in applicable surveys).
• 2015 Total Cash: The sum of 2015 salary, cash bonus, cash performance fees, and commissions.
• 2015 Overtime: Overtime paid in 2015.
• 2015 Long-Term/Deferred Awards: Long-term awards is the calculated summation of all applicable compensation elements: deferred cash, options, restricted shares/units, performance vested awards, (both mandatory deferral and add-on LTIP), and other awards.
• 2015 Total Compensation: Total compensation is the sum of all applicable compensation elements: salary, cash incentives, long-term/deferred incentives, overtime, etc.
• 2016 Salary: Annual salary rate as of the most recent salary review (typically March/April 1, 2016) for the incumbent. Data is reflective of full-time equivalents and is reported on an annual basis.
8
2016 NAMIC Property/Casualty Compensation Survey
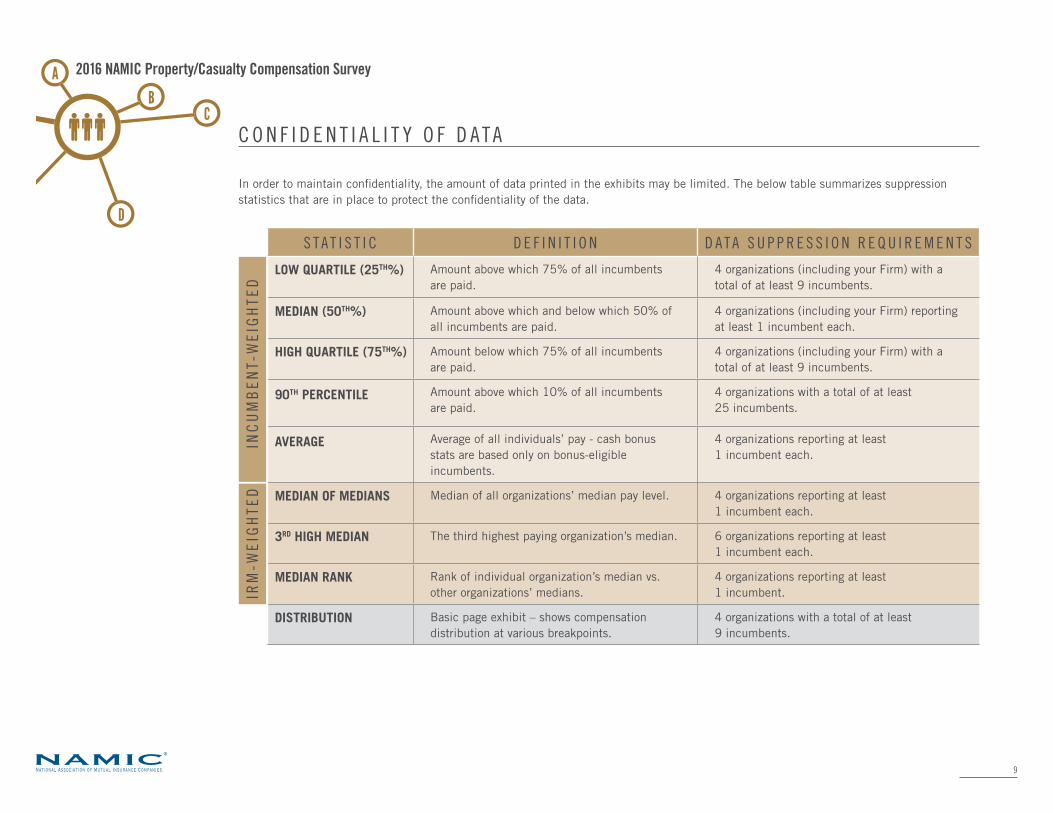
C O N F I D E N T I A L I T Y O F D A T A
In order to maintain confidentiality, the amount of data printed in the exhibits may be limited. The below table summarizes suppression statistics that are in place to protect the confidentiality of the data.
S T A T I S T I C D E F I N I T I O N D A T A S U P P R E S S I O N R E Q U I R E M E N T S
LOW QUARTILE (25TH%) Amount above which 75% of all incumbents are paid.
4 organizations (including your Firm) with a total of at least 9 incumbents.
MEDIAN (50TH%) Amount above which and below which 50% of all incumbents are paid.
4 organizations (including your Firm) reporting at least 1 incumbent each.
HIGH QUARTILE (75TH%) Amount below which 75% of all incumbents are paid.
4 organizations (including your Firm) with a total of at least 9 incumbents.
90TH PERCENTILE Amount above which 10% of all incumbents are paid.
4 organizations with a total of at least 25 incumbents.
AVERAGE Average of all individuals’ pay - cash bonus stats are based only on bonus-eligible incumbents.
4 organizations reporting at least 1 incumbent each.
MEDIAN OF MEDIANS Median of all organizations’ median pay level. 4 organizations reporting at least 1 incumbent each.
3RD HIGH MEDIAN The third highest paying organization’s median. 6 organizations reporting at least 1 incumbent each.
MEDIAN RANK Rank of individual organization’s median vs. other organizations’ medians.
4 organizations reporting at least 1 incumbent.
DISTRIBUTION Basic page exhibit – shows compensation distribution at various breakpoints.
4 organizations with a total of at least 9 incumbents.
9
2016 NAMIC Property/Casualty Compensation Survey
INC
UM
BE
NT-
WE
IGH
TED
IRM
-WE
IGH
TED

E X H I B I T 1 : S A M P L E S U R V E Y R E S U LT S (Page 1)
The “basic” pages in the PDF binder contain market data, distributions, and data analysis by position.
1 0
2016 NAMIC Property/Casualty Compensation Survey

E X H I B I T 1 : S A M P L E S U R V E Y R E S U LT S (Page 2)
The “scope” pages in the PDF binder contain the same total cash, total compensation, and current year salary market data from the basic pages along with scoped cuts of the data by position, location, direct written premium size, and firm ownership type (i.e. stock or mutual).
The total number of firms and incumbents matched into each scoped job is listed on the right-hand side of the page.
1 1
2016 NAMIC Property/Casualty Compensation Survey