nama design and preparation - partnership on transparency ... · nama design and preparation:...
TRANSCRIPT

NAMA Design and Preparation:
Consultation on selecting priority
NAMAs for Lebanon
Ministry of Environment
The United Nations Development Programme

NAMA options for Lebanon
Partner institutions

Rehabilitation of Zouk & Jieh P.P. Hydro Development Micro Hydro Energy
Waste to Energy from WWTP HFO Conditioning
By Karim Osseiran
Energy Consultant at the MoEW
22 May 2013
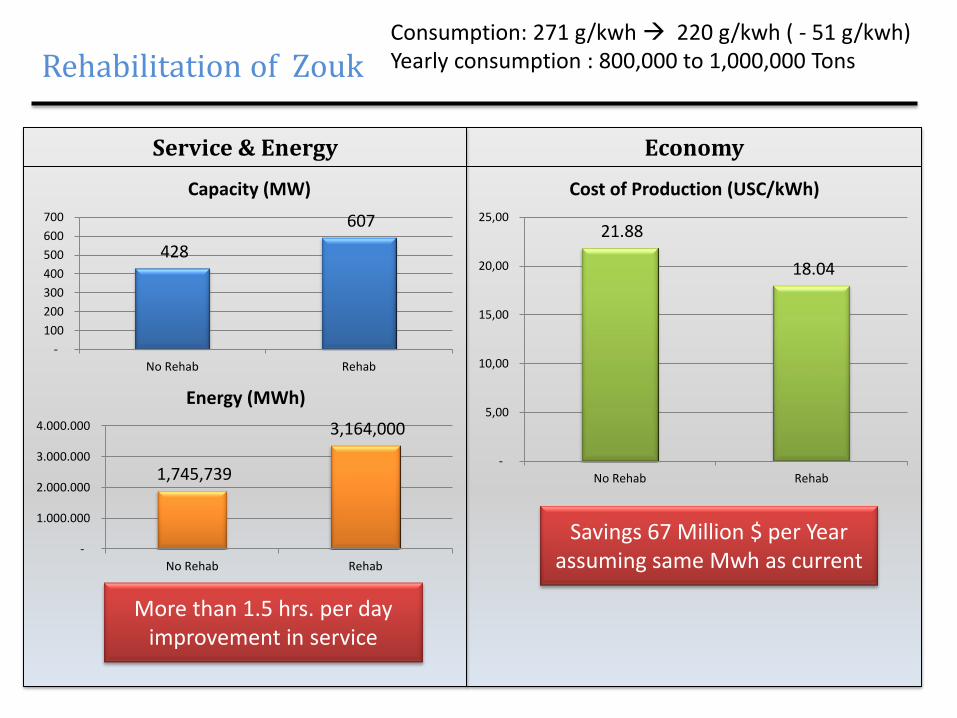
Economy
Rehabilitation of Zouk
Service & Energy
428
607
-
100
200
300
400
500
600
700
No Rehab Rehab
Capacity (MW)
1,745,739
3,164,000
-
1.000.000
2.000.000
3.000.000
4.000.000
No Rehab Rehab
Energy (MWh)
21.88
18.04
-
5,00
10,00
15,00
20,00
25,00
No Rehab Rehab
Cost of Production (USC/kWh)
Savings 67 Million $ per Year assuming same Mwh as current
More than 1.5 hrs. per day improvement in service
Consumption: 271 g/kwh 220 g/kwh ( - 51 g/kwh) Yearly consumption : 800,000 to 1,000,000 Tons

Economy
Rehabilitation of Jieh
Service & Energy
227
326
-
100
200
300
400
500
600
700
No Rehab Rehab
Capacity (MW)
1,016,000
1,704,000
-
1.000.000
2.000.000
3.000.000
4.000.000
No Rehab Rehab
Energy (MWh)
23.27
20.78
-
5,00
10,00
15,00
20,00
25,00
No Rehab Rehab
Cost of Production (USC/kWh)
Savings 49 Million $ per Year assuming same Mwh as current
More than 0.5 hrs. per day improvement in service
Consumption: 315 g/kwh 245 g/kwh ( - 70 g/kwh) Yearly Consumption : around 500,000 Tons

1- Rehabilitation & Upgrade of Existing Hydro Plants : Will increase the available Hydro generation capacity at least
from 190 to 282 MW (+ 92 MW)
2- Installation of New Hydro Plants – Master Plan:
32 new sites were identified as follows:
- Around 263 MW (1,271 GWh/y) with a cost of 667 M.$ in Run of River scheme
- Around 368 MW (1,363 GWh/y) with a cost of 772 M.$ in Peak scheme
25 of these are economically viable with Minimum Selling Tariff < 12 $c/kWh:
- Around 233 MW (1,126 GWh/y) with a cost of 560 M.$ in Run of River scheme
- Around 315 MW (1,217 GWh/y) with a cost of 665 M.$ in Peak scheme
Hydro Development Possibilities

Mechmech
Qarn
El Mara
Sir (Sukkar)
Sir (Bared sup)
Qattine
El Ouatié
Bared
Kannoubin
Bchanine
Beit Chlala)
Boustane
Mseilha
Hdaine
Janneh*
Ibrahim 4
Chabrouh
Mayrouba
Boqaata*
BlatDaraya*
Dachouniyé
Rechmaya
Mtaile
El Boum
Jezzine
Aval Joun
Chamra*
Yammouneh0,0
1,0
2,0
3,0
4,0
5,0
6,0
7,0
8,0
9,0
10,0
11,0
12,0
0 2 4 6 8 10 12 14 16 18 20
Impa
ct e
nvir
onne
men
tal
Tarif de vente minimum du kWh [$cts]
résultats de l'analyse multicritères
Impa
ct e
nvir
onne
men
tal c
rois
sant
Niveau 1
Niveau 2
Niveau 3
Ther
miq
ue a
u ga
z
Ther
miq
ue H
FO
Level 1
Level 2
Level 3
Results of Multi-criteria Analysis
Minimum kWh Selling Tariff [$cts]
Envi
ronm
enta
l Im
pact
* Chart from Sogreah Study
New Hydro Sites Feasibility Multi-Criteria Chart
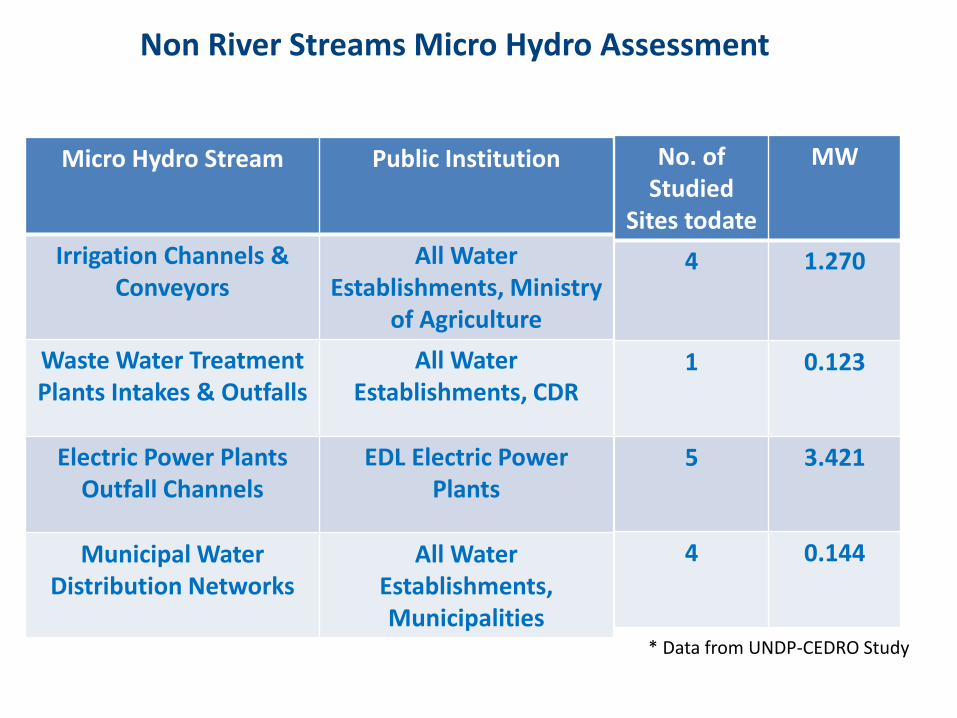
Micro Hydro Stream Public Institution
Irrigation Channels & Conveyors
All Water Establishments, Ministry
of Agriculture
Waste Water Treatment Plants Intakes & Outfalls
All Water Establishments, CDR
Electric Power Plants Outfall Channels
EDL Electric Power Plants
Municipal Water Distribution Networks
All Water Establishments, Municipalities
No. of Studied
Sites todate
MW
4 1.270
1 0.123
5 3.421
4 0.144
* Data from UNDP-CEDRO Study
Non River Streams Micro Hydro Assessment
Anaerobic Digestion Technology: Principle & Requirements
• Anaerobic digestion is a process in which organic matter from wet organic wastes (ie. Waste water sludge, liquid & solid manure, food processing wastes, slaughterhouse residues, agriculture residues etc.) is converted into Biogas by bacteria in the absence of oxygen.
• The Biogas including 60% Methane (CH4) is then collected and may be
used to generate Electricity & Heat (1 Nm3 Biogas 0.6 liters LFO). • Biogas reduces emissions by preventing methane release in the
atmosphere. Methane is 21 times stronger than carbon dioxide as a greenhouse gas.
• In addition, the AD process creates potentially valuable by-products,
such as High Ammonia content fertilizer from hygenized sludge, and/or liquid with available nutrients.
• Finally the AD process has the advantage of Odor Control & Sludge
volume reduction to (1/3).
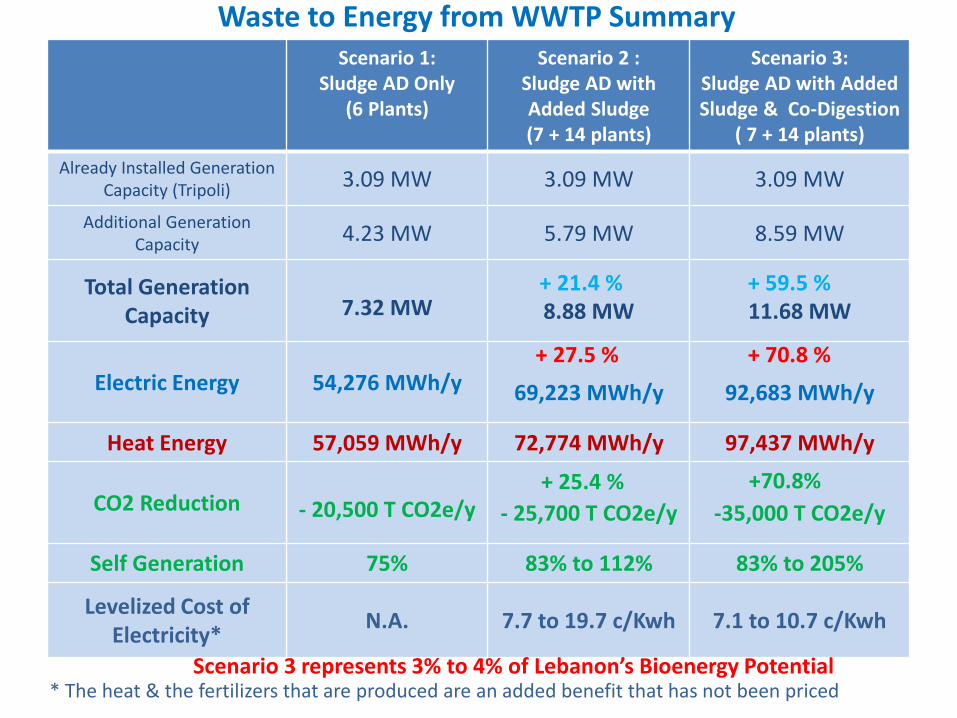
Scenario 1:
Sludge AD Only (6 Plants)
Scenario 2 : Sludge AD with Added Sludge (7 + 14 plants)
Scenario 3: Sludge AD with Added Sludge & Co-Digestion
( 7 + 14 plants)
Already Installed Generation Capacity (Tripoli)
3.09 MW 3.09 MW 3.09 MW
Additional Generation Capacity
4.23 MW 5.79 MW 8.59 MW
Total Generation Capacity 7.32 MW 8.88 MW 11.68 MW
Electric Energy 54,276 MWh/y 69,223 MWh/y 92,683 MWh/y
Heat Energy 57,059 MWh/y 72,774 MWh/y 97,437 MWh/y
CO2 Reduction - 20,500 T CO2e/y - 25,700 T CO2e/y -35,000 T CO2e/y
Self Generation 75% 83% to 112% 83% to 205%
Levelized Cost of Electricity*
N.A. 7.7 to 19.7 c/Kwh 7.1 to 10.7 c/Kwh
* The heat & the fertilizers that are produced are an added benefit that has not been priced
+ 21.4 % + 59.5 %
+ 27.5 % + 70.8 %
+ 25.4 % +70.8%
Scenario 3 represents 3% to 4% of Lebanon’s Bioenergy Potential
Waste to Energy from WWTP Summary

Variable Actual Baseline
Level of Emission Guaranteed Value of
Improvement
Actual Results following a 6 months Trial Period on one
Unit at Zouk
Particulate Matter – PM 536 mg/Nm3 50 % Reduction 87 % Reduction
Carbon Oxide – CO 841 ppm 80 % Reduction 91 % Reduction
Condensing Sulfur Trioxide – SO3
1.35 ppm 80 % Reduction 87 % Reduction
Nitrogen Oxides - Nox 510 ppm 15 % Reduction 24 % Reduction
Fly Ash Acidity - pH 4.2 3.5 Minimum 2.5 to 3.0
Boiler Cleanliness Clogging due to hard Deposits
Clean Clean & Old
Deposits Removed
Boiler Efficiency – ƞ 91.47 % 1% Increase 2% Increase
HFO Conditioning Solution : Summary Table

THANK YOU

Wind Farm NAMA
Hassan Harajli
22 May 2013

Large wind farm (500 MW) to support the national 12% RE target Introduction
Wind farm development in Lebanon, where Lebanon has at least 1500 MW of
economically viable wind power to source.
Technology
characteristics/hig
hlights
Renewable
Combustion- free
Competitive cost
Variable resource
Institutional and
organizational
requirements
The government has released the first bidding document for a 50-100 MW wind farm,
yet the regulatory framework of the released bid can be further solidified.
The large-scale renewable energy sector, esp. wind, needs a clear, transparent, and long-
term regulatory framework to be established.
Local expertise does not exist since there are no wind farms to date in Lebanon.
More capacity building will be required for wider penetration
Utility requires training and upgrading (manpower and software) to enable them to
handle the integration of variable resources of power.
Operation and
maintenance
Technology is developed. Tenderers will have experienced operators on board.
Scale/Size of
beneficiaries group
Nation-wide benefits, Lebanon will benefit as a whole in lowered blackouts
Disadvantages
Variable resource
Can cause problems with migratory birds if not well mitigated
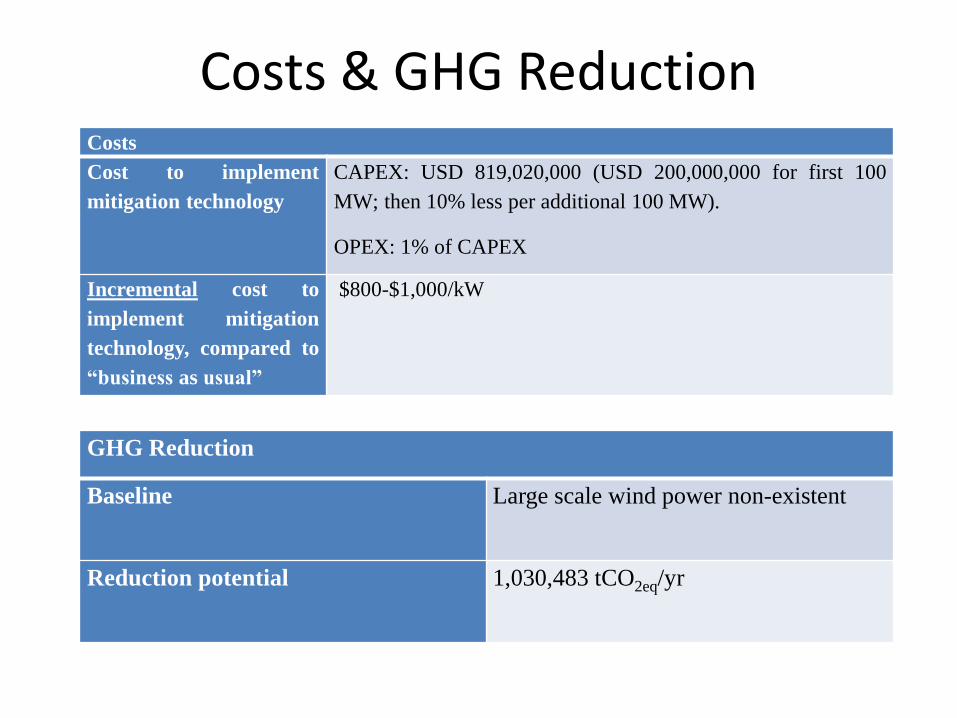
Costs & GHG Reduction Costs
Cost to implement
mitigation technology
CAPEX: USD 819,020,000 (USD 200,000,000 for first 100
MW; then 10% less per additional 100 MW).
OPEX: 1% of CAPEX
Incremental cost to
implement mitigation
technology, compared to
“business as usual”
$800-$1,000/kW
GHG Reduction
Baseline Large scale wind power non-existent
Reduction potential 1,030,483 tCO2eq/yr
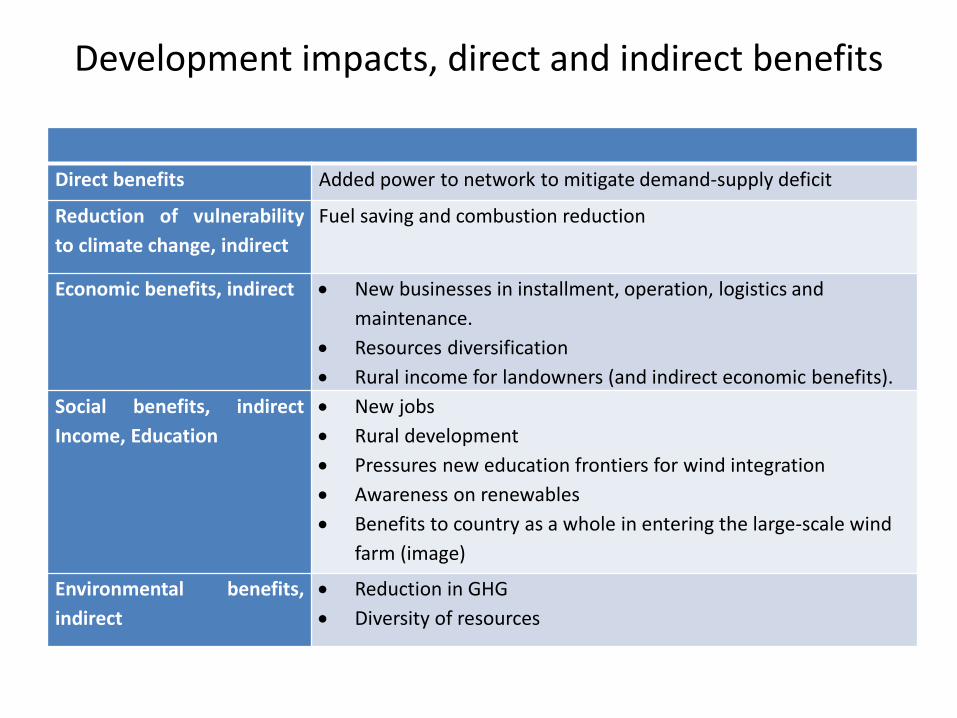
Development impacts, direct and indirect benefits
Direct benefits Added power to network to mitigate demand-supply deficit
Reduction of vulnerability
to climate change, indirect
Fuel saving and combustion reduction
Economic benefits, indirect
New businesses in installment, operation, logistics and
maintenance.
Resources diversification
Rural income for landowners (and indirect economic benefits).
Social benefits, indirect
Income, Education
New jobs
Rural development
Pressures new education frontiers for wind integration
Awareness on renewables
Benefits to country as a whole in entering the large-scale wind
farm (image)
Environmental benefits,
indirect
Reduction in GHG
Diversity of resources
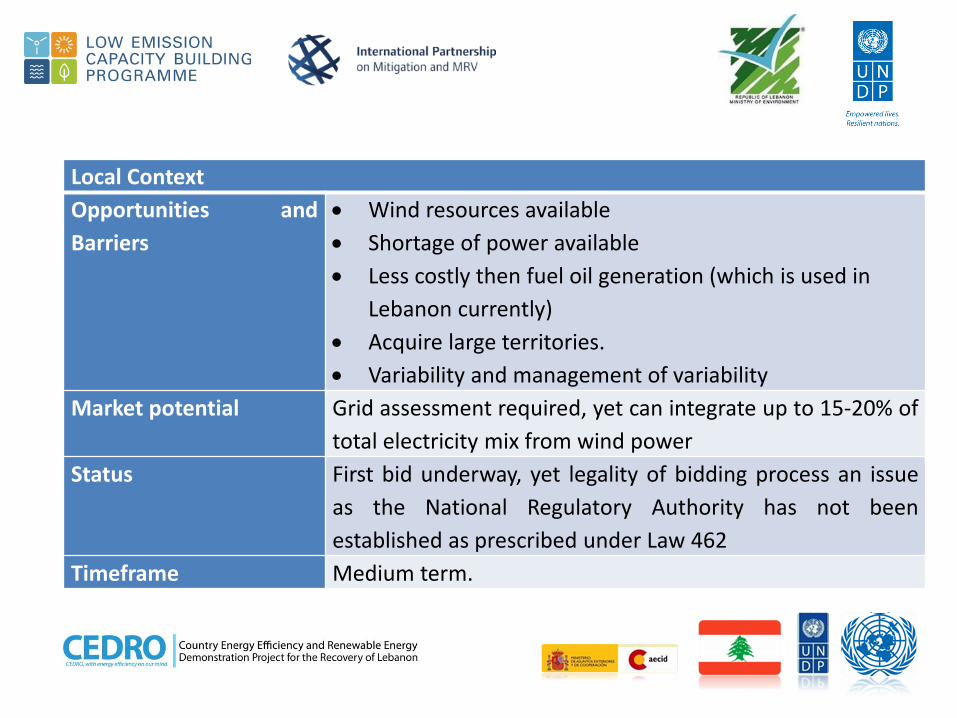
Local Context
Opportunities and
Barriers
Wind resources available
Shortage of power available
Less costly then fuel oil generation (which is used in
Lebanon currently)
Acquire large territories.
Variability and management of variability
Market potential Grid assessment required, yet can integrate up to 15-20% of
total electricity mix from wind power
Status First bid underway, yet legality of bidding process an issue
as the National Regulatory Authority has not been
established as prescribed under Law 462
Timeframe Medium term.

THANK YOU
Scaling up renewable energy and energy efficiency in the Lebanese
building sector
Rani Al Achkar, Energy Engineer Lebanese Center for Energy conservation (LCEC)
22 May 2013
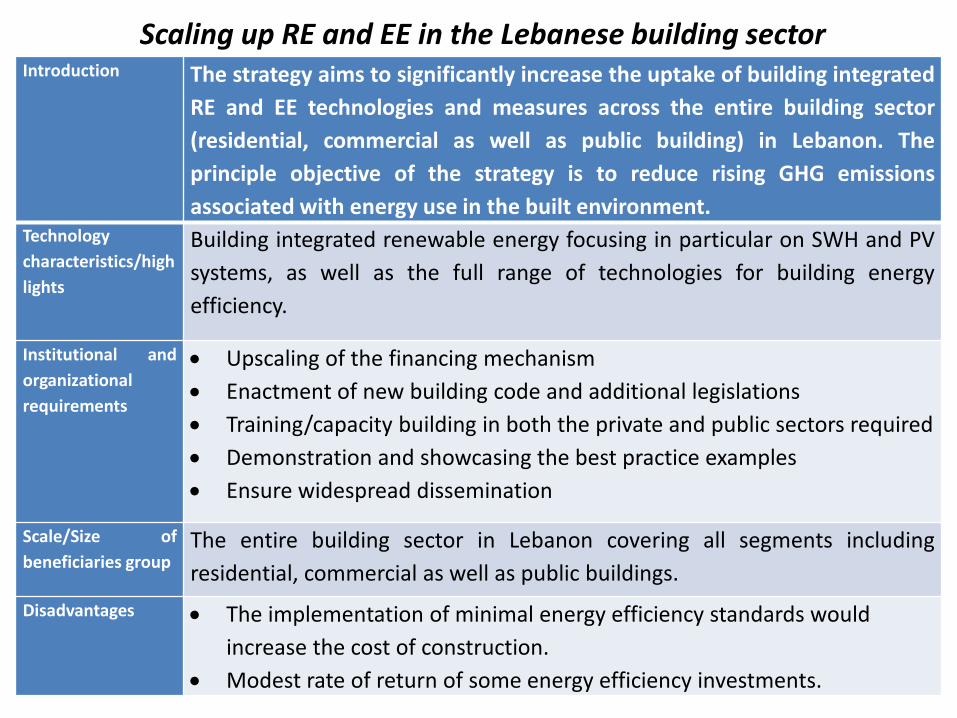
Scaling up RE and EE in the Lebanese building sector Introduction
The strategy aims to significantly increase the uptake of building integrated
RE and EE technologies and measures across the entire building sector
(residential, commercial as well as public building) in Lebanon. The
principle objective of the strategy is to reduce rising GHG emissions
associated with energy use in the built environment. Technology
characteristics/high
lights
Building integrated renewable energy focusing in particular on SWH and PV
systems, as well as the full range of technologies for building energy
efficiency.
Institutional and
organizational
requirements
Upscaling of the financing mechanism
Enactment of new building code and additional legislations
Training/capacity building in both the private and public sectors required
Demonstration and showcasing the best practice examples
Ensure widespread dissemination
Scale/Size of
beneficiaries group The entire building sector in Lebanon covering all segments including
residential, commercial as well as public buildings.
Disadvantages
The implementation of minimal energy efficiency standards would
increase the cost of construction.
Modest rate of return of some energy efficiency investments.

Scaling up RE and EE in the Lebanese building sector
SWH 0% loan for households
Credit Line/ Loan Facility 3-5% (EIB/
Kfw/ AFD)
NAMA Comp. 2Building
Code
NAMA Component 5: Marketing
Expected 2013 NAMAComp 3
Training/ CapacityBuilding
NAMAComp 4Demon-stration
NAMA Component 1
0%interest loan(Subsidized by national budget with
limited ceiling)
NEEREA
NAMA
Bonus scheme(MEW –
200$/SWH)
Loan Guarantee for SMEs(Kafalat)
Grant Funding of 15% of loan for SMEs (EU)
Loan Guarantee for NGOs/ social projects (UNDP)
Global Solar Water Heating Market (UNDP/GEF)

Costs & GHG Reduction Costs
Cost to implement
mitigation technology
USD 49,000,000
Incremental cost to
implement mitigation
technology, compared to
“business as usual”
USD 17,000,000
GHG Reduction
Baseline Already installed 43,500 SWHs (2011), 615 kWp PV
systems benefitted from the existing financing
mechanism (since end of 2012).
3 million CFLs were distributed part of the Lebanese
CFL Replacement CDM project (2010).
Reduction potential Initial broad estimates suggest that the NAMA may lead
to total GHG emission reductions of over 14 mtCO2e until
2030.

Development impacts, direct and indirect benefits
Development impacts, direct and indirect benefits
Direct benefits Creation of new jobs in the energy technology and
energy services sector;
Improved energy system reliability and energy security
leading to reduced energy costs and greater productivity.
Economic benefits, indirect
More reliable electricity supply and increased access to
energy services for households. Reduced dependence on
private self generators will increase disposable incomes
of households given the high cost of private generation.
Social benefits, indirect
Income, Education
Higher living standards and health benefits through
improved building stock.
Environmental benefits,
indirect
Improvement of local environmental quality, e.g.
reduction of noise and pollution from diesel generators.

Local Context
Opportunities and Barriers
Local Context
Financial Higher cost of RE and EE technologies and high cost of retrofitting for
older buildings
Access to capital (esp. as smaller projects and energy efficiency
projects are not attractive for commercial banks)
Risk perception of banks of RE and EE technologies
Customs increase on RE technologies by Lebanese authorities
Information Lack of awareness and information (general public)
Lack of technical expertise/ know how (institutions, banks, engineers)
Lack of building data and weather data
Regulatory The fact that Law 462 is not applied, which grants monopoly rights to
EDL to supply electricity and prevents widespread access to feed into
the national grid
Lack of mandatory building code for energy performance
Technical Urban structure (shading of buildings reduces solar efficiency)
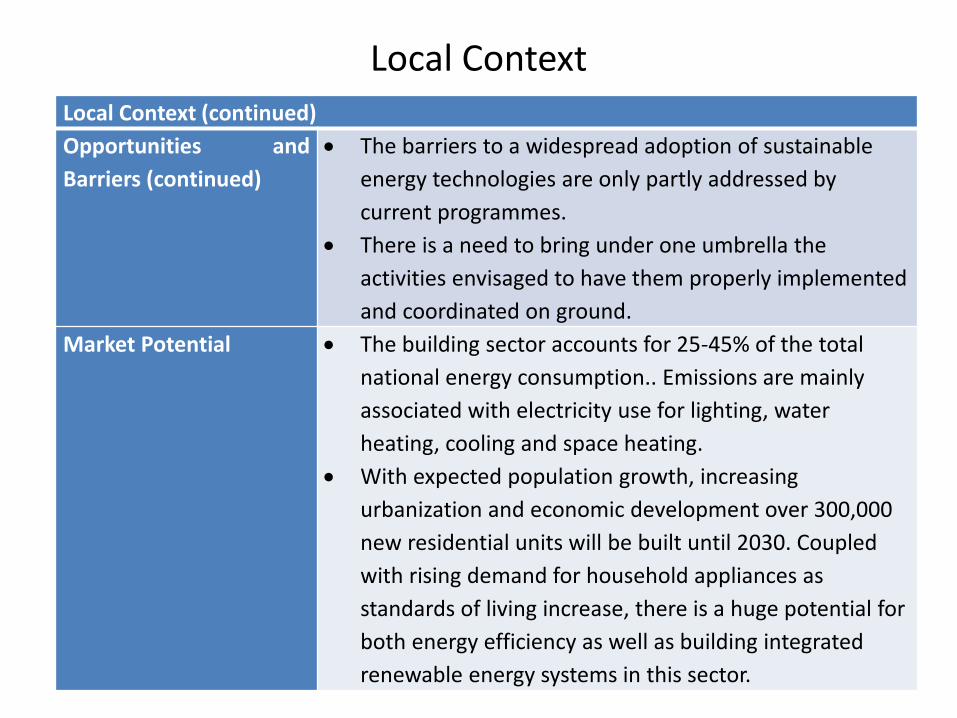
Local Context (continued)
Opportunities and
Barriers (continued)
The barriers to a widespread adoption of sustainable
energy technologies are only partly addressed by
current programmes.
There is a need to bring under one umbrella the
activities envisaged to have them properly implemented
and coordinated on ground.
Market Potential The building sector accounts for 25-45% of the total
national energy consumption.. Emissions are mainly
associated with electricity use for lighting, water
heating, cooling and space heating.
With expected population growth, increasing
urbanization and economic development over 300,000
new residential units will be built until 2030. Coupled
with rising demand for household appliances as
standards of living increase, there is a huge potential for
both energy efficiency as well as building integrated
renewable energy systems in this sector.
Local Context
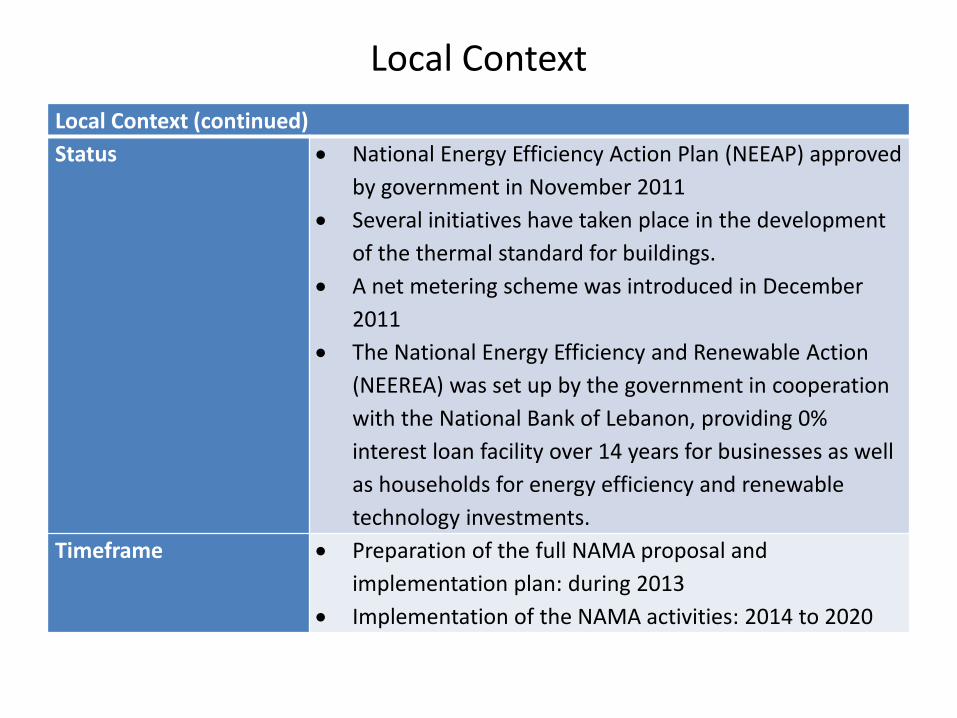
Local Context (continued)
Status National Energy Efficiency Action Plan (NEEAP) approved
by government in November 2011
Several initiatives have taken place in the development
of the thermal standard for buildings.
A net metering scheme was introduced in December
2011
The National Energy Efficiency and Renewable Action
(NEEREA) was set up by the government in cooperation
with the National Bank of Lebanon, providing 0%
interest loan facility over 14 years for businesses as well
as households for energy efficiency and renewable
technology investments.
Timeframe Preparation of the full NAMA proposal and
implementation plan: during 2013
Implementation of the NAMA activities: 2014 to 2020
Local Context
Thank you!
Ministry of Energy and Water (MEW) Corniche du Fleuve, 1st Floor
Room 303, Beirut, Lebanon
www.lcecp.org.lb

Photovoltaic power station (10MW) to support the national 12% RE
target
Dr. Farid Chaaban
22 May 2013
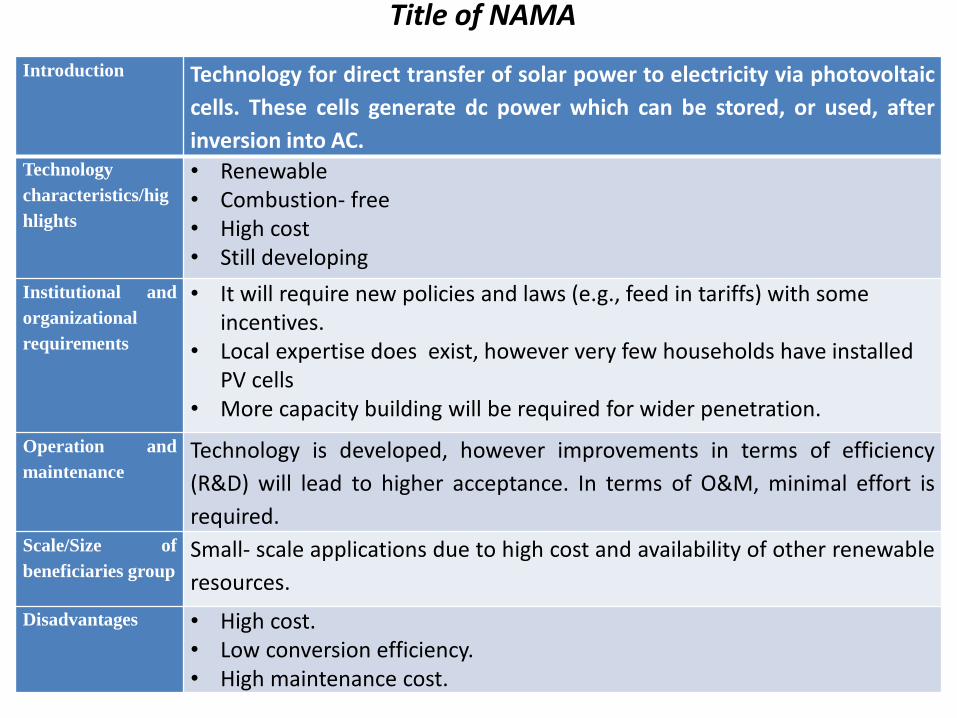
Title of NAMA
Introduction
Technology for direct transfer of solar power to electricity via photovoltaic
cells. These cells generate dc power which can be stored, or used, after
inversion into AC. Technology
characteristics/hig
hlights
• Renewable • Combustion- free • High cost • Still developing
Institutional and
organizational
requirements
• It will require new policies and laws (e.g., feed in tariffs) with some incentives.
• Local expertise does exist, however very few households have installed PV cells
• More capacity building will be required for wider penetration.
Operation and
maintenance Technology is developed, however improvements in terms of efficiency
(R&D) will lead to higher acceptance. In terms of O&M, minimal effort is
required. Scale/Size of
beneficiaries group Small- scale applications due to high cost and availability of other renewable
resources.
Disadvantages
• High cost. • Low conversion efficiency. • High maintenance cost.
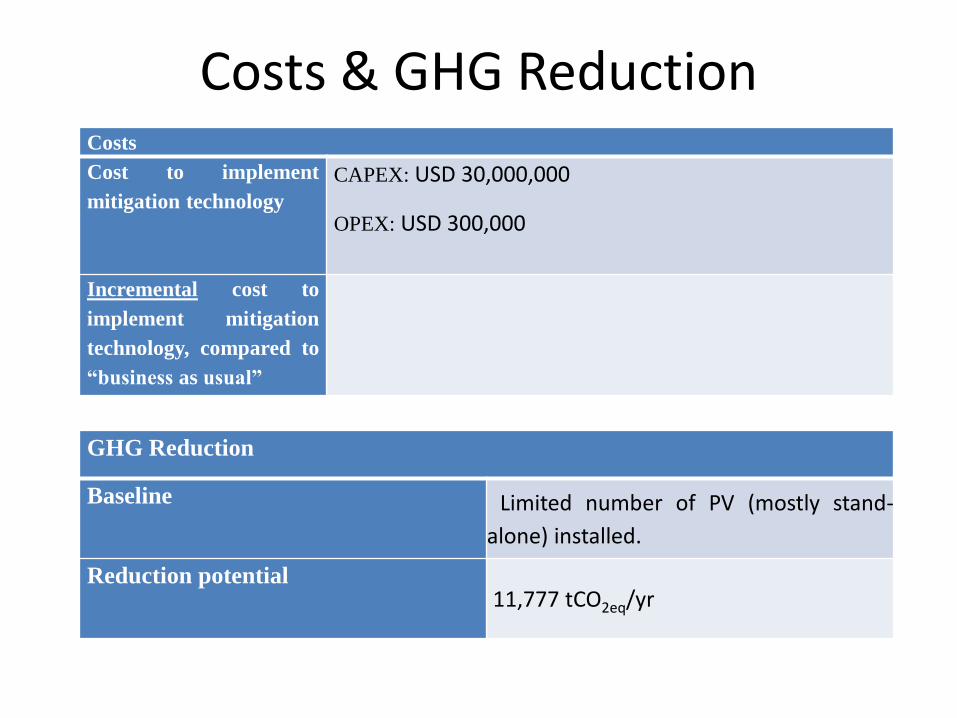
Costs & GHG Reduction Costs
Cost to implement
mitigation technology
CAPEX: USD 30,000,000
OPEX: USD 300,000
Incremental cost to
implement mitigation
technology, compared to
“business as usual”
GHG Reduction
Baseline Limited number of PV (mostly stand-
alone) installed.
Reduction potential 11,777 tCO2eq/yr
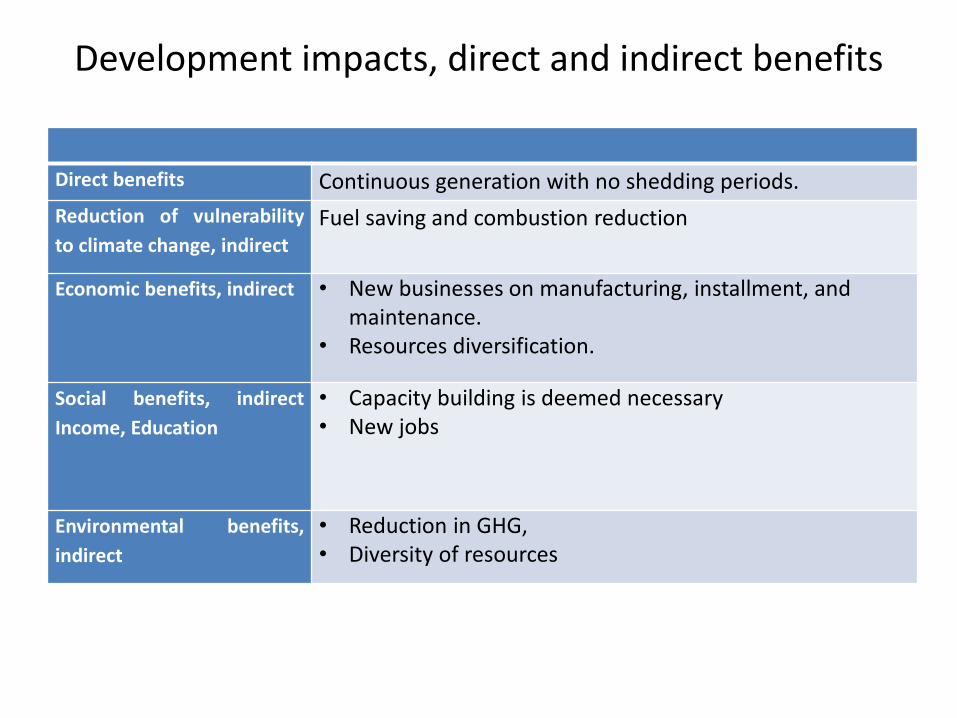
Development impacts, direct and indirect benefits
Direct benefits Continuous generation with no shedding periods.
Reduction of vulnerability
to climate change, indirect
Fuel saving and combustion reduction
Economic benefits, indirect
• New businesses on manufacturing, installment, and maintenance.
• Resources diversification.
Social benefits, indirect
Income, Education
• Capacity building is deemed necessary • New jobs
Environmental benefits,
indirect
• Reduction in GHG, • Diversity of resources
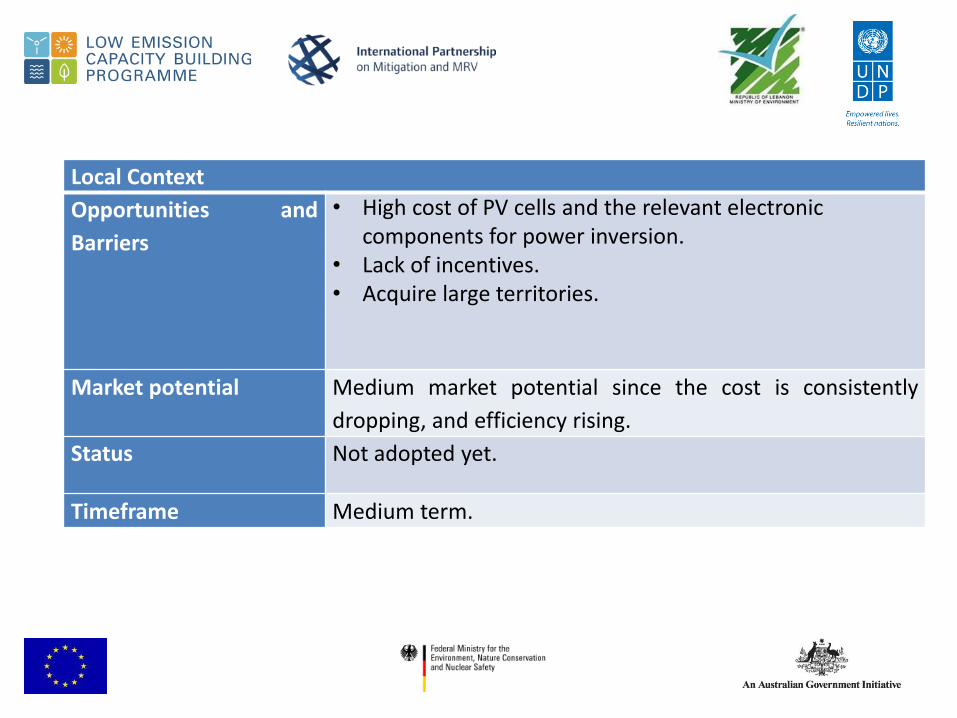
Local Context
Opportunities and
Barriers
• High cost of PV cells and the relevant electronic components for power inversion.
• Lack of incentives. • Acquire large territories.
Market potential Medium market potential since the cost is consistently
dropping, and efficiency rising.
Status Not adopted yet.
Timeframe Medium term.
Waste treatment through anaerobic digestion and electricity generation
(15-25MW)
Dr. Farid Chaaban
22 May 2013
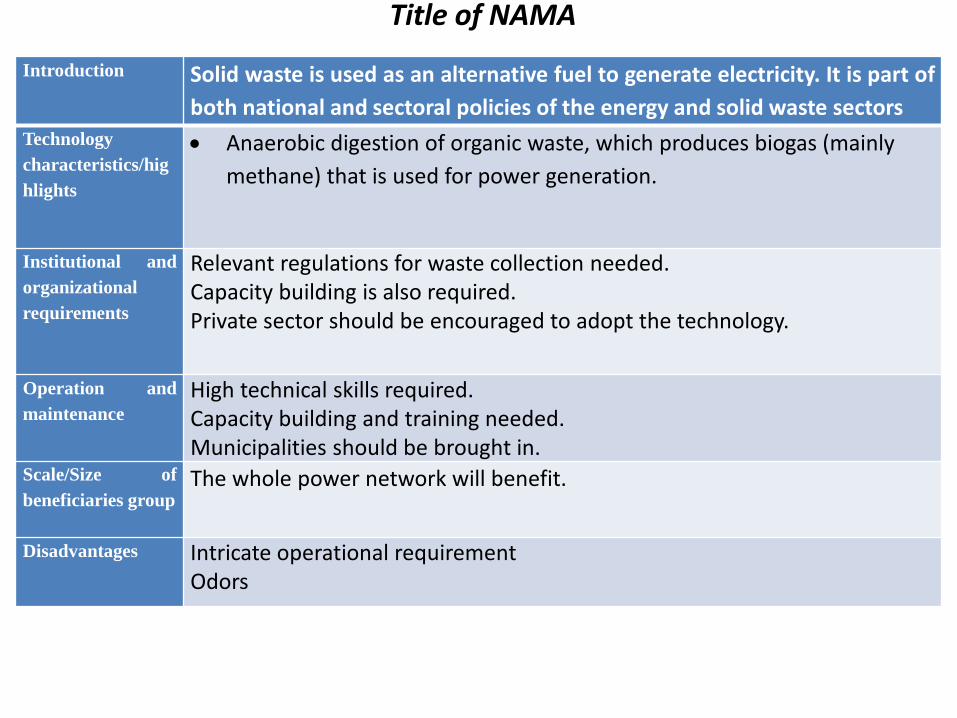
Title of NAMA
Introduction
Solid waste is used as an alternative fuel to generate electricity. It is part of
both national and sectoral policies of the energy and solid waste sectors
Technology
characteristics/hig
hlights
Anaerobic digestion of organic waste, which produces biogas (mainly
methane) that is used for power generation.
Institutional and
organizational
requirements
Relevant regulations for waste collection needed. Capacity building is also required. Private sector should be encouraged to adopt the technology.
Operation and
maintenance
High technical skills required. Capacity building and training needed. Municipalities should be brought in.
Scale/Size of
beneficiaries group The whole power network will benefit.
Disadvantages
Intricate operational requirement Odors

Costs & GHG Reduction Costs
Cost to implement
mitigation technology
CAPEX: USD 47,500,000 (USD 1,900/kW)
OPEX: USD 1,187,500 (2.5%/yr of CAPEX)
Incremental cost to
implement mitigation
technology, compared to
“business as usual”
GHG Reduction
Baseline No biomass or waste to energy plant is
installed or operational.
Reduction potential 95,688 tCO2eq/yr

Development impacts, direct and indirect benefits
Direct benefits 80%- efficient conversion process.
Reduction of vulnerability
to climate change, indirect
GHG emissions reduction. Smaller solid waste management problem.
Economic benefits, indirect
New jobs. Better solid waste management.
Social benefits, indirect
Income, Education
New expertise to be developed. Additional income for municipalities.
Environmental benefits,
indirect
Reduces amount of landfilled waste GHG emissions reduction, from the sectors
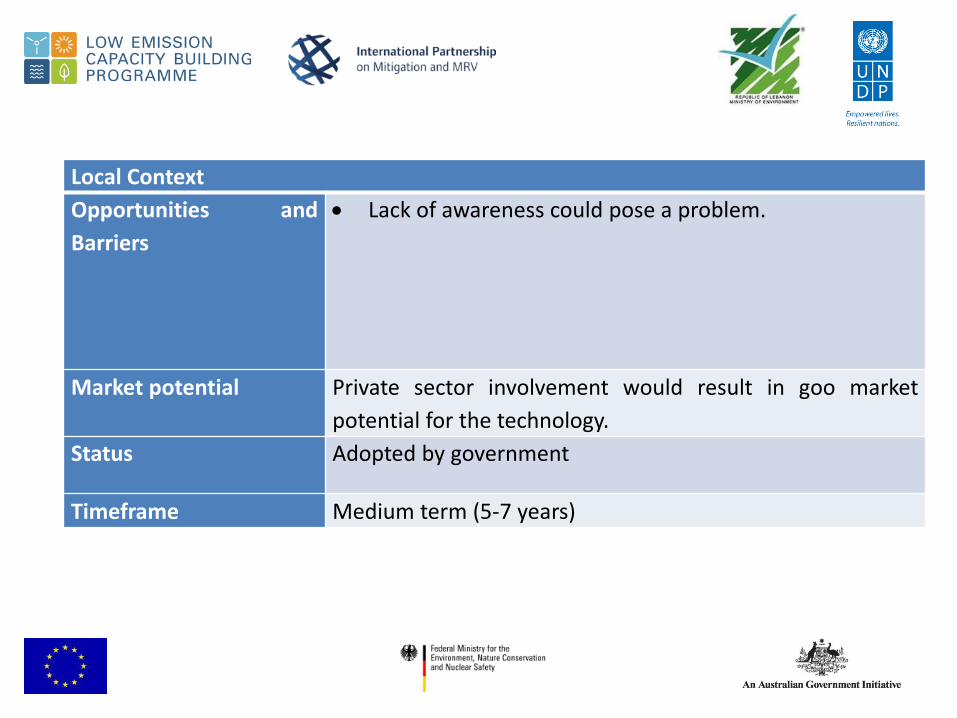
Local Context
Opportunities and
Barriers
Lack of awareness could pose a problem.
Market potential Private sector involvement would result in goo market
potential for the technology.
Status Adopted by government
Timeframe Medium term (5-7 years)
THANK YOU

Implementation of the National solid waste Strategy using WtE Technology
Bassam SABBAGH
Head of Urban Environment Service
- Ministry of Environment -
22 May 2013

Title of NAMA
Introduction Electricity Generation using solid waste as an alternative fuel
Technology
characteristics
• Very Advanced Technology, especially in last 10 – 15 years
• Low % in volume after incineration
• Generation of electricity from solid waste
Institutional and
organizational
requirements
• Issuing of an integrated solid waste management law with its applicable decrees. • Adopting a financing and cost recovery system. • Specific Actions to be taken by the government considering incentives, awarness,
indirect taxes, adoption of “ polluter pays “ principle • Some relevant regulations for waste collection needs to be amended. • Capacity building is required. • Private sector participation.
Operation and
maintenance
• O & M done by the private sector
• Initial cost paid by the government
• Cost of waste collection is the responsibility of the Municipalities
Scale/Size of
beneficiaries group
• Large benefit - EDL Economy financial sector lower pressure on LF
Environment
• Indirect benefit - Health Tourism
Disadvantages
• Lack of awareness
• Technology not very well known by the public
• High cost (but not higher then what we are paying now)

Costs & GHG Reduction Costs
Cost to implement
mitigation technology
CAPEX: around 1 Billion $
OPEX: 36 Million $
GHG Reduction
Baseline No Incinerations installed
Potential reduction
• 400,122 tCO2eq/yr (from fossil fuel replacement).
• Additional reduction from the entire solid waste
management strategy is anticipated.
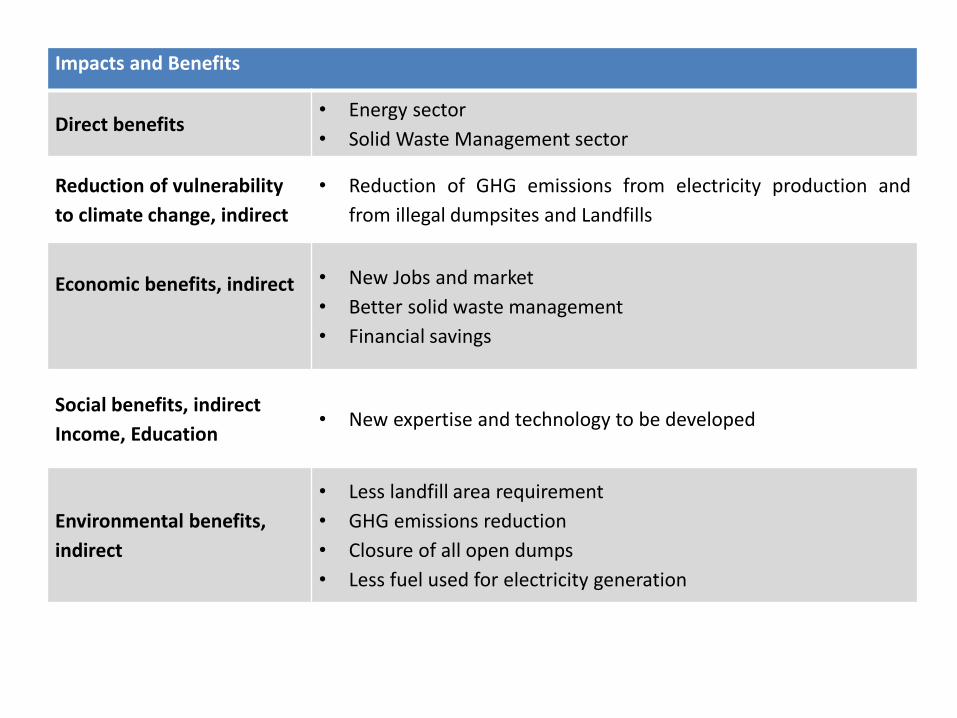
Impacts and Benefits
Direct benefits • Energy sector
• Solid Waste Management sector
Reduction of vulnerability
to climate change, indirect
• Reduction of GHG emissions from electricity production and
from illegal dumpsites and Landfills
Economic benefits, indirect
• New Jobs and market
• Better solid waste management
• Financial savings
Social benefits, indirect
Income, Education • New expertise and technology to be developed
Environmental benefits,
indirect
• Less landfill area requirement
• GHG emissions reduction
• Closure of all open dumps
• Less fuel used for electricity generation
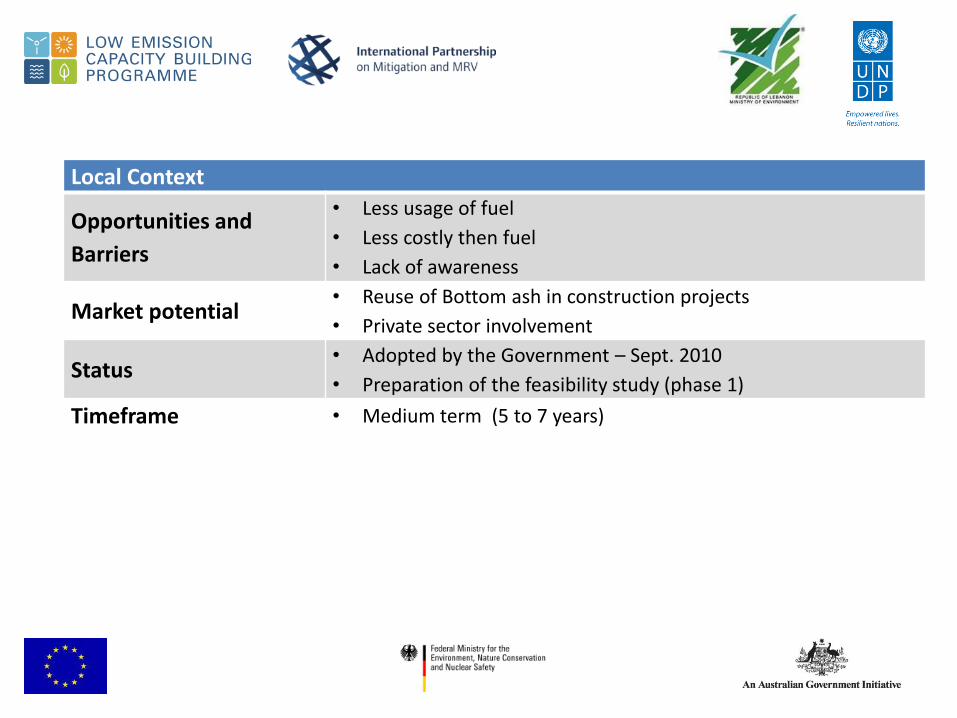
Local Context
Opportunities and
Barriers
• Less usage of fuel
• Less costly then fuel
• Lack of awareness
Market potential • Reuse of Bottom ash in construction projects
• Private sector involvement
Status • Adopted by the Government – Sept. 2010
• Preparation of the feasibility study (phase 1)
Timeframe • Medium term (5 to 7 years)

THANK YOU

NAMA Design and Preparation: Consultation on selecting priority NAMAs for Lebanon
Transport Sector Mitigations Actions: passenger cars swap program
bus mass transit on dedicated lanes
Charbel MANSOUR, Ph.D.
Assistant Professor, Lebanese American University
Wednesday May 22nd, 2013
Holiday Inn Dunes Hotel-Verdun
MANSOUR | NAMA Workshop | 46
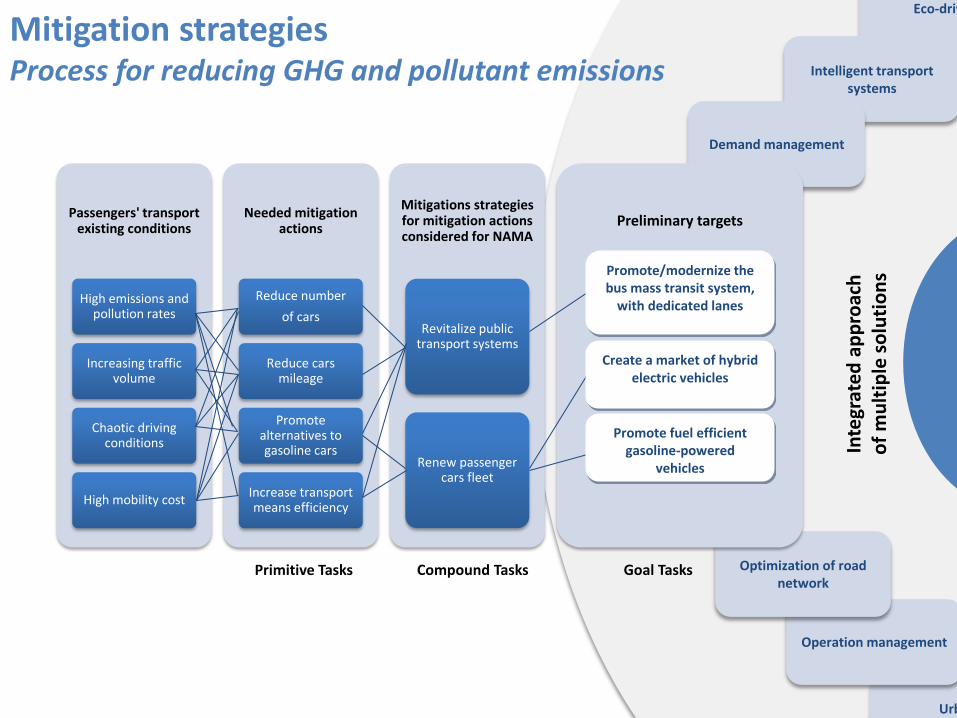
Passengers' transport existing conditions
High emissions and pollution rates
Increasing traffic volume
Chaotic driving conditions
High mobility cost
Needed mitigation actions
Reduce number
of cars
Reduce cars mileage
Promote alternatives to gasoline cars
Increase transport means efficiency
Mitigations strategies for mitigation actions considered for NAMA
Revitalize public transport systems
Renew passenger cars fleet
Primitive Tasks Compound Tasks Goal Tasks
Mitigation strategies Process for reducing GHG and pollutant emissions
Urban planning
Eco-driving
Intelligent transport systems
Demand management
Operation management
Optimization of road network
Preliminary targets
Inte
grat
ed
ap
pro
ach
o
f m
ult
iple
so
luti
on
s Promote/modernize the bus mass transit system,
with dedicated lanes
Create a market of hybrid electric vehicles
Promote fuel efficient gasoline-powered
vehicles
MANSOUR | NAMA Workshop | 47
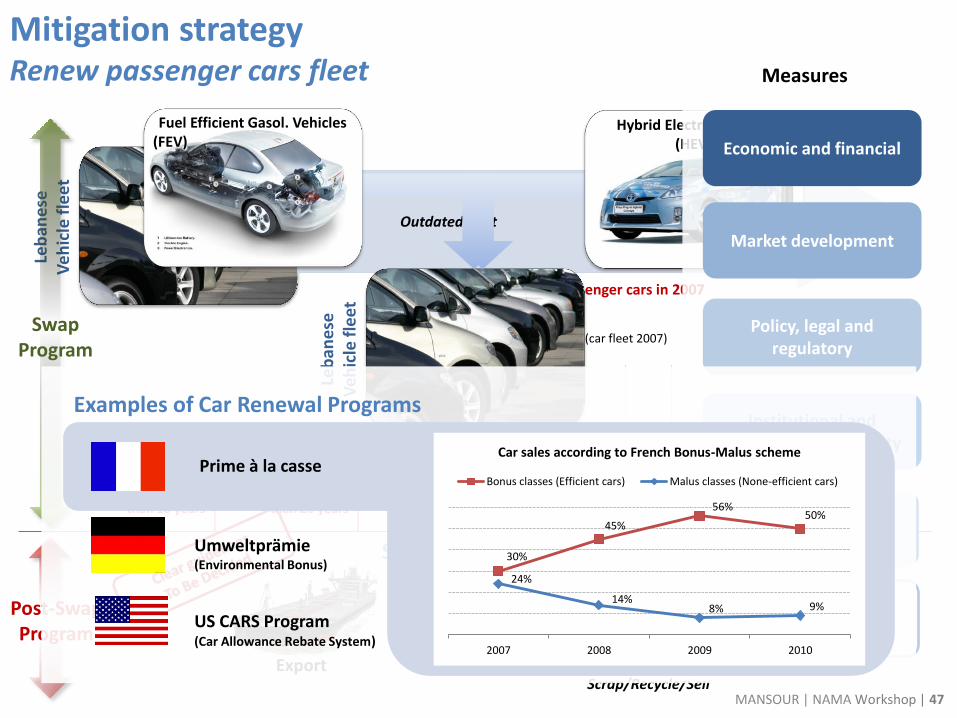
Scrappage Program
Export Car termination plant Scrap/Recycle/Sell
Mitigation strategy Renew passenger cars fleet
Leb
ane
se
Ve
hic
le f
leet
Outdated fleet Inefficient fleet
63% older than 20 years
90% older than 10 years
+1.2 million registered passenger cars in 2007
0,1%
1,2%
29,9%
32,5%
26,7%
3,4%
2,7%
2,6%
0,9%
0% 10% 20% 30% 40%
1950-1960
1961-1970
1971-1980
1981-1990
1991-2000
2001-2002
2003-2004
2005-2006
2007-2008
Model year distribution (car fleet 2007)Le
ban
ese
V
eh
icle
fle
et
up to 650,000 car unit over 8-10 years (63% older than 20 years)
Swap Program
Post-Swap Program
Hybrid Electric Vehicles (HEV)
Fuel Efficient Gasol. Vehicles (FEV)
Measures
Economic and financial
Market development
Policy, legal and regulatory
Institutional and organizational capacity
Social awareness
Data monitoring and process validation
Examples of Car Renewal Programs
Umweltprämie (Environmental Bonus)
US CARS Program (Car Allowance Rebate System)
30%
45%
56% 50%
24%
14% 8% 9%
2007 2008 2009 2010
Car sales according to French Bonus-Malus scheme
Bonus classes (Efficient cars) Malus classes (None-efficient cars)Prime à la casse
MANSOUR | NAMA Workshop | 48
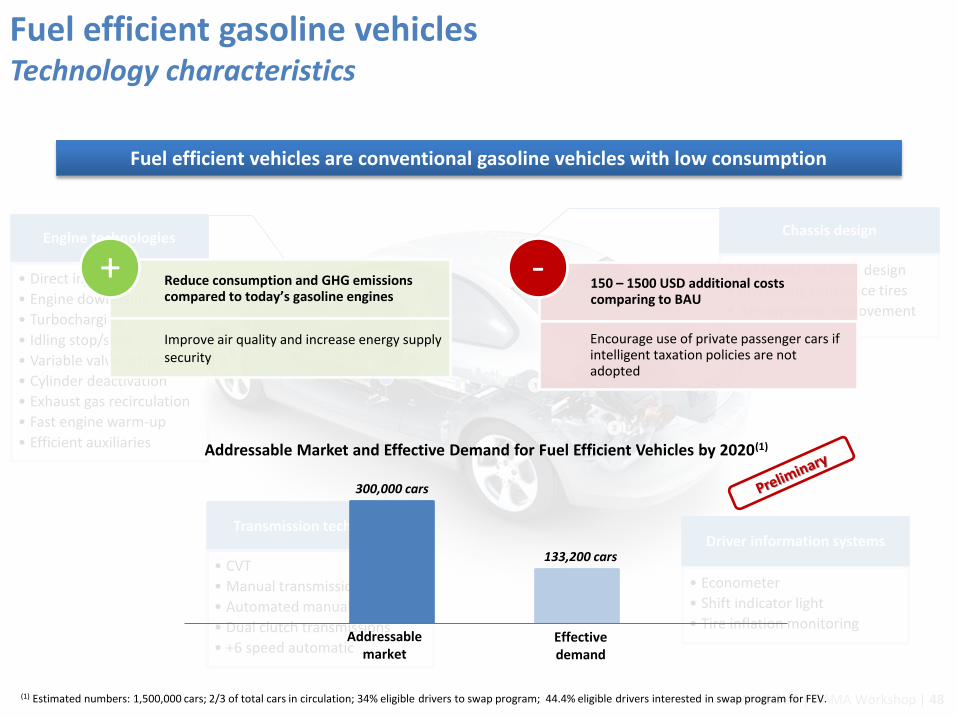
Fuel efficient gasoline vehicles Technology characteristics
Fuel efficient vehicles are conventional gasoline vehicles with low consumption
Driver information systems
• Econometer
• Shift indicator light
• Tire inflation monitoring
Engine technologies
• Direct injection
• Engine downsizing
• Turbocharging
• Idling stop/start
• Variable valve actuation
• Cylinder deactivation
• Exhaust gas recirculation
• Fast engine warm-up
• Efficient auxiliaries
Transmission technologies
• CVT
• Manual transmissions
• Automated manual
• Dual clutch transmissions
• +6 speed automatic
Chassis design
• lightweight vehicle design
• low rolling resistance tires
• Aerodynamic improvement
Reduce consumption and GHG emissions compared to today’s gasoline engines
Improve air quality and increase energy supply security
+ 150 – 1500 USD additional costs comparing to BAU
Encourage use of private passenger cars if intelligent taxation policies are not adopted
-
Addressable market
Effective demand
300,000 cars
133,200 cars
(1) Estimated numbers: 1,500,000 cars; 2/3 of total cars in circulation; 34% eligible drivers to swap program; 44.4% eligible drivers interested in swap program for FEV.
Addressable Market and Effective Demand for Fuel Efficient Vehicles by 2020(1)

MANSOUR | NAMA Workshop | 49
Batteries
Fuel tank
Electric motor (Traction / Brake Energy Recovery)
Engine
Hybrid electric vehicles Technology characteristics
Engine stop when the vehicle is at rest and brake energy recovery
Reduce GHG, fuel consumption and improve air quality
Lower maintenance and operating costs than BAU
Similar driving range as BAU
Do not require additional infrastructure
+ 1000 - 4000 USD additional costs comparing to BAU after tax reforms
May require a battery change over the vehicle life
Increase hazard waste if policies not adopted
Encourage use of passenger cars if intelligent policies are not adopted
-
Addressable market
Effective demand
300,000 cars
20,000 cars
(2) Estimated numbers: 1,500,000 cars; 2/3 of total cars in circulation; 34% eligible drivers to swap program; 6.58% eligible drivers interested in swap program for HEV.
Addressable Market and Effective Demand for Hybrid electric Vehicles by 2020(2)

MANSOUR | NAMA Workshop | 50
Renew passenger cars fleet Fuel and CO2 savings potential in Greater Beirut Area (Baseline 2007)
35,7% 28,3%
17,1%
9,7%
0%
20%
40%
60%
80%
0
2
4
6
8
10
12
Sub-compact car Compact car Midsize car Large car
CO
2 S
avin
gs [
%]
Fuel
Co
nsu
mp
tio
n [
L/1
00
km
] Fuel Consumption Savings relative to Leb. fleet 2007
67%
52%
40% 37%
0%
20%
40%
60%
80%
0
2
4
6
8
10
12
Sub-compact car Compact car Midsize car Large car
CO
2 S
avin
gs [
%]
Fuel
Co
nsu
mp
tio
n [
l/1
00
km]
Fuel consumption Savings relative to Leb. fleet 2007
Hybrid Electric Vehicles
Fuel Efficient Gasoline Vehicles

MANSOUR | NAMA Workshop | 51
Renew passenger cars fleet Cost benefits analysis
53%
46%
54%
48%
42%
44%
46%
48%
50%
52%
54%
56%
0,0
0,1
0,2
0,3
0,4
0,5
Sub-compact fuel efficientcar
Compact fuel efficient car HEV StopStart HEV Full Hybrid
Co
st S
avin
gs [
%]
Rel
ativ
e b
enef
its
[USD
/pas
s.km
]
Car owners’ benefits relative to non-fuel efficient car
Average savings relative to non fuel efficient car (%) GBA peak GBA off-peak Rural
18%
0% 11%
-17% -30%
-10%
10%
30%
-0,10
-0,05
0,00
0,05
0,10
Sub-compact fuel efficientcar
Compact fuel efficient car HEV StopStart HEV Full Hybrid
Co
st S
avin
gs [
%]
Rel
ativ
e b
enef
its
[USD
/pas
s.km
]
Government's benefits relative to non-fuel efficient car
Average savings relative to non fuel efficient car (%) GBA peak GBA off-peak Rural
CBA is based on current figures of :
Tax levied on fuel imports
Road-usage fees
Custom duties excise tax
Cars VAT at import
Max hybrid car cost to allow a 100% government cost
recovery 23,000 USD
Specific transportation costs assessed in CBA:
Ownership cost
Operation cost
Air pollution
GHG emissions
Parking
Crash cost
Travel time
Congestion
Operation subsidies
Fuel tax revenues

MANSOUR | NAMA Workshop | 52
Renew passenger cars fleet Government’s cost and benefits: BAU 2020 v/s Mitigation Scenarios
8%
32,2%
48,3%
11,9%
BAU 2020(3) 1,500,000 passenger cars
10%
40% 45%
5%
Mitigation 1 - 2020(3) 1,500,000 passenger cars
120,000 FEV
20%
39%
35%
5% 0,7% 0,3%
Mitigation 2 - 2020(3) 1,500,000 passenger cars 155,000 FEV – 15,000 HEV
<1.4 liters
1.4-2.0
2.0-3.0
>3.0
hybrid stop/start
full hybrid
90.2M USD
56.0M USD
14.5M USD
107.8M USD
92.8M USD
40.7M USD Gov. subsidy (USD/yr)
Gov. forgone fuel tax (USD/yr)
Avg. Gov. total benefits (USD/yr)
Mitigation 1 - 2020 120,000 FEV
Mitigation 2 - 2020 155,000 FEV - 15,000 HEV
Go
v. C
ost
s
Go
v. C
ost
s
Government Costs and Benefits per year relative to non-fuel efficient cars in Greater Beirut Area(4)
(3) 2/3 of passenger cars assumed in circulation. (4) Costs and benefits are equally distributed along the program period. Average mileage assumed 16,000 km/yr. Driving patterns in GBA: 51% urban peak, 31% urban off-peak, 18% highway.
MANSOUR | NAMA Workshop | 53
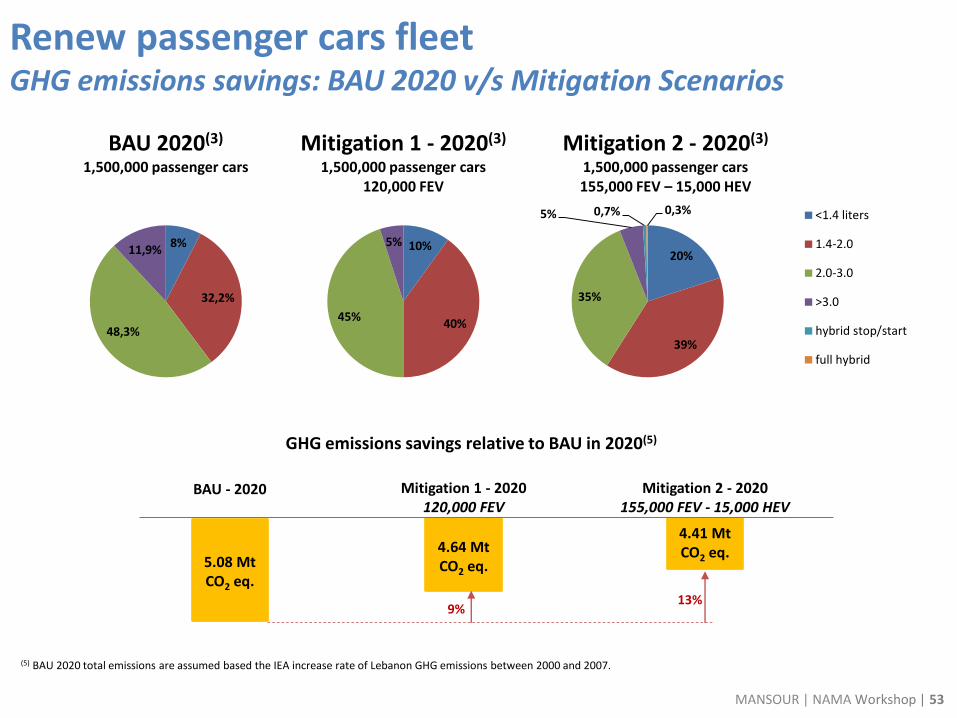
Renew passenger cars fleet GHG emissions savings: BAU 2020 v/s Mitigation Scenarios
8%
32,2%
48,3%
11,9%
BAU 2020(3) 1,500,000 passenger cars
10%
40% 45%
5%
Mitigation 1 - 2020(3) 1,500,000 passenger cars
120,000 FEV
20%
39%
35%
5% 0,7% 0,3%
Mitigation 2 - 2020(3) 1,500,000 passenger cars 155,000 FEV – 15,000 HEV
<1.4 liters
1.4-2.0
2.0-3.0
>3.0
hybrid stop/start
full hybrid
9%
Mitigation 1 - 2020 120,000 FEV
Mitigation 2 - 2020 155,000 FEV - 15,000 HEV
GHG emissions savings relative to BAU in 2020(5)
(5) BAU 2020 total emissions are assumed based the IEA increase rate of Lebanon GHG emissions between 2000 and 2007.
4.64 Mt CO2 eq.
4.41 Mt CO2 eq.
BAU - 2020
5.08 Mt CO2 eq.
13%

MANSOUR | NAMA Workshop | 54
Renew passenger cars fleet Action plan for FEV-HEV swap program
Exemption from custom and excise fees, registration fees,
and road usage fees at registration.
1 Create market
Give incentives
Payment of min salvage value (2500 USD) as down payment for car loan> Extension of loan period to 8-years. Reduce loan interest.
Reduce gradually max age of imported pre-owned vehicles to 3-
years with mileage lower than 100,000 km.
Adopt a Bonus-Malus tax policy where polluters pay more annual road-usage fees, and where taxes like the road
usage fees are reconsidered according to fuel efficiency and/or emissions rather than engine displacement.
Create a car scrappage program based on swapping current passenger cars with
hybrid and fuel efficient cars
Create a car termination plant that deals with the car termination process after the swap in
the scrappage program
Update decree 6603/1995 relating to standards on permissible levels of exhaust
fumes and exhaust quality to cover all types of vehicles
Update the vehicle inspection program requirements taking into consideration special requirements for hybrid cars’
inspection, in addition to mandating the presence of catalytic converters on conventional gasoline vehicles
Set up a mechanical inspection unit at the port of Beirut in charge of checking up the
emissions and safety standards of imported pre-owned cars before entering the country
Establish awareness campaign
Create Mobility Monitoring Indicators
(MMI) framework
2 Stop the
bleed
Economic and financial measures
3 Remove old
cars
Market development
4 Regulate car
imports
Policy, legal and regulatory
5 Close the tap
Institutional/ organizational
capacity
6 Reform wrong
perception
Social awareness
7 Monitor the
progress
Project monitoring and
validation
Priority sequence Measures Type
MANSOUR | NAMA Workshop | 55
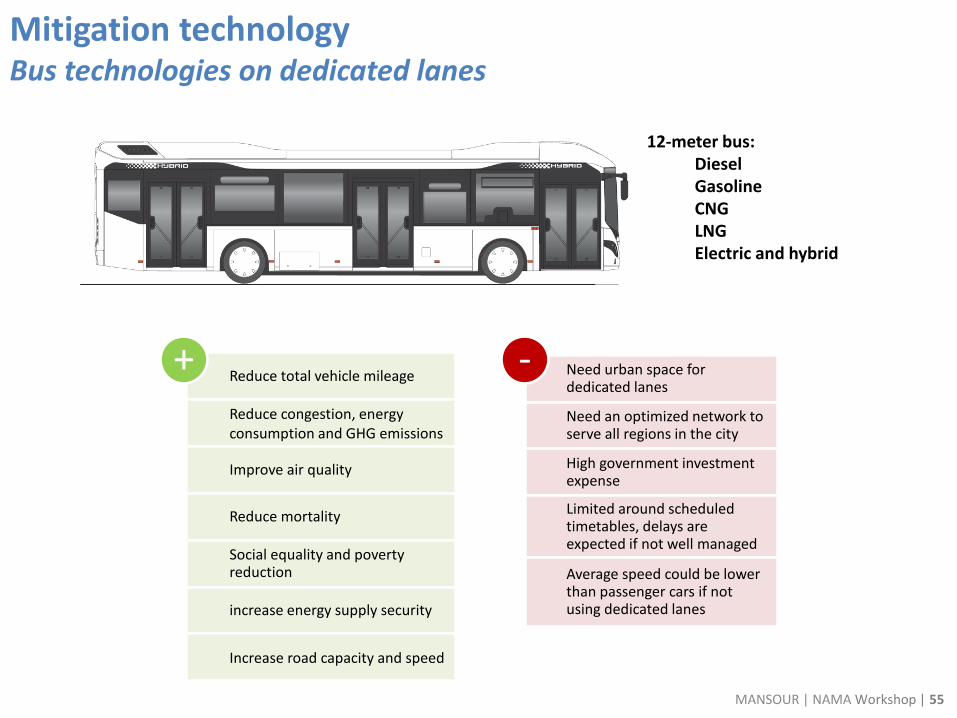
Mitigation technology Bus technologies on dedicated lanes
Reduce total vehicle mileage
Reduce congestion, energy consumption and GHG emissions
Improve air quality
Reduce mortality
Social equality and poverty reduction
increase energy supply security
Increase road capacity and speed
+ Need urban space for dedicated lanes
Need an optimized network to serve all regions in the city
High government investment expense
Limited around scheduled timetables, delays are expected if not well managed
Average speed could be lower than passenger cars if not using dedicated lanes
-
12-meter bus: Diesel Gasoline CNG LNG Electric and hybrid

MANSOUR | NAMA Workshop | 56
Bus mass transit on dedicated lanes Development impacts: Fuel and CO2 savings
0
20
40
60
80
100
120
140
160
180
5 10 15 20 25 30 35 40
Eff
icie
nc
y [
Pa
ss
.km
/ko
e]
Bus occupancy [pass/veh]
Electric and hybrid
Diesel
Gasoline
CNG
LNG
(1.5 pass/veh)
0
50
100
150
200
250
300
350
400
450
5 10 15 20 25 30 35 40
CO
2 e
mis
sio
ns [
g/p
ass.k
m]
Bus occupancy [pass/veh]
Diesel
Gasoline
CNG
LNG
(1.5 pass/veh)

MANSOUR | NAMA Workshop | 57
Bus mass transit on dedicated lanes Fuel cost savings
-60%
-40%
-20%
0%
20%
40%
60%
80%
100%
DieselBus
GasolineBus
CNG Bus PCEngine
<1.4
PCEngine1.4-2.0
PCEngine2.0-3.0
PCEngine
>3.0
75%
63% 74%
27%
17%
-4%
-45%
Cost savings relative to average car
Public transport with 15 pass/veh occupancy Passenger cars (PC) with 1 pass/veh
Egypt
Greece
Turkey
France
Germany
USA
Up to 88% savings relative to passenger car during rush hours (30 pass/veh)

MANSOUR | NAMA Workshop | 58
Bus mass transit on dedicated lanes Cost benefits analysis
53% 46% 54% 48%
89%
0%
20%
40%
60%
80%
100%
0,0
0,2
0,4
0,6
0,8
Sub-compact fuelefficient car
Compact fuelefficient car
HEV StopStart HEV Full Hybrid Diesel bus ondedicated lanes
Savi
ngs
[%
]
Re
lati
ve b
en
efit
s [U
SD/p
ass.
km]
Bus riders' benefits relative to non-fuel efficient car
Average savings relative to non fuel efficient car (%) GBA peak GBA off-peak Rural
18%
0%
11%
-17%
60%
-80%
-40%
0%
40%
80%
-0,20
-0,10
0,00
0,10
0,20
Sub-compact fuelefficient car
Compact fuelefficient car
HEV StopStart HEV Full Hybrid Diesel bus ondedicated lanes
Savi
ngs
[%
]
Re
lati
ve b
en
efit
s [U
SD/p
ass.
km]
Government's benefits relative to non-fuel efficient car
Average savings relative to non fuel efficient car (%) GBA peak GBA off-peak Rural
Specific transportation costs assessed in CBA:
Ownership cost
Operation cost
Air pollution
GHG emissions
Parking
Crash cost
Travel time
Congestion
Operation subsidies
Fuel tax revenues
MANSOUR | NAMA Workshop | 59
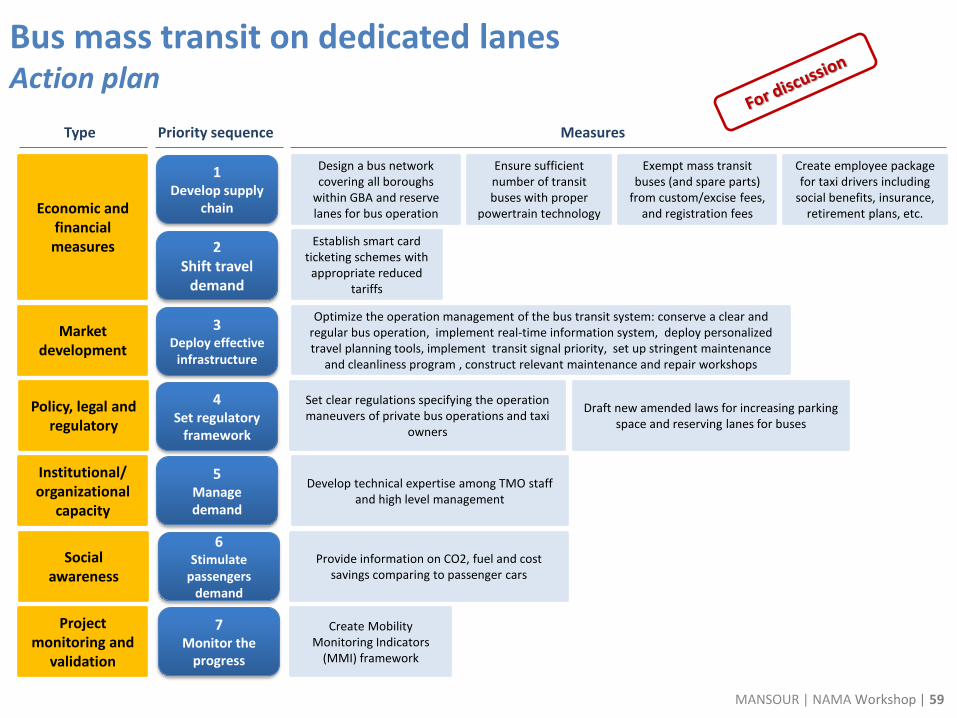
Bus mass transit on dedicated lanes Action plan
Design a bus network covering all boroughs
within GBA and reserve lanes for bus operation
1 Develop supply
chain
Ensure sufficient number of transit buses with proper
powertrain technology
Exempt mass transit buses (and spare parts)
from custom/excise fees, and registration fees
Establish smart card ticketing schemes with
appropriate reduced tariffs
Optimize the operation management of the bus transit system: conserve a clear and regular bus operation, implement real-time information system, deploy personalized travel planning tools, implement transit signal priority, set up stringent maintenance
and cleanliness program , construct relevant maintenance and repair workshops
Set clear regulations specifying the operation maneuvers of private bus operations and taxi
owners
Draft new amended laws for increasing parking space and reserving lanes for buses
Develop technical expertise among TMO staff and high level management
Provide information on CO2, fuel and cost savings comparing to passenger cars
Create Mobility Monitoring Indicators
(MMI) framework
2 Shift travel
demand
Economic and financial measures
3 Deploy effective
infrastructure
Market development
4 Set regulatory
framework
Policy, legal and regulatory
5 Manage demand
Institutional/ organizational
capacity
6 Stimulate
passengers demand
Social awareness
7 Monitor the
progress
Project monitoring and
validation
Priority sequence Measures Type
Create employee package for taxi drivers including
social benefits, insurance, retirement plans, etc.
