naiop 2012 texas shoot out case challenge
TRANSCRIPT

averick
evelopment
April 19, 2012| Lee Mazurek | Jason Turnbow | Eric Hendrickson | Tyler Clayton | Jeff Peanick | Nathan Beaman |

Introduction
Overview of Site
Functional Design
Linkages
Economic Base
Financial Analysis
Questions & Answers


Dallas Potential
“Great cities are the product of four
qualities: quality of place, quality of
talent, quality of opportunity, and
quality of leadership.”
Ms. Carol ColettaPresident & CEO of CEOs for Cities

Recommendation
Multi-use Development With High-Rise Office
Buildings, Retail Space, A Residential Area,
Entertainment, Restaurants, And Public Transit.


Reunion Park Site Plan
Retain existing frontage roads
to provide access to grade-
level streets and parking
structures for new
development
Develop “Lot E” with
mid- and high-rise
mixed-use development
rising to Houston
/Jefferson viaduct level
Establish strong connections
within development to
encourage pedestrian
circulation and support
walkable blocks
Create new terraced park
providing visual connection to
Trinity Park
Ensure compatibility with
Dallas Convention Center
Ensure stop along Houston
viaduct streetcar line to serve
new development
Enhance sidewalks along
viaducts to strengthen
pedestrian connection
between Omni Hotel and
new development


City of Dallas
Geographic Center of North AmericaA
Dallas Hub
− 20 Fortune 500 Companies
− 269 Headquartered CompaniesA
600,000+ Workforce
− 30% Have at Least a College Degree
1.3 Million within City of Dallas
− 9th Largest in U.S.
−7,000 Central Business District
− Median Income of $62,000

Accessibility Overview
Superior Location with DART Rail
Easy Access to Dallas Love Field Airport
More Than 1,900 Flights Daily
Dallas is Centrally Located
4-Hour Flight To Most North American Cities
Surrounded by Three Major Highways
Highways Connect to Entire Metroplex
7 Miles from Dallas Love Field
20 Miles from DFW International Airport

1) Location: Inside CBD Loop | High Visibility | View of Trinity River
2) Timing: Many Real Estate Development Projects in Dallas
3) Capital: Economic Resiliency Compared to National Average
Benefit Analysis
PROS
1) Location: Dart Rail Cutoff Across From Project Site
2) Location: ½ Mile From Trinity River Project
3) Capital: Private / Public Land Swap Not A Viable Option
CONS

Development Impact
Adjacent Land Use(s)
The City of Dallas
Economic Base of Dallas


I-35 / Reunion Blvd:
235,466
Commerce St. / S. Houston St.:
13,778
S. Lamar St. / ERL Thornton
Fwy: 15,584
I-30 / S. Akard St.:
189,442
I-35 / S. Market St.:
141,048
I-35 / I-30:
118,432
Site Traffic Count

Number of Businesses

Business Sector Analysis

Consumer Spending

Employment

Site Vision

Target Market
Dallas Has 28+ Million Annual Visitors
3%+ of The Air Market Visit Dallas Each Year
Within 500-Mile Radius
34 Million People

Investment Strategy
Structured Site Plan
+ 5-Year, 4 Phase Development Project
Create 2,092,650 Additional Square Feet
+ 957,250 Retail Space
+ 823,400 Office Space
+ 312,000 Residential Space
5-Year Investment Horizon
+ 2-Year Residential Exposure
+ 5-Year Office & Retail Exposure

Phase I
2 High-Rise Office Buildings
- 823,400 sq. ft. | $320.00 sq. ft.
Light Rail Transportation
- 82,680 sq. ft. | $800.00 sq. ft.
Bike Path
- 37,500 sq. ft. | $30.00 sq. ft.
Adaptive Reuse of Parking Garage
- 134,000 sq. ft. | $45.95 sq. ft.
$367,720,211 Total Cost
4-Year Development Timeline | Start Year 1

Phase II
3 Condominium Buildings
- 468,000 sq. ft. | $132.00 sq. ft.Central Retail Building
- 189,000 sq. ft. | $103.00 sq. ft.
Cinema
- 40,000 sq. ft. | $45.95 sq. ft.
$85,723,000 Total Cost
2-Year Development Timeline | Start Year 3

Phase III
Reunion Village
- 143,000 sq. ft. | $103.00 sq. ft.LeReunion Mall
- 135,000 sq. ft. | $140.00 sq. ft.
$33,269,000 Total Cost
2-Year Development Timeline | Start Year 3


The Past Meets The Future
LeReunion Grande Casino

Phase IV

LeReunion Grande Casino
Largest Luxury Casino in North AmericaA
Recaptures $2.7B Texas Gaming RevenuesA
Generates 1.2M Hotel “Rooms Nights” AnnuallyA
Generates $740M in Hotel RevenueA
Creates 8,000 Casino JobsA
Generates $18M Annually in Hotel TaxA
Generates $12M Annually in State Sales Tax

Texas Gaming Legislation
Article 17
- Requires Constitutional Amendment
A
3 .2
2 .5
10 .3
2 .5
2 .0
0 .3
0 .7
0 .0 5 .0 1 0 .0 1 5 .0
Ok l ah oma
Lou is ian a
N evada
M iss iss ippi
A r izon a
N ew M ex ic o
Co l o r ado
2 0 0 9 GAMIN G REVENUES
Tex as Va l ue Cas in o Reven ue
In B il l ion s
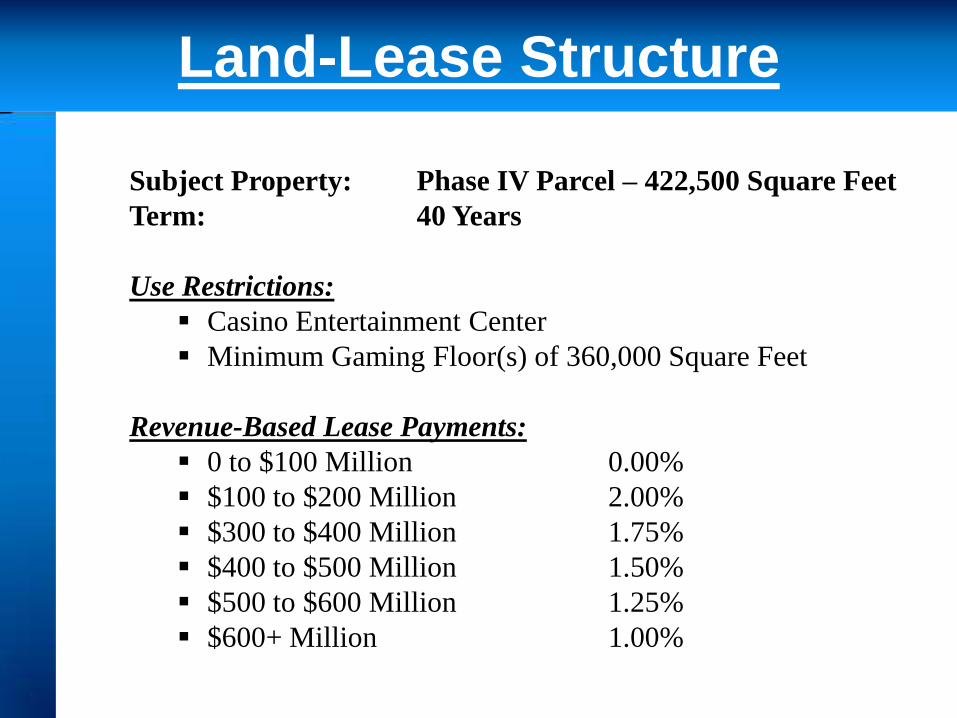
Land-Lease Structure
Subject Property: Phase IV Parcel – 422,500 Square Feet
Term: 40 Years
Use Restrictions:
Casino Entertainment Center
Minimum Gaming Floor(s) of 360,000 Square Feet
Revenue-Based Lease Payments:
0 to $100 Million 0.00%
$100 to $200 Million 2.00%
$300 to $400 Million 1.75%
$400 to $500 Million 1.50%
$500 to $600 Million 1.25%
$600+ Million 1.00%

Dallas’ LeReunion Grande Casino
Lease Offset
Fees Will Be Applied Against Lease Expense
8 Years From Initial Option Date
Term I for 3 Years
– Option 1: $10.8 Million
Term II for 2 Years
– Option 2: $7.2 Million
Option Term Sheet

Term Sheet Continued
$175,000,000A
Maturity – 30 Years
Fixed 4.75% Rate
Coverage Ratio – 1.2 Times
• Level Sinking Fund Payments
Security
Assignment of 40-Year Land Lease
Deed of Trust on Parcel 4
Enterprise Revenue Bond Issue


Term Sheet
Facility: 5-Year Syndicated Revolving Line of Credit
Amount: $600 Million
Purpose: Interim Construction Finance plus Interest Reserve
Repayment Source :
Primary : Permanent 20-Year Take-Out by Insurer for $320 Million (80% LTV)
Secondary: Proceeds From Sale of Condos &Lease Income From Office And Retail Space
Tertiary : Enterprise Revenue Bond
Pricing: Libor + 2.0% *
Security:
• Deed of Trust on Reunion Park
• Assignment of Lease Proceeds
* Based on 5-Year Libor Swaps (1.134%) plus a spread of 200 bps, the estimated fixed cost
of funds is 3.5% , including the net cost of selling an interest rate floor against buying an
interest rate cap.
| Interim Construction Financing |

Unlevered Return
INTERIM CONSTRUCTION FINANCE UTILIZATION
Year 1 Year 2 Year 3 Year 4 Year 5
Operating Cash Flow
Lease Revenue $0.00 $0.00 $0.00 $42,075,810 $84,038,640
Operating Expense $0.00 $0.00 $0.00 -$38,221,666 -$76,340,701
Land Lease Option Fees $10,800,000 $7,128,000
Total Operating Cash Flow 10,800,000$ -$ -$ 10,982,144$ 7,697,939$
Construction Costs
Phase 1 (Central Development) $91,930,053 $91,930,053 $91,930,053 $91,930,053
Phase 2 (East Side Development) $42,861,500 $42,861,500
Phase 3 (West Side Development) $16,814,500 $16,814,500
Phase 4 (West Side Develoment)
Total $91,930,053 $91,930,053 $151,606,053 $151,606,053 $0
Total (91,930,053)$ (91,930,053)$ (151,606,053)$ (151,606,053)$ -$
ICF UTILIZATION
Phase 1 (Central Development) 91,930,053$ 91,930,053$ 91,930,053$ 91,930,053$ (0)$
Phase 2 (East Side Development) -$ -$ 42,861,500$ 42,861,500$
Phase 3 (West Side Development) -$ -$ 16,814,500$ 16,814,500$
Phase 4 (West Side Develoment) -$ -$ -$ -$
TOTAL CONSTRUCTION ADVANCES 91,930,053$ 91,930,053$ 151,606,053$ 151,606,053$ -$
ICF REPAYMENTS (10,800,000)$ -$ (79,560,000)$ (166,134,618)$
Capitalized Interest 1,230,776$ 4,491,405$ 8,910,486$ 14,528,565$
Capitalized Interest Reserve 1,230,776$ 5,722,181$ 14,632,667$ 29,161,232$
TOTAL ICF UTILIZATION 82,360,829$ 178,782,286$ 339,298,825$ (0)$ (0)$
ICF REPAYMENTS (0)$ -$
Operating Cash Flow (10,800,000)$ -$ -$ (10,982,144)$
Phase 1 (Central Development) -$ -$ -$ -$
Phase 2 (East Side Development) -$ -$ -$ -$
Phase 3 (West Side Development) -$ -$ -$ (10,819,200)$
Phase 4 (West Side Develoment) -$ -$
Permanent Take-Out Financing Phase 1 -$ (340,000,000)$
Proceeds of Condo Sales -$ -$ (79,560,000)$ (79,560,000)$
TOTAL ICF REPAYMENTS (10,800,000)$ -$ (79,560,000)$ (166,134,618)$
PROJECT CASH OUT -$ -$ -$ 275,226,727$
5-Year Libor Swap 1.1340%
Spread 1.5000%
Forward Rate Agreement Costs (Amortized) 0.866%
Total Blended Interest Cost 3.5000% Terminal Value: $681,036,835
Unlevered IRR: 7.656%

Outstanding Credit
$ (5 0 )
$ -
$ 50
$ 10 0
$ 15 0
$ 20 0
$ 25 0
$ 30 0
$ 35 0
$ 40 0
1 2 3 4 5
Mil
lio
ns
Yea r
IC F UTILIZATION
* 3% Growth Annual Growth Rate Assumed
ICF UTILIZATION
Phase 1 (Central Development) 91,930,053$ 91,930,053$ 91,930,053$ 91,930,053$ (0)$
Phase 2 (East Side Development) -$ -$ 42,861,500$ 42,861,500$
Phase 3 (West Side Development) -$ -$ 16,814,500$ 16,814,500$
Phase 4 (West Side Develoment) -$ -$ -$ -$
TOTAL CONSTRUCTION ADVANCES 91,930,053$ 91,930,053$ 151,606,053$ 151,606,053$ -$
ICF REPAYMENTS (10,800,000)$ -$ (79,560,000)$ (166,134,618)$
Capitalized Interest 1,230,776$ 4,491,405$ 8,910,486$ 14,528,565$
Capitalized Interest Reserve 1,230,776$ 5,722,181$ 14,632,667$ 29,161,232$
TOTAL ICF UTILIZATION 82,360,829$ 178,782,286$ 339,298,825$ (0)$ (0)$
ICF REPAYMENTS (0)$ -$
Operating Cash Flow (10,800,000)$ -$ -$ (10,982,144)$
Phase 1 (Central Development) -$ -$ -$ -$
Phase 2 (East Side Development) -$ -$ -$ -$
Phase 3 (West Side Development) -$ -$ -$ (10,819,200)$
Phase 4 (West Side Develoment) -$ -$
Permanent Take-Out Financing Phase 1 -$ (340,000,000)$
Proceeds of Condo Sales -$ -$ (79,560,000)$ (79,560,000)$
TOTAL ICF REPAYMENTS (10,800,000)$ -$ (79,560,000)$ (166,134,618)$
PROJECT CASH OUT -$ -$ -$ 275,226,727$
5-Year Libor Swap 1.1340%
Spread 1.5000%
Forward Rate Agreement Costs (Amortized) 0.866%
Total Blended Interest Cost 3.5000%
Interim Construction Financing Utilization Schedule

Financing Schedule
$ -
$ 20
$ 40
$ 60
$ 80
$ 10 0
$ 12 0
$ 14 0
$ 16 0
1 2 3 4
Mil
lio
ns
Yea r
IC F UTILIZATION
* 3% Growth Annual Growth Rate Assumed
ICF UTILIZATION
Phase 1 (Central Development) 91,930,053$ 91,930,053$ 91,930,053$ 91,930,053$ (0)$
Phase 2 (East Side Development) -$ -$ 42,861,500$ 42,861,500$
Phase 3 (West Side Development) -$ -$ 16,814,500$ 16,814,500$
Phase 4 (West Side Develoment) -$ -$ -$ -$
TOTAL CONSTRUCTION ADVANCES 91,930,053$ 91,930,053$ 151,606,053$ 151,606,053$ -$
ICF REPAYMENTS (10,800,000)$ -$ (79,560,000)$ (166,134,618)$
Capitalized Interest 1,230,776$ 4,491,405$ 8,910,486$ 14,528,565$
Capitalized Interest Reserve 1,230,776$ 5,722,181$ 14,632,667$ 29,161,232$
TOTAL ICF UTILIZATION 82,360,829$ 178,782,286$ 339,298,825$ (0)$ (0)$
ICF REPAYMENTS (0)$ -$
Operating Cash Flow (10,800,000)$ -$ -$ (10,982,144)$
Phase 1 (Central Development) -$ -$ -$ -$
Phase 2 (East Side Development) -$ -$ -$ -$
Phase 3 (West Side Development) -$ -$ -$ (10,819,200)$
Phase 4 (West Side Develoment) -$ -$
Permanent Take-Out Financing Phase 1 -$ (340,000,000)$
Proceeds of Condo Sales -$ -$ (79,560,000)$ (79,560,000)$
TOTAL ICF REPAYMENTS (10,800,000)$ -$ (79,560,000)$ (166,134,618)$
PROJECT CASH OUT -$ -$ -$ 275,226,727$
5-Year Libor Swap 1.1340%
Spread 1.5000%
Forward Rate Agreement Costs (Amortized) 0.866%
Total Blended Interest Cost 3.5000%

2 0 .0 0 %
8 0 .0 0 %
C a pit a l St r uc t ur e F in a nc in g
Eq ui t y Debt
3 0 .2 6 % In t er n a l Ra t e o f Ret u r n (L ev er ed )
Capital Structure
37.83%
5:1 Levered Internal Rate of Return

2 0 .0 0 %
8 0 .0 0 %
C a pit a l St r uc t ur e F in a nc in g
Eq ui t y Debt
3 0 .2 6 % In t er n a l Ra t e o f Ret u r n (L ev er ed )
Capital Structure
30.26%
4:1 Levered Internal Rate of Return
2 5 .0 0 %
7 5 .0 0 %
C a pit a l St r uc t ur e F in a nc in g
Eq ui t y Debt
W AC C 7 .5 0 %
Equity 30%
Debt 05%
P r o j ec t ed C a pit a l
Capital $162,051,877
Debt $979,591,193
To t a l C a pit a l C o st
Project $1,088,434,658

The Final Vision


Development Costs $ %
Phase 1 (Central Development) $367,720,211 75.5%
Phase 2 (East Side Development) $85,723,000 17.6%
Phase 3 (West Side Development) $33,629,000 6.9%
Phase 4 (West Side Development) $0 0.0%
Total $487,072,211 100%
Land Development Sq Ft %
Office Space 823,400 49.7%
Retail Space 957,250 57.8%
Green Space 208,900 12.6%
Residential Space 312,000 18.8%
Site Enhancement 120,180 7.3%
2,421,730 146%
Basic Per Foot Analysis $ %
Total Cost Per Square Foot (Land) $294.25
Total Cost Per Square Foot (Space) $201.13
Revenue Per Square Foot $42.63 14.49%
Revenue Analysis (Diversification) $ %
Office Revenue $29,642,400 13.8%
Retail Revenue $52,066,000 24.3%
Residential Revenue $132,350,400 61.8%
Total $214,058,800 100.0%

Gaming Hotel
Floor Rooms Employees
Ballys 225,756 2,000 3,649
Borgata 161,000 2,802 6,025
Caesars 145,000 1,158 3,052
Harrahs 160,000 2,588 3,959
Revel 150,000 1,399 3,333
Showboat 127,978 1,331 2,384
Tropicana 148,000 2,129 2,920
Trump Plaza 91,181 906 1,372
Trump Taj Mahal 167,321 2,248 3,325
Mean 152,915 1,840 3,335
LeReunion Grande 360,000 4,332 7,852
Casino Employees 7,852
Hotel Room Nights 1,264,966
Occupancy 80%
Hotel Avg Rate 100$
Hotel Revenue 126,496,642$
Hotel Occupancy Tax 0.09 11,384,698$
Texas Sales Tax 0.06 7,589,798$
ATLANTIC CITY CASINOS

Phase 1 (Central Development) $367,720,211
2 Skyscraper Office Buildings
Total Square Footage 823,400 $320.00
Number of Floors 56
Number of Parking Spaces (6 Floors Deep) 469
Cost------------------------------------------------ $263,488,000.00
Bike Paths
Length of Bike Path 37,500 $30.00
Cost--------------------------------------------------------------$1,125,000.00
Park ing Garage Renovation
Total Square Footage 134,750 $45.95
Number of Floors 5
Number of Parking Spaces 4,185
Cost---------------------------------------------------- $6,191,250.00
Light Rail Transportation System
Rail System 38,720 $800.00
Bridge 43,960 $1,500.00
$96,915,961.05
Phase 2 (East Side Development) $85,723,000
3 Individual Luxury Apartment Buildings
Total Square Footage 468,000 $132.00
Number of Floors (3 Parking & 6 Living) 9
Number of Parking Spaces 953
Cost---------------------------------------- $61,776,000.00
Central Retail Building
Total Square Footage 189,000 $103.00
Number of Floors 3
Number of Parking Spaces 191
Cost--------------------------------------- $19,467,000.00
Cinema
Total Square Footage 40,000 $112.00
Number of Floors 1
Number of Parking Spaces 191
Cost------------------------------------ $4,480,000.00

Phase 3 (West Side Development) $33,629,000
Reunion Village
Total Square Footage 143,000 $103.00
Number of Floors 2
Number of Parking Spaces -
Cost------------------------------------------ $14,729,000.00
La Reunion Mall
Total Square Footage 135,000 $140.00
Number of Floors 1
Number of Parking Spaces -
Cost---------------------------------------- $18,900,000.00
Phase 4 (West Side Development)
Luxury Casino
Total Square Footage 422,500 $135.00
Number of Floors 3
Number of Parking Spaces 611
Cost----------------------------------------- $57,038,484.47
Total Office Space 823,400
Total Retail Space 957,250
Total Residential Space 312,000
Total Office Space 39.35%
Total Retail Space 45.74%
Total Residential Space 14.91%
2,092,650
Costs & Investments
Total Development Costs $586,389,011
Total Debt Financing $340,474,958
Total Equity Financing $345,230,853
CHECK: TRUE $586,389,011

Article 17: "Mode of amending the Constitution of this State"
Notwithstanding the large number of amendments (and proposed amendments) that the constitution has had since its inception, the only method of amending the constitution prescribed by Article 17 is via the legislature, subject to voter approval. The constitution does not provide for amendment by initiative, constitutional convention, or any other means. A 1974 constitutional convention required the voters to amend the Constitution to add a separate section to this Article; the section was later repealed in 1999.
The section also prescribes specific details for notifying the public of elections to approve amendments. It requires that the legislature publish a notice in officially approved newspapers that briefly summarizes each amendment and shows how each amendment will be described on the ballot. It also requires that the full text of each amendment be posted at each county courthouse at least 50 days (but no sooner than 60 days) before the election date.
Once an amendment passes it is compiled into the existing framework (i.e., text is either added or deleted), unlike the United States Constitution.

ICF
INTERIM CONSTRUCTION FINANCE UTILIZATION
Year 1 Year 2 Year 3 Year 4 Year 5
Operating Cash Flow
Lease Revenue $0.00 $0.00 $0.00 $42,075,810 $84,038,640
Operating Expense $0.00 $0.00 $0.00 -$38,221,666 -$76,340,701
Land Lease Option Fees $10,800,000 $7,128,000
Total Operating Cash Flow 10,800,000$ -$ -$ 10,982,144$ 7,697,939$
Construction Costs
Phase 1 (Central Development) $91,930,053 $91,930,053 $91,930,053 $91,930,053
Phase 2 (East Side Development) $42,861,500 $42,861,500
Phase 3 (West Side Development) $16,814,500 $16,814,500
Phase 4 (West Side Develoment)
Total $91,930,053 $91,930,053 $151,606,053 $151,606,053 $0
Total (91,930,053)$ (91,930,053)$ (151,606,053)$ (151,606,053)$ -$
ICF UTILIZATION
Phase 1 (Central Development) 91,930,053$ 91,930,053$ 91,930,053$ 91,930,053$ (0)$
Phase 2 (East Side Development) -$ -$ 42,861,500$ 42,861,500$
Phase 3 (West Side Development) -$ -$ 16,814,500$ 16,814,500$
Phase 4 (West Side Develoment) -$ -$ -$ -$
TOTAL CONSTRUCTION ADVANCES 91,930,053$ 91,930,053$ 151,606,053$ 151,606,053$ -$
ICF REPAYMENTS (10,800,000)$ -$ (79,560,000)$ (166,134,618)$
Capitalized Interest 1,230,776$ 4,491,405$ 8,910,486$ 14,528,565$
Capitalized Interest Reserve 1,230,776$ 5,722,181$ 14,632,667$ 29,161,232$
TOTAL ICF UTILIZATION 82,360,829$ 178,782,286$ 339,298,825$ (0)$ (0)$
ICF REPAYMENTS (0)$ -$
Operating Cash Flow (10,800,000)$ -$ -$ (10,982,144)$
Phase 1 (Central Development) -$ -$ -$ -$
Phase 2 (East Side Development) -$ -$ -$ -$
Phase 3 (West Side Development) -$ -$ -$ (10,819,200)$
Phase 4 (West Side Develoment) -$ -$
Permanent Take-Out Financing Phase 1 -$ (340,000,000)$
Proceeds of Condo Sales -$ -$ (79,560,000)$ (79,560,000)$
TOTAL ICF REPAYMENTS (10,800,000)$ -$ (79,560,000)$ (166,134,618)$
PROJECT CASH OUT -$ -$ -$ 275,226,727$
5-Year Libor Swap 1.1340%
Spread 1.5000%
Forward Rate Agreement Costs (Amortized) 0.866%
Total Blended Interest Cost 3.5000%


Term Sheet
Facility: 5-Year Syndicated Revolving Line of Credit
Amount: $600 Million
Purpose: Interim Construction Finance plus Interest Reserve
Repayment Source :
Primary : Permanent 20-Year Take-Out by Insurer for $320 Million (80% LTV)
Secondary: Proceeds From Sale of Condos &Lease Income From Office And Retail Space
Tertiary : Enterprise Revenue Bond
Pricing: Libor + 2.5% *
Security:
• Deed of Trust on Reunion Park
• Assignment of Lease Proceeds
* Based on 5-Year Libor Swaps (1.134%) plus a spread of 250 bps, the estimated fixed cost
of funds is 4.0% , including the net cost of selling an interest rate floor against buying an
interest rate cap.
| Interim Construction Financing |