(nahco3) - university of minnesota there were no significant differences in grain yield between...
TRANSCRIPT

103
Table 2. Soil test results and the suggested fertilizer program for corn 1981.
Soil Test Results1Test LAB A LAB B LAB C LAB D LAB E (UM)
PH 7.8 7.6 7.9 7.6 7.8
Phosphorus (Bray 1)(NaHCO3)
8.5-L 14-M
39-M 10
8.5-M 12
Potassium 122-H 143-M 170 120-H 80
Organic matter (%) 3.8 3.3-H 5.3 M M
Calcium 4550 2790-H 4500 3200-M -
Magnesium 550 448-H 550 620-H -
Sodium 16 - 59 - -
Sulfur 8.5-H 6-L 12 14-ADQ 8
Iron 7.0-H 13-M 18.4 - -
Manganese 5.0-VH 11-M 11.6 8-H -
Zinc •93-H 2.3-M 2.2 2.6-ADQ 1.9
Copper •38-H 0.7-L 0.8 0.8-H -
Boron - 1.1-M 1.0 - -
ENR (lb/A) - 96 - - -
Nitrate nitrogen (lb/A) - - 7 - -
C.E.C. (meq/100 g) 27.7 18.1 27.7 - -
Soluble sa:Us (mmhos/cra) .69 - .35 - -
Suggesited Fertilizer Program2
Nutrient
Nitrogen
Phosphorus (P2O5)
Potassium (K20)
Sulfur
Zinc
Manganese
Copper
Boron
LAB A
120
97
46
LAB B
145
75
105
15
LAB C
120
140
1653
14
1 All soil test values are stated in ppm unless noted otherwise.
LAB D
102
77
65
LAB E (UM)
80
80
95
2 All values indicate pounds of nutrient suggested per acre for a yield goal of 130 bushels of cornper acre.
3 Values include maintenance plus 1/2 of suggested buildup.

104
There were no significant differences in grain yield between laboratories (Table 7). Plant height,lodging, grain moisture and grain protein did not vary significantly between laboratories.
The fertilizer cost and economic returns are given in Table 8. The fertilizer cost differed $41.09between Labs A and C. The return over fertilizer varied from $231.50 (Lab A) to $190.81 (Lab C).The check had the lowest returns.
Results and Discussion of the Corn Trial
As shown in Table 2, the soil tests again varied widely. Recommendations for N, P and K were different, but the range was not as great for wheat. Again, two laboratories recommended sulfur and onerecommended copper.
Small whole plant nutrient concentration differences among laboratories were significant only for Cu(Table 6). Lab D had a significantly higher Cu concentration but had no Cu applied for the 1981 crop.However, there was an application of 2 lb/A of Cu for the 1980 crop.
Earleaf nutrient concentration differences among laboratories were significant for N, Ca, Cu and Mn.The lowest N concentration was Lab E where the N applied was lowest and the highest N concentrationwas Lab B where N applied was highest. The Cu concentrations were not consistent with the highest(Lab A) never receiving Cu. The Mn concentration was highest for Lab B which received Mn in 1980.
Corn grain yields did not vary significantly between laboratories. None of the other plant measurements varied significantly (.05 level) between treatments.
The fertilizer cost and economic returns are given in Table 8. Fertilizer costs varied from $43.00(Lab D) to $76.97 (Lab C). The returns over fertilizer varied only about $18/acre.
Two-Year Summary
Analysis of the combined data for 1980 and 1981 for wheat (Table 9) shows quite a range in returnover check, but all values are negative. The highest cost was Lab C and the lowest cost was Lab A.For corn all returns are positive with the greatest return from Lab E ($93.05) and the least returnfrom Lab C ($63.58). After two years it appears that the recommendations by some labs of sulfur,micronutrients and high rates of P and K are not resulting in significantly higher yields than theUniversity of Minnesota recommendations. On the other hand, some labs give recommendations that areclose to those of the University of Minnesota.
Table 3. Effect of suggested fertilizer applications on the leaf1 nutrient concentration of wheat.
Nutrient
LAB P K Ca Mg Fe Zn Cu Mn B
A .326 2.09 .684 .310 86 34.2 2.2 81 24.2
B .340 2.22 .634 .287 86 31.5 2.3 76 23.8
C .342 2.28 .761 .329 92 36.5 2.1 91 23.6
D .336 2.23 .719 .299 87 37.1 2.3 83 22.5
E (UM) .313 2.07 .626 .273 84 31.4 2.0 69 21.1
Check .317 2.24 .524 .218 78 32.3 2.6 61 24.1
Significance * NS ** * ** ** NS *ft NS
BLSD (.05) .019 ~ .075 .072 6 2.5 — 15 ~
CV (%) 3.5 6.4 7.8 15.0 4.6 5.1 14.6 12.5 22.3
1 Upper 2 leaves prior to flowering.

105
Table 4. Effect of suggested fertilizer applications on the nutrient concentration of whole plantsat soft dough stage of wheat.
NutrientLAB N P K Ca Mg Fe Zn Cu Mn B
% _ ppm _
A 1.37 .198 1.35 .176 .142 34 19.6 <0.04 28 1.4
B 1.29 .180 1.62 .204 .141 32 15.2•t
28 2.0
C 1.55 .213 1.61 .204 .152 37 21.4ii
32 2.2
D 1.35 .190 1.39 .184 .140 32 21.1ii
28 1.8
E (UM) 1.24 .171 1.44 .179 .139 27 15.1ii
27 1.9
Check 1.40 .226 1.02 .155 .132 28 20.0ii
31 1.9
Significance NS NS ft ft NS * + - NS NS
BLSD (.05) - - .35 .033 - 7 - - - -
CV (%) 11.63 14.5 15.5 10.7 14.3 13.5 19.2 - 19.2 54.35
Table 5. Effect of suggested fertilizer applications on the nutrient concentration in young whole
plants of corn.
Nutrient
LAB P K Ca Ms Fe Zn Cu Mn B
1
A .333 3.43 .838 .627 1483 50.6 8.6 111 1.5
B .338 3.49 .750 .582 1496 54.2 8.8 116 1.6
C .345 3.67 .801 .576 1409 48.0 8.3 113 1.9
D .347 3.41 .749 .627 1474 45.6 9.5 112 1.7
E (UM) .336 3.41 .756 .632 1449 55.8 8.2 111 1.5
Check .340 3.36 .786 .644 1415 64.1 9.4 110 1.7
Significance NS NS NS NS NS NS * NS NS
BLSD (.05) - - - - - - 0.8 - -
CV (%) 4.78 7.37 9.41 9.54 14.11 31.41 5.83 6.04 17.97
Table 6. Effect of suggested fertilizer applications on the leaf concentrations in corn.
Nutrient
LAB N P K Ca Mg Fe Zn Cu Mn B
X
A 3.07 .294 1.48 .483 .414 93 18.6 2.7 70 4.7
B 3.20 .304 1.55 .535 .390 94 18.0 2.6 77 4.7
C 3.09 .287 1.51 .475 .390 89 17.1 2.2 73 4.8
D 3.06 .287 1.43 .495 .450 90 16.6 2.5 69 4.8
E (UM) 3.02 .285 1.45 .478 .453 89 16.4 2.1 67 4.4
Check 2.70 .268 1.35 .465 .422 87 16.6 2.2 62 4.5
Significance ** NS + * NS NS NS * ** NS
BLSD (.05) 0.18 - - .042 - - - 0.5 7 -
CV (%) 3.96 5.69 5.63 5.39 12.33 4.35 7.74 12.40 6.67 4.60

106
Table 7. Effect of fertilizer recommendations on various plant measurements.
Corn Wheat
EarlyPlants Broken Plant Plant
Early (10) Stalks Lodging Popula- Corn Height LodgingPlant Dry at at tion at Grain Grain at at Grain Grain GrainHeight WeiRht Harvest Harvest Harvest Yield Moisture Harvest Harvest Yield Moisture ProteinLAB
-in- -grams-• -%- -%- -1000's/A-• -BuA- -%- -in- Score1 -Bu/A- -%- -%-
A 19.3 39 2.2 30 19.1 114.1 25.8 30.8 7.0 60.5 13.6 13.8
B 18.4 37 3.1 24 19.7 123.0 27.1 31.5 7.0 65.1 13.4 13.7
C 19.0 37 2.0 26 19.0 123.2 26.1 32.0 7.2 60.6 13.8 14.1
D 19.6 36 11.2 35 18.7 117.8 25.7 31.5 7.2 60.4 13.7 14.8
E (UM) 19.7 41 4.9 31 19.2 118.3 26.7 28.5 6.5 55.8 14.0 14.2
Check 18.8 45 6.0 36 18.9 93.6 27.5 29.2 6.5 48.9 14.1 13.8
Signif. NS NS NS NS NS ** + + + ** + NS
BLSD (.05) - - - - - 9.5 - - - 6.7 - -
CV (%) 4.8 19.3 138.2 34.2 7.2 5.7 3.3 5.7 6.1 7.6 2.4 4.7
1 Lodging score: 1 = No lodging, 9 ° flat.
Table 8. Economic return over fertilizer costs - 1981.
Wheat Corn
Value Value
of Return of Return
Crop Fertilizer over Crop Fertilizer over
LAB <? $4/Bu Cost* Fertilizer <? $3/Bu Cost* Fertilizer
$/A $/A
A 242.00 10.50 231.50 342.30 48.23 294.07
B 260.40 30.96 229.44 369.00 59.65 309.35
C 242.40 51.59 190.81 369.60 76.97 292.63
D 241.60 14.86 226.74 353.40 43.00 310.40
E (UM) 223.20 13.90 209.30 354.90 44.35 310.55
Check 195.60 0 195.60 289.80 0 289.80
* Values used ($/lb) were as follows: N = $0.15, P2O5 = $0.25, K2O = $0.13, S = $0.18, Cu = $2.80.
Table 9. Two-year summary of yields and economic returns
Wheat Com1
Total Economic Total Economic
Total 2-Year Return Return Total 2-Year Return Return
2-Year Fertilizer over over 2-Year Fertilizer over over
LAB Yield Cost Fertilizer Check Yield Cost Fertilizer Check
Bu/A $/A $/A $/A Bu/A $/A $/A $/A
A 109.2 40.95 395.85 -0.55 233.00 94.68 604.32 +81.82
B 113.2 74.66 378.14 -18.26 239.80 117.85 601.65 +79.15
C 109.1 113.95 322.45 -73.95 243.60 144.72 586.08 +63.58
D 109.4 50.66 389. 94 -6.46 236.50 118.27 591.23 +68.73
E (UM) 106.5 36.91 389.09 -7.31 234.00 86.45 615.55 +93.05
Check 99.1 0 396.40 - 204.50 0 522.50 -

107
Pesticide Plots at Rosemount
Russell S. Adams, Jr.
A new herbicide (chlorosulfuron or Glean) is considered to have promised for weed control in wheat.However, residue carryover may occur in calcareous soils. In 1981 bioassay plots were establishedat Rosemount on the old lime plots. The soil type was a Port Byron silt loam (Typic Hapludoll).Four rates of chemical were applied (0, 1/3, 3/4 and 11/2 oz/A) representing approximately one,two, and five times field rate.
The wheat was planted on May 12, herbicide applied on May 13, Preharvest weed biomass sampled onJuly 13, wheat harvested on July 30 and postharvest weed biomass sampled on October 2.
Yield and weed biomass data are reported in Tables 1 and 2. The data shows that wheat yields wereslightly improved by either lime or herbicide and that these responses were additive. Weed growthwas effectively suppressed by both lime and herbicide. Weed regrowth after harvest showed considerable recovery except in high lime and high herbicide treatments. Herbicide analysis on frozensoil samples have not been completed. However, recovery of weed growth shows that the herbicide waseither being deactivated or degraded through the summer. The major preharvest weed species were soybeans, velvet leaf and giant foxtail. The major postharvest weed species were lambsquarter andstunted giant and green foxtails.
This summer, 1982, these plots will be planted to soybeans and sunflowers and residue effectsfollowed.
Table 1. Wheat yields in chlorosulfuron treatments at Rosemount, 1981.
LimeT/A1948
Chlorosulfuron treatments oz/A
1/3 3/4 1 1/2
0 34.7 39.7-bushels/acre
38.3 38.1
6 40.8 41.9 41.0 44.0
24 39.7 42.8 43.4 42.7
Table 2. Preharvest and postharvest biomass in wheat plots treated with chlorosulfuron to controlweed growth, Rosemount, 1981,
LimeT/A1948
Chlorosulfuron treatments oz/A0 1/3 3/4 • 1 1/2
Pre- Post- Pre- Post- Pre- Post- Pre- Post-
harvest harvest harvest harvest
0 0.22 0.31 0.03 0.25 0.02 0.19 0.01 0.11
6 0.06 0.37 0.04 0.17 0.00 0.29 0.01 0.02
24 0.03 0.37 0.02 0.11 0.01 0.11 0.00 0.01
108
FERTILIZATION TRIALS OF MALTING BARLEY
ON IRRIGATED SANDY SOIL IN CENTRAL MINNESOTA
Mike O'Leary and Greg Buzicky
Introduction
In recent years there has been an increase in irrigated acreage in central Minnesota. While corn,potatoes and alfalfa are the main crops grown on irrigated land, there is interest in introducingsamll grains into rotations. Malting barley would be a possibility if satisfactory yields withacceptable malting characteristics, can be obtained.
Since most irrigated soils are sandy with low nitrogen content and low residual nitrate-nitrogen,it should be possible to manage the nitrogen environment for malting barley production. Therefore,the objectives of this study were:
1) to examine the response of Manker, Morex and other experimental varieties tonitrogen fertilization,
2) to examine the effect of various times of application of nitrogen fertilizeron an established malting barley variety,
3) to examine various levels of potassium and seeding rates on yield and qualityof Manker barley.
Methods
The study was established at the Staples Irrigation Demonstration and Research Farm in WadenaCounty in central Minnesota. Soil type at the plot site was an Esterville sandy loam with aslightly acid pH, high phosphorus test and low potassium test.
The plot area was fertilized to optimum P, K, and S levels as recommended by soil tests. Theseeding rate was 96 lbs/A with 10 lbs/A P.O. as starter fertilizer. Weed control was obtainedwith Brominal + (.25 //a.i./A) at the four leaf stage and plots were sprayed for disease controlin 1981. A solid set irrigation system provided 12.2" in 1979, 8.0" in 1980 and 5.9 in 1981 ofwater in addition to the 14", 13.5 and 13.4" of rainfall for 1979, 1980, and 1981, respectively.The nitrogen source used was ammonium nitrate for all trials.
The Nitrogen Rate by Variety trial was conducted utilizing a split plot design replicated fourtimes with varieties as the main plot and N rates as the subplot. Nitrogen rates were 0, 45,90 and 135 lbs/A applied 2/3 preplanting and 1/3 at tillering stage. Varieties tested includedManker and Morex for three years and Larker (1), M-32 (2), M-34 (1) and M-36 (2).
The Time of Nitrogen Application trial utilized a randomized complete block design replicated fourtime with nitrogen applied at a 90 lb/A rate according to four schemes of timing. The fivetreatments were: (1) check; (2) 90 lbs/A, preplant (P); (3) 60 lbs/A, preplant and 30 lbs/A,tillering (P + T); (4) 60 lbs/A, preplant and 30 lbs/A, early boot (P + B); (5) 40 lbs/A, preplantand 30 lbs/A, tillering and 20 lbs/A early boot (P + T + B).
The Density of Planting by Nitrogen Rate by Potassium Rate trial was set out in a factorial arrangement (2x2x2) replicated four times in a randomized complete design. Seeding rates of 96 and 144lbs/A, nitrogen rates of 45 and 90 lbs/A, and potassium rates of 60 and 260 lbs/A were used.Nitrogen was applied as ammonium nitrate with 2/3 applied preplant and 1/3 applied at tillering.Potassium was applied preplant incorporated.
Nitrogen Rate by Variety Study
During the course of the Nitrogen Rate by Variety trial all varieties tested responded in similarfashion to increasing N rates. Interaction between these two variables was absent for all parameters

109
measured except for plump kernels in 1980. Two experimental varieties, M-34 and M-36, exhibited atendency to sustain a higher plump kernel percentage than other varieties at high N rates.
Manker and Morex, the two recommended malting varieties, were tested in all years. No significantdifference In grain yield or percent protein between these varieties was noted during the courseof this trial (Table 2). Morex had significantly better plump than Manker in 1979 and 1980 whileManker had significantly better test weight than Morex in both these years. Differences betweenall varieties tested in 1979 and 1980 were due mostly to the presence of experimental varietiesthat were subsequently dropped in 1981. M-36, an experimental variety tested in 1980 and 1981,proved comparable to Manker or Morex for the characters measured. Varietal data for 1981 can befound in table 3. Results from previous years are given in Soil Series 107 and 109.
N rates, when averaged across varieties, proved to have major effects under the prevailing conditions.Significant increases in grain yield were observed with each increment of added nitrogen up to 90lbs/A In all years (Table 1). In 1980 and 1981 135 lbs. N/A produced significantly higher yieldsthan other nitrogen treatments.
Changes in grain protein between the check and the 45 lbs/A rate were variable for the three years.Significant Increases in percent grain protein were produced for each addition of nitrogen above45 lbs/A in all years. Although grain protein was increased with each rate the values associatedwith the high N rate were relatively low. In each year percent plump kernels displayed a tendencyto decrease as N rates were Increased from 45 lbs. N/A. Signifiant decreases in percent plumpfor N above 45 lbs/A were observed in 1979 and 1980. In 1981 a significant decrease occurred onlybetween 45 and 90 lbs. N/A. During the duration of the study N rate had negligible effects ontest weight.
Table 1. Effect of: N rate on yie!Id, test weight, percent plump, and percentgrain at Staples, MN in 1979, 1980, and 1981.
Test
N-Rate Yield weight Protein Plump(lbs/A) (bu/A) (lbs/bu) (%) (%)
0 30.8 48.2 10.9 73.7
45 51.4 48.4 10.0 74.8
90 66.2 48.0 11.2 67.0
135 69.1 47.2 12.4 60.3
BLSD (.05) 4.8 — .4 2.5
C.V. % 13.2 2.0
1980
4.7 4.8
0 33.4 48.9 9.4 76.5
45 65.8 49.5 9.1 79.1
90 89.3 48.9 10.5 74.9
135 94.5 49.4 11.2 72.9
BLSD (.05) 3.5 — .4 1.8
C.V. % 9.6 2.7 8.6 4.4
0 28.7 46.0 8.4 73.9
45 45.0 46.7 8.9 82.8
90 62.3 46.6 10.0 79.2
135 68.0 45.9 11.6 78.5
BLSD (.05) 2.7 — .3 2.1
C.V. % 7.2 2.0 3.6 3.4

110
Table 2. Yield, test weight, % plump and % protein of Manker and Morex barley grain — Staples, MN1979, 1980, and 1981.
Test
Yield weight Protein Plump(bu/A) (lbs/bu) (%) (%)
Variety 79^^79/3^11798^81798081
Morex 56.6 69.5 46.5 47.9 47.5 45.2 11.3 10.2 9.9 72.8 75.1 77.6
Manker 55.2 73.0 54.2 49.8 50.2 46.8 11.0 10.2 9.7 66.6 72.2 78.3
Table 3. Effect of variety on yield, test weight, percent protein and percent plump of barley grainat Staples, MN, 1981.
Test
Yield weight Plump ProteinVariety (bu/A) (lbs/bu) (%) (%)
Morex 54.2 46.8 78.3 9.7
Manker 46.5 45.2 77.6 9.9
M-36 52.3 46.8 79.9 9.6
Significance ns ns ns ns
C.V. (%) 7.2 3.4 2.0 3.6
Table 4. Effect of time nitrogen application on Manker (1979, 1980) and Morex (1981) barley yield,test weight, percent plump and percent protein of barley grain at Staples, MN.
Test
Treatment Yield weight Protein Plump(lbs N/A) (bu/A) (lbs/bu) (%) w
check 29.6 48.4 9.7 70.1
90(P) 56.7 50.6 9.9 71.2
60(P) + 30(T) 52.5 50.5 9.9 69.2
60(P) + 30(B) 61.6 51.9 11.2 79.2
40(P) + 30(T) +20(B) 65.2 51.2 11.2 71.4
BLSD (.05) 8.2 — 2.1 .9
C.V. % 10.8 3.4 2.9 5.6
check 25.5 49.4 8.6 64.0
90(P) 82.3 50.5 8.4 70.2
60(P) + 30(T) 84.6 50.4 9.2 65.8
60(P) + 30(B) 82.1 52.2 12.2 84.2
40(P) + 30(T) +20(B) 88.3 51.2 10.4 71.2
BLSD (.05) 9.4 1.9 1.3 6.3
C.V. % 9.2 2.2 9.1 6.0

Ill
Table 4, continued.
Test
Treatment Yield weight Protein Plump
(lbs N/A) (bu/A) (lbs/bu) (%) (%)
check 22.1 42.3 8.8 69.0
90(?) 49.3 43.2 9.6 78.0
60(P) + 30(T) 48.6 42.2 9.4 76.0
60(P) + 30(B) 48.6 44.0 10.7 78.0
40(P) + 30(T) +20(B) 55.0 44.2 10.6 76.0
BLSD (.05) 6.1 — .6 4.0
C.V. % 9.6 2.4 4.2 4.0
Time of Nitrogen Application Trial
Yields were not greatly affected by time of nitrogen application (Table 4). Apart from thecheck, which generally yielded 22-30 bu/A, few significant differences were observed. In 1979,the P + B and P + T + B methods of application produced the highest yields. In 1980, nosignificant differences were noted amoung the four methods although the P + T + B method had thehighest yield. In 1981, the P + T + B method again produced the highest yield. Thus in each yearthe application of nitrogen at the preplant, tillering and boot stages gave the highest mean yield.
Test weight was not consistently affected by time of application, although an increase in testweight was observed in 1980 for the P + B and P + T + B methods over the check.
Kernel plumpness was greatly Increased in two of the three years by the P + B application method.This is especially striking since the P + T + B scheme also provided nitrogen at both the plantingand boot stage although at lower rates. This suggests that, under these conditions, adequatenitrogen must be available early and then followed with additional nitrogen in adequate amountsat the critical grain-filling period in order to obtain the highest percentage of plump kernels.
Protein content of the grain was greatly increased in all three years by application of nitrogenat the boot stage by treatments P + B and P + T + B. This delayed application resulted in anadequate supply of available N for grain filling, thereby increasing the protein content of thegrain.
Density of Planting by Nitrogen Rate by Potassium Rate Trial
Results of this trial showed few significant differences or interactions. The high N rate (90 lbsversus 45 lbs/A) increased yield and percent protein in both years. In 1979, a significant decreasein kernel plumpness was caused by high density seeding (144 versus 96 lbs/A). No significantdifference for any variables were observed due to potassium fertility levels (260 versus 60 lbs/A).
Summary
These trials were conducted in order to provide information on the production of irrigated maltingbarley in Minnesota, which to the present time has been limited. Due to the nature of most irrigatedsoils, associated growing conditions, and the dependence of a quality barley crop on favorablesoil fertility conditions, various aspects of nitrogen fertilization were the main areas of investigation.
Varietal response to N rates was quite similar during the experimental period. There was a dramaticincrease in yield from the application of nitrogen in all years. Furthermore, there was a trendof increased grain yield and protein as a result of increasing N rates in all years. Kernel plumpnessalso was greatly influenced by N rates. Highest kernel plumpness was obtained with 45 lbs/A with

112
successive decreases associated with higher N rates. The recommended varieties, Manker and Morex,and experimental M-36 performed in similar fashion when tested together. These varieties do notseem to be particularly well apapted to the irrigated conditions encountered in these trials.
At the optimum N rate (90 lbs/A), the P + T + B split application resulted in the highest yield.Kernel plumpness was highest for the two split treatments involving a boot stage application. Of thetwo schemes of application, the 40(P) + 30(T) + 20(B) produced slightly higher yields while the60(P) + 30(B) resulted in a significantly higher percentage of plump kernels and a slightly higherprotein content. No differences were obtained between medium and high seeding density or lowand high potassium levels.
Personnel Engaged in Barley Research
Department of Soil Science
Dr. Charles Simkins, ProfessorJerome Lensing, Assistant ScientistMike O'Leary, Sr. Research Plot TechnicianGreg Buzicky, Associate ScientistMel Wiens, Plot Supervisor (Staples)
*Supported in part by MBIA grant.

113
CORN - BEAN ROTATION
Harvey Meredith and Melvin Wiens
Yields from continuous corn on the irrigated sands have been disappointing. A study wasinitiated in 1981 at the Staples Station to evaluate continuous corn, corn-soybean, and corn-edible beans.
Two maturity corn varieties are planted in the study: Pioneer 3978 (85-day) and 3906 (95-day);McCall soybeans and Seafarer edible beans.
No significant differences in corn yields were noted in 1981. Corn yields averaged 151.4 bu/A.
This study will be continued. Two additional locations will be initiated in 1982.

114
SOUTHERN EXPERIMENT STATION - WASECA
WEATHER DATA - 1981
Month Period
Precipitation
1981 Normal
Avg.1981
Air Temp.
Normal
Growing Degree Days1981 Normal
__°F
January 1-31 0.15 .73 16.5 12.9
February 1-28 2.54 .96 22.5 17.5
March 1-31 0.96 1.94 35.7 28.5
April 1-30 4.49 2.48 48.8 45.6
May 1-10
11-20
21-31
Total
1.95
0.08
1.57
3.60 3.86
52.0
53.6
62.1
56.1 57.7
62.0
81.0
138.5
281.5 319
June 1-10
11-20
21-30
Total
0.50
1.70
1.66
3.86 4.75
67.0
66.5
65.4
66.4 67.1
167.0
165.0
153.0
485.0 519
July 1-10
11-20
21-31
Total
0.00
4.65
1.56
6.21 4.02
72.6
74.4
66.3
71.0 71.4
223.5
241.5
179.5
644.5 646
August 1-10
11-20
21-31
Total
1.79
1.85
3.74
7.38 3.60
71.0
66.2
68.1
68.4 69.7
211.0
163.0
199.5
573.5 604
September 1-30 1.46 3.45 58.6 60.3 307.0 337
October 1-31 3.24 1.89 44.4 50.3 0.0 35
November 1-30 1.24 1.25 36.8 32.9
December 1-31 1.18 1.02 14.6 19.0
Year Jan-Dec 36.31 29.95 45.1 44.4 2291.5 2460
Growing
Season May-Sep 22.51 19.68 64.1 65.3 2291.5 2425
Notes:
1) Highest temp, on June 8 — 932) Highest 24-hour precipitation on August 27 — 2.20"3) Growing degree days were 7% below normal4) Available soil moisture in 0-5' profile was never below
85% of field capacity5) Last spring frost — May 106) Frost on September 28

115
LIQUID AND DRY STARTER FERTILIZERSFOR CORN IN SOUTH-CENTRAL MINNESOTA
Waseca, 1981
G. W. Randall
Row-applied starter fertilizers have been used for over 30 years in corn production. As greateramounts of P and K fertilizers have been broadcast-applied and soil tests have increased over thelast decade, row applications have declined in popularity because of less direct yield response andgreater time and labor required for this method of application. Within the last five years liquidstarter fertilizers have become extremely competitive with dry materials and in some cases havereplaced dry fertilizers; largely because of ease and speed of handling. The purpose of this studywas to determine (1) the Influence of starter fertilizer on early corn growth, nutrient uptake andcorn yield and (2) the relative effectiveness of dry vs liquid starter fertilizer methods.
EXPERIMENTAL PROCEDURES
Four starter fertilizer treatments and a check with no starter fertilizer (Table 1) were applied ina randomized, complete-block design with six replications on a Nicollet clay loam soil (AqulcHapludoll). Soil test of this site averaged: pH = 5.8, Bray 1 extractable P = 54 lb/A and exchangeable K - 375 lb/A. Corn that had been moldboard plowed was the previous crop. Nitrogen as anhydrousammonia was applied at a rate of 180 lb N/A on May 2.
Corn (Pioneer 3732) was planted on May 13 at a rate of 27700 plants/A with a 4-row John Deere 7000Max-Emerge planter. This planter was used to apply the dry material in a 2 x 2 band and the liquidin the row with the seed. The 7-21-7, 5-12-5 and 8-20-8 were obtained from local fertilizer dealerswhile the 9-18-9 was obtained from Na-Churs. The 5-12-5 dry material applied at the 95-lb rateyields approximately the same amount of N + P + K as 5 gal/A of the two liquid materials. The 140-lbrate of the 8-20-8 is closer to a more conventional rate of a dry fertilizer while still using a1:2.5:1 material. Amaze at a rate of 1 lb/A (active) was band-applied to control rootworms. Lasso(3>s qts/A) and atrazine (3 lb/A) were applied to control weeds.
Ten randomly selected plants from the outside 2 rows of these 4-row plots were sampled on June 16for early plant growth measurements and for nutrient analysis. Leaf samples opposite and below theear were taken at silking (July 27) for analysis. Grain yields were determined by combine harvestingthe center two rows of each plot with a JD 3300 modified plot combine. Moisture and proteinanalyses were determined on those samples.
RESULTS
Although normal temperatures and slightly drier than normal conditions existed in the six-week periodafter planting, significant differences in early plant weight were noticed (Table 1). Plants werelargest with the liquid materials, intermediate with the dry materials and smallest with no starterfertilizer. Differences in small plant weight did not exist between the two liquid fertilizers orbetween the two rates of dry fertilizer. A possible explanation for the advantage shown with theliquid materials is the effect of placement. The liquids were placed in the seed zone between thedouble disc openers while the dry materials were applied in a conventional 2x2 placement.
Small plant P was increased significantly over the control and the liquid materials by the drymaterials (Table 1). No other nutrients were affected by the dry materials. Neither of the liquidmaterials increased the nutrient concentrations above those of the control. Perhaps this was due toa "dilution effect" with the larger plants associated with the liquid treatments.
Nutrient uptake, the product of nutrient concentration times small plant weight (dry matter), wasinfluenced by the treatments (Table 2). The higher levels of P, K, Ca and Mg were associated withthe larger dry matter accumulations found with both the liquid and dry materials with no differencebetween the liquid and dry materials. The liquid materials, however, did result in significantlyhigher Mn, Zn, Cu and B levels than the control. Uptake of Fe was not affected by the starterfertilizers.
Leaf nutrient concentrations shown in Table 3 were sufficient for optimum yields but were notinfluenced by any of the starter fertilizer treatments.

116
Table 1. Influence of starter fertilizer on the nutrient concentration in the small whole
plants at Waseca in 1981.
corn
Small
Treatment plant NutrientMaterial Rate weight P K Ca Mg Fe Mn Zn Cu B
g DM/plt.
2.7
3.6
3.7
3.1
3.2
No Starter
9-18-9 (liq) 5 gal/A7-21-7 (liq) 5 gal/A5-12-5 (dry) 95 lb/A8-20-8 (dry) 140 lb/A
Significance:-1-,P Level (%) 'A'BLSD (.05) :CV (%) :
**
99
0.4
10.3
.46
.45
.45
.51
.53
**
99
.02
3.1
5.00
4.96
5.05
5.10
5.17
NS
55
.46
.46
.46
.48
.48
+
92
4.1 3.6
.28
.27
.28
.28
.28
*
95
.01
3.3
860
865
685
675
850
NS
64
28.
iV
li
**, *, + are significant at the 99, 95, 90% levels, respectively;NS = not significant at the 90% level.
Probability levels of significant difference among treatment means.
80
82
82
80
87
NS
33
11.
38 12.4
35 11.4
35 12.3
36 11.5
10.7
10.9
9.9
10.6
38 11.0 10.3
NS
79
7.0
NS
52
13.
NS
25
13.
Table 2. Influence of starter fertilizer on the nutrient uptake in the small whole corn plantsat Waseca in 1981.
Treatment
Material Rate
No Starter
9-18-9 (liq) 5 gal/A7-21-7 (liq) 5 gal/A5-12-5 (dry) 95 lb/A8-20-8 (dry) 140 lb/A
SignificanceP Level (%)BLSD (.05)
CV (%)
12.2
16.2
16.6
15.9
17.1
**
99
2.0
11.
133
178
186
160
167
**
99
21
11.
Ca
12.3
16.4
16.9
15.0
15.4
**
99
1.9
11.
Uptake
Mg Fe-mg/plant-
2.2
3.2
2.5
2.1
2.8
7.4
9.6
10.1
8.9
9.2
**
99
1.1
10.
NS
86
29.
Mn
.21
.29
.30
.25
.28
**
99
.05
16.
Zn
10
,13
,13
,11
,12
*
98
.02
12.
Cu
.033
.040
.045
.036
.035
**
99
.007
15.
.028
.038
.036
.033
.033
*
98
.006
14.
Table 3. Influence
Waseca in
of starter
1981.
fertilizer on the nutrient concentrations in the corn ear leaf at
Treatment
N P K Ca
Nutrient
Mg Fe Mn Zn CuMater lal Rate B
No Starter
9-18-9 (liq)7-21-
5-12-
(liq)(dry)
8-20-8 (dry)
5 gal/A5 gal/A
95 lb/A140 lb/A
2.8
2.8
2.8
2.8
2.8
.33
.34
.33
.33
.34
08
01
00
03
00
.42
.43
.43
.43
.43
.27
.27
.27
.27
.28
105
106
104
106
106
71
65
68
67
66
-ppm-
21
19
20
20
19
2.8
2.8
2.4
2.5
2.4
3.8
3.8
3.4
3.6
3.4
Significance: NS NS NS NS NS NS NS + NS NS
P Level (%) : 16 59 23 13 21 5 21 94 86 29
CV (%) : 3.1 3.3 5.9 5.0 6.1 5.6 13. 6.3 13. 21.

117
Reductions in final plant population have been reported when applying liquid fertilizer materialswith the seed. The data shown in Table 4 indicate no effect of any treatment on plant population.Grain yield, moisture and protein were not influenced statistically by the starter fertilizer treatments. However, a trend toward higher grain protein with the starter treatments was evident forthe second year in a row.
Table 4. Influence of starter fertilizer on corn population, grain yield, grain moisture and grainprotein at Waseca in 1981.
SUMMARY
Treatment Final
population
Grain
Material Rate Yield Moisture Protein
x 10"J bu/A % %
No Starter 24.3 181.0 24.6 8.7
9--18-9 (liq) 5 gal/A 25.2 177.6 24.3 9.2
7--21-7 (liq) 5 gal/A 25.0 172.9 24.3 9.1
5--12-5 (dry) 95 lb/A 25.2 179.8 24.3 9.0
8--20-8 (dry) 140 lb/A 25.2 182.1 24.4 9.1
SignificanceP Level (%)CV (%)
NS
71
3.4
NS
88
3.5
NS
37
1.6
NS
79
4.6
Under these high soil test P and K conditions early plant growth was enhanced by the liquid fertilizer materials. However, nutrient concentrations in the small plants were generally not affected bythe starter fertilizers. Nutrient concentrations in the earleaf at silking were not influenced bythe starter fertilizer treatments. Plant population, grain yield, grain moisture and grain proteinwere not affected by the starter treatments.

118
SOIL TEST COMPARISON STUDY
Waseca, 1981
D.K. Langer, G.W. Randall and W.E. Jokela
Soil testing is one of the best and most economical methods of ascertaining the nutrient status ofthe soil. The test then serves as the basis for fertilizer recommendations for crops. Many privateand public laboratories provide that service to Corn Belt farmers. The purpose of this study is tocompare the soil analyses and fertilizer recommendations given by five regional laboratories forcorn production in Southern Minnesota. Working with the laboratories in this comparison study weshould be able to improve and standardize fertilizer recommendations for corn production.
PROCEDURES
Two experimental sites measuring 150' by approximately 300' were selected for sampling in October1979. One of the sites had a history of high P and K fertilization while the other had not receivedP or K since 1974. The soil type in the former is a Nicollet clay loam while that in the latter isprimarily Webster clay loam with some Nicollet clay loam. Both sites have been cropped to continuouscorn. Tile lines spaced at 75' intervals provide excellent drainage at both sites. Neither sitecan be irrigated.
Four samples consisting of approximately 35 cores each from a 0-7" depth were taken from each site.All samples were oven-dried at 95 F, crushed and mixed thoroughly. The samples were then subdividedand sent to five laboratories which test the majority of the soil samples from Southern Minnesota.Soil analyses requested consisted of pH, OM, extractable Pj, exchangeable K, extractable S and themicronutrients generally tested by each laboratory. Based on the results from the U of M laboratorythese two sites were then classified as being initially "very high" and "medium-high".
The fertilizer recommendations given by the five laboratories were then applied as five treatmentsin the spring of 1980 for corn. An additional check (no fertilizer) treatment was included in therandomized, complete-block design with six replications. After the 1980 crop, soil samples (3 cores/plot times 6 replications yielding 18 cores per treatment) were taken from each treatment and sentto the respective laboratory. This allows us to follow the buildup or decline of nutrients asaffected by the recommendations of a particular laboratory over a continuous, long period of time.
Fertilizer amounts based on the analyses and recommendations from the fall 1980 samples were thenapplied to the appropriate plots and incorporated by field cultivation in the spring of 1981. Thefertilizer recommendations were based on a yield goal of 160 bu/A of continuous corn. Corn (Pioneer3732) was planted at the rate of 27700 ppA in 30" rows on May 8 with 1 lb Amaze/A and no starterfertilizer. Chemical weed control consisted of 3h lb Lasso and 3 lb Bladex/A applied preemergence.
Ten, random, small, whole plants were sampled from the four center rows of each plot, weighed andsubmitted for analyses. The leaf opposite and below the ear was sampled from ten plants at silkingand submitted for analyses. Final populations were determined from 70' of row. Grain yield,moisture and protein were determined on corn harvested from the center two rows of each plot with amodified JD 3300 plot combine. Grain yields were converted to 15.5% moisture.
In September, 1981, 0-7" soil samples were taken from each treatment at each of the two sites andwere sent to the laboratory of the respective treatment. The recommendations obtained from thesesamples will be used for the 1982 growing season.
RESULTS
Very high testing site
The soil test results and the accompanying recommended fertilizer program of each laboratory areshown in Table 1 for the very high testing site. Nitrogen recotnmendations among the laboratorieswere quite similar while the P and K recommendations among the labs were substantially different.Various micronutrients and S were recommended by three of the four private labs.

119
Table 1. Soil test results and the recommended fertilizer programs on the very high testing siteat Waseca in 1981.
Soil Test Results1 Lab E
Test Lab A Lab B Lab C Lab D (UM)
pH 5.7 5.6 5.8 5.5 5.3
pH (buffer) 6.6 6.2 6.5 6.4 6.4
Phosphorus 29 H 36 L 29 37 VH 20 H
Potassium 141 M 180 L 120 158 H 108 MH
Organic matter (%) 3.8 H 4.9 M 3.8 H
Calcium 2390 M 2900 M 2405 VH
Magnesium 326 VH 450 M 356 M
Sulfur 6 L 15 M 25 A 7 L 6 LM
Iron 65 VH 75.2 VH 8+ A 5.6 VH
Manganese 33 VH 38.5 H 2+ A 2.1 VH
Zinc 2.1 M 2.9 H 1.0 M 1.1 M 1.3 H
Copper 0.8 L 1.0 M 0.4+ A
Boron 1.6 H 1.2 H 3.4 S
ENR (lb/A) 106 95 M
C.E.C.(meq/100g) 19.0 27.8 24.0
— All soil test results are stated in ppm unless noted 0:therwise.
Recommended Fertilizer Profit Lab E
Nutrient Lab A Lab B Lab C Lab D (UM)
Nitrogen 190 185 182 215 170
Phosphorus (P2O5) 35 60 ,
1603-'56 75 50
Potassium (K^O) 130 128 110 105
Sulfur 18 14 13 /.12*-',Iron
Manganese
Zinc 8
Copper 1
Boron
Lime (T/A) 2.0 4.5 5.5 3.5 5.0
•^ All values indicate pounds of nutrient recommended per acre for a yield goal of 160 bushelsof corn per acre.
— Value includes maintenance recommendation, plus 50% of the buildup recommendation which wasto be applied over a two-year period.
- As 5 qt/A of a material weighing 10 lb/gal and containing 5% Zn, 1% Fe and 1% Mn.
Grain yields were significantly affected by the fertilizer treatments (Table 2). All fertilizerrecommendations resulted in higher yields than the unfertilized check. The recommendations fromlabs D and B produced higher yields (P=.05 level) than that from lab E (U of M). With lab D, thismay have been due to the higher N rate or the Fe, Mn and Zn application, although the latter doesnot appear to be the reason when looking at the plant analyses. The higher K rate with lab B mayhave been responsible for the higher yield than with lab E. Slight differences in final populationexisted but was thought not to influence yield. Grain moisture among all laboratory treatmentswas equal and was significantly below the check.
Small, whole plant Ca, Zn and Mn concentrations were higher with the fertilizer treatments than thecontrol (Table 3). This is primarily due to the imbalance created by N deficiency in the checktreatment. Plant Zn was highest with lab B, probably a result of the 8 lb Zn/A recommendation forthe 1980 crop. Plant P, K, Mg, Fe and Cu were not affected by the different fertilizer recommendations.
Earleaf N, P, Ca, Fe and B concentrations among the five laboratories were not significantly different(P=.05 level) (Table 4). The higher K rate applied with treatment B did result in higher leaf K andlower leaf Mg than lab E (U of M). The Fe + Mn + Zn recommendation of lab D resulted in higher leafMn than the other labs but Fe and Zn were unaffected. The Cu recommendation from lab A and the Znrecommendation of lab C did not result In significantly increased leaf Cu or Zn in those treatments.

120
Leaf Zn levels were highest with recommendations from labs A and B which did not recommend Zn in1981. However, this may be carryover from the Zn recommended by these two laboratories for 1980(8 and 6 lb Zn/A, respectively). Leaf nutrient concentrations except Cu and B appeared to beadequate from the lab E treatment which has never received any nutrient except N, P and K. Leaf Cuand B levels in general appear low.
Table 2. Effect of fertilizer recommendations on corn final population, grain yield and moistureon the very high testing site in 1981.
Fertilizer Recommendations
Final
PopulationGrain
Lab Yield H20
A
B
C
D
E(UM)Check
lb/A^
190N +35P +130K +S+Cu
185N +60P +160K +S
182N +56P +128K +Zn
215N +75P +11OK +S+Fe+Mn+Zn
170N +50P +105K
/
ppA x 10" •*
24.2
25.2
25.2
24.6
23.5
23.8
bu/A
171.7
175.4
173.2
180.3
167.4
139.6
%
20.0
20.2
20.1
20.1
20.0
21.1
Significance Level(%) :z'BLSD (.05) :CV (%) :
95
1.5
4.4
99
7.7
4.2
99
.4
1.5
±1 P and K expressed on oxide basis.
•^ Probability level of significance.
Table 3. Effect of fertilizer recommendations on smal1 plant growth and nutrient concentrations
on the very high testing site in 1981.
Small plant Nutrient
Lab dry weight P K Ca MR Fe Mn Zn Cu B
g/plt. %--,_.____
A 4.4 .38 4.95 .42 .31 524 75 55 11.7 7.0
B 4.4 .39 4.98 .43 .31 403 74 58 11.4 7.2
C 4.6 .39 4.96 .44 .32 547 81 51 11.4 6.8
D 4.6 .39 4.97 .43 .31 507 82 50 11.7 6.4
E(UM) 4.2 .38 4.98 .42 .32 490 76 47 12.1 6.2
Check 4.4 .38 4.81 .40 .30 506 63 38 12.0 7.0
Signif(%) 13 33 39 99 75 63 99 99 14 94
BLSD(.05) .02 6 3
CV(%) 12. 3.4 3.8 3.7 3.7 23. 6.6 4.8 10. 8.9
Table 4. Effect of fertilizer recommendations on corn earleaf nutrient concentrations on the veryhigh testing site in 1981.
Nutrient
Lab N P K Ca Mg Fe Mn Zn Cu B
A 3.20 .31 1.92 .46 .34 111 71 32 3.4 3.9
B 3.17 .32 2.06 .46 .33 113 75 36 3.5 3.7
C 3.19 .32 1.98 .47 .34 114 79 31 3.7 3.9
D 3.27 .32 1.99 .48 .34 116 87 28 4.1 4.0
E(UM) 3.17 .32 1.88 .48 .37 114 74 26 3.7 3.8
Check 2.60 .29 1.84 .41 .30 96 44 20 2.6 3.2
Signif(%): 99 99 96 99 97 99 99 99 99 99
BLSD(.05): .11 .01 .16 .02 .04 5 9 3 .5 .3
CV(%) : 3.2 2.7 5.9 4.2 9.0 4.4 12. 8.9 12. 6.6

121
Medium-high testing site
The soil test results and the accompanying recommended fertilizer program of each laboratory areshown in Table 5 for the medium-high testing site. Nitrogen recommendations among the laboratorieswere quite similar while both the P and K recommendations varied substantially. Sulfur and variousmicronutrients were recommended by three of the four private labs.
Table 5. Soil test results and the recommended fertilizer programs on the medium-high testing siteat Waseca in 1981.
Soil Test Results1 Lab E
Test Lab A Lab B Lab C Lab D (UM)
pH 6.5 6.9 6.8 6.5 6.5
pH (buffer) 6.7 7.0
Phosphorus 14 M 24 L 22 24 M 12 MH
Potassium 163 L 180 L 120 228 H 100 MH
Organic matter (%) 4.2 H 7.4 M 4.2 H
Calcium 4300 H 5600 H 6090 VH
Magnesium 577 VH 770 M 1038 H
Sulfur 6 L 14 L 25 A 8 M 7 MH
Iron 37 VH 39.4 H 8+ A 5.6 VH
Manganese 21 H 16.1 H 2+ A 2.1 VH
Zinc 1.3 M 1.9 H 1.1 A 1.7 M 1.2 H
Copper 1.0 M 0.9 M 0.4+ A
Boron 1.7 H 1.5 H 3.4 A
ENR (lb/A) 114 UO H
C.E.C.(meq/100g) 35.0
•*• All soil test results are stated in ppm unless noted 1otherwise.
,/Recommended Fertilizer Program- Lab E
Nutrient Lab A Lab B Lab C Lab D (UM)
Nitrogen 185 185 .
90*'195^'
182 200 170
Phosphorus (P2O5) 80 56 90 80
Potassium (K20) 125 128 110 105
Sulfur 18 16
. 12*'..6*/
Iron
Manganese
Zinc 3
CopperBoron — ___ ___ _—
Lime (T/A) 1.5 0.5
— All values indicate pounds of nutrient recommended per acre for a yield goal of 160 bushelsof corn per acre.
— Value includes maintenance recommendation, plus 50% of the buildup recommendation which was
to be applied over a two-year period.
— As 5 qt/A of a material weighing 10 lb/gal and containing 5% Zn, 1% Fe and 1% Mn.
At this medium-high testing site the treatments that received fertilizer yielded significantly morethan the check (Table 6). However, there were no significant yield differences among the fertilizertreatments (recommendations). Grain moisture was reduced significantly from the control by all ofthe fertilizer treatments with no difference among the five laboratories. Final population was notdifferent among the treatments.
Small plant growth was increased over the check by all treatments which received fertilizer (Table 7).Plant growth was larger with all four of the private laboratory treatments compared to the publiclab (E). This may have been due to the higher application rate of K over the two-year period withthe private lab recommendations. Evidence of this is shown by higher K concentrations in the smallplants with the private lab treatments. Calcium and Mg show an inverse relationship to K which isexpected. Plant Zn responded to the lab A recommendation of 3 lb Zn/A in 1981 and 4.5 lb in 1980but differences among labs B-E were not significant (P=.05 level). Small plant P, Fe, Mn, Cu and B

122
were not influenced by the five laboratory recommendations.
The five laboratories did not show significantly different leaf nutrient concentrations (P=.10 level)(Table 8). The only nutrient to be influenced compared to the no fertilizer control was N, whichwas increased to the same level by all recommendations. This would indicate that the high P and Krates plus the Fe, Mn and Zn recommendations were not being utilized by the plants even under thesehigh yield conditions. Again, all nutrients except Cu and B appeared to be at or above publishedsufficiency levels.
Table 6. Effect of fertilizer recommendations on corn final population, grain yield and moistureon the medium-high testing site in 1981.
Lab
A
B
C
D
E(UM)Check
Fertilizer Reconnyendations
185N +80P +125K +S+Zn
185N +90P +195K +S
182N +56P +128K
200N +90P +110K +Fe+Mn+Zn
170N +80P +105K
Signif. Level (%)BLSD(.05)CV (%)
J P and K expressed on oxide basis.
Final
population?rrppA x 10'
25.3
24.9
24.6
24.5
25.2
24^232~
5.4
Grain
Yield H20bu/A %
181.3 27.7
180.0 27.7
176.2 27.8
181.1 27.6
183.2 27.4
120.1 29.7
99
9.6
5.3
99
0.6
2.0
Table 7. Effect of fertilizer recommendations on small plant growth and nutrient concentrationson the medium-high testing site in 1981.
Lab
Small plant Nutrientdry weight P K Ca Mg Fe Mn Zn Cu B
g/plt.
A 3.9
B 3.8
C 3.9
D 4.0
E(UM) 3.4
Check 2.2
Signif.(%)BLSD(.05)CV(%)
99
0.4
10.
.41
.41
.43
.42
.41
.38
99
.02
3.3
35
41
40
32
77
03
99
.26
6.0
.57
.58
.59
.58
.63
.64
99
.03
4.0
.43
.43
.43
.43
.52
.58
99
.06
10.
475
483
534
522
464
596
46
26.
68
71
70
70
73
63
87
8.8
-ppm-
47
42
39
43
40
39
96
6
9.8
13.3
12.2
13.2
12.9
12.4
14.7
99
1.1
6.9
8.3
8.4
8.1
7.3
8.2
8_;_3" 40
14.
Table 8. Effect of fertilizer recommendations on corn earleaf nutrient concentrations on the medi-
urn-high testing site in 1981.
Nutrient
Lab N P K Ca Mg Fe Mn Zn Cu B
%—.—.
ppm
A 2.78 .28 1.62 .48 .41 90 49 23 2.5 4.2
B 2.88 .28 1.64 .46 .40 90 48 22 2.5 4.0
C 2.84 .28 1.56 .48 .44 88 47 21 2.4 3.9
D 2.88 .30 1.62 .47 .39 88 53 22 2.6 4.0
E(UM) 2.91 .30 1.67 .50 .41 94 55 23 2.8 3.9
Check 2.18 .28 1.52 .45 .38 87 41 24 2.7 3.6
Signif•(%): 99 85 34 80 66 13 59 34 39 69
BLSD(. 05) : .17
CV(%) 5.5 6.5 11. 6.7 12 10. 24. 14. 18 9.7

123
SUMMARY - 1981
There were substantial differences among the laboratories' fertilizer recommendations at both sites.Nitrogen recommendations were generally similar, but P and K recommendations differed greatly amongthe laboratories. Sulfur and various micronutrient recommendations were provided by all fourprivate labs. Small growing plants showed some uptake response to the micronutrients and K recommended. Earleaf nutrient concentrations among the lab recommendations were generally not significantly different except for K on the medium-high testing site. Some carryover of Zn from the 1980 recommendations was observed. Grain yield differences were not observed among the 5 lab recommendationsat the medium-high testing site; however, significant yield differences were found on the very hightesting site.
Fertilization resulted in a slight profit ($13-19/A) on the very high testing site with no realdifference among the labs with respect to profit or loss from the various recommendations (Table 9).However, fertilizer costs ranged from $77/A with lab D to $52/A with lab E. On the medium-hightesting site a substantial return was gained from fertilization ($66-92/A). Also, the laboratories'recommendations resulted in fertilizer costs ranging from $58-78/A while net return varied by $26/Aamong the labs.
Table 9. Effect of fertilizer recommendations on yield, value, fertilizer cost and the resultingeconomic return on both the very high testing site and medium-high testing site atWaseca in 1981.
Very High Testing Site Medium-High Testing Sitia
Value Fert.J./
Return2-Value Fert.J
._/
Return^Lab Yield <?$2.40/bu cost Yield @$2.40/bu cost
bu/A $/A- bu/A $/A-
A 172 413 60 17 181 434 70 76
B 175 420 66 18 180 432 78 66
C 173 415 65 14 176 422 58 76
D 180 432 77 19 181 434 76 70
E(UM) 167 401 52 13 183 439 59 92
Check 140 336 0 — 120 288 0 —
-1- Using May 1, 1981 prices for each nutrient expressed as dollars/lb as follows: N, .15;P20s, .25; K20, .13; S, .18; Mn, 1.04; Zn, .89; Cu, 2.80; B, 1.90.
•*• Return yield value @$2.40/bu - fertilizer cost - value of check treatment.
Conclusions from the 1981 study can be summarized as follows:
1. Application of high rates of P and K to soils already testing very high is not practical.
2. No direct benefit or response was obtained with the addition of S or the micronutrientseven though they were recommended by some laboratories.
TWO-YEAR SUMMARY
Summarizing the 1980 and 1981 data from the very high testing site generally showed no benefit forfertilization (Table 10). This was due to fertilizer recommendations being made for a goal of180 bu/A in 1980 while the yields obtained barely exceeded 100 bu/A due to drought conditions. Thelowest total fertilizer cost was with lab E ($92/A) and this resulted in the highest return. Lab Drecommended the highest fertilizer cost. Recommendations by all private labs did not pay for thefertilizer used in this study; partially because of the dry conditions.

124
Recommendations by all laboratories paid for the fertilizer in the medium-high testing site(Table 10). Return above the unfertilized check ranked the labs in the order E>OA>D>B. Highestfertilizer costs were recommended by lab B with lowest costs by lab E (U of M).
Table 10. Effect of fertilizer recommendations on total corn yield, total fertilizer cost andthe resulting economics on both the very high and medium-high testing site at Wasecafrom 1980 and 1981.
Very High Testing Site Medium-High Testing Site
Total Two-Year Total Two-Year
Crop .Value1-'
Fert.
Return4Crop .Value1'
Fert.
Return4'Lab Yield Cost. Yield Costbu/A
270
bu/A
317A 707 131 -48 842 153 56B 275 720 135 -39 308 816 177 6C 279 733 121 -12 312 830 135 62D 282 738 148 -34 310 821 163 25E(UM) 274 722 92 6 316 838 112 93Check 236 624 0 -- 235 633 0
-1- Price used per bushel was $3.00 and $2.40 in 1980 and 1981, respectively.,/— Return over two-year period = crop value - fertilizer cost - value of check treatment.
n
r\
o

o
125
EFFECT OF SYMBOOSTER ON SOYBEAN PRODUCTION
University of MinnesotaSouthern Experiment Station
Waseca, MN — 1981
Gyles W. Randall
Symbooster is "a biostimulant consisting of enzymes" and works as "a chemistry of enzymes and micro-minerals that stimulate the bioactivity of the soil and their enhanced activity results in an improvedyield", according to Agro-K Corporation, who markets the product. Claims are made that "Symboosterwill increase the available form of phosphorus and potassium fertilizer making them more available tothe plant to utilize for optimum growth development". They further claim that "excellent resultshave been posted to date on potatoes, sugar beets and soybeans".
The purpose of this study was to evaluate the effect of Symbooster on soybeans produced on a fertile,south-central Minnesota soil.
EXPERIMENTAL PROCEDURES
The soil type used was a Webster clay loam with pH=6.9, Bray No. 1 extractable P=38 lb/A (High) andexchangeable K=284 lb/A (High). Following wheat in 1980, 0+60+150 (lb N+P20s+K20/A) was broadcastapplied and chisel plowed in. A combination of Treflan (1 qt/A) + Amiben (5 qt/A) was applied andincorporated on May 6 to control weeds.
A randomized, complete-block design consisting of six replications and three treatments was used.Each individual plot measured 55' x 10'. Two rates of Symbooster (1 gal/A—recommended rate and2 gal/A) were applied with a bicycle sprayer on May 19 and were field cultivated in lightly. Hodgson78 soybeans were planted in 30" rows at a rate of about 7 beans/foot on May 22. Twenty uppermost,mature trifoliate leaves were sampled at mid-bloom on July 29 from each plot. The center two rowsof each 4-row plot were harvested by a ALAMC0 plot combine on October 23. Final stand and seed
isture were taken at that time.^RESULTS
Soybean seed yield, seed moisture at harvest and final population were not influenced (P=.10 level)by the Symbooster treatments (Table 1). Probability levels indicate only an 8% chance that the 0.3bu/A difference in yield between the control and the recommended Symbooster rate was significant—even with a very low C.V. Symbooster also did not influence (P=.10 level) the soybean leaf nutrientconcentrations. All nutrient concentrations were considered to be optimum for high soybean yields.
Table 1. Influence of Symbooster on soybean production and leaf nutrient content at Waseca in 1981.
Symbooster Final Seed Nutrients-Treatment Stand Yield P K Ca Mg Fe Mn Zn Cu B_
pi. /foot bu/A % ppm
Check 6.0 44.7 .50 2.25 1.38 .49 94 160 24.6 8.2 53
1 gal/A 5.9 45.0 .51 2.23 1.37 .48 94 163 24.7 8.0 532 £al/A 5^9 44J_8_ _ _ J>9 _ _2JL15 _ _K34 _ _.48 96 _ _149_ _ 23^.8_ _ 8.2 _ _ 52
Significance:-2-^ NS NS NS NS NS NS NS NS NS NS NSP Level (%) -A' 32 8 42 84 28 48 25 89 28 52 61CV (%) : 5.7 3.0 6.4 3.9 6.1 2.4 5.2 7.0 8.0 3.8 2.9
-*- Uppermost, mature trifoliate at mid-flowering.
- NS = not significant at the 90% level.
— Probability level at which difference in means would be significant.
SUMMARY
"o. the basis of this one-year study, Symbooster cannot be recommended for soybean production ontortile soils in south-central Minnesota.

126
MAXIMUM YIELD DEMONSTRATION
University of MinnesotaSouthern Experiment Station
Waseca, MN — 1981
Gyles W. Randall
Numerous studies have been initiated over the last few years to "pull out the stops" in an effort tomaximize corn and soybean yields. The purpose of this effort was to establish a "non-limiting" environment in which corn and soybean yields could be maximized in a demonstration approach withoutreplication.
EXPERIMENTAL PROCEDURES
The site selected was formerly a garden demonstration area which had a long history of high fertilization rates. The soil was a moderately well drained Nicollet clay loam with a 2-4% south-facing slope.Each crop system was planted in an area measuring 20' x 65'. Trickle irrigation using Chapin Water-matic Twin Wall 8 mil, 15" outlet tubing was installed at 30" spacings. Flow meters measured application rates. Water was applied from July 1 thru July 10. Tensiometers were installed at depths of12" and 30" in all plots. Readings were taken on Monday, Wednesday and Friday at 9:00 A.M. Thecorn was hand planted while a Tye drill was used to plant the soybeans. The corn plots were harvestedand measurements taken on the center 40' of each of the center 4 rows of each 8-row plot. Soybeanyields were taken from combine harvested areas measuring 10' x 50' from the center of each plot.Additional experimental procedures are outlined in Table 1.
Table 1. Experimental procedures used in "non-limiting" environment demonstration at Waseca in 1981.
Parameter
Cont.
Corn
Corn
after
Soybeans
Crop SysitenSoybeansafter
Corn
Cont.
Soybeans
Tillage: F. Chisel
Spr. f. cult.(2x)
F. Chisel
Spr. f. cult.(2x)
F. Chisel
Spr. f. cult.(2x)
F. Chisel
Spr. f. cult.
(2x)
Fertilizer: 350 lb N/A
-100 as AN (4/15)-100 as soybean
meal (4/17) PPI-150 as Urea (6/12)No P or K
350 lb N/A-100 as AN (4/15)-100 as soybean
meal (4/17) PPI-150 as Urea (6/12)No P or K
None None
Hybrid-Variety:
Planting date:
Planting rate:
Row width:
Herbicide:
Insecticide:
Rainfall:
Irrigation:
Harvest date:
Harvest
method:
Agway 849XPioneer 3732
4/17
34800 ppA
15"
Lasso + Bladex
Furadan (3 lb/A)
July 2.75"
9/21 6. 10/2
Hand
Agway 849XPioneer 3732
4/17
34800 ppA
15"
Lasso + Bladex
Furadan (3 lb/A)
MayJune
JulyAugust
3.75"
9/21 & 10/2
Hand
Vickery Vickery
5/19 5/19
160000 ppA 160000 ppA
6 2/3" 6 2/3"
Treflan + Amiben Treflan + Amiben
None None
3.60"
3.86"6.21"
7.38"
None None
10/22 10/22
Combine Combine

127
The effect of a high fertilization history is shown in Table 2 from samples taken in 1980. Soil testP and K levels down to 24 inches were extremely high. Soil teat Zn and S were judged to be very highand high, respectively. Soil pH was slightly acid with medium to high levels of organic matter.
Table 2. Soil tests from "non-limiting" environment demonstration at Waseca.
Crop Sys tern
Corn SoybeansCont. after after Cont.
Depth Corn Soybeans Corn Soybeansinches
0-6 6.6 6.4 6.1 6.4
6-12 6.4 6.3 6.0 6.2
12-18 5.9 5.9 5.6 5.8
18-24 5.9 5.7 5.4 5.7
0-6
0-6
6-12
12-18
18-24
0-6
6-12
12-18
18-24
0-6
0-6
4.5
317
285
101
42
930
820
420
380
OM (%)
5.0 4.4
Bray Pi (lb/A)-
262 255
260 200
148 95
60 28
Exch. K (lb/A)-
960 880
890 520
880 490
940 440
Zn (ppm)
6.3 (VH) 5.2 (VH) 4.5 (VH)
15 (H)
S (ppm)
15 (H) 13 (H)
4.4
235
195
112
30
990
920
920
900
4.4 (VH)
14 (H)
RESULTS
Tensiometer values shown in Table 3 indicate sufficient soil moisture levels throughout the season.This soil has an available soil water holding capacity of over 10 inches in the 0-5' profile. Withthat in mind, the few occasions when values were greater than 50 centibars is of no consequence.This is especially true at the 12" level because we desire and encourage the roots to penetrate todepths of 4-5'. On only one occasion (7/29) did the 30" value equal 50 centibars or greater. Soilmoisture drawdown was greatest for corn following soybeans, somewhat less for continuous corn andleast for soybeans.
Nutrient concentrations in the diagnostic tissues shown in Table 4 indicate sufficient amounts of allnutrients with the possible exception of Mg in corn. The Mg levels were somewhat lower than normalprobably due to the extremely high soil K levels. The Agway 849X hybrid accumulated substantiallyless Mg and somewhat less K and Zn than did Pioneer 3732. High soil K did not result in extremelyhigh tissue K levels. Copper levels also appeared to be low, but this may be associated withdifferent analytical methods used now (ICP) compared to previous methods when Cu sufficiency levelswere documented.
Yields from this demonstration fell below our goals of 250 and 80 bu/A for corn and soybeans, respectively (Table 5). The highest corn yield was 222.4 bu/A with the Agway 849X variety following soybeans. When this variety followed corn, severe rootworm damage occurred and resulted in 84% of theplants lodged, 7% barren stalks, a lower final population and the lowest yield in the demonstration.Corn yield following soybeans was higher than following a previous crop of corn, although very little

128
difference was noted in the Pioneer 3732 hybrid. Protein levels were less than in 1980 but were notinfluenced by previous crop or hybrid. Final population was substantially lower than the plantingrate. This was primarily due to very cold soils and delayed emergence (18-19 days) following thevery early planting date (April 17). Also, strong winds in early June broke off some of the Agway849X plants at the soil surface. Yields were taken at physiological maturity; thus, grain moisture(grain + cob) was quite high.
Table 3. Tensiometer readings from June 10 thru September 4, 1981.
Crop System
. Cont. Corn C-Sb Sb-C Cont.
12"
Sb
Week of-1-' Depth(in): 12" 30" 12" 30" 12" 30" 30"
6/106/176/247/17/87/157/22
7/298/58/128/198/26
9/2
22J
8
37
32
60
6
14
10
18
17
22
26
8
lrW9
9
8
11
8
11
13
22
24
9
11
10
35
34
77
82
61
17
57
57
34
6
17
28
7
-centibars-
14
12
14
13
15
20
35
50
28
10
12
16
11
6
2
4
5
64
6
9
4
6
3
9
11
11
— Readings taken on Monday, Wednesday and Friday A.M.
— Each value is an average of 6 readings (3 dates x 2 tensiometers).
i/ Each value is an average of the 3 dates.
12
10
9
9
12
8
12
16
27
42
21
33
11
13
6
11
10
54
8
25
23
54
34
38
29
8
13
8
7
7
10
8
9
10
13
11
8
9
9
Table 4./
Nutrient concentrations in the leaf-
at Waseca in 1981.
from the "non-limiting" environment demonstration
Crop System Hybrid N Ca Mg Fe Mn Zn Cu
Cont. Corn A849X 2.95 .45 2.44 .56 .13 105 29 15 4 4
P3732 2.92 .40 2.56 .47 .23 141 40 21 5 6
Corn-Sb A849X 2.92 .43 2.47 .55 .13 138 39 21 4 4
P3732 2.99 .39 2.89 .44 .22 209 49 25 6 5
Sb-C — .47 2.24 1.05 .32 92 55 37 3 49
Cont. Sb — .45 2.10 1.06 .32 93 50 32 3 50
x/ Corn: leaf opposite and below the ear at silkingSoybeans: uppermost, fully mature trifoliate at mid-bloom
Table 5. Corn and soybean production in a "non-limiting" environment at Waseca in 1981.
Crop System
Hybrid-Varlety
Cont. Corn A849X•i .. p3732
Corn - Sb A849X
P3732
Soybeans
Cont. Sb
VickeryVickery
Grain
Yield Moisture
bu/A
170.4 40.2
193.0 34.8
222.4 40.3
197.3 35.6
42.1
39.6
14.0
13.9
Prot.
9.1
9.2
8.9
8.9
Barren
Stalks
Root +
Stalk
Lodging
81
14
3
6
Final
Popl'n* 10"J
26.3
28.5
29.6
32.2

129
The wet weather during 1981 resulted in Increased internodal growth of the soybeans, severe lodgingas early as mid-July, and relatively poor yields (Table 5). Soybean yield following corn was 2.5 bu/Abetter than the yield of continuous soybeans. Disease (Septoria, Brown stem rot and downy mildew)evidence began to show by late August. Brown stem rot was most prevalent with continuous beans. Theconductive tissue of many plants with continuous soybeans was rotten by August 26. This resulted inaverage soybean size of 154 mg/seed compared to 168 rag/seed with soybeans following corn.
Total above ground plant material was weighed, separated into grain and fodder, dried and weighed tocalculate dry matter production. The Agway hybrid produced 11.627 tons dry matter/A when followingsoybeans and in both crop systems out-produced the Pioneer hybrid (Table 6). However, the Pioneerhybrid did consistently show a higher grain:stover ratio as indicated by harvest index values of .50and .51. Fodder N was slightly higher for continuous corn with little consistent difference betweenhybrids. Total N uptake (grain + fodder) was highest for the Agway 849X hybrid over both croppingsystems and was well below the 350 lb N/A application rate. Total N uptake as a percent of N application ranged from 55 to 71% and indicates that our N application rate should have been sufficient.
Table 6. Total
the "i
drynon-
matter production, harvest index, fodder N and total Nlimiting" environment demonstration at Waseca in 1981.
uptake of the corn in
Hybrid
Total
DryMatter
Harvest
Index
Fodder
Total
N
Crop System N Yield Uptake
Cont. Cornit ii
Corn-Sbii it
A849X
P3732
A849X
P3732
T/A
10.079
9.217
11.627
9.100
.40
.50
.45
.51
%
0.84
0.84
0.78
0.65
T DM/A
6.060
4.650
6.366
4.432
lb/A
219
212
249
191
Soil samples were taken in one-foot increments to a depth of 5' from the corn plots following harvest.Nitrate-N analyses show a relatively small amount of residual N in the profile following continuouscorn but a substantial carryover of NO3-N with the corn-soybean sequence (Table 7). The lower levelsfollowing continuous corn could be due to increased immobilization and denitrification due to thehigh amount of corn residue (ca 5 T/A) incorporated from the previous crop. These values alsoindicate the N application rate of 350 lb/A was in excess of demand when corn followed soybeans.
Table 7. Residual NO3-N left in the soil profile after harvest as influenced by cropping system.
Profile Crop System
Depth Cont. Corn Corn-Sb
ft. —lb NOj-N/A—
0-1 21 156
1-2 17 60
2-3 21 54
3-4 20 44
4-5
Total
16
95
31
345
DISCUSSION
The number of frustrations and hazards encountered in 1981 was reduced from 1980. Much of this wasdue to increased precipitation, thicker plastic irrigation tubing (8-mil vs 4-mil) and reducedlodging. Birds, striped gophers and squirrels were still a problem but corrective measures, i.e.,shotguns, poison, a netting over the plots following tasseling and run down and under a 3' high wirefence which surrounded the plots, almost eliminated these problems.
Final population was reduced from 40000 ppA in 1980 to about 30000 ppA in 1981. This reduction wasmore than intended but did result in less premature death and lodging. However, I think that ahigher population should have been maintained to maximize yields.

130
Selection of the two hybrids with a fairly large difference in relative maturity was good. Agway849X (120-day RM) even though planted early did not reach physiological maturity until the firstfall frost (September 28) while Pioneer 3732 (105-day RM) reached maturity by September 7. Growingdegrees during 1981 were 7% below normal, so under these conditions a 120-day hybrid would be expected to encounter difficulty maturing before a killing frost.
Hybrid differences were also noticed in seed vigor, brittleness and in root development. Seedlingemergence was slower (1-2 days) with 849X and the stands were poorer which indicated germinationproblems with early planting and cool soil temperatures. The high wind speeds of June 11 (70 MPH)broke off some of the Agway 849X plants while the Pioneer 3732 plants were not broken. Even thougha very heavy application of Furadan (3 lb a.i./A) was used, the 849X hybrid lodged extensively whenin continuous corn. Either the rootworms found this root environment to be more favorable or the
root system of this hybrid was less developed.
Fodder production was quite high, especially with Agway 849X. Because all dry matter except theears are returned to the soil, we can expect immobilization of significant fertilizer N in theseplots in 1982.
FUTURE
Because of soybean diseases and poor yields, corn will be planted in all plots in 1982. The sametwo hybrids will be used at a planting rate of 40000 ppA. Another short season (probably about80-day RM) will be used. Also, we would like to try some of the 25-5" or 23-7" row spacings.Nitrogen will be applied at 400 lb N/A following corn and 300 lb/A following soybeans. Othermanagement practices will remain similar to 1981.
ACKNOWLEDGMENT
Sincere appreciation is extended to the Potash & Phosphate Insitute for their financial assistance tothis project.

131
NITROGEN INCORPORATION STUDY
Waseca, 1981
G.W. Randall, H.L. Meredith and D.K. Langer
With increasing usage of post-plant application of nitrogen (N), there has been a considerableamount of attention given to whether or not it is necessary to incorporate surface-applied N formaximum corn yield and greatest N efficiency. The purpose of this study was to determine the valueof incorporating three sources of surface-applied N fertilizer by measuring corn yield and leaf andgrain N concentration.
EXPERIMENTAL PROCEDURES
Thirteen treatments, involving a factorial with 3 sources of N, 2 rates of N and 2 methods of application (incorporation vs no incorporation), plus a check treatment, were replicated six times andapplied to a Nicollet clay loam soil (Table 2). Within each replication the incorporation treatmentsserved as main plots with the six source-rate treatments randomized as subplots. Each individualplot measured 10' wide (4 rows) by 55' in length.
The previous crop was corn which had been moldboard plowed immediately after receiving a broadcastapplication of 0+30+120 (lb N+P205+K20/A) in the fall of 1980. Prior to planting the incorporatedN treatments were applied on May 11 and field cultivated in.
Corn (Pioneer 3901) was planted at 27700 plants/A with 1 lb Amaze/A on May 12. Weeds were chemicallycontrolled with Lasso (3*4 lb/A) and Atrazine (3 lb/A). The nonincorporated treatments were surface-applied on May 27.
Two soil cores/check plot were taken to a 5-foot depth and composited into 1-foot increments fromeach of the replications on May 6. These samples were analyzed for NO3-N. In addition, 0-6"samples were taken from each plot in July for pH determination of the surface soil.
Leaf samples were taken from 10 random plants at silking. Population was determined from 35' of rowprior to harvest. Grain yield, grain moisture and grain protein were determined on corn harvestedfrom the center two rows of each plot with a modified JD 3300 plot combine on October 12.
RESULTS
The site selected for the study contained a moderate amount of NO3-N in the 5-foot profile (Table 1).Most of the NO3-N was found in the 0-2' layer with little accumulation below that depth.
Table 1. Nitrate content of the soil profile at the beginning of the study in 1981.
Depth N03-W1feet lb/A
0-1 34( 7.5)1-2 30( 5.9)2-3 16( 2.1)3-4 16( 4.4)4-5 16( 2.6)
Total 112(18.2)
•*• Each value is an average(standard error of mean)from the six check plots.
Two separate analyses of variance statistical tests were conducted on the data. The first includedall treatments and indicates that significant differences (P=.01 level) in leaf N, yield, grainmoisture and grain N were found (Table 2). All N treatments showed higher leaf N concentrations,grain yields and grain N concentrations when compared to the check. Final population and soil pHwere not related to treatment and, thus, should not have had a bearing on any particular treatment.

132
Table 2. Influence of nitrogen rate, nitrogen source and incorporation on soil pH, leaf N, finalpopulation, grain yield, grain moisture and grain nitrogen at Waseca in 1981.
N Treatments
Soil
i pH
Leaf
N
Final
Population
Grain. Incor-
Rate Source-*- poratio: Yield Moisture N
lb/A % x 10-J bu/A ———————A"
0 6.7 2.32 24.6 138.2 26.0 1.12
75 AN No 6.7 2.64 25.2 167.4 25.3 1.24
75 AN Yes 6.6 2.67 25.2 170.8 24.7 1.27
75 Urea No 6.8 2.67 24.7 164.9 25.3 1.20
75 Urea Yes 6.7 2.72 25.2 159.2 24.8 1.19
75 28% No 6.6 2.47 25.4 158.2 26.1 1.22
75 28% Yes 6.7 2.63 24.9 170.5 24.8 1.25
150 AN No 6.6 2.75 25.2 170.6 25.0 1.24
150 AN Yes 6.7 2.74 25.1 177.7 24.0 1.31
150 Urea No 6.7 2.72 25.1 180.1 24.6 1.25
150 Urea Yes 6.8 2.70 25.9 175.9 24.2 1.29
150 28% No 6.7 2.62 25.3 167.4 25.0 1.26
150 28% Yes 6.7 2.71 25.0 176.3 24.4 1.26
Signif. Level(%) */ <1 99 22 99 99 99
BLSD(.05) .14 10.7 0.8 .08
CV(%) 5.6 4.5 4.6 5.8 2.8 5.4
Individual Factors
N Rate (lb/A)75 6.7 2.63 25.1 165.2 25.2 1.23
150 6.7 2.71 25.3 174.7 24.5 1.27
Signif. Level(%) 42 99 59 99 99 99
N Source
AN 6.6 2.70 25.2 171.6 24.8 1.27
Urea 6.7 2.70 25.2 170.0 24.7 1.23
28% 6.6 2.61 25.2 168.1 25.1 1.25
Signif. Level(%) 93 99 4 64 96 76
BLSD(.05) .05 0.3
Incorporation
No 6.7 2.64 25.1 168.1 25.2 1.24
Yes 6.7 2.70 25.3 171.7 24.5 1.26
Signif. Level(%) 2 53 29
Signif. Level
70
(%)
88 66
Interactions
Rate x Source <1 85 37 93 26 72
Rate x Incorp. 78 82 32 12 54 47
Source x Incorp. 31 95 73 99 68 41
Rate x Source x Incorp. 74 6 1 24 78 51
J./
2/
AN = 33% N, Urea = 45% N, UAN => 28% N solution.
Probability level of significance.

133
A second analysis, with the N check plots omitted, was made to accurately estimate the source, rateand incorporation effects and their interactions. The 150-pound N rate resulted in significantlyhigher leaf N, grain yield and grain N and lower grain moisture than the 75-pound rate (Table 2). Acomparison of N sources indicated highest leaf N with ammonium nitrate (AN) and urea (U) and lowestwith UAN. Grain yield and N were not influenced by the three N sources. The incorporation of the Ndid not influence any of the parameters measured when averaged over N source or N rate as comparedto leaving the N on the soil surface.
Significant interactions between N source, rate of application and surface application with or without incorporation were not common but had significant implications (Table 2). The significant ratex source interaction for yield was due to a 18.0 bu/A yield increase at the 150-lb N rate with Uover the 75-lb rate while the AN and UAN only showed 5.1 and 7.4 bu/A increases, respectively. Thesignificant source x incorporation interaction for leaf N indicates that leaf N was not increasedby the incorporation of AN or U but was increased significantly by the incorporation of UAN. Asignificant source x incorporation interaction was also found in grain yield. Incorporation resultedin a slight yield decrease with U (4.9 bu), a slight increase with AN (5.2 bu) and a significantincrease with UAN (10.6 bu). These data indicate that the incorporation of UAN was more importantthan the incorporation of either AN or U for improving N efficiency.
The weather conditions in the 10 days after application of the non-incorporated treatments are shownin Table 3. A slight rain (0.06") occurred within 12 hours after the N application with another0.10" the following day. This dissolved the N into the surface soil. Only 0.36" of rain wasrecorded during the 10-day period following N application. Air temperatures were quite mild duringthis 10-day period. Maximum air temperature averaged 78 F and ranged from 68 F to 84 F. In thenext 10-day period, measurable amounts of rain occurred in 5 days and totaled 2.00". Surface soilswere saturated during half of this time in which maximum air temperatures averaged 67 F.
Table 3. Air temperature and precipitation in the 10-day period following surface application ofN in 1981.
Air Temperature
Day Max Min Precipitation
°F_ inches
1 (N applied) 71 55 0.06
2 79 58 0.10
3 80 47
4 68 47
5 82 59
6 82 61 0.03
7 75 50 0.15
8 73 53
9 84 58 0.02
10 82 54
SUMMARY
The incorporation of UAN did improve yield and leaf N under these experimental conditions in 1981.Incorporation of ammonium nitrate or urea did not influence N efficiency. Leaf N was significantlyless and grain moisture higher with UAN than with the other two sources.

134
ROTATION NITROGEN STUDY
Waseca, 1981
G. W. Randall and D. K. Langer
Increasing the efficiency of fertilizer N along with reducing fertilizer N recommendations by improveddiagnostic techniques, symbiotic N fixation, crop rotation, etc. are goals which are gaining widespread research support throughout the United States. The adoption of crop rotations or sequencesmay play a vital role in the conservation of N. The purpose of this study is to determine the Nneeds of corn following corn, soybeans, wheat and corn removed as silage in a crop sequence study.
EXPERIMENTAL PROCEDURES
Four crop sequences (continuous corn, corn-soybean, corn-wheat and corn-wheat + alfalfa) were begunin 1974 on a Webster clay loam. Each N plot within each crop sequence is 15' wide (6 rows) by 50*long. Rates of N (0, 40, 80, 120, 160 and 200 lb N/A) have been applied annually to corn.
The corn-wheat + alfalfa sequence was dropped in 1981 in favor of a continuous corn system where allof the corn was removed as silage the preceding year. This gives us a comparison of the N needsbetween grain removal only compared to total above-ground biomass removal.
In 1981, anhydrous ammonia was applied on April 25 to all corn plots. Wheat received 50 lb N/A asurea before planting. Broadcast P and K of 30 + 120 lb P20s and K20/A were applied in the fall of1980 before moldboard plowing all plots. Starter fertilizer was not applied.
Each corn plot was split lengthwise and two corn hybrids (Pioneer 3732 and Pioneer 3901) wereplanted in 30" rows at 27700 ppA on May 1. Amaze was applied to all corn plots at 1 lb/A to controlrootworms. Era wheat was planted on May 18. Each of the previous year's corn-soybean plots weresplit so that Corsoy was planted on half of each plot and Hodgson in the other half on May 18.
Weeds were chemically controlled along with one cultivation of the corn. A combination of 34 qtLasso plus 3 lb Bladex/A was applied preemergence to corn. Soybeans received 34 qt Lasso plus54 qt Amiben/A applied preemergence.
Corn leaf samples were taken at silking from rows 2 and 3 (Hybrid A) and from rows 4 and 5 (Hybrid B)of each 6-row plot. Corn yields were taken by mechanically harvesting the same rows. Grain moistureand protein data were obtained on the harvested samples.
RESULTS
A significant grain yield and leaf N response to fertilizer N was shown with both hybrids regardlessof the previous crop (Table 1). The Pioneer 3901 hybrid yielded slightly more than the P3732 butgenerally contained less leaf N. When averaging the two hybrids together grain yield response to N(200 lb N/A) ranged from 43 bu/A following soybeans to 80 bu/A following continuous corn (grain).Yield responses of 59 and 57 bu/A resulted following corn removed for silage and wheat, respectively.When no N was added yields were lowest for continuous corn (grain), intermediate following continuouscorn (silage) and wheat and highest following soybeans. Yields were maximized at 160-200, 160, 120and 120-160 lb N/A when continuous corn (grain), corn (silage), soybeans or wheat were the precedingcrops, respectively. At the 200 lb/A N rate corn yields were 0, 5 and -1 bu/A higher followingcorn (silage), soybeans, or wheat as compared to continuous corn. This was consistent with bothhybrids but was considerably different than in past years. The reason is thought to be due to theextremely favorable weather conditions in 1981 which did not provide any stress situations. Also,the hybrids used in 1981 are perhaps much more tolerant to a monoculture system than the previoushybrid (Pioneer 3780).
When no N was added, leaf N was highest following soybeans, intermediate following wheat and corn(silage), and lowest following continuous corn (grain). At the 200-lb N rate differences in leaf Nwere not found among the previous crop histories.
To determine if N from the 1980 application to corn carried over and affected soybean yields, soybeansfrom the 0 and 200 lb N/A treatments were harvested from all 5 replications. The data shown inTable 2 indicate no effect of the previous year's N treatment on soybean yields in 1981.
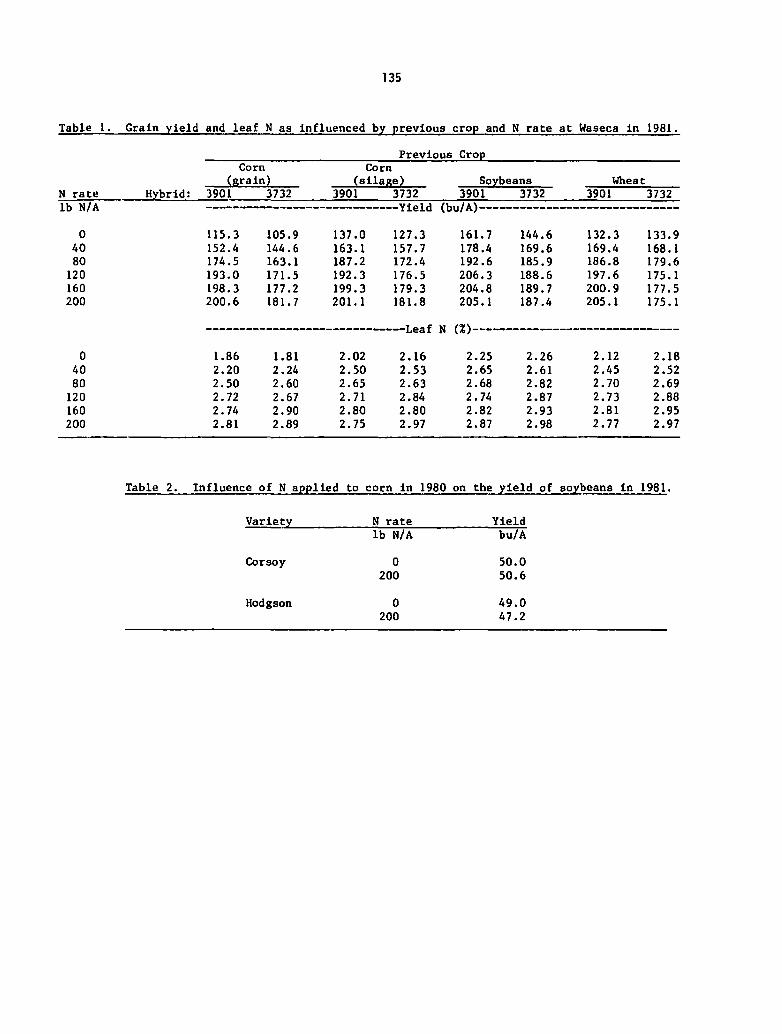
135
Table 1. Grain yield and leaf N as influenced by previous crop and N rate at Waseca in 1981.
Previous Crop
Corn Corn
(grain) (silagiN rate Hybrid:lb N/A
0
40
80
120
160
200
0
40
80
120
160
200
Corn Co rn
(grain) (silage) Soybeans Wheat
3901 3732 3901 3732 3901 3732 3901 3732
Yield
115.3 105.9 137.0 127.3 161.7 144.6 132.3 133.9
152.4 144.6 163.1 157.7 178.4 169.6 169.4 168.1
174.5 163.1 187.2 172.4 192.6 185.9 186.8 179.6
193.0 171.5 192.3 176.5 206.3 188.6 197.6 175.1
198.3 177.2 199.3 179.3 204.8 189.7 200.9 177.5
200.6 181.7 201.1 181.8 205.1 187.4 205.1 175.1
1.86 1.81 2.02 2.16 2.25 2.26 2.12 2.18
2.20 2.24 2.50 2.53 2.65 2.61 2.45 2.52
2.50 2.60 2.65 2.63 2.68 2.82 2.70 2.69
2.72 2.67 2.71 2.84 2.74 2.87 2.73 2.88
2.74 2.90 2.80 2.80 2.82 2.93 2.81 2.95
2.81 2.89 2.75 2.97 2.87 2.98 2.77 2.97
Table 2. Influence of N applied to corn in 1980 on the yield of soybeans in 1981.
Variety N rate Yield
Corsoy
Hodgson
lb N/A
0
200
0
200
bu/A
50.0
50.6
49.0
47.2

136
NITROGEN EFFICIENCY AS AFFECTED
BY RIDGE - PLANTING
Waseca, 1981
G. W. Randall and D. K. Langer
As conservation tillage systems become more popular there are numerous questions regarding properfertilization practices. Ridge planting, a system where no preparatory tillage is done but theseeds are planted on a performed ridge, has attracted much attention in the last few years. Thepurpose of this study was to determine the influence of N source, N rate and method-time of Napplication on the N needs of continuous corn grown in a ridge-plant system so as to improve Nefficiency with conservation tillage.
EXPERIMENTAL PROCEDURES
Nineteen treatments, Involving a factorial with 3 method-times of application, 3 sources of N and2 rates of N plus a check treatment, were replicated five times and applied to a Webster clay loam.All treatments were completely randomized. Each individual plot measured 10' wide (4 rows) by 60'in length.
The previous crop was corn which had been ridged in June of 1980. A N rate of 180 lb N/A had beenused in 1980. In the fall of 1980, P and K were broadcast at a rate of 30 + 120 lb P205+K20/A.Soil tests averaged: pH ° 7.6, Bray Pi = 39 lb/A (High) and exchangeable K = 255 lb/A (High).
Corn (Pioneer 3732) was planted with a Buffalo till-planter at 26500 plants/A with 1 lb Amaze/A onMay 14. No starter fertilizer was used. Weeds were chemically controlled with Lasso (34 lb/A) +Bladex (3 lb/A) applied preemergence on May 15. All plots were cultivated and ridged on July 2.
One-third of the N treatments was applied preplant on May 14. The urea was broadcast on thesurface by hand while the urea-ammonium nitrate (UAN) solution (28% N) was broadcast with a bicyclesprayer. The planting operation which removes the top of the ridge and deposits the soil in theinter-row valleys was done within 6 hours of N application and should have incorporated most of theN. Anhydrous ammonia (AA) was knifed-ln between the ridges with an anhydrous tool bar equippedwith coulters ahead of the knives.
Another one-third of the treatments was applied just as the corn was emerging (May 27). Applicationtechniques were the same as at preplanting. The last one-third of the treatments was sidedress-applied at the 8-leaf stage (June 26). The urea and UAN materials were banded along each row andcovered slightly with soil.
The percent of the soil surface covered by corn residue from the 1980 crop was measured at emergenceby the line-intercept method.
Leaf samples were taken at silking from 10 random plants per plot. Final population was determinedfrom 70' of row prior to harvest. Grain yield, grain moisture and grain N (protein) were determinedon corn harvested from the center two rows of each plot with a modified JD 3300 plot combine onNovember 4.
RESULTS
Two separate analyses of variance statistical tests were conducted on the data. The first includedall treatments and indicates that highly significant differences (P=.01 level) in leaf N, grainyield, grain moisture and grain N were found (Table 1). All N treatments showed significantlyhigher leaf N and grain yield and lower grain moisture when compared to the check. Grain proteinwith all of the 150-lb N treatments was higher than the check.
The second analyses, with the check treatment omitted, was made to estimate the method-time, sourceand rate of N effects and their interactions. When averaged over N source and N rate the sidedress(SD) time of application resulted in the highest leaf N concentrations, the emergence (EM) time ofapplication resulted in lowest yields while N application preplant (PP) showed lowest grain moisture(Table 2). Final population and protein were unaffected by the method-time of application.
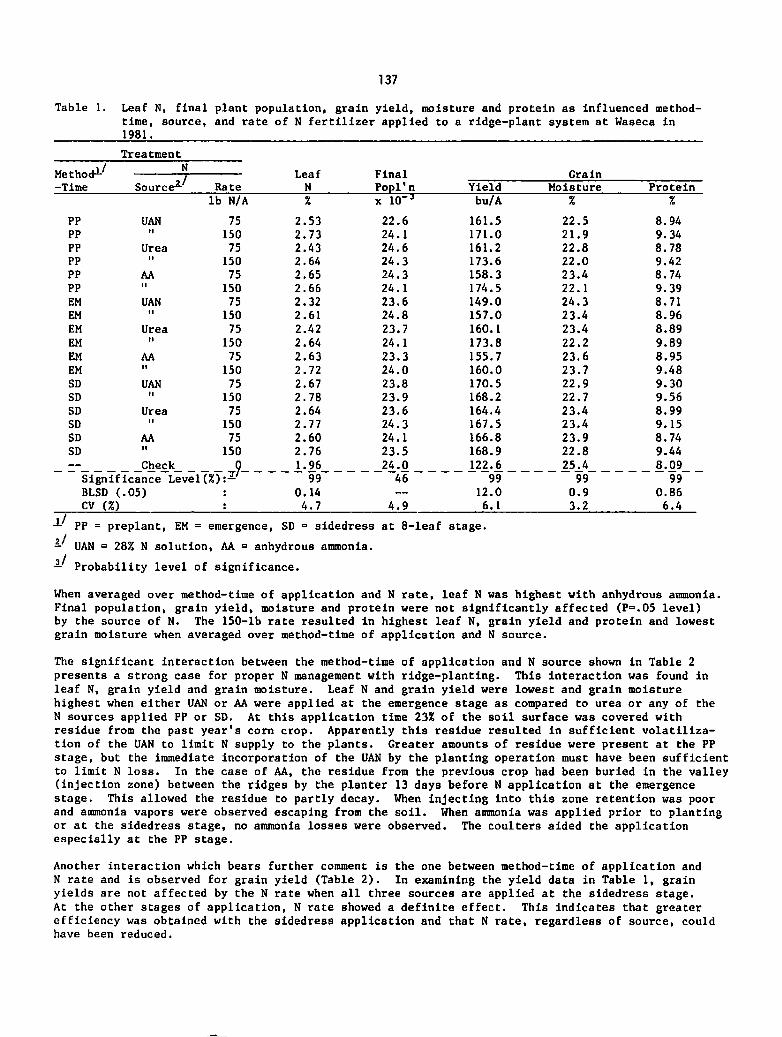
137
Table 1. Leaf N, final plant population, grain yield, moisture and protein as influenced method-time, source, and rate of N fertilizer applied to a ridge-plant system at Waseca In1981.
•Freatment
Leaf
N
Final
Popl'nGrainMethod^ N
Source4- Rate-Time Yield Moisture Protein
lb N/A % x 10" * bu/A % %
PP UAN 75 2.53 22.6 161.5 22.5 8.94
PPII
150 2.73 24.1 171.0 21.9 9.34
PP Urea 75 2.43 24.6 161.2 22.8 8.78
PPii
150 2.64 24.3 173.6 22.0 9.42
PP AA 75 2.65 24.3 158.3 23.4 8.74
PP " 150 2.66 24.1 174.5 22.1 9.39
EM UAN 75 2.32 23.6 149.0 24.3 8.71
EMII
150 2.61 24.8 157.0 23.4 8.96
EM Urea 75 2.42 23.7 160.1 23.4 8.89
EMii
150 2.64 24.1 173.8 22.2 9.89
EM AA 75 2.63 23.3 155.7 23.6 8.95
EMit
150 2.72 24.0 160.0 23.7 9.48
SD UAN 75 2.67 23.8 170.5 22.9 9.30
SDn
150 2.78 23.9 168.2 22.7 9.56
SD Urea 75 2.64 23.6 164.4 23.4 8.99
SDii
150 2.77 24.3 167.5 23.4 9.15
SD AA 75 2.60 24.1 166.8 23.9 8.74
SDii
150 2.76 23.5 168.9 22.8 9.44
— Check 9 1.96 24.0 122.6 25.4 8.09
Significance Level(%):-' 99 46 99 99 99
BLSD (.05) : 0.14 — 12.0 0.9 0.86
CV (%) : 4.7 4.9 6.1 3.2 6.4
— PP = preplant, EM = emergence, SD = sidedress at 8-leaf stage.,/— UAN - 28% N solution, AA = anhydrous ammonia.,/— Probability level of significance.
When averaged over method-time of application and N rate, leaf N was highest with anhydrous ammonia.Final population, grain yield, moisture and protein were not significantly affected (P=.05 level)by the source of N. The 150-lb rate resulted in highest leaf N, grain yield and protein and lowestgrain moisture when averaged over method-time of application and N source.
The significant interaction between the method-time of application and N source shown in Table 2presents a strong case for proper N management with ridge-planting. This interaction was found inleaf N, grain yield and grain moisture. Leaf N and grain yield were lowest and grain moisturehighest when either UAN or AA were applied at the emergence stage as compared to urea or any of theN sources applied PP or SD. At this application time 23% of the soil surface was covered withresidue from the past year's corn crop. Apparently this residue resulted in sufficient volatilization of the UAN to limit N supply to the plants. Greater amounts of residue were present at the PPstage, but the immediate incorporation of the UAN by the planting operation must have been sufficientto limit N loss. In the case of AA, the residue from the previous crop had been buried in the valley(injection zone) between the ridges by the planter 13 days before N application at the emergencestage. This allowed the residue to partly decay. When injecting into this zone retention was poorand ammonia vapors were observed escaping from the soil. When ammonia was applied prior to plantingor at the sidedress stage, no ammonia losses were observed. The coulters aided the applicationespecially at the PP stage.
Another interaction which bears further comment is the one between method-time of application andN rate and is observed for grain yield (Table 2). In examining the yield data in Table 1, grainyields are not affected by the N rate when all three sources are applied at the sidedress stage.At the other stages of application, N rate showed a definite effect. This indicates that greaterefficiency was obtained with the sidedress application and that N rate, regardless of source, couldhave been reduced.

Table 2.
138
Factorial analyses of leaf N, plant population, grain yield, moisture and protein as influenced by method-time, source and rate of N fertilizer applied to a ridge-plant systemat Waseca in 1981,
Leaf
N
Final
popl'nGrain
Yield Moisture ProteinMAIN TREATMENTS % x 10"J bu/A % %
Method-Time
PP 2.60 24.0 166.7 22.5 9.10
EM 2.56 23.9 159.3 23.4 9.15
SD 2.70 23.9 167.7 23.2 9.20
Signif.Level(%): 99 8 99 99 18
BLSD (.05) : .06 - 4.8 0.3 --
N Source
UAN 2.61 23.8 162.9 22.9 9.14
Urea 2.59 24.1 166.8 22.9 9.18
AA 2.67 23.9 164.0 23.3 9.12
Signif.Level(%): 97 37 72 92 10
BLSD (.05) : 0.06 — « ~ ~
N Rate (lb/A)75 2.54 23.7 160.8 23.4 8.89
150 2.70 24.1 168.3 22.7 9.40
Signif.Level(%): 99 90 99 99 99
INTERACTIONS
Meth-Time x Source
PP UAN 2.63 23.4 166.2 22.2 9.14
PP Urea 2.54 24.4 167.4 22.4 9.10
PP AA 2.65 24.2 166.4 22.8 9.06
EM UAN 2.46 24.2 153.0 23.8 8.84
EM Urea 2.53 23.9 167.0 22.8 9.39
EM AA 2.67 23.6 157.8 23.7 9.21
SD UAN 2.73 23.8 169.4 22.8 9.43
SD Urea 2.70 23.9 166.0 23.4 9.07
SD AA 2.68 23.8 167.8 23.3 9.09
Signif.Level(%): 99 69 92 99 84
Significance Levels(%)
Meth-Time x Rate 50 48 94 58 26
Source x Rate 86 74 36 17 50
M-T x S x R 62 45 15 90 30
Grain N removal shown in Table 3 indicates a significant increase over the control with all N treatments. Nitrogen efficiency, as calculated from grain N removal divided by N application rate,shows the lowest values for the UAN and AA applied at emergence and highest values with the sidedress, 75-lb N rates.
The weather conditions in the 10 days after application at the emergence stage are shown in Table 4.A slight rain (0.06") occurred within 12 hours after the N application with another 0.10" thefollowing day. Only 0.36" of rain was recorded during the 10-day period following N applications.Air temperatures were quite mild during this 10-day period. Maximum air temperature averaged 78 Fand ranged from 68 F to 84 F. In the next 10-day period, measurable amounts of rain occurred in5 days and totaled 2.00". Surface soils were saturated during half of this time in which maximumair temperatures averaged 67 F.

139
Table 3. Grain N removal and N efficiency as influenced by method-time, source and rate of ferti-lizer N applied to a ridge-planted system at Waseca in 1981.
Table 4.
Treatments
Grain N1'removal
Method- N
Time Source Rate N efficiency*
lb N/A lb N/A %
PP UAN 75 110.4 47
PPii
150 120.9 30
PP Urea 75 107.2 42
PPii
150 123.8 32
PP AA 75 105.0 39
PP " 150 124.8 33
EM UAN 75 98.7 31
EM11
150 106.6 21
EM Urea 75 108.0 43
EMii
150 130.2 36
EM AA 75 105.8 40
EMII
150 114.9 26
SD UAN 75 120.2 60
SDII
150 121.6 31
SD Urea 75 111.8 48
SDn
150 115.9 27
SD AA 75 110.6 47
SDii
150 120.9 30
Check 0 75.4 —
x' Yield times grain N
2- (Grain N removed from trt.
Signif.Level(%)BLSD(.05)
CVW
99
14.6
10.4
- Grain N removed from check) f N rate
Air temperature and precipitation in the 10-day period following the emergence stage application of N in 1981.
Air Temperature
Day Max Min PrecipitationUF_ inches
1 (N applied) 71 55 0.06
2 79 58 0.10
3 80 47
4 68 47
5 82 59
6 82 61 0.03
7 75 50 0.15
8 73 53
9 84 58 0.02
10 82 54
SUMMARY
The application of UAN and anhydrous ammonia at the emergence stage resulted in reduced yields ascompared to urea or any of the three N sources applied preplant (immediately before planting) orsidedress (8-leaf stage). Volatilization of the surface-applied UAN and poor retention of theammonia in the band of incorporated residues were thought to be the primary reasons for the poorerN efficiency. Highest N efficiency was obtained with the sidedress applications of 75-lb N/A.
ACKNOWLEDGMENT
Sincere appreciation Is given to Pioneer Hi-Bred International, Inc.in this project.
for their financial assistance

140
CONSERVATION TILLAGE STUDY
Waseca, 1981
G. W. Randall and J. B. Swan
With increasing emphasis on controlling erosion and minimizing energy requirements (time, labor andfuel), tillage practices of the future will undoubtedly change markedly within the next decade. Asa result these practices may be commonly referred to as "conservation tillage" systems.
Experimental Procedures
To evaluate some of these conservation tillage practices on continuous corn an experiment wasestablished in 1975 on a Webster clay loam at the Southern Experiment Station. Five tillage treatments (Table 1) were replicated four times. Each plot was 20' wide by 125' long. Beginning in 1979all plots were split into two, 4-row plots — one with 140 lb 9-23-30/A as starter fertilizer andthe other without starter fertilizer. Tile lines spaced 75' apart lie perpendicular to the rowswithin all plots.
Ridges are built along the corn rows for the till-plant (Ridge) treatment by cultivation in Juneeach year. After harvest the stalks are chopped and the moldboard and chisel plow operations areperformed in early November. On May 11 the moldboard and chisel plow plots were field cultivatedonce with the chisel plots receiving a prior disking.
Corn (Pioneer 3732) was planted in 30-inch rows at a rate of 26,100 ppA on May 5. The no-tillage,fall plow and fall chisel treatments were planted with a John Deere Max-Emerge planter equippedwith 2" fluted coulters. A Buffalo till planter was used for the till-plant treatments.
Broadcast P and K were applied at a rate of 0+40+100 (lb N+P20s+K20/A) in November, 1980. Nitrogen(180 lb N/A as ammonium nitrate) was broadcast on May 11. Amaze (1 lb/A) was applied to all plotsat planting. Chemical weed control consisted of 34 lb Lasso and 3 lb atrazine/A applied preemergence.Treatments 2, 3, 4, and 5 were cultivated on June 22. Weed control was excellent in all cultivatedtreatments.
Planting depth was determined by cutting off the coleoptile at the soil surface from all the plantsin a 3-meter length of row in each plot 30 days after planting. The seeds were then excavated andthe length of the coleoptile to the seed was measured. Early plant growth was determined byharvesting the above ground portion of 10 random plants per plot 36 days after planting. Yieldswere taken by combine harvesting two rows from each plot.
Statistical interpretation of the data throughout this report is based on the percent probability(significance levels) of obtaining a response. A significance level of 95 indicates that we couldexpect a real difference to occur 19 times out of 20 and only 1 time out of 20 due to chance. Asignificance level below 50 would indicate less than 50:50 odds of being real.
Results
Significant differences in final population, grain moisture, N removal in the grain and grain yieldwere found among the tillage treatments (Table 1). Grain protein was not affected (90% level).
Grain yield of the moldboard plow treatment (MP) was significantly higher than any of the othertreatments (Table 1). The till-plant (ridge) (TP-R) treatment showed the second highest yield(5.7 bu/A less than MP) and was not significantly better than the chisel plow (CP) yield. Tillplanting without a ridge (TP-F) did not yield as well as either the TP-R or CP treatments but was29 bu/A better than no tillage.
Starter fertilizer did improve grain yield when averaged over all treatments (Table 1). All tillagetreatments except TP-F responded to starter fertilizer in 1981; thus, the tillage x starterfertilizer interaction was not significant. No explanation can be given for the lack of responsewith TP-F.
Final population for the MP, CP and TP-R systems were equal and were significantly higher than thepopulation of the NT system (Table 1).
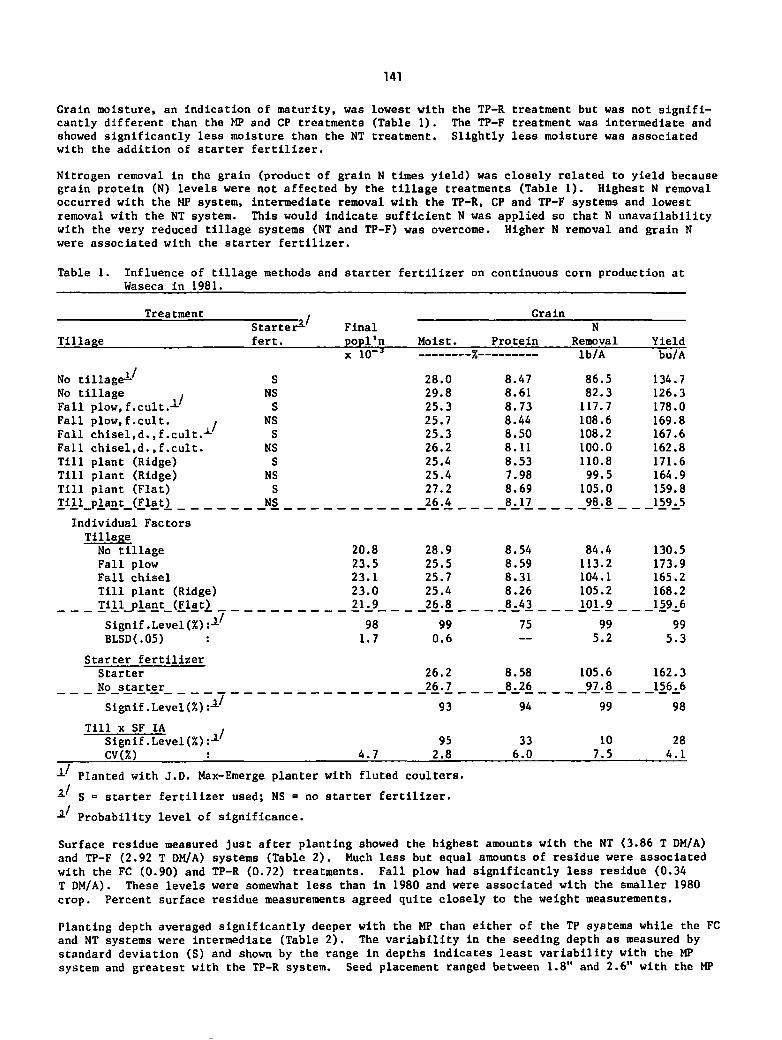
141
Grain moisture, an Indication of maturity, was lowest with the TP-R treatment but was not significantly different than the MP and CP treatments (Table 1). The TP-F treatment was intermediate andshowed significantly less moisture than the NT treatment. Slightly less moisture was associatedwith the addition of starter fertilizer.
Nitrogen removal In the grain (product of grain N times yield) was closely related to yield becausegrain protein (N) levels were not affected by the tillage treatments (Table 1). Highest N removaloccurred with the MP system, intermediate removal with the TP-R, CP and TP-F systems and lowestremoval with the NT system. This would indicate sufficient N was applied so that N unavailabilitywith the very reduced tillage systems (NT and TP-F) was overcome. Higher N removal and grain Nwere associated with the starter fertilizer.
Table 1. Influence of tillage methods and starter fertilizer on continuous corn production atWaseca in 1981.
Treatment jFinal
Grain
Starter^- N
Tillage fert. popl'n Moist. Protein Removal Yield
x 10_J %_ lb/A bu/A
No tillage^ S 28.0 8.47 86.5 134.7
No tillage ,Fall plow, f.cult.-1-
NS 29.8 8.61 82.3 126.3
S 25.3 8.73 117.7 178.0
Fall plow,f.cult. ,Fall chisel,d.,f.cult.x
NS 25.7 8.44 108.6 169.8
S 25.3 8.50 108.2 167.6
Fall chisel,d.,f.cult. NS 26.2 8.11 100.0 162.8
Till plant (Ridge) S 25.4 8.53 110.8 171.6
Till plant (Ridge) NS 25.4 7.98 99.5 164.9
Till plant (Flat) S 27.2 8.69 105.0 159.8
Till plant (Flat) NS 26.4 8.17 98.8 159.5
Individual Factors
TillageNo tillage 20.8 28.9 8.54 84.4 130.5
Fall plow 23.5 25.5 8.59 113.2 173.9
Fall chisel 23.1 25.7 8.31 104.1 165.2
Till plant (Ridge) 23.0 25.4 8.26 105.2 168.2
Till_plant (Flatj. 21.9 26.8 8.43 101.9 159.6
Signif.Level (%):J-/ 98 99 75 99 99
BLSD(.05) : 1.7 0.6 — 5.2 5.3
Starter fertilizer
Starter 26.2 8.58 105.6 162.3
No starter 26.7 8.26 97.8 156.6
Signif .Level(%):J- 93 94 99 98
Tlll x SF IA ,
Signif.Level(%):a 95 33 10 28
CV(%) : 4.7 2.8 6.0 7.5 4.1
-*- Planted with J.D. Max-Emerge planter with fluted coulters.
•*• S •= starter fertilizer used; NS = no starter fertilizer.
-1 Probability level of significance.
Surface residue measured just after planting showed the highest amounts with the NT (3.86 T DM/A)and TP-F (2.92 T DM/A) systems (Table 2). Much less but equal amounts of residue were associatedwith the FC (0.90) and TP-R (0.72) treatments. Fall plow had significantly less residue (0.34T DM/A). These levels were somewhat less than in 1980 and were associated with the smaller 1980crop. Percent surface residue measurements agreed quite closely to the weight measurements.
Planting depth averaged significantly deeper with the MP than either of the TP systems while the FCand NT systems were intermediate (Table 2). The variability in the seeding depth as measured bystandard deviation (S) and shown by the range in depths indicates least variability with the MPsystem and greatest with the TP-R system. Seed placement ranged between 1.8" and 2.6" with the MP

142
system and between 0.8 and 2.6" with the TP-R system. This emphasizes the need for careful adjustment of the till planter; otherwise stand losses can be encountered with shallow seed placement.
Table 2. Influence of tillage methods for continuous corn on surface residue and seedling depth atWaseca in 1981.
Surface Residue
Planting Depth
Treatment Average S Range
No tillageFall plowFall chisel
Till plant (Ridge)Till_plant (Flat)
T DM/A
3.86
.34
.90
.72
2.92
%
89
6
25
14
54
47.1
53.4
46.4
41.3
41.0
5.8
4.8
6.1
7.6
6.2
31-57
46-67
27-58
21-65
26-67
Signif.Level(%):BLSD(.05) :CV(%) :
99
.35
14.
99
8
14.
99
7.1
9.6
Soil temperature at the 3" depth was measured prior to planting by thermocouples placed randomly inthe MP system and placed directly in the center of the ridge and in the center of the valleys in theTP-R system. Temperatures over the 9-day period prior to planting were essentially identical forthe MP (57.3°F) and TP-R ridges (56.9°F) (Table 3). The valleys, however, averaged 4°F cooler thanthe ridge, which shows the advantage for planting on ridges in the TP system.
Table 3. Soil temperature average (3") prior to planting as influenced by tillage practice atWaseca in 1981.
Treatment-Position
Fall plowT-P (Ridge) TopT-P (Ridge) Valley
4/27 4/28 4/29
Day4/30 5/1 5/2 5/5 Avg.
65.4
64.5
57.2
52.6
51.4
51.8
57.5
58.0
53.8
°Fx/
53.2 59.9
52.0 59.9
50.1 52.8
57.9
57.4
52.6
54.7
55.2
53.2
57.3
56.9
53.1
J Average of daily maximum and minimum.
The rate of seedling emergence was determined by counting the number of plants that had spiked thruin 100-feet of row/plot each day from the 10th to the 25th day following planting. Emergence, as apercent of final stand, shown in Table 4 indicates the most rapid germination and growth with theMP treatment and followed closely (1 day) by the TP-R and CP treatments. Slowest emergence occurredwith the NT system. The TP-F system was somewhat faster than the NT system but lagged behind theothers.
Table 4. Influence of tillage methods on the emergence progress of continuous corn at Waseca in1981.
Days Post Planting
Treatment 10 11 12 13 14 15 16 17 18 20 21 25
No tillage 0 0 0 0 0 4 31 56 73 91 96 100
Fall plow 20 64 81 87 90 91 94 94 94 99 99 100
Fall chisel 2 26 58 71 76 82 86 88 89 97 99 100
T-P (Ridge) 3 21 66 79 94 95 98 99 99 99 99 100
T-P (Flat) 0 2 12 20 36 57 78 86 88 94 98 100

143
Early plant growth (EPG) measurements shown in Table 5 Indicate substantial differences among thetillage treatments. Plant growth by mid-June showed significantly larger plants with the MP system,intermediate growth (75% of the MP) with the CP and TP-R systems, smaller plants (47% of MP) withthe TP-F system and smallest plants (32% of the MP) with the NT system. Starter fertilizersignificantly Improved early growth when averaged over all tillage systems. The correlation betweenEPG and grain yield was highly significant with starter fertilizer (+.824) and no starter treatments(+.873). A curve linear relationship resulted in both cases.
Because of apparent stress symptoms and stunting with the reduced tillage systems, plant height of10 plants/plot was taken on July 10 and August 3 (Table 5). Plants grown on MP tillage weresignificantly taller than all others on July 10. Intermediate height was shown with the CP and TP-Rsystems. Plants were somewhat taller with the TP-F system as compared to NT. By August 3 differencesin plant height were much less evident. Heights of all tillage systems except NT were equal andwere significantly greater than the NT. A height response to starter fertilizer averaged overtillage treatments was not shown for either date but the significant tillage x starter fertilizerinteraction on July 10 Indicates the height response to starter for the NT system.
Table 5. Influence of tillage methods and starter fertilizer for continuous corn on small wholeplant growth and plant height at Waseca in 1981.
Treatment Earlyplantgrowth
PlantStarter
fert.
Height
Tillage 10 July 3 August
g/plant
No tillage S 2.52 57 114
No tillage NS 1.75 53 113
Fall plow S 6.85 76 118
Fall plow NS 6.52 76 119
Fall chisel S 5.00 69 118
Fall chisel NS 4.95 70 116
Till plant (Ridge) S 5.15 69 119
Till plant (Ridge) NS 4.75 69 118
Till plant (Flat) S 3.20 62 117
Till_plant (Flat) NS 3.12 63 117
Individual Factors
TillageNo tillage 2.14 55 114
Fall plow 6.69 76 119
Fall chisel 4.98 69 117
Till plant (Ridge) 4.95 69 118
Till plant (Flat) 3.16 62 117
Signif.Level(%): 99 99 99
BLSD(.05) : 0.98 3 3
Starter fertilizer
S 4.54 66 118
NS 4.22 66 117
Signif.Level(%): 99 79 87
Till x SF IA
Signif.Level(%): 78 99 74
CV(%) : 7.4 1.9 1.2

144
The small whole plants taken for early plant growth (EPG) measurements were chemically analyzed(Table 6). Nutrient analyses indicated significant effects (P=.10) of the tillage treatments onsmall plant P, K, Mg and Fe. Highest P levels were obtained with the NT system, probably becauseof less dilution. Highest K concentrations were found with the MP system. The TP systems hadsignificantly less plant K. Plant Fe was higher for all systems which received some tillage,indicating that soil had probably splashed onto the plants and contamination resulted. The additionof starter fertilizer increased plant P, K, Ca, Fe and Mn but reduced B. A tillage x starterfertilizer interaction was evident with B and indicated that starter fertilizer decreased B with
the NT and TP systems but not with the MP and CP systems. All plant concentrations appeared to besufficient for optimum yields.
Table 6. Influence of tillage methods and starter fertilizer for continuous corn on small wholeplant nutrient concentrations at Waseca in 1981.
Treatment
NutrientStarter
Tillage fert. P K Ca Mg Fe Mn Zn Cu B
No tillage S .48 4.77 .41 .26 271 51 34 9.4 7.5
No tillage NS .44 4.74 .37 .26 208 44 34 9.6 8.2
Fall plow S .47 5.01 .44 .24 366 52 40 9.2 8.4
Fall plow NS .42 4.77 .41 .27 293 49 37 9.5 8.3
Fall chisel S .45 4.69 .42 .27 322 58 36 10.3 8.2
Fall chisel NS .41 4.70 .41 .26 318 54 36 9.5 8.0
Till plant (Ridge) S .44 4.49 .45 .32 382 51 39 11.4 7.2
Till plant (Ridge) NS .43 4.28 .44 .34 362 45 41 10.8 8.1
Till plant (Flat) S .43 4.57 .46 .33 293 46 36 11.6 7.0
Till_plant (Flat) NS .40 4.30 .43 .33 308 43 36 10.4 9.1
Individual Factors
TillageNo tillage .46 4.76 .39 .26 240 48 35 9.5 7.8
Fall plow .44 4.89 .42 .26 329 50 38 9.4 8.4
Fall chisel .43 4.70 .42 .26 320 56 36 9.9 8.1
Till plant (Ridge) .43 4.38 .44 .33 372 48 40 11.2 7.6
Till £lant (Flat) .41 4.44 .44 .33 301 44 36 11.0 8.0
Signif.Level(%): 90 90 74 99 98 35 86 65 22
BLSD(.05) : .06 74
Starter fertilizer
S .45 4.70 .44 .28 327 52 37 10.4 7.7
NS .42 4.56 .41 .29 298 47 37 10.0 8.3
Signif.Level(%): 99 95 98 64 91 96 13 85 99
Till x SF IA
Signif.Level(%): 90 40 11 12 62 6 16 61 96
CV(%) : 3.6 4.7 7.0 11. 16. 13. 10. 9.0 9.1

145
Nutrient uptake by the small plants was calculated by multiplying the nutrient concentrations(Table 6) by the EPG found in Table 5. The differences in uptake values among the tillage treatments are closely associated with the respective EPG values (Table 7). Uptake of all elements wassignificantly affected by the tillage treatments. Generally, uptake was greatest with MP system,intermediate with the CP and TP-R systems and least with the TP-F and NT systems. Starterfertilizer resulted in significantly higher uptake of P, K, Ca, Fe, Mn, Zn and Cu.
Table 7. Influence of tillage methods and starter fertilizer for continuous corn on small wholeplant nutrient uptake at Waseca in 1981.
Treatment
Starter Nutrient
Tillage fert. P K Ca Mg Fe Mn Zn Cu B# . / 10 plants-
No tillage S 12 121 10 6 6.9 1.29 .86 .23 .19
No tillage NS 8 83 6 5 3.6 .77 .60 .17 .14
Fall plow S 32 344 30 17 25.1 3.51 2.71 .63 .58
Fall plow NS 27 312 27 17 19.0 3.13 2.44 .62 .54
Fall chisel S 23 234 21 13 16.4 2.90 1.84 .50 .42
Fall chisel NS 21 233 20 13 16.0 2.64 1.81 .46 .40
Till plant (Ridge) S 23 233 23 16 19.8 2.54 2.04 .58 .37
Till plant (Ridge) NS 21 202 21 17 16.8 2.09 1.95 .51 .38
Till plant (Flat) S 14 145 15 11 9.1 1.45 1.16 .36 .23
Till_plant (Flat) NS 12 134 13 10 9.5 1.32 1.14 .32 .28
Individual Factors
Tillage
No tillage 10 102 8 6 5.2 1.03 .73 .20 .17
Fall plow 30 328 28 17 22.1 3.32 2.58 .62 .56
Fall chisel 22 234 20 13 16.2 2.77 1.83 .48 .41
Till plant (Ridge) 22 218 22 16 18.4 2.31 1.99 .54 .38
Tilljplant (Flat^ 13 140 14 11 9.3 1.39 1.15 .34 .26
Signif.Level(%): 99 99 99 99 99 99 99 99 99
BLSD(.05) : 5 52 4 4 5.2 .53 .49 .06 .12
Starter fertilizer
S 21 215 20 13 15.5 2.34 1.72 .46 .36
NS 18 193 17 12 13.0 1.99 1.59 .42 .35
Signif.Level(%): 99 99 99 48 99 99 92 99 30
Till x SF IA
Signif.Level(%): 75 61 31 23 83 17 31 20 92
CV(%) : 9.3 10. 11. 15. 19. 17. 14. 11. 10.
Leaf samples were taken from the leaf opposite and below the ear at silking. With the exception ofN and Zn, nutrient concentrations were not affected significantly (P=.10) by the tillage systems(Table 8). Significantly lower N and Zn concentrations were found with the MP system. Although adefinite trend toward lower leaf K in the reduced tillage systems was evident, concentrations werenot statistically different (P=.10). Starter fertilizer did not affect leaf nutrient concentrationswith the exception of lower Ca and Mg with the row-applied fertilizer.

146
Table 8. Influence of tillage methods and starter fertilizer for continuous corn on the nutrient
concentration in the earleaf at Waseca in 1981.
Treatment
NutrientStarter
Tillage fert. N P K Ca Mg Fe Mn Zn Cu B
--% —ppm-
No tillage S 2.9 .32 1.90 .41 .27 100 33 20 4.4 4.1
No tillage NS 3.0 .32 1.89 .45 .34 121 38 21 5.3 4.0
Fall plow S 2.7 .32 2.29 .46 .25 94 44 18 4.9 3.5
Fall plow NS 2.8 .30 2.08 .49 .31 91 44 18 4.3 3.8
Fall chisel S 2.8 .30 1.97 .48 .32 91 47 21 4.6 3.6
Fall chisel NS 2.9 .30 1.87 .52 .33 130 48 21 3.6 3.6
Till plant (Ridge) S 2.8 .31 1.96 .49 .35 101 38 20 4.8 3.4
Till plant (Ridge) NS 2.8 .32 2.01 .48 .36 100 36 21 4.8 3.8
Till plant (Flat) S 2.9 .29 1.69 .48 .35 112 44 24 4.4 3.7
Till plant (Flat) NS 2.9 .30 1.91 .48 .36 94 44 21 4.8 3.2
Individual Factors
TillageNo tillage 2.9 .32 1.89 .43 .30 111 36 21 4.9 4.0
Fall plow 2.7 .31 2.18 .48 .28 93 44 18 4.6 3.6
Fall chisel 2.8 .30 1.92 .50 .32 110 47 21 4.1 3.6
Till plant (Ridge) 2.8 .32 1.99 .48 .35 100 37 20 4.8 3.6
Till p_lant XFlat) 2.9 .30 1.80 .48 .35 103 44 22 4.6 3.4
Signif.Level(%): 91 41 84 88 77 32 43 95 60 82
BLSD(.05) : 3
Starter fertilizer
S 2.8 .31 1.96 .46 .31 100 41 21 4.6 3.6
NS 2.9 .31 1.95 .48 .34 107 42 20 4.6 3.7
Signif.Level(%): 88 11 18 93 97 66 57 18 24 14
Till x SF IA
Signif.Level(%): 71 57 94 57 47 79 44 80 70 50
CV(%) : 3.7 4.1 6.8 6.7 13. 23. 11. 9.2 21. 14,
SUMMARY
A field experiment was established in 1975 to evaluate five tillage systems (no tillage, moldboardplow, chisel plow, till-plant (ridge) and till-plant (flat) on continuous corn on a Webster clayloam. Beginning in 1979 all plots were split to evaluate the effect of starter fertilizer withthese tillage treatments. Grain yields with the moldboard plow were significantly higher than withany of the other systems. The chisel plow and till-plant (ridge) systems yielded slightly less(8.7 and 5.7 bu/A, respectively). Lowest yields were obtained with no tillage. Starter fertilizerdid improve yields when averaged over all treatments.

147
SEVEN-YEAR YIELD SUMMARY
Grain yields have been obtained from the five tillage systems where starter fertilizer was used from1975-1981 (Table 9). The 7-year average yield shows a 4.8 bu/A yield advantage for the moldboardplow over the till-plant (ridge) system. Most of this difference could be attributed to the 17bushel advantage in 1980 for moldboard plowing. The chisel plow and till-plant (flat) systemsshowed intermediate yields while lowest yields were obtained with no tillage. Weed control hasbeen excellent in all treatments except no tillage. However, postemergence herbicides were appliedto no tillage in 1979 and 1980 and did provide better weed control.
Three-year data indicate some advantage for the use of starter fertilizer with the chisel plow(8 bu/A), till-plant (ridge) (6 bu/A) and no tillage systems (6 bu/A). No reason can be given forthe obvious difference in response to starter fertilizer between the no tillage and till-plant(flat) systems when both treatments represent the most severely reduced tillage systems.
Table 9. Influence of tillage methods and starter fertilizer on continuous corn yields at Waseca.
Treatment Grain
Starter 1979-81 1975-81
Tillage fert. Avg. Yield Avg. Yield
-bu/A
No tillage S 141.0 127.8
No tillage NS 134.7
Fall plow S 169.6 151.6
Fall plow NS 170.2
Fall chisel S 161.1 141.6
Fall chisel NS 152.8
Till plant (Ridge) S 159.9 146.8
Till plant (Ridge) NS 154.0
Till plant (Flat) S 153.1 142.8
Till plant (Flat) NS 154.6

148
USE OF DWELL (TERRAZOLE) AND N-SERVE ASNITRIFICATION INHIBITORS WITH FALL VS. SPRING NITROGEN
APPLICATION FOR CORN PRODUCTION IN SOUTHERN MN.
G.L. Malzer, T. Graff and G.W. Randall
The use of nitrification inhibitors on fine textured soils of southern Minnesota has
gained considerable attention over the last several years. There are severalchemicals known which are capable of delaying the rate of nitrification, but thereis only one currently on the market (N-Serve -Dow Chemical, U.S.A.). An experimentalchemical Dwell (Terrazole-Olin Corporation) has shown nitrification inhibitioncharacteristics and was evaluated under field conditions along with N-Serve at theSouthern Experiment Station at Waseca, MN in 1981. The objectives of the trail wereto evaluate the use of nitrification inhibitors with different nitrogen rates,nitrogen forms, in fall vs. spring nitrogen application programs.
Experimental Procedures
An experiment consisting of 35 treatments, with six replication was arranged in arandomized complete block design and established at the Southern Experiment Station.Twelve treatments were applied on September 16th, 1980 and consisted of a factorialarrangement of two nitrogen rates (75 and 150 it N/A), two nitrogen forms (urea andanhydrous ammonia) ,and three inhibitor treatments (none, N-Serve, and Dwell). Sixteen spring treatments were applied on May 1st 1981 and consisted of a factorialarrangement of two nitrogen rates (75 and 150 // N/A), three nitrogen forms (urea,anhydrous ammonia and 28% solution), and three nitrification inhibitor treatments(none, N-Serve, and Dwell). Four sidedress treatments were applied at the 8-leafstage of corn growth on June 17th. Anhydrous ammonia was used at the 75 it N/A withthree inhibitors (none, N-Serve, and Dwell), and 150 #N/A without an inhibitor. Acontrol treatment receiving no fertilizer N was also included.
Fall treatment: Urea was broadcast and the respective nitrification inhibitor treatments made as a separate spray application over the soil surface followed by immediateincorporation. The anhydrous ammonia treatments were injected at a depth of 6-8 inchesutilizing 30" knife spacing. N-Serve applications were made by addition of theproduct directly into the anhydrous tank so that both products were appliedsimultaneously. Dwell applications were made simultaneously with the use of a dual-tube anhydrous shank and a separate pressurized system for the application of theDwell.
Spring treatment: Urea and anhydrous ammonia were applied in a similar manner asthe fall treatments. N-Serve and Dwell was, however, injected into the anhydrousammonia at a position after the nitrolater and before the manifold utilizing a separatepumping system. Applications of 28% N solution were sprayed onto the plots with aseparate spray application for the nitrification inhibitor treatments and againfollowed by immediate incorporation. The 8-leaf sidedress applications were madewith anhydrous ammonia and the inhibitor applied in a similar manner to the earlyspring application. All nitrification inhibitors were applied at 0.5 if a.i./A.Corn (Pioneer 3732) was planted into the experimental area in 30" rows at a seedingrate of approximately 27,000 seeds/A. Leaf samples were collected from oppositeand below the ear at silking, dried, and Kjeldahl nitrogen determined. Dry matterproduction was determined by harvesting 15' of row from each plot at physiologicalmaturity separating the sample into ears and stover. Subsamples were collectedfor moisture determination and Kjeldahl nitrogen analysis. Corn grain yieldswere determined by machine harvesting the center two rows from each plot (55')and expressing the yield at 15.5% moisture.

149
General Results
The corn grain yields were excellent at Waseca in 1981. The growing season wascharacterized by being relatively dry early with more than adequate moistureduring mid to late summer. This can at least partially explain many of the results,and the apparent conclusion that nitrogen losses at Waseca in 1981 were not severe.Corn c;rain yields were significantly increased up through the highest rate ofnitrogen application (150 it N/A). Time of N application (Fall vs. spring) anduse of nitrification inhibitors had relatively little influence on grain yields.Anhydrous ammonia did on the average provide higher yields than urea application.Total nitrogen removal was influenced by all four variables tested. Nitrogenremoval was increased when the nitrogen rate was increased to 150// N/A and whenanhydrous ammonia was used vs urea. Applications of nitrogen in the spring resultedin higher amounts of N taken up, while N-Serve application also increased totalN removal. Most of the total N removal increase that was associated with N-Serve
was due to a higher amount of nitrogen in the stover. Overall, no large differenceswere observed between nitrogen management varialbes (except N rate) thus reflectingthe comment that nitrogen losses due to leaching and/or denitrification wereminimal during 1980-81 season.

150
Table 1. Influence of nitrogen form, nitrogen rates, nitrification inhibitors and timing ofnitrogen application on leaf N content, grain yield, dry matter production, grain Ncontent and nitrogen removal of corn - Waseca, 1981.
Tr"eatments
N^Inhlb.
Leaf Grain
Dry Matter Production N-Conc. N-•Removal
N
Rate Form Time N Yield Grain Stover Total Grain Stover Grain Stover Total§/t\ i bu/A —T/A-- % -lbs/A-
Check~
- 2.02 124.9 2.94 3.73 6.67 0.98 0.48 58.5 35.8 94.2
75 Urea - 2.43 151.9 3.80 4.36 8.16 1.00 0.40 76.6 35.3 111.975 Urea N-S 2.32 153.1 3.70 4.41 8.12 1.13 0.48 83.8 42.7 126.5
75 Urea Dwell 2.37 149.5 3.59 4.24 7.83 1.01 0.45 72.6 37.9 110.675 AA 2.52 162.6 4.11 4.38 8.49 1.09 0.45 89.3 39.7 129.1
75 AA N-S 2.23 162.4 3.99 4.43 8.43 1.10 0.56 88.3 49.8 138.2
75 AA Dwell 2.49 169.8 4.09 4.67 8.76 1.14 0.53 93.5 49.9 143.5150 Urea - 2.55 171.9 4.39 4.84 9.23 1.20 0.57 105.0 55.1 160.1
150 Urea N-S 2.52 162.3 4.30 4.90 9.20 1.23 0.66 105.6 64.7 170.4
150 Urea Dwell 2.46 173.5 4.40 4.94 9.34 1.17 0.62 103.0 61.5 164.6
150 AA - 2.44 171.4 4.27 4.80 9.06 1.19 0.56 101.0 53.1 154.1150 AA NS 2.62 180.0 4.32 4.82 9.14 1.22 0.68 105.4 65.7 171.2150 AA Dwell 2.72 179.4 4.58 4.84 9.42 1.24 0.63 113.9 61.3 175.2
75 Urea S - 2.27 154.9 3.99 4.57 8.51 1.14 0.53 90.3 48.6 139.075 Urea S N-S 2.27 159.6 3.87 4.56 8.43 1.15 0.51 88.7 46.6 135.375 Urea S Dwell 2.19 144.1 3.71 4.34 8.05 1.06 0.51 78.7 44.6 123.375 AA S - 2.52 158.7 3.94 4.55 8.49 1.11 0.49 87.7 45.1 132.7
75 AA S N-S 2.49 167.9 4.10 4.85 8.96 1.14 0.55 94.0 53.6 147.6
75 AA S Dwell 2.23 157.9 3.72 4.37 8.10 1.08 0.50 81.4 44.0 125.475 28% S - 2.54 165.0 4.21 4.88 9.09 1.16 0.55 97.8 53.7 151.5
75 28X S N-S 2.45 168.7 4.18 4.76 8.94 1.11 0.57 93.3 54.1 147.5
75 282 S Dwell 2.49 162.7 3.99 4.75 8.75 1.18 0.47 94.5 45.2 139.6150 Urea S - 2.54 174.9 4.39 5.12 9.01 1.25 0.61 109.6 62.4 172.0
150 Urea S N-S 2.51 180.3 4.34 5.05 9.39 1.24 0.66 107.1 66.4 173.5
150 Urea S Dwell 2.57 169.5 4.17 4.90 9.07 1.23 0.62 102.1 61.4 163.5
150 AA S - 2.63 176.4 4.33 4.72 9.05 1.20 0.62 104.1 58.5 162.7
150 AA S N-S 2.61 180.0 4.54 4.70 9.24 1.26 0.66 114.2 62.0 176.3
150 AA S Dwell 2.83 172.9 4.55 5.01 9.56 1.21 0.66 110.3 65.5 175.7
150 28* S - 2.62 182.2 4.36 4.95 9.31 1.24 0.64 107.6 63.7 171.4150 28% S N-S 2.36 176.4 4.32 4.92 9.24 1.26 0.63 109.0 61.6 170.5
150 28% S Dwell 2.61 169.8 4.28 4.87 9.15 1.17 0.64H 100.1 60.6 160.775 AA 8-L - 2.75 166.7 4.03 4.48 8.51 1.10 0.60 88.9 53.7 142.6
75 AA 8-L N-S 2.76 167.9 3.98 4.41 8.39 1.13 0.59 90.1 51.9 142.0
75 AA 8-L Dwell 2.72 166.0 4.11 4.50 8.61 1.15 0.59 94.5 53.1 147.6
150 AA 8-L - 2.72 176.6 4.40 4.62 9.01 1.23 0.63 108.2 57.9 166.1
Significance ** ** ** ** ** ** ** ** ** **
BLSD(.05) 0.20 11.5 0.35 0.41 0.69 0.08 0.10 10.5 11.1 18.4
Table 1 continued on next page 1/ F=: fa11 s =Spring 8_L =leaf

151
i^Vable 1 (continued)Leaf
N
GrainYield
Dry Matter Production N-Conc. N-Removal
Grain Stover Total Grain Stover Grain Stover Total
% bu/A T/A— -% -lbs/A •Factorial Arrangement (Nitrogen Rate X Nitrogen Form X Inhibitors X Time treatments)
3.88
4.38
4.78
4.898.369.27
1.101.12
0.50
0.63
N-Rate if/A
75150
SignificanceBLSD (.05)
N-Form
2.362.58
*+
0.08
157.7174.4
**
4.4 0.13 0.15 0.26 0.03 0.04
Urea 2.42 162.1A.A. 2.53 170.0Significance ** **BLSD (.05) 0.08 4.4
Inhibitor
None
N-Serve
DwellSignificanceBLSD(.05)
TimeFailSpring
/"^Significance'BLSD(.05)
2.492.45
2.48NS
2.472.47
NS
165.3
168.2164.6
NS
165.6
166.4NS
4.05 4.694.21 4.68
** NS
0.13
8.748.89
NS
4.14 4.67 8.814.14 4.72 8.864.10 4.66 8.77
NS NS NS
4.12
4.13NS
4.644.72
NS
8.76
8.86NS
1.151.17
NS
1.151.18
1.14**
0.03
1.14
1.17*
0.02
Factorial Arrangement (N-Rate X Time X Anhydrous Ammonia)
N-Rate #/A
75150
SignificanceBLSD(.05)
TimeFallSpring8-LeafSignificanceBLSD(.05)
2.60
2.59
NS
162.7 4.03 4.47 8.50 1.10174.8 4.33 4.71 9.04 1.21
*• ** + * **
11.6 0.23 0.22 0.41 0.06
2.482.57
2.73**
0.13
167.0 4.19 4.59 8.78 1.14167.6 4.13 4.63 8.77 1.16171.7 4.21 4.55 8.76 1.17
NS NS NS NS NS
Factorial Arrangement (Inhibitor X Time at 75 § N/A)
InhibitorNone 2.60 162.7N-Serve 2.58 166.1Dwell 2.48 164.6Significance NS NSBLSD (.05)
Time
FalT 2.41 165.0Spring 2.42 161.58-Leaf 2.74 166.9Significance ** NS
OBLSD(.05) 0.12
4.03 4.47 8.504.03 4.56 8.593.98 4.52 8.49
NS NS NS
4.06 4.503.92 4.594.04 4.47
NS NS
8.568.528.51
NS
1.10
1.131.12
NS
1.111.11
1.13NS
0.550.58
+
0.02
0.530.590.56
**
0.03
0.55
0.58+
0.02
0.510.60
**
0.08
0.50
0.550.61
0.07
0.51
0.570.54
NS
0.520.520.59
*
0.06
85.4
106.844.861.5
4.2 4.1
93.698.6
*•
4.2
95.4
98.494.5
NS
94.9
97.4NS
88.6104.4
**
7.0
95.295.998.5
NS
88.6
90.889.8
NS
90.4
87.791.2
NS
52.354.0
NS
49.7
56.453.3
**
3.8
51.4
54.9
3.2
46.256.5
*•
8.3
46.4
51.855.8
+
7.0
46.2
51.849.0
NS
46.547.552.9
+
5.8
130.2168.3
**
7.4
145.9152.6
•
5.7
145.2154.9147.7
7.2
146.3152.2
5.7
134.8161.0
**
12.6
141.6
147.7154.3
NS
134.8142.6
138.8NS
136.9135.2144.1
NS

152
THE INFLUENCE OF EROSION CLASS AND SLOPE STEEPNESS ON
THE PRODUCTIVITY OF MT. CARROLL SILT LOAM SOILS
Clifton Halsey
Objective
To determine the effect of past erosion on the yield of corn grown on Mt. Carroll silt loam soils.
Problem
It is generally assumed that the removal of topsoil by erosion reduces the productivity of theremaining soil. Soil scientists realize that the proportion of productivity lost depends on thequality of the productivity-related characteristics of the remaining soil.
Research with well-drained deep loam soils has shown that where the original surface soil ismechanically removed, crop productivity can be restored with additional fertilizer. Economic researchregarding the effects of erosion on projected long-term productivity has shown generally that farmerscan expect only very minor increases in farm Income from using soil conserving practices. Yieldestimates used in these income computations have been based primarily on the subjective Judgment ofsoil scientists. There has been very little, if any, recent research on this problem on the erosivesloping soils in southeastern Minnesota. The question still persists, "What is the effect of erosionon the crop productivity of Minnesota's soils?".
Procedure
Field research is being conducted on Mt. Carroll silt loam soils In typical farm fields in OlmstedCounty; 1981 was the first year of the study.
Three different suitable fields will be located each of five successive years in Olmsted County withthe aid of SCS soil scientist, George Poch, and the permission of the farmers. Each field is to havethree adjacent classes of erosion - slight, moderate and severe, as defined below.
Soil cores of the sites are taken during the spring to locate three plots classed as having none toslight, moderate, and severe erosion. The plots are about 100 feet x 100 feet in size. None toslight erosion is defined as sites having a depth greater than 30 inches to the bottom of the B2horizon. Moderate erosion includes sites having a depth between 20 and 30 inches to the bottom ofthe B2 horizon. Severely eroded sites will have a depth of less than 20 inches to the bottom of theB2 horizon. The depth of profile development is related to the slope steepness and distinguishingbetween the effect of accelerated erosion and the effect of slope steepness on productivity Is verydifficult and perhaps impossible. Three cores, 5 feet deep, will be taken from each yield plot anddivided into the following Incremental samples: Ap horizon, bottom of the Ap to 20 inches deep, 20 to30 inches deep, 30 to 40 inches deep, kO to 50 inches deep, and 50 to 60 inches deep. They will bestored in plastic bags for later analysis. (The 1981 cores were divided by horizons.)
Detailed cropping and management history are obtained for each field to determine possible sources ofvariation in results.
The following analyses will be made of the core increments:
chemical: organic carbon, available phosphorus, exchangeable potassium, available zinc, and pH
physical: particle size, available water-holding capacity, mechanical resistance, and availablewater during planting the middle of June and at tasseling.
Samples of the crops are harvested from each plot and weighed; moisture content of these samples andyields are determined.
Statistical analysis will determine the relationship of crop yield to the erosion class and to othermeasured characteristics of the soil. The 1981 data have not been statistically analyzed.

153
Results and Discussion - First Year
The corn yields and plant populations for each plot and the averages for each erosion class are shownin Table 1. Variations in weediness, lodging and plant populations are likely causes of the variationin yields. Field Behnken-2 was contoured with tight turns in the slightly eroded plot. Lodging andan apparent overlapping of rows confused harvesting in the Behnken-2 moderately eroded plot. Thegeneral moisture conditions during the growing season were good.
The average depths of the lower boundaries of the horizons are given in Table 2. The plots fittedquite well with the established criterion for associating erosion with depth to the bottom of the B2horizon, as defined previously in "Procedure". The Behnken-2 field has a more deeply developedprofile.
Extractable phosphorus in parts per million for three horizons as plot averages and horizon averagesare in Table 3* Analyses of the Ap horizons reflect applications of commercial fertilizer.Phosphorus content of the subsoil is generally high.
Exchangeable potassium analyses are shown in Table 4. Potassium levels in the Ap horizon rangedbetween medium and high because of applications of commercial fertilizer. Levels in the subsoil weremostly medium to medium-high.
Available zinc was mostly in the lower medium range as shown in Table 5-
Available moisture capacities of the horizons in the erosion classes are listed in Table 6. They arequite uniform.
Soil acidities as pH are given in Table 7- The pH of the Ap horizons reflects the liming history ofthe fields. The pH of the B2 and the Cl horizons of the slight and moderate erosion classes averagearound 5.8 to 6.0. Limy till lies a little below 5 feet from the surface. Two cores struck the tillwithin 4 to 5 feet of the surface.
Organic carbon percentages are contained in Table 8. There seems to be a difference among the threefields in this order: 0hm-1>, Behnken-2>, Behnken-1. The difference may be due to long termmanagement or to native vegetation. The differences between erosion classes may be attributable toaccelerated erosion and slope steepness.
Particle size data are in Table 9. The figures are the averages of the three fields for each horizonwithin each erosion class. The textures appear quite uniform throughout the profiles.
Summary and Conclusions
Information on which statements are based regarding the effect of erosion on crop productivity inMinnesota is not very solid. Locating suitable sites for comparing erosion classes Is difficult.Distinguishing between accelerated erosion and soil formation factors as influences on depths of soilto the bottom of the 82 horizon may be impossible. Using portions of farm fields as plots producesconsiderable variation in yields. Adequate moisture during the entire growing season may minimizeyield differences among erosion classes.
The Mt. Carroll subsoils appear to have medium to high quantities of extractable phosphorus andmoderate amounts of exchangeable potassium. Surface supplies of zinc border on insufficient for corn.
Available moisture throughout the profile is quite high. The soils are acid unless limed. Organiccarbon ranges between 1 and over 2 percent, depending on the site and the position on the landscapeor amount of erosion. The soil texture is a quite uniform silt loam throughout the profile.
More attention needs to be given to locating fields having uniform management to reduce yieldvariation. Data should be collected which indicates the available moisture status of the soil.
Years of moisture stress may result in yield differences between erosion classes.

154
Table 1. Corn stands and yields - 1981 fields.rs
Erosion Plants Peir Acre
Class Behnken- 1 Behnken-2 0hm-1 Average
slightmoderate
severe
17.050
18.10017.900
18.00023.050
20,000
26,60025,00025.300
20.700
22,05021,067
Bushels Peir Acre
Behnken-•1 Behnken-2 0hm-l Average
slightmoderate
severe
138.4123-2
135-3
112.2
129.9115.8
176.4163.6163.4
142.3138.9138.2
Table 2. Average horizon lower boundary depth:i - 1981 fitilds (inches).
Erosion
Horizon
Plot Averages 3-PlotClass Behnken-1 Behnken-2 0hm-1 Averages
slight ApB21
B22, 23
B3Cl
9-317.334.044.755-3
8.0
23.3
35.748.060.0
9.0
18.729.339-049.0
8.8
19.833-0
43.958.4
moderate ApB21
B22
B3, 23Cl
8.718.726.736.044.0
7-0
16.726.738.360.0
8.0
16.724.032.0
54.3
7.917.425.835.4 ^52.8 ' y
severe ApB2
B3Cl
C2
6.0
17.7
25-334.044.0
6.720.7
38.360.0
7.0
17.7
28.747.752.0
6.6
18.730.847.248.0
Table 3- Extractable phosphorus - 1981 fields (parts 1>er mi 11 ion).
Erosion
Horizon
Plot Averages 3-PIotClass Behnken-1 Behnken-2 0hm-1 Averages
slight ApB21
Cl
14.013.2
18.8
18.2
27.330.2
32.39-316.0
21-516.6
21.7
moderate Ap
B21
Cl
15-715-319.0
19-723.0
28.3
19.7
13.5
18.7
18.4
17.322.0
severe ApB21
Cl
29.721.2
20.2
19-813.016.0
25.814.812.8
25-1
16.316.3
rs

155
Table 4. Exchangeable potassium - 1981 fields (parts per million),
Uk rosion
Class
slight
moderate
severe
Plot Averages 3-P1ot
Hor izon Behnken-1 Behnken-2 0hm-1 Averages
ApB21
Cl
112.3
68.559-0
153.3118.8
107.2
115.881.0
70.2
127.189.478.8
ApB21
Cl
107.580.263.2
122.399-0
85-7
112.2
91.776.2
114.0
90.375-0
ApB21
Cl
160.2
86.8
66.3
89.089.764.0
85.879-748.5
111.7
85.459-6
Table 5. Available zinc in the Ap horizon - I98I fields.
Erosion
Class
slightmoderate
severe
Plot Averages 3-Plot
Behnken-1
0.570.400.50
Behnken-2
0.830.730.63
0hm-1
0.770.430.37
Average
0.72
0.52
0.50
Table 6. Available moisture capacity - 1981 fields.
V^^E rosionClass
slight
moderate
severe
o
difference between 1/3 bar 6 15 bar,percent of oven-dry weightField 3-Plot
Horizon Behnken-1 Behnken-2 0hm-1 Averages
Ap 19-1 14,.4 13-3 15-6B21 18.1 17,,4 19.1 18.2
B22 17.6 19.•9 18.6 18.7Cl 18.2 17..8 18.7 18.2
Ap 17.3 12..6 14.2 14.7B21 17.2 16,.6 17.6 17-1B22 17.5 19..0 19.0 18.5Cl 17.0 18,•5 16.8 17.4
Ap 15.3 10,•9 15.8 14.0
B21 17.0 14,.1 19.3 16.8
B22 12.6 17,.4 19-7 16.6
Cl 16.9 17..8 19.4 17.9

156
Table 7- pH (water) - I98I fields.-T\
Erosion
Class
slight
moderate
severe
Horizon
ApB21
B22
C1
ApB21
B22
Cl
C2
ApB21
B22
Cl, 2
Behnken-1
7-0
7.1
6.76.2
7.16.8
6.0
5.9
7.1
6.96.6
6.1
Plot Averages
Behnken-2
6.0
6.05.4
5-7
6.15.85.45.7
6.86.2
5-86.1
0hm-1
6.2
6.2
5.86.0
6.86.4
6.05-87.4
6.56.5
7-6
3-PlotAverages
6.46.4
6.0
6.0
6.76.35.85.8
6.8
6.56.2
6.6
Table 8. Percent organic carbon in the Ap horizon - 1981 fields.
Erosion
Class
none to siightmoderate
severe
Behnken-1
1.40
1.23
1.03
Plot Averages
Behnken-2
1.60
1-331.10
Ohm-1
2.23
1.671-57
3-PlotAverages
(0.M.%)1.74 3-01.41 2.4
1.23 2.1
Table 9. Particle size data - 1981 fields (average percent).n
Erosion
Class
slight
moderate
severe
Sand Silt
Horizon v.f. sand total fine total Clay
ApB21
622
C1
5.76.89.615-7
7-28.010.1
17.4
32.731.524.320.6
71.468.264.462.4
21.723-825.420.2
ApB21
B22
Cl
4.96.710.0
15.0
6.37.810.8
16.6
31.927.2
27-719.3
70.065-066.664.9
23.727.2
22.6
18.5
ApB21
B22
Cl
7-09-0
13.116.1
8.611.0
21.916.8
26.8
23.619.019.2
66.6
63.155-166.2
24.725-923.0
17.0
Texture
C ass
si It loam
si t loam
si t loam
si It loam
si It loam
si Ity clay loamsi It loam
si It loam
si It loam
si It loam
si It loam
si It loam
rs