nagios certified administrator · chapter 8: monitor with ssh ... the purpose of this manual is to...
TRANSCRIPT

Nagios Certified Administrator
Preparation for the Nagios Certified Administrator Exam.

Date of Manual Version: July 2, 2012
Copyright and Trademark Information
Nagios is a registered trademark of Nagios Enterprises. Linux is a registered trademark of Linus Torvalds. Ubuntu registered trademarks with Canonical. Windows is a registered trademark of Microsoft Inc. All other brand names and trademarks are properties of their respective owners.
The information contained in this manual represents our best efforts at accuracy, but we do not assume liability or responsibility for any errors that may appear in this manual.

Table of ContentsAbout This Manual...................................................6Intended Audience...................................................6Preparation for Exercises...........................................6Chapter 1: Introduction.............................................1Nagios Monitoring Solutions.......................................1Technical Support...............................................2Official Training...............................................2Service and Host Check Options..................................3
Chapter 2: Installation.............................................5Installing From Source............................................5File System Tree................................................7
Installation From Repository......................................8Chapter 3: Configuration ..........................................11Configuration Files..............................................12Eliminating the HTTP Error.....................................13Nagios Check Triangle..........................................14Review File Locations..........................................15
Network Addressing...............................................18Implementing Changes...........................................18
Objects..........................................................19Object Types ..................................................19Host Groups....................................................19Service Groups.................................................22Contact Groups.................................................23Object Inheritance ............................................23Understanding the Basics.......................................23Local vs. Inherited Variables..................................25Chaining.......................................................27Precedence in Multiple Sources.................................28Incomplete Object Definitions .................................29Creating Custom Variables......................................29Canceling Inheritance..........................................30Additive Inheritance...........................................31Using Hostgroups...............................................31
Templates........................................................33Modify Timeperiods.............................................34
Illegal Object Name Characters ..................................35Security Risks...................................................35Plugin Use.......................................................35Web Interface ...................................................37Event Handlers...................................................37Managing Nagios Time.............................................40Nagios Core BackUp...............................................40Reachability ....................................................43Volatile Service ................................................48State Stalking...................................................48

Flapping.........................................................48Parallelism......................................................51Orphaned Service.................................................51Freshnesss.......................................................51Commit Error from the Web Interface .............................52Nagios Checks: Active/Passive....................................53Active.........................................................53Passive .......................................................53
Distributed Monitoring...........................................54Central Nagios Server Set Up ..................................55Non-central Set Up ............................................58
Sending Mail From Nagios.........................................60Nagiostats.......................................................62Performance......................................................64Create RAM Disk................................................64Caching with rrdcached.........................................66Reaper Settings................................................68
Addons...........................................................69NDOUtils.......................................................69Install NDOUtils...............................................71NagVis.........................................................73
Updates..........................................................73Checking for Updates...........................................74Updating Nagios Core...........................................75
Chapter 4: User Management.........................................79Authentication and Privileges..................................79Authentication.................................................79Notification ..................................................84Escalation.....................................................87Notification: Host and Service Dependencies....................92
Chapter 5: Public Ports............................................95check_ping.....................................................97check_tcp......................................................97check_smtp.....................................................98check_imap.....................................................99check_simap...................................................100check_ftp.....................................................101check_http....................................................101check_dig.....................................................103
Chapter 6: Monitor Linux..........................................105NRPE Concepts.................................................106Set Up the Nagios Server......................................109Modifying NRPE................................................111
Chapter 7: Monitor Windows........................................113Installation of NSClient++....................................113NSClient++ and check_nt.......................................116NSCLient++ Password ..........................................118NRPE on Nagios Server.........................................118

NSClient++ and NRPE...........................................119NRPE: Internal NSClient ++ Functions..........................120
Chapter 8: Monitor with SSH.......................................123Configure the Nagios Server...................................123Configure Remote Host ........................................124From the Nagios Server Test the SSH Connection ...............124Using SSH to Check Services...................................124
Chapter 9: Scaling Nagios.........................................127Install check_multi...........................................127Create check_multi.cmd........................................128check_multi with SSH .........................................129
Chapter 10: Graphing .............................................133PNP4Nagios .....................................................135NagiosGraph.....................................................139MRTG............................................................140Cacti on Nagios ................................................141
Chapter 11: Monitor with SNMP ....................................143SNMP for Servers................................................146Activate SNMP on Windows Server...............................146Checking SNMP on a Windows Server.............................146SNMP Checks with Linux Servers................................148
Chapter 12: Exercises.............................................153Exercise #1: Installation From Source.........................153Exercise #2: Increasing Nagios Performance....................155Exercise #3: Installing NRPE..................................156

About This ManualThe purpose of this manual is to provide a study resource for the Nagios Certified Administrator Exam. This manual has been written to aid those taking the exam, but it is also a resource for those who are administrators that manage Nagios on a daily basis. The questions that are presented in the exam are framed in context in this manual. In order to facilitate learning at a deeper level, exercises are included to help students work through the practical solutions that the exam represents.
Intended AudienceThe information contained in this manual is intended for those who will be pursuing the Nagios Certified Administrator Certification from Nagios and for administrators working with Nagios on a daily basis. The content of the Nagios Certifed Administrator Certification aims at the individual designing, implementing and supporting of a Nagios Core installation.
Preparation for ExercisesThere are several stepbystep exercises included in the manual which will illustrate these aspects that an administrator managing Nagios Core needs to capable of:
* How to install Nagios Core from source.* How to tune a Nagios system for performance.* How to implement the NRPE agent for Linux monitoring.
Generally the exercises can be performed on any network and illustrate skills that all networks using Nagios will employ.

Chapter 1: Introduction 1
Chapter 1: IntroductionThe Nagios Certified Administrator exam is designed to evaluate the skill set of an administrator who is responsible for managing a Nagios Core system. The requirements for passing this exam include the ability to install a Nagios Core system with the understanding of how it will be designed, implemented with an operating system and supported once the installation is complete.
The support of the Nagios system after installation includes the ability to install and view graphing, review data that suggests trends, understand the difference of passive and active checks in how they relate both to standard implementations and distributed monitoring, and be able to install agents on various operating systems so Nagios can effectively monitor internal components of the system.
All of this can be accomplished on a system that supports these features of Nagios.
FlexibilityNagios has been designed to be able to meet these flexibility requirements by providing the tools to monitor just about anything that is connected to a network allowing administrators to monitor both the internal metrics like CPU, users, disk space, etc. and the application processes on those devices.
ExtensibilityNagios is designed to be able to use both plugins and addons designed by Nagios and addons created by thirdparty organizations. Nagios is able to integrate with almost any script languages that an organization may be using including; shell scripts, Perl, ruby, etc.
ScalabilityAs companies grow more equipment will need to be monitored and greater diversity of equipment will be implemented. Nagios is designed to be able to scale with companies as they grow and have changing needs.
Open Source codeNagios Core is an Open Source Software licensed under the GNU GPL V2.
CustomizableCustomization not only includes what devices to monitor, how those devices and applications within the devices will be monitored, but also includes the protocol, plugin, addon, etc, that is incorporated into Nagios to allow that monitoring to occur.
Nagios Monitoring SolutionsNagios Core is the foundational application that provides the monitoring and alerting options that Nagios is known for. Administration of the Nagios interface is mainly achieved through the CLI or Command Line Interface. The Nagios web interface which uses CGI as the backend by default can be modified to use a MySQL database. The frontend or web interface, can be modified with custom options to provide the look and feel that an organization needs. Several examples of frontends would be themes that are available (i.e. Exfoliation, Vautour and Arana), Web Interfaces like VShell, Nagiosdigger, MNTOS, Check_MK and Mobile Interfaces like Nagios Mobile, NagMobile and
Copyright by Nagios Enterprises, LLC Cannot be reproduced without written permission. P.O. Box 8154, Saint Paul, MN 55108
Chapter 1: Introduction 2
iNag. Vshell is the official PHP interface for Nagios Core. Nagios Core by design features and supports many different addons that can be used with it.
Nagios XI takes the Nagios Core and builds upon it to create an enterpriseclass monitoring and alerting solution that is easier to set up and configure using a PHP frontend. Nagios XI using easy to use network wizards provides infrastructure monitoring of all of an organization's critical hardware, applications, network devices and network metrics. The dashboard feature allows you to view the entire infrastructure visually as you monitor all of these services and devices. You also have the alerting options which communicate to administrators when services and hosts have problems. The trending and hardware capacity limits help you create proactive decisions about the network and devices on the network. The graphical interface is easy to customize to fit the organization needs and by monitoring the graphs will help you predict network, hardware and application problems.
Nagios Fusion provides a GUI for central management of a network infrastructure spread over a large geographical area. With central management Nagios Fusion allows the organization to review the organization's entire structure in one location through one interface and yet allow each location to manage their infrastructure independently. Tactical overview screens provide a snapshot of the monitored devices globally.
Nagios Fusion is distributed monitoring the easy way. It provides scalability and comprehensive server support worldwide and in a central location. Fusion also provides the opportunity to create a failover situation with multiple Fusion servers.
Technical SupportThe official support site for Nagios can be found at http://support.nagios.com/forum. This site provides both free support open to anyone and also customer support for those who have purchased a support contract. The user can ask questions of the technical staff at Nagios and receive answers usually within the same business day.
Official TrainingNagios provides Official Nagios Training for both Nagios Core and Nagios XI. The training options can be found at http://nagios.com/services/training. Training services include Live Training performed over the Internet or onsite as well as selfpaced training for those wanting to work on their own as they have available time. The Official Nagios training provides users with comprehensive manuals with stepbystep instructions and videos which students can view in order to understand how to implement Nagios in a variety of ways.
Copyright by Nagios Enterprises, LLC Cannot be reproduced without written permission. P.O. Box 8154, Saint Paul, MN 55108

Chapter 1: Introduction 3
Service and Host Check Options
Public Service Checks There are a number of protocols that exist which allow the Nagios server to test them externally. For example the common port 80 is available on any web server.
FTP port 21 SSH port 22 WEB port 80 SMTP port 25 Secure Web port 443
These public services allow Nagios to not only check to see if the port is open but to verify the correct application is running on the specific port. This can be done because each of these public services run specific protocols which provide the information needed to monitor them correctly and to differentiate them from other services on the same server. Checks Using SSH Nagios can connect to a client server using SSH and then execute a local plugin to check internal functions of the server like CPU load, memory, processes, etc. The advantage of using SSH is that checks are secure in the connection and the transfer of information. The disadvantage of SSH is the complexity of setting up keys and the configuration required on the host including editing visudo for some checks.
Nagios Remote Plugin Executor NRPE, Nagios Remote Plugin Executor, executes plugins internally on the client and then returns that information to the Nagios server. The Nagios server connects on port 5666 in order to execute the internal check. NRPE is protected by the xinetd daemon on the client so that an administrator can restrict the connections to the NRPE plugins. The advantage is that it is the easiest agent to set up.
Monitoring with SNMP SNMP, Simple Network Management Protocol, is used extensively in network devices, server hardware and software. SNMP is able to monitor just about anything that connects to a network, that is the advantage. The disadvantage is that it is not easy to work with. The complexity of SNMP is made even worse by the fact that vendors write propitiatory tools to monitor SNMP that are not easily accessed using Nagios. SNMP can be monitored directly using Nagios plugins or the device itself can monitor SNMP and send information to SNMP traps which can be located on the Nagios server. The difficulties are further aggravated when using traps as the SNMP trap information must be translated into data that Nagios can understand.
Nagios Service Check Acceptor NSCA, Nagios Service Check Acceptor, employs a daemon on the Nagios server which waits for information generated by passive checks which execute independently on the client being monitored by Nagios. The advantage of NCSA is that services are monitored locally independent of the Nagios server and then sent to the Nagios server so this is a good option when a firewall between the Nagios server and the client prevent other types of communication. The disadvantage is that passive checks use plugins but often require scripts to execute on the client.
Communication can be encrypted between the client and the Nagios server and a password will be required to
Copyright by Nagios Enterprises, LLC Cannot be reproduced without written permission. P.O. Box 8154, Saint Paul, MN 55108

Chapter 1: Introduction 4
complete communication.
Another use for NSCA is distributed monitoring. Distributed monitoring allows a wide geographical base of network devices to be monitored by multiple Nagios servers which use NSCA to send service checks and host checks to a central Nagios server.
Nagios Remote Data ProcessorNRDP is another way of monitoring using passive checks. The advantage of using NRDP is that it uses less resources and it connects on the common port 80 or 443 on the Nagios server.
NSClient ++This agent is installed on Windows servers and desktops in order to monitor with either check_nt, NRPE or using passive checks. This is the most reliable Windows agent available and has the advantage of multiple options for monitoring.
Copyright by Nagios Enterprises, LLC Cannot be reproduced without written permission. P.O. Box 8154, Saint Paul, MN 55108

Chapter 2: Installation 5
Chapter 2: Installation
Nagios Core may be installed several different ways; compiled by source or installed from distribution based repositories. The default method of installing Nagios is to use source code. Installing Nagios from distribution repositories will install Nagios and plugins in different locations than the defaults so this must be taken into consideration when making any edits to files. This document is based on compiling Nagios on a CentOS server.
Installing From SourceInstallation from source is a process where the source code that was developed by the programmer is converted into a binary format that the server can run. Compiling Nagios is not as difficult as it may sound. It may require a few extra steps in setting up Nagios but there are several advantages over using a RPM repository or a DEB repository. The biggest advantage of installing from source is that the installation process can be repeated on almost any Linux distribution. This aspect is even more important when you consider that whether you install from a RPM repository (CentOS) or from a DEB repository (Ubuntu) the file names and locations for files are different in each case. The implications for documentation are that you must translate any documentation to the installation method that was chosen.
Another significant advantage of compiling from source is that you have more options so the configuration may be altered to meet specific requirements. Of course, any changes to the defaults mean that the documentation and other dependencies must be evaluated per the changes from the default.
The installation of Nagios must be performed as root. In order for all of the following commands to work become root with the complete root environment or use sudo with the full path to binaries.
su root password
or use the sudo command
Move into the /tmp directory to perform the install. The source files from this directory can be removed once the installation is complete.
cd /tmp
The source code that is downloaded is in the form of a tarball and compressed so it is in the form of a tar.gz file. The wget command is used to pull the source code down from the web site.
wget http://prdownloads.sourceforge.net/sourceforge/nagios/nagios3.4.1.tar.gz
wget http://sourceforge.net/projects/nagiosplug/files/nagiosplug/1.4.15/nagiosplugins1.4.15.tar.gz/download
Prerequisites to compile. When you compile software it will require a compiler like GCC. This source code is what the programmer has
Copyright by Nagios Enterprises, LLC Cannot be reproduced without written permission. P.O. Box 8154, Saint Paul, MN 55108

Chapter 2: Installation 6
developed in an editor. The compiler takes the source code and converts it into binary code that the server can use. Or to put it another way, the source code is taken and built into object code which can then be executed from the computer hardware. It is typical that the source code will have dependencies as well. Dependencies are applications that are required to be installed before the source code will work properly. Several of the files installed with yum in this example are dependencies that must be available. Note that depending on the Linux distribution these dependency applications may be called by different names.
A web server must be installed in order to use the CGIs.
yum install y httpd php gcc glibc glibccommon gd gddevel
Add the required users and groups.useradd nagios
groupadd nagcmd
usermod a G nagcmd nagios
The tarballs are compressed so in order to compile these must be expanded into the directories that contain the source code.
tar zxvf nagios3.4.1.tar.gz tar zxvf nagiosplugins1.4.15.tar.gz
Move into the directory created when the Nagios source was uncompressed and run the configure script using the group that was created earlier.
cd nagios./configure withcommandgroup=nagcmd
The make command will compile the Nagios source code.make all
Now make will install the binaries, the init script, the config files, set the permissions on the external command directory and verify the web configuration files are installed. The semicolons allow you to run all the commands from one line.
make install; make installinit; make installconfig; make installcommandmode; make installwebconf
Edit the contacts.cfg and and add the email for the primary nagios administrator, nagiosadmin.
vi /usr/local/nagios/etc/objects/contacts.cfg
Create a password for the nagiosadmin which will be needed in order to login to the web interface.
htpasswd c /usr/local/nagios/etc/htpasswd.users nagiosadmin
Copyright by Nagios Enterprises, LLC Cannot be reproduced without written permission. P.O. Box 8154, Saint Paul, MN 55108

Chapter 2: Installation 7
Nagios Plugins Move into the directory created when the Nagios plugins source was uncompressed and run the configure script using the group that was created earlier. Note: If you want to use check_snmp be sure to install netsnmp before you compile the plugins.
yum install y netsnmp
cd /tmpcd nagiosplugins1.4.15
./configure withnagiosuser=nagios withnagiosgroup=nagios
Now make will install the binaries. make make install
File System TreeThe file system tree will always be the same if you allow for the defaults when compiling.
/usr/local/nagios> /etc
| nagios.cfg| cgi.cfg| resource.cfg| htpasswd.users> /objects
| commands.cfg| contacts.cfg| localhost.cfg| printer.cfg| switch.cfg| templates.cfg| timeperiods.cfg| windows.cfg
> /bin| nagios| nagiosstats
> /include> /libexec
| plugins are kept here> /sbin
| cgi scripts are located here> /share
| web files are located here> /var
| socket, log and data files located here
Copyright by Nagios Enterprises, LLC Cannot be reproduced without written permission. P.O. Box 8154, Saint Paul, MN 55108
Chapter 2: Installation 8
Installation From Repository
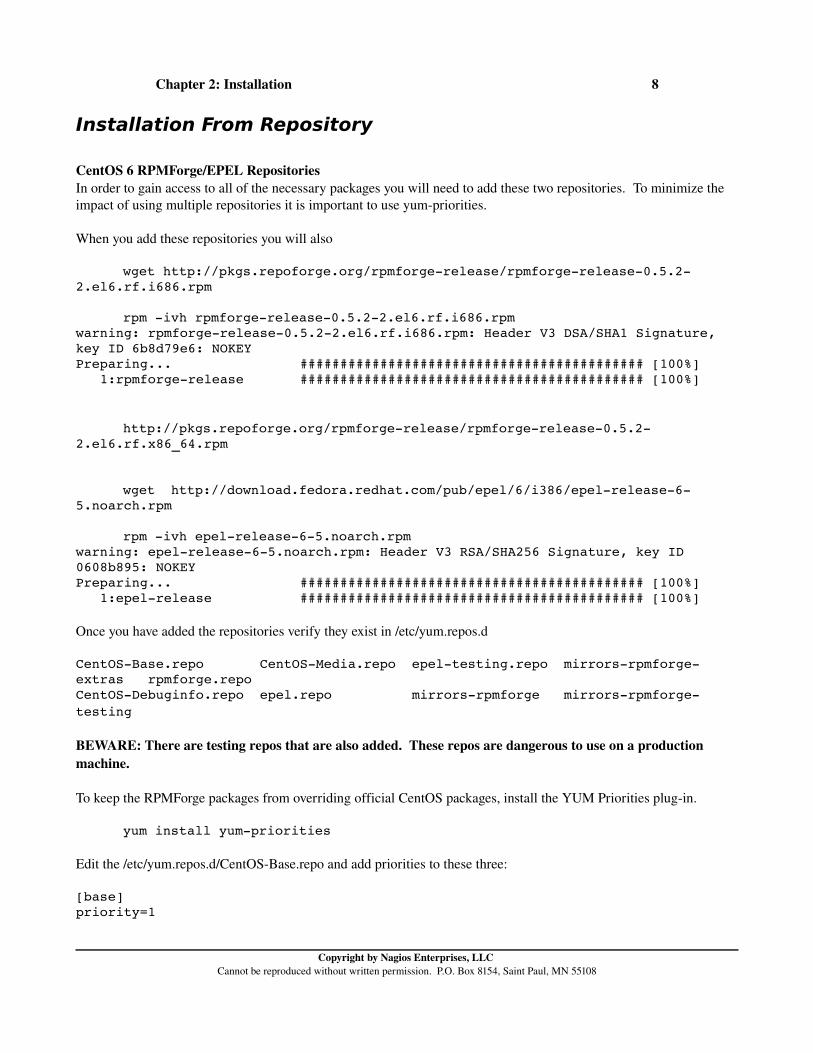
CentOS 6 RPMForge/EPEL Repositories In order to gain access to all of the necessary packages you will need to add these two repositories. To minimize the impact of using multiple repositories it is important to use yumpriorities.
When you add these repositories you will also
wget http://pkgs.repoforge.org/rpmforgerelease/rpmforgerelease0.5.22.el6.rf.i686.rpm
rpm ivh rpmforgerelease0.5.22.el6.rf.i686.rpm warning: rpmforgerelease0.5.22.el6.rf.i686.rpm: Header V3 DSA/SHA1 Signature, key ID 6b8d79e6: NOKEY Preparing... ########################################### [100%] 1:rpmforgerelease ########################################### [100%]
http://pkgs.repoforge.org/rpmforgerelease/rpmforgerelease0.5.22.el6.rf.x86_64.rpm
wget http://download.fedora.redhat.com/pub/epel/6/i386/epelrelease65.noarch.rpm
rpm ivh epelrelease65.noarch.rpm warning: epelrelease65.noarch.rpm: Header V3 RSA/SHA256 Signature, key ID 0608b895: NOKEY Preparing... ########################################### [100%] 1:epelrelease ########################################### [100%]
Once you have added the repositories verify they exist in /etc/yum.repos.d
CentOSBase.repo CentOSMedia.repo epeltesting.repo mirrorsrpmforgeextras rpmforge.repo CentOSDebuginfo.repo epel.repo mirrorsrpmforge mirrorsrpmforgetesting
BEWARE: There are testing repos that are also added. These repos are dangerous to use on a production machine.
To keep the RPMForge packages from overriding official CentOS packages, install the YUM Priorities plugin.
yum install yumpriorities
Edit the /etc/yum.repos.d/CentOSBase.repo and add priorities to these three:
[base] priority=1
Copyright by Nagios Enterprises, LLC Cannot be reproduced without written permission. P.O. Box 8154, Saint Paul, MN 55108

Chapter 2: Installation 9
[updates] priority=1
[extras] priority=1
Now access the rpmforge.repo and edit one repository, the others are disabled, to make it 5 in priority.[rpmforge]priority=5
Finally, edit epel.repo and make it 11 in priority.
[epel]priority=11
The purpose of the priorities for a production server is to maintain as much stability as possible with access to packages that are not in the CentOS 6 repository. The numbers (111) represent the most important repository as the CentOS repo, then if packages are not located the rpmforge.repo will be accessed and last the epel.repo. The epel.repo, which is Fedora, is likely to introduce packages slightly ahead of current CentOS packages. Again, this is not a perfect solution, but if you need packages outside of the CentOS repositories you do not have many options unless you compile all of the packages.
To test your configuration, run the command,
yum checkupdate
When it finishes, you should see a line similar to:
818 packages excluded due to repository priority protections
It is important that you are working with an updated system before you install Nagios. So perform a:
yum update
You will see packages that will be updated and you will be asked to add the RPMGPGKEYCentOS5 which ensures the integrity of the packages that you download. Note: If you add a kernel, as in the text below, you will need to reboot the system for the kernel to be active.
47/60): selinuxpolicytargeted2.4.6279.el5_5.1.noarc | 1.2 MB 00:08 (48/60): rpm4.4.2.320.el5_5.1.i386.rpm | 1.2 MB 00:08 (49/60): ksh201002021.el5_5.1.i386.rpm | 1.2 MB 00:10 (50/60): crash4.1.24.el5.centos.1.i386.rpm | 1.5 MB 00:10 (51/60): gnupg1.4.514.el5_5.1.i386.rpm | 1.8 MB 00:12 (52/60): udev09514.21.el5_5.1.i386.rpm | 2.3 MB 00:15 (53/60): lvm22.02.568.el5_5.6.i386.rpm | 2.6 MB 00:17 (54/60): devicemappermultipath0.4.734.el5_5.5.i386.r | 2.8 MB 00:19 (55/60): poppler0.5.44.4.el5_5.13.i386.rpm | 3.0 MB 00:20 (56/60): cups1.3.718.el5_5.7.i386.rpm | 3.1 MB 00:21 (57/60): glibc2.549.el5_5.4.i686.rpm | 5.3 MB 00:35
Copyright by Nagios Enterprises, LLC Cannot be reproduced without written permission. P.O. Box 8154, Saint Paul, MN 55108

Chapter 2: Installation 10
(58/60): perl5.8.832.el5_5.2.i386.rpm | 12 MB 01:15 (59/60): glibccommon2.549.el5_5.4.i386.rpm | 16 MB 01:47 (60/60): kernel2.6.18194.17.1.el5.i686.rpm | 17 MB 01:49 Total 141 kB/s | 90 MB 10:49 warning: rpmts_HdrFromFdno: Header V3 DSA signature: NOKEY, key ID e8562897 updates/gpgkey | 1.5 kB 00:00 Importing GPG key 0xE8562897 "CentOS5 Key (CentOS 5 Official Signing Key) <centos5[email protected]>" from /etc/pki/rpmgpg/RPMGPGKEYCentOS5
Install Nagios
yum install y nagios nagiosplugins
Copyright by Nagios Enterprises, LLC Cannot be reproduced without written permission. P.O. Box 8154, Saint Paul, MN 55108
Chapter 3: Configuration 11
Chapter 3: Configuration
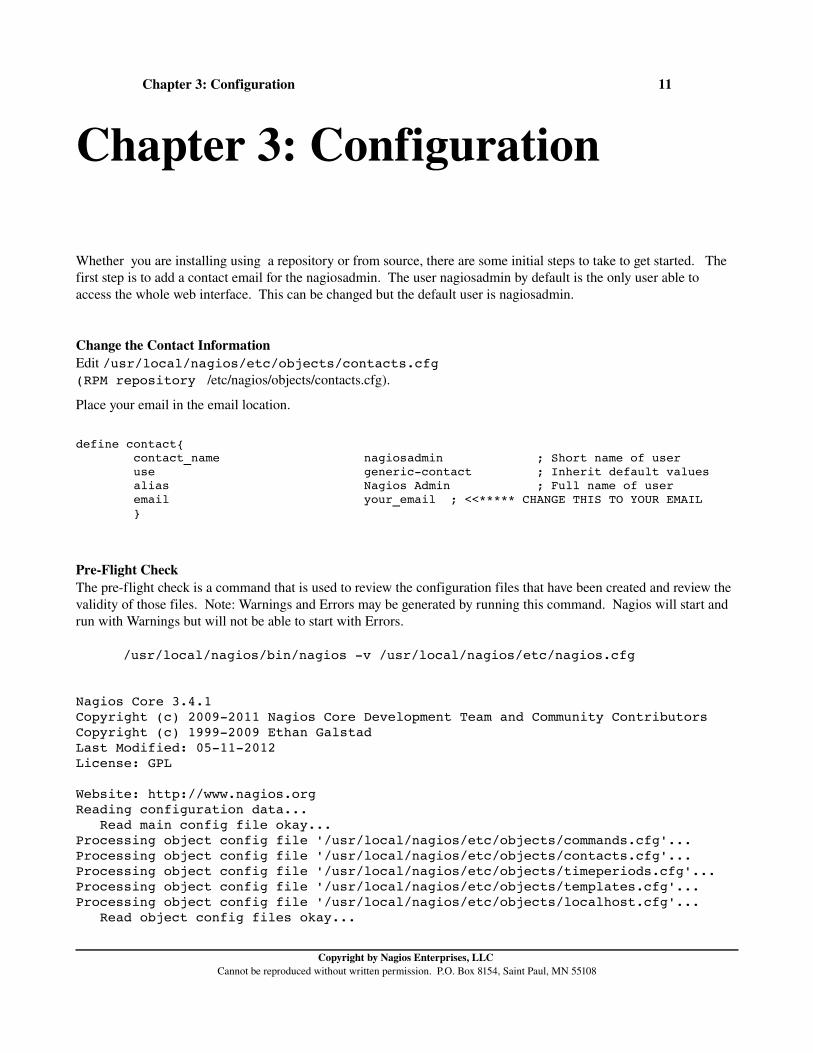
Whether you are installing using a repository or from source, there are some initial steps to take to get started. The first step is to add a contact email for the nagiosadmin. The user nagiosadmin by default is the only user able to access the whole web interface. This can be changed but the default user is nagiosadmin.
Change the Contact InformationEdit /usr/local/nagios/etc/objects/contacts.cfg (RPM repository /etc/nagios/objects/contacts.cfg).
Place your email in the email location.
define contact{ contact_name nagiosadmin ; Short name of user use genericcontact ; Inherit default values alias Nagios Admin ; Full name of user email your_email ; <<***** CHANGE THIS TO YOUR EMAIL }
PreFlight CheckThe preflight check is a command that is used to review the configuration files that have been created and review the validity of those files. Note: Warnings and Errors may be generated by running this command. Nagios will start and run with Warnings but will not be able to start with Errors.
/usr/local/nagios/bin/nagios v /usr/local/nagios/etc/nagios.cfg
Nagios Core 3.4.1Copyright (c) 20092011 Nagios Core Development Team and Community ContributorsCopyright (c) 19992009 Ethan GalstadLast Modified: 05112012License: GPL
Website: http://www.nagios.orgReading configuration data... Read main config file okay...Processing object config file '/usr/local/nagios/etc/objects/commands.cfg'...Processing object config file '/usr/local/nagios/etc/objects/contacts.cfg'...Processing object config file '/usr/local/nagios/etc/objects/timeperiods.cfg'...Processing object config file '/usr/local/nagios/etc/objects/templates.cfg'...Processing object config file '/usr/local/nagios/etc/objects/localhost.cfg'... Read object config files okay...
Copyright by Nagios Enterprises, LLC Cannot be reproduced without written permission. P.O. Box 8154, Saint Paul, MN 55108

Chapter 3: Configuration 12
Running preflight check on configuration data...
Checking services... Checked 7 services.Checking hosts... Checked 1 hosts.Checking host groups... Checked 1 host groups.Checking service groups... Checked 0 service groups.Checking contacts... Checked 1 contacts.Checking contact groups... Checked 1 contact groups.Checking service escalations... Checked 0 service escalations.Checking service dependencies... Checked 0 service dependencies.Checking host escalations... Checked 0 host escalations.Checking host dependencies... Checked 0 host dependencies.Checking commands... Checked 24 commands.Checking time periods... Checked 5 time periods.Checking for circular paths between hosts...Checking for circular host and service dependencies...Checking global event handlers...Checking obsessive compulsive processor commands...Checking misc settings...
Total Warnings: 0Total Errors: 0
Things look okay No serious problems were detected during the preflight check
By default it should run and you should be able to login to the web interface after you create the nagiosadmin user.
htpasswd c htpasswd.users nagiosadmin New password: Retype new password: Adding password for user nagiosadmin
Now login to the web interface with http://ip_address/nagios
Configuration FilesThe configuration files necessary for making modifications to Nagios are found in /usr/local/nagios/etc/objects if Nagios has been installed by source. However, configuration files do not need to be located there. The location of the
Copyright by Nagios Enterprises, LLC Cannot be reproduced without written permission. P.O. Box 8154, Saint Paul, MN 55108

Chapter 3: Configuration 13
configuration files are actually determined by nagios.cfg.
This example is a reference to a configuration file “cfg_file”. These are defaults but can be changed by altering the path and making the files readable by nagios.
cfg_file=/usr/local/nagios/etc/objects/commands.cfgcfg_file=/usr/local/nagios/etc/objects/contacts.cfgcfg_file=/usr/local/nagios/etc/objects/timeperiods.cfgcfg_file=/usr/local/nagios/etc/objects/templates.cfg
Configuration directories can also have the same changes applied by altering the path. These default locations are commented out but illustrate that configuration files could be placed in these or newly created directories as long as the path is entered into the nagios.cfg file.
#cfg_dir=/usr/local/nagios/etc/servers#cfg_dir=/usr/local/nagios/etc/printers#cfg_dir=/usr/local/nagios/etc/switches#cfg_dir=/usr/local/nagios/etc/routers
The nagios.cfg file determines the location of the configuration files and can be modified to fit any situation.
The content of the configuration files is also an option. For example, the contacts.cfg generally contains the contacts for Nagios. However, a contact could be added to any configuration file.
cfg_file=/usr/local/nagios/etc/objects/contacts.cfg
Nagios is able to determine the information that is placed in any configuration file so it is highly customizable. For example, some administrators may place all windows servers on one file, while others may want to create a directory and have a single file for each server. As long as you place the path to the configuration files in the nagios.cfg and give the nagios user access to the configuration files it will all work.
Eliminating the HTTP ErrorWhen you set up the Nagios server and either review your log files in /var/log/nagios/nagios.log or review the web interface you may initially see an error related to the web server. The error is related to the fact that you do not have a an index.html file that exists. Note: If you do not see the error it is because you have the necessary files so you can skip this step. Here is what it will look like in the log.
WARNING: HTTP/1.1 403 Forbidden 5240 bytes in 0.001 second response time Sep 26 10:00:18 nagios nagios: SERVICE ALERT: localhost;HTTP;WARNING;HARD;4;HTTP
You can easily eliminate the error by creating an index.html file. Create a simple HTML.
vi /var/www/html/index.html
<HTML><BODY>
Copyright by Nagios Enterprises, LLC Cannot be reproduced without written permission. P.O. Box 8154, Saint Paul, MN 55108

Chapter 3: Configuration 14
Nagios Server</BODY></HTML>
chmod 755 /var/www/html/index.htmlchown apache:apache /var/www/html/index.html
Nagios Check TriangleWhen a service check is created, remember that all plugins with Nagios will require three elements to be configured. There must be a host definition, a service definition and a command definition. Think of it as a triangle each time you want to use a plugin.
These three definitions may be located in three separate files, hosts.cfg, services.cfg and commands.cfg. You may need to create hosts.cfg and services.cfg as they are not created by default. As mentioned previously, Nagios is flexible so hosts, service and command information can be placed in file names and locations of your choice as long as the path is added to the nagios.cfg.
These files must be located in:
/usr/local/nagios/etc/objects
Host DefintionNagios needs to know an IP Address of the host to be checked. This is configured in the hosts.cfg file, typically. The hosts.cfg file does not exist initially so you will need to create it. In this example the host_name is “win2008” and it is tied to the address “192.168.3.114”. This is the information Nagios must have in order to understand a host.
define host{ use windowsserver host_name win2008 alias Windows Server address 192.168.3.114 }
Copyright by Nagios Enterprises, LLC Cannot be reproduced without written permission. P.O. Box 8154, Saint Paul, MN 55108

Chapter 3: Configuration 15
Service DefinitionThe second part of the triangle is the service definition. Nagios needs to know what service you want to check, so that service or plugin must be defined. In this example the host “win2008”, which Nagios knows now is tied to the IP Address 192.168.3.114, is being checked with the ping plugin. So you can see the host_name determines which host the plugin acts upon and then the service_description is really the text that shows up in the web interface. The check_command, defines the parameters of the plugin. Here you can see that “check_ping” is the plugin and it is followed by two different sections of options divided by “!”. The first section, “60.0,5%”, provides a WARNING level if packets are taking longer than 60 milliseconds or if there is greater than a 5% loss of packets when the ping command is performed. The second section is the CRITICAL level where a CRITICAL state will be created if packets take longer than 100 milliseconds or if there is more than 10% packet loss.
define service{ use genericservice host_name win2008 service_description Ping check_command check_ping!60.0,5%!100.0,10% }
Command DefinitionThe command definitions are typically located in the commands.cfg file which is created by default in the objects directory. Many commands are already defined so you do not have to do anything with those. The check_ping command is one example that has been defined. The command_name, “check_ping”, is what is part of the service definition. The command_line specifically defines where the plugin is located with the “$USER1$ macro. This is equal to saying that the plugin check_ping is located in /usr/local/nagios/libexec (if you compiled). The other 4 options include the host, using the $HOSTADDRESS$ macro, a warning level (w) using the $ARG1$ macro, the critical level (c) using the $ARG2$ macro and the number of pings to use by default (p 5).
# 'check_ping' command definition define command{ command_name check_ping command_line $USER1$/check_ping H $HOSTADDRESS$ w $ARG1$ c $ARG2$ p 5 }
In each of the elements of the Nagios triangle you can see the importance of the term “definition” as each element must be clearly defined and each element is dependent upon the other definitions.
Review File LocationsThere are a number of files that you should review, both their location and their content. It is important that you review these because if you change a file location you may have to modify a number of additional files that depend on that location.
Main Configuration FileThe main configuration file for nagios is /usr/local/nagios/etc/nagios.cfg (RPM repository /etc/nagios/nagios.cfg). This is the file that contains paths to the other configuration files.
Copyright by Nagios Enterprises, LLC Cannot be reproduced without written permission. P.O. Box 8154, Saint Paul, MN 55108
Chapter 3: Configuration 16
Configuration DirectoryThe directory /usr/local/nagios/etc/objects (RPM repository /etc/nagios/objects) contains much of the information needed for modify objects.
commands.cfg contacts.cfg localhost.cfg printer.cfg switch.cfg templates.cfg timeperiods.cfg windows.cfg
Review the contents of each of these files. If you change the name of any you will need to make changes to at least the nagios.cfg, possibly others.
Log FileThe main Nagios log is located at /usr/local/nagios/var/nagios.log. This location is specified in the nagios.cfg file. This file should be the first place an administrator looks to find indications of problems. The log file is automatically rotated and the old log files are created in the /usr/local/nagios/var/archives directory. As you can see they are rotated daily.
rwrwr 1 nagios nagios 2.0M Apr 27 23:59 nagios0428201200.logrwrwr 1 nagios nagios 32K Apr 28 2011 nagios0429201100.log
Resource File/usr/local/nagios/etc/resource.cfg (RPM repository /etc/nagios/resource.cfg)
Plugins and CGIsThe scripts for plugins and the cgi files that provide data for the web interface are found here at /usr/local/nagios/libexec (RPM repository /usr/lib/nagios/plugins).
Review the available plugins that you may want to use.
Apache Web InterfaceThe web interface contains the settings necessary for the Internet access. The stylesheets provides css files that can be used to modify the settings for the web interface. These are found in /usr/local/nagios/share/stylesheets (RPM repsoitory /usr/share/nagios/stylesheets). You will also find the images for the web interface in the images directory and the contexthelp will contain the help files that you can modify. Everything that you need to modify the way it looks is found here.
/usr/local/nagios/share/stylesheetscontexthelp docs images index.html main.html media robots.txt side.html ssi stylesheets
Apache Server ModificationsNagios will need to set up a directory that requires authentication and some modifications to the cgiscripts. These changes will be found in a file located in the /etc/httpd/conf.d directory called nagios.conf. Here you can see listed the ScriptAlias so nagios can use cgi scripts and the directory for authentication. Note that if you want to change the database name for the web interface users you can modify the name “htpasswd.users” and be sure to use the exact name in /usr/local/nagios/etc (RPM repository /etc/nagios) when you create the database.
Copyright by Nagios Enterprises, LLC Cannot be reproduced without written permission. P.O. Box 8154, Saint Paul, MN 55108

Chapter 3: Configuration 17
That covers the basic file locations, be sure to review these as they will be very important for your system development. Now review the paths for different installation methods in the following chart.
NAGIOS Program Location Configuration File Plugins
Compile /usr/local/nagios/bin/nagios /usr/local/nagios/etc/nagios.cfg /usr/local/nagios/libexec
CentOS /usr/bin/nagios /etc/nagios/nagios.cfg /usr/lib/nagios/plugins
Debian/Ubuntu /usr/bin/nagios3 /etc/nagios3/nagios.cfg /usr/lib/nagios/plugins
NRPE Program Location Configuration File
Compile /usr/local/nagios/bin/nrpe /usr/local/nagios/etc/nrpe.cfg /usr/local/nagios/libexec
CentOS /usr/sbin/nrpe /etc/nagios/nrpe.cfg /usr/lib/nagios/plugins
Debian/Ubuntu /usr/sbin/nrpe /etc/nagios/nrpe.cfg /usr/lib/nagios/plugins
NSCA Program Location Configuration File
compile /usr/local/nagios/bin/nsca /usr/local/nagios/etc/nsca.cfg
CentOS /usr/sbin/nsca /etc/nagios/nsca.cfg
Debian/Ubuntu
WEB Web Pages cgi Configuration cgi Files
Compile /usr/local/nagios/share /usr/local/nagios/etc/cgi.cfg
CentOS /usr/share/nagios /etc/nagios/cgi.cfg /usr/lib/nagios/cgi
Debian/Ubuntu /etc/nagios3/cgi.cfg
Web Server Program Location Web Server Configuration Nagios Web Config
CentOS /usr/sbin/httpd /etc/httpd/conf/httpd.conf /etc/httpd/conf.d/nagios.cfg
Debian/Ubuntu /usr/sbin/apache2 /etc/apache2/apache2.conf /etc/nagios3/apache2.conf
htpasswd Database
Compile /usr/local/nagios/etc
CentOS /etc/nagios
Debian/Ubuntu /etc/nagios3/
Copyright by Nagios Enterprises, LLC Cannot be reproduced without written permission. P.O. Box 8154, Saint Paul, MN 55108

Chapter 3: Configuration 18
Network AddressingNagios supports IPV4, IPV6 and MAC addressing. Each of these can be used in service checks for a host. Nagios does not directly interpret whether an address is IPv4, IPv6 or a MAC address so you can use any of these options, they are simply passed using the $HOSTADDRESS$ macro. Of course, if the plugin you select does not support a particular address type it will not work.
What this means for Nagios One of the implications of IPv6 and the implementation of it world wide is that from now on administrators will have to take it into consideration as they build and monitor networks as some locations will push IPv6 into use sooner rather than later. Many of the plugins that are used for Nagios already have built in features for using either IPv4 or IPv6. In the example below you can see that using the ping command to check on a google server, one of those implementing IPv6 more rapidly than others. If you do not designate a preference the checks default to IPv4, use the “4” for IPv4 or use “6” for IPv6.
define host{ use linuxserver host_name google alias Google address 74.125.53.104 } define service{ use genericservice host_name google service_description Ping Default check_command check_ping!60.0,5%!100.0,10% } define service{ use genericservice host_name google service_description Ping IPV4 check_command check_ping!60.0,5%!100.0,10%!4 } define service{ use genericservice host_name google service_description Ping IPV6 check_command check_ping!60.0,5%!100.0,10%!6 }
Going forward Nagios administrators should be thinking about making the necessary changes to implicitly indicate version 4 or version 6 and be ready to move to version 6 as soon as possible.
Implementing ChangesAny time that changes have been made to the Nagios configuration the Nagios application must be restarted.
service nagios restart
Changes will not be implemented until this has been done.
Copyright by Nagios Enterprises, LLC Cannot be reproduced without written permission. P.O. Box 8154, Saint Paul, MN 55108

Chapter 3: Configuration 19
ObjectsAn object in Nagios is a unit of information, such as a host, service, contact, group, timeperiod, etc. Since these units or objects represent text files, they can inherit properties from other units or objects.
Object Types It is important to have a basic understanding of object types and how they are related.
Hosts * physical devices on a network * have an IP Address or MAC Address * usually have services associated with them * may have parent/child relationships representing topology
HostGroups * contain one or more hosts used to view similar hosts
Services * monitor internal attributes of a host (CPU, memory, disk space, etc.) * monitor services on a host (HTTP, POP3, FTP, etc.) * monitor settings associated with host (DNS settings, etc.)
ServiceGroups * contain one or more services which are related
Contacts * contain a notification method (email, pager, cell phone) * receive notifications for devices and services
ContactGroups * one or more contacts which enables similar grouping for notification
Timeperiods * time host or service is monitored
Commands* host and service check definitions * notification definitions * event handler definitions
Before discussing how to create object inheritance it is important to understand the foundation of groups including hostgroups, servicegroups and contactgroups.
Host GroupsOften you will want to create a group of devices that have similar monitoring needs. The hostgroup allows you to then
Copyright by Nagios Enterprises, LLC Cannot be reproduced without written permission. P.O. Box 8154, Saint Paul, MN 55108

Chapter 3: Configuration 20
create service checks that are tied to all devices within the hostgroup. Specifically what this means is that the services defined for the group will be available for all hosts in the group without making individual configurations. Nagios will also list the hosts together in the web interface if they are in the same hostgroup.
Define Each HostIn order to set up a hostgroup, each server must be defined as a host. In this example, 3 Ubuntu servers are defined.
define host{ use linuxserver host_name ub alias Ubuntu Server address 192.168.5.180 } define host{ use linuxserver host_name ub1 alias Ubuntu Server address 192.168.5.181 } define host{ use linuxserver host_name ub3 alias Ubuntu Server address 192.168.5.183 }
Define Host GroupsCreate hostgroups.cfg in the objects directory and create an entry in nagios.cfg to the location of hostgroups.cfg.
cfg_file=/usr/local/nagios/etc/objects/hostgroup.cfg
Define the hostgroup, in this example the hostgroup ubuntu_servers is defined with the three members that were defined in hosts.cfg file.
define hostgroup { hostgroup_name ubuntu_servers alias Ubuntu Servers members ub,ub1,ub3 }
Define Services for the GroupThe advantage of the hostgroup is that you can create one service definition and add that to the whole group of servers. This is exactly the same as a regular service definition except you use hostgroup_name instead of host.
define service{ use genericservice hostgroup_name ubuntu_servers
Copyright by Nagios Enterprises, LLC Cannot be reproduced without written permission. P.O. Box 8154, Saint Paul, MN 55108

Chapter 3: Configuration 21
service_description Ping check_command check_ping!60.0,5%!100.0,10% } define service{ use genericservice hostgroup_name ubuntu_servers service_description SSH Server check_command check_tcp!22 } define service{ use genericservice hostgroup_name ubuntu_servers service_description Web Server check_command check_tcp!80 }
Now if you go to the web interface and select “Hostgroups” you will have a group of servers that are all related with the same service checks.
If you want to add individual service checks for one of the servers in the hostgroup that would be done as a regular service definition using the host.
Copyright by Nagios Enterprises, LLC Cannot be reproduced without written permission. P.O. Box 8154, Saint Paul, MN 55108
Chapter 3: Configuration 22
Service GroupsNagios combines devices that are checking the same services into group in order to make the set up faster and more efficient. This allows an administrator to group machines based on services. Each of these services must be configured as service checks for each host. Once that is complete the services may be grouped in the servicegroups.cfg. The other major advantage is that the administrator may manage all those in the service group with servicegroup commands in the web interface.
You will need to create a file called servicegroups.cfg and put an entry in nagios.cfg to indicate where it is. Note the entries are in pairs (first host, then service) “host,service, host2,service2”.
define servicegroup{ servicegroup_name web alias Web Servers members ub, HTTP ,ub1, HTTP ,ub3, HTTP }
Define each host with a normal service check.
define service{ use genericservice host_name ub service_description HTTP check_command check_http } define service{ use genericservice host_name ub1 service_description HTTP check_command check_http } define service{ use genericservice host_name ub3 service_description HTTP check_command check_http }
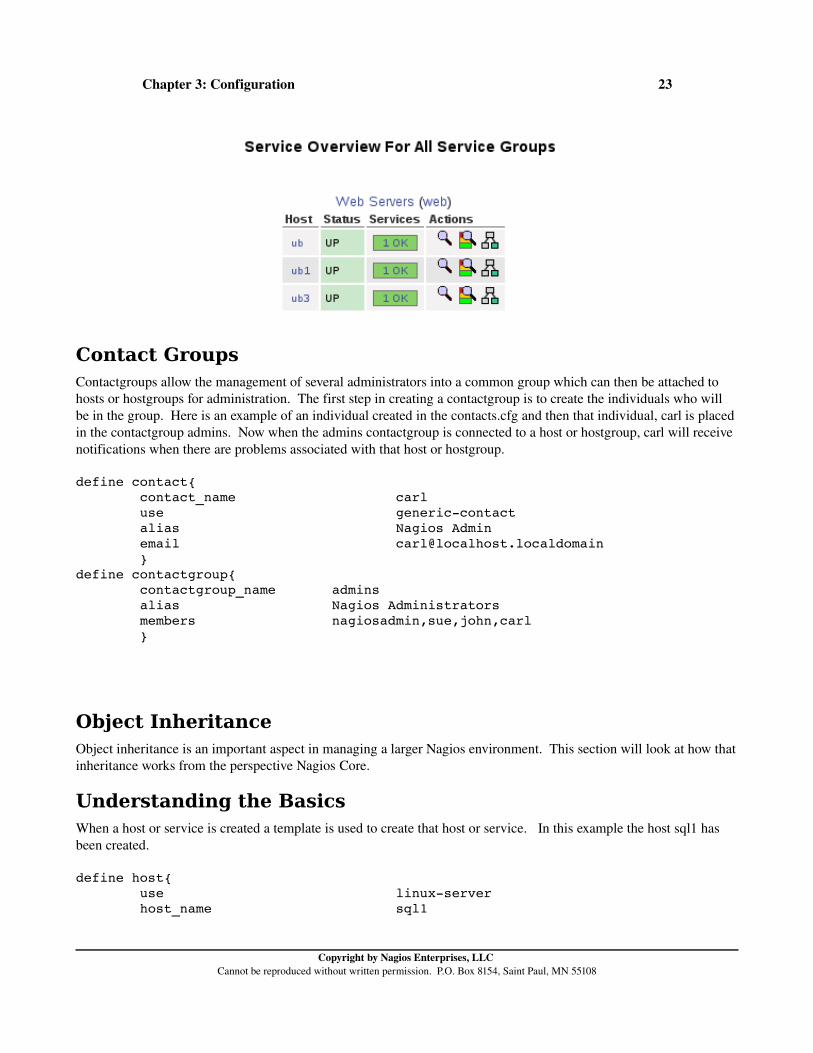
This now allows the administrator to group these services and view them as a group when “ServiceGroups” is selected in the web interface.
Copyright by Nagios Enterprises, LLC Cannot be reproduced without written permission. P.O. Box 8154, Saint Paul, MN 55108
Chapter 3: Configuration 23
Contact GroupsContactgroups allow the management of several administrators into a common group which can then be attached to hosts or hostgroups for administration. The first step in creating a contactgroup is to create the individuals who will be in the group. Here is an example of an individual created in the contacts.cfg and then that individual, carl is placed in the contactgroup admins. Now when the admins contactgroup is connected to a host or hostgroup, carl will receive notifications when there are problems associated with that host or hostgroup.
define contact{ contact_name carl use genericcontact alias Nagios Admin email [email protected] }define contactgroup{ contactgroup_name admins alias Nagios Administrators members nagiosadmin,sue,john,carl }
Object Inheritance Object inheritance is an important aspect in managing a larger Nagios environment. This section will look at how that inheritance works from the perspective Nagios Core.
Understanding the BasicsWhen a host or service is created a template is used to create that host or service. In this example the host sql1 has been created.
define host{ use linuxserver host_name sql1
Copyright by Nagios Enterprises, LLC Cannot be reproduced without written permission. P.O. Box 8154, Saint Paul, MN 55108
Chapter 3: Configuration 24
alias MySQL Server_1 address 192.168.5.197 }
Three variables determine object inheritance; name, use and register. The “name” variable is the text string that labels the template. The “use” variable lists the name of a template where settings can be pulled from thus creating inheritance. The “register” variable determines whether a variable should be registered with Nagios.
define someobjecttype{ objectspecific variables ... name template_name use name_of_template_to_use register [0/1] }
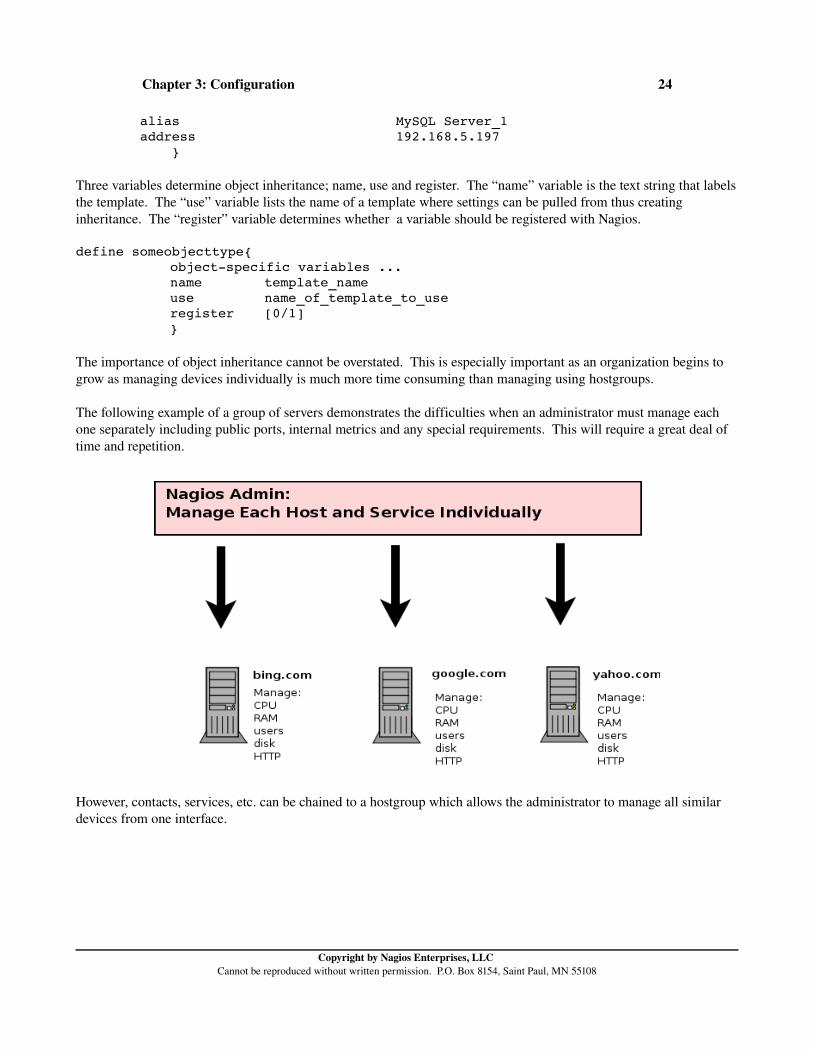
The importance of object inheritance cannot be overstated. This is especially important as an organization begins to grow as managing devices individually is much more time consuming than managing using hostgroups.
The following example of a group of servers demonstrates the difficulties when an administrator must manage each one separately including public ports, internal metrics and any special requirements. This will require a great deal of time and repetition.
However, contacts, services, etc. can be chained to a hostgroup which allows the administrator to manage all similar devices from one interface.
Copyright by Nagios Enterprises, LLC Cannot be reproduced without written permission. P.O. Box 8154, Saint Paul, MN 55108
Chapter 3: Configuration 25
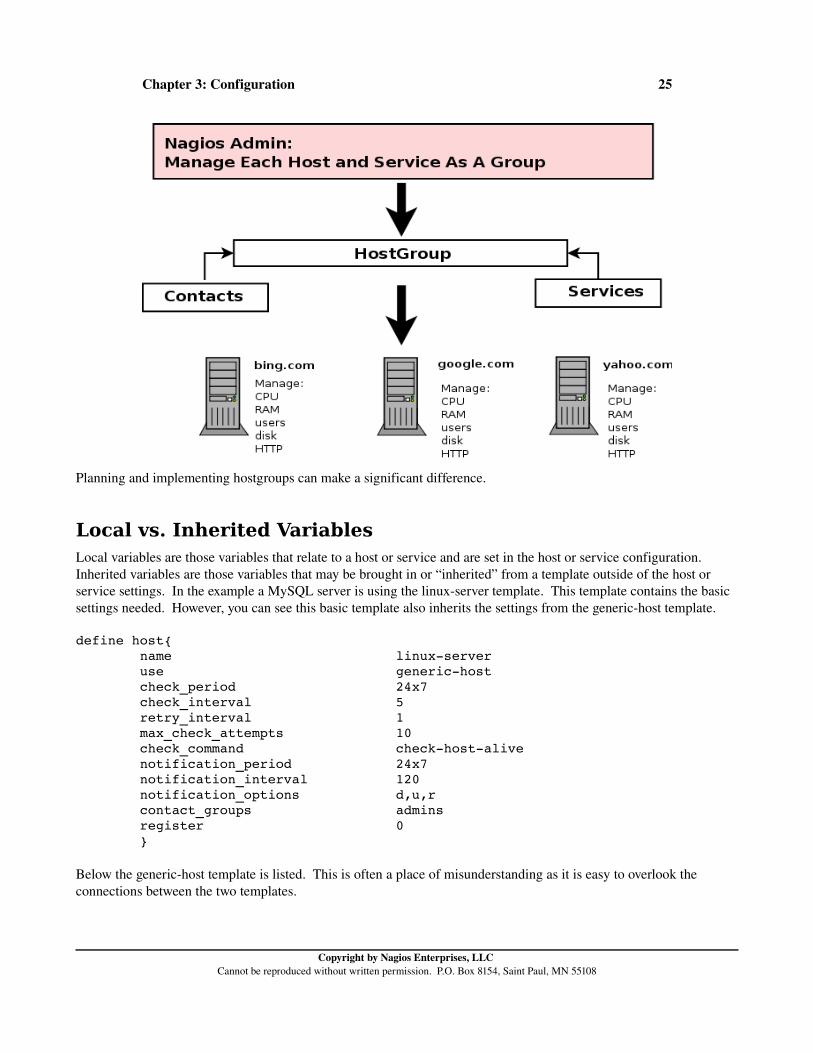
Planning and implementing hostgroups can make a significant difference.
Local vs. Inherited VariablesLocal variables are those variables that relate to a host or service and are set in the host or service configuration. Inherited variables are those variables that may be brought in or “inherited” from a template outside of the host or service settings. In the example a MySQL server is using the linuxserver template. This template contains the basic settings needed. However, you can see this basic template also inherits the settings from the generichost template.
define host{ name linuxserver use generichost check_period 24x7 check_interval 5 retry_interval 1 max_check_attempts 10 check_command checkhostalive notification_period 24x7 notification_interval 120 notification_options d,u,r contact_groups admins register 0 }
Below the generichost template is listed. This is often a place of misunderstanding as it is easy to overlook the connections between the two templates.
Copyright by Nagios Enterprises, LLC Cannot be reproduced without written permission. P.O. Box 8154, Saint Paul, MN 55108

Chapter 3: Configuration 26
define host{ name generichost notifications_enabled 1 event_handler_enabled 1 flap_detection_enabled 1 failure_prediction_enabled 1 process_perf_data 1 retain_status_information 1 retain_nonstatus_information 1 notification_period 24x7 register 0 }
Local variables always take precedence over inherited variables. So in this example if you changed the linuxserver template to:notification_period workhours
The outcome will be workhours even though the inherited value is 24x7 from the generichost template.
notification_period 24x7
The workhours setting takes precedence as host definition uses linuxserver as the local template.
define host{ use linuxserver host_name sql1 alias MySQL Server_1 address 192.168.5.197 }
Often it is easier to work with templates by creating a new template for a group of servers which will be similar. Here is a base template that will be used for MySQL servers called sqlserver.
define host{ name sqlserver check_period 24x7 check_interval 15 retry_interval 1 max_check_attempts 5 check_command checkhostalive notification_period 24x7 notification_interval 120 notification_options d,u,r contact_groups admins
notifications_enabled 1 event_handler_enabled 1 flap_detection_enabled 1 failure_prediction_enabled 1
Copyright by Nagios Enterprises, LLC Cannot be reproduced without written permission. P.O. Box 8154, Saint Paul, MN 55108

Chapter 3: Configuration 27
process_perf_data 1 retain_status_information 1 retain_nonstatus_information 1 register 0 }
Change the base template to sqlserver.
define host{ use sqlserver host_name sql1 alias MySQL Server_1 address 192.168.5.197 }
That should be reflected when you go to the web interface System/Configuration and choose hosts.
ChainingOnce you have a base template you can chain other templates to it. If you create a new template that reflects changes you may want for Red Hat servers, not necessarily MySQL servers. Three changes are seen here and are highlighted.
define host{ name rhelserver check_period 24x7 max_check_attempts 5 check_command checkhostalive notification_period 24x7 notification_options d,u,r contact_groups rheladmins icon_image redhat.png statusmap_image redhat.png notifications_enabled 1 retain_nonstatus_information 1 register 0 }
In order to chain that template to the existing template, add a comma and append the template to the use line.
define host{ use sqlserver,rhelserver host_name sql1 alias MySQL Server_1 address 192.168.5.197
Copyright by Nagios Enterprises, LLC Cannot be reproduced without written permission. P.O. Box 8154, Saint Paul, MN 55108

Chapter 3: Configuration 28
}
Be sure to also create the contactgroup rheladmins.
define contactgroup{ contactgroup_name rhel_admins alias nagios group members tom }
Restart Nagios and check the changes.
The image has been inherited as you can see in the example.
However, the contactgroup is not inherited because of the principle that local variables take precedence over inherited variables, meaning the admins contactgroup was already in place.
If you wanted to use both contact groups you would have to chain that feature.
define host{ use sqlserver,rhelserver host_name sql1 alias MySQL Server_1 address 192.168.5.197 contact_groups admins,rheladmins }
So in the example you are chaining the templates and contact_groups used.
Precedence in Multiple SourcesCreate another template used for debian servers that use MySQL. The primary difference being the contact_groups and icons used.
Copyright by Nagios Enterprises, LLC Cannot be reproduced without written permission. P.O. Box 8154, Saint Paul, MN 55108

Chapter 3: Configuration 29
define host{ name debianserver check_period 24x7 max_check_attempts 5 check_command checkhostalive notification_period 24x7 notification_options d,u,r contact_groups debianadmins icon_image debian.png statusmap_image debian.png notifications_enabled 1 retain_nonstatus_information 1 register 0 }
define host{ use sqlserver,debianserver,rhelserver host_name sql1 alias MySQL Server_1 address 192.168.5.197 contact_groups admins }
Now the debian image shows in the map because of the order placed in the host definition. This demonstrates that inheritance is influenced by order as well.
Incomplete Object Definitions Object definitions do not have to be complete to be used. An incomplete object definition can be used by another template to create chaining or it could be used for a specific purpose for some hosts, for example.
Creating Custom VariablesWhen custom host variables are used the first step is to create the template for the custom variable. In this example two variables have been added to this template (snmpvar), the SNMP community and the SNMP version. Note that the values need to be entered as the variable name when it is inserted and it is important that the variable name be started with a “_” so it does not conflict with other macros. The variable name will be converted into upper case before it is used so it may be easier to understand the function by making these upper case.
define host{ name snmpvar
_snmp_community public _snmp_version 2c
register 0 }
The next step is to add the variable to the host. Here you can see chaining of three templates.
Copyright by Nagios Enterprises, LLC Cannot be reproduced without written permission. P.O. Box 8154, Saint Paul, MN 55108
Chapter 3: Configuration 30
define host{ use sqlserver,rhelserver,snmpvar host_name sql1 alias MySQL Server_1 address 192.168.5.197 contact_groups admins }
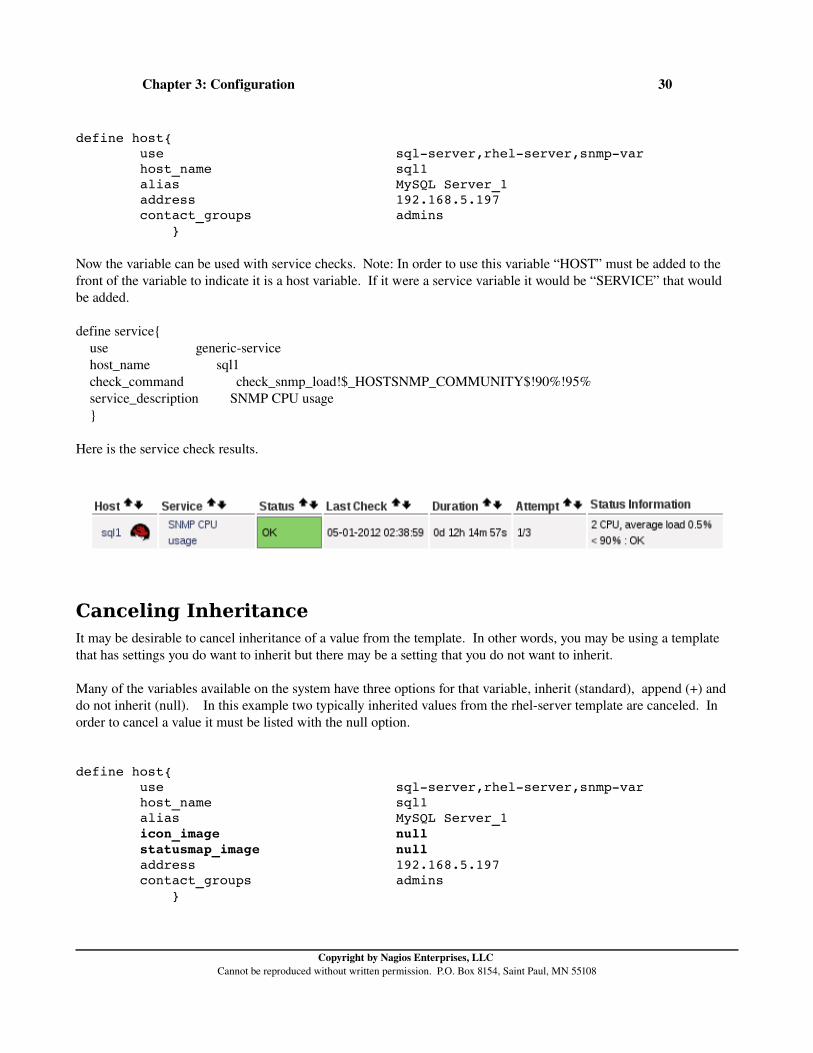
Now the variable can be used with service checks. Note: In order to use this variable “HOST” must be added to the front of the variable to indicate it is a host variable. If it were a service variable it would be “SERVICE” that would be added.
define service{ use genericservice host_name sql1 check_command check_snmp_load!$_HOSTSNMP_COMMUNITY$!90%!95% service_description SNMP CPU usage }
Here is the service check results.
Canceling InheritanceIt may be desirable to cancel inheritance of a value from the template. In other words, you may be using a template that has settings you do want to inherit but there may be a setting that you do not want to inherit.
Many of the variables available on the system have three options for that variable, inherit (standard), append (+) and do not inherit (null). In this example two typically inherited values from the rhelserver template are canceled. In order to cancel a value it must be listed with the null option.
define host{ use sqlserver,rhelserver,snmpvar host_name sql1 alias MySQL Server_1 icon_image null statusmap_image null address 192.168.5.197 contact_groups admins }
Copyright by Nagios Enterprises, LLC Cannot be reproduced without written permission. P.O. Box 8154, Saint Paul, MN 55108

Chapter 3: Configuration 31
Now the null has canceled the inheritance of the redhat.png icon.
Additive InheritanceAdditive inheritance appends the variable to an existing variable. In this example, the admins is a local variable for contact_groups so the contact_groups value of rheladmins will not be added based on the fact the local value exists. However, if the template is modified the rheladmins can be added to the local value by using a “+”.
define host{ use sqlserver,rhelserver,snmpvar host_name sql1 alias MySQL Server_1 address 192.168.5.197 contact_groups +rheladmins }Now both contact_groups will be used.
Using HostgroupsHost groups allow you to group hosts in a logical manner, making it easier for users to get a quick view of their network infrastructure. More importantly however, hostgroups provide a way to leverage time and energy by managing a group of devices which are similar more efficiently.
Step #1: Create the Host In this example a MySQL server is created and when that is done the server will use two additional templates that have been configured already as well as use additive inheritance to add to the contact_groups. Immediately the administrator is saving time and testing as those previously created templates have proven to provide what is needed.
define host{ use sqlserver,rhelserver,snmpvar host_name sql2 alias MySQL Server_1 address 192.168.5.198 contact_groups +rheladmins }
Step #2: Create a HostgroupA hostgroup needs to be created to help in the management process. In this example a hostgroup for MySQL servers has been created. This groups need to be devices that will have similar needs in terms of contacts, service checks, etc.
define hostgroup { hostgroup_name mysql_servers
Copyright by Nagios Enterprises, LLC Cannot be reproduced without written permission. P.O. Box 8154, Saint Paul, MN 55108

Chapter 3: Configuration 32
alias MySQL Servers members sql1,sql2}
Step #3: Roll Out Service Checks Using HostgroupsNow the real power can be seen when the service checks typically required for all MySQL servers are rolled out to all devices in the group using the hostgroup. Here is an example of rolling out a service check for CPU to all MySQL servers at one time. This prevents the administrator having to touch each box to make the changes.
define service{ use genericservice hostgroup_name mysql_servers check_command check_snmp_load!$_HOSTSNMP_COMMUNITY$!90%!95% service_description SNMP CPU usage }
This diagram illustrates that the hostgroup can inherit services and contact information but not host template information.
Copyright by Nagios Enterprises, LLC Cannot be reproduced without written permission. P.O. Box 8154, Saint Paul, MN 55108

Chapter 3: Configuration 33
TemplatesTemplates allow Nagios to pass configuration settings to multiple objects. The default templates are created and stored in /usr/local/nagios/etc/objects/templates.cfg.
Here is an example. Required parameters are highlighted.
define host{ name generichost notifications_enabled 1 event_handler_enabled 1 flap_detection_enabled 1 failure_prediction_enabled 1 process_perf_data 1
Copyright by Nagios Enterprises, LLC Cannot be reproduced without written permission. P.O. Box 8154, Saint Paul, MN 55108
Chapter 3: Configuration 34
retain_status_information 1 retain_nonstatus_information 1 notification_period 24x7 register 0 ;DONT REGISTER DEFINITION }
The register parameter determines if this will be used as a host definition or as a template. If the “0” is used it will only be used as a template.
When a host definition is created the “use” directive indicates the template to be applied. In this example, the host centos is using the “linuxserver” template. Multiple hosts could use this template “linuxserver”.
define host{ use linuxserver host_name centos alias Company Server address 192.168.5.1 }
Modify TimeperiodsTimeperiods provide control of monitoring and alerting options and the settings are found in a template. Typically a 24 hour day is used so keep that in mind when configuring various times.
define timeperiod{ name usholidays timeperiod_name usholidays alias U.S. Holidays january 1 00:0000:00 ; New Years monday 1 may 00:0000:00 ; Memorial Day (last Monday) july 4 00:0000:00 ; Independence Day monday 1 september 00:0000:00 ; Labor Day (first Monday) thursday 1 november 00:0000:00 ; Thanksgiving (last Thursday) december 25 00:0000:00 ; Christmas }
The numbers indicate various options.
This represents a specific date in December.december 25 00:0000:00 ; Christmas
The “1” indicates the last Monday in May.monday 1 may 00:0000:00
The “1” indicates the first Monday in September.monday 1 september 00:0000:00
Here the “day” indicates a day in the month and the “3” indicates the third day.
Copyright by Nagios Enterprises, LLC Cannot be reproduced without written permission. P.O. Box 8154, Saint Paul, MN 55108

Chapter 3: Configuration 35
day 3 9:0011:00
Timeperiod modifications allow you to determine when a host or service check will occur using the check_period option.
Illegal Object Name Characters The nagios.cfg contains a line that lists illegal characters for object names. This can sometimes be a frustration if you do not recognize these characters initially and try to create or import a large number of hosts with illegal characters.
illegal_object_name_chars=`~!$%^&*|'"<>?,()=
Security RisksNagios can pose security risks to organizations which do not configure Nagios properly. Because the Nagios server is able to execute commands on the hosts that it monitors, special care should go into protecting the Nagios server. Here are a few of the items that need to be considered:
* use a firewall on the Nagios server to limit access to administrators and client machines that will be sending passive check data* encrypt communication to protect data that will be over a public network* restrict user privileges to only what is required to administer the Nagios server* use a physical box or virtual machine dedicated to Nagios* monitor changes on the Nagios server* tighten security on the clients that Nagios will monitor
Plugin UseNagios provides numerous methods to monitor a device whether that be with plugins or scripts which access clients using public ports, NRPE, SSH NSClient++, SNMP or even accepting passive checks from clients with NSCA or NRDP. Monitoring choices are based on network protocol requirements or administrative skills in configuring the options for monitoring.
Plugins are used to gather information about hosts and services and then return that information to the Nagios server. Nagios uses plugins which can be scripts or compiled executables that can be used to check services and hosts on your network. Plugins can be written in C, C++, PHP, Python, Ruby, Java, shell scripts, etc. Nagios is very flexible in using these different languages. Typically, though this is not required, plugins start with “check_” and then the name of the plugin. For example, check_tcp. Each plugin will evaluate the situation and return a status value to Nagios. There are four status values that Nagios interprets.
0 OK the status is as expected 1 WARNING a warning limit has been reached 2 CRITICAL a critical limit has been reached 3 UNKNOWN the status is unknown, misconfiguration
Copyright by Nagios Enterprises, LLC Cannot be reproduced without written permission. P.O. Box 8154, Saint Paul, MN 55108
Chapter 3: Configuration 36
In order for Nagios to provide these four levels of status settings, warning and critical limits must be established. An important aspect of setting these limits is that each network will have different equipment and varying needs so these settings should reflect the individual network.
Plugins typically generate both data that is human readable and gets displayed in the web interface and it can also produce performance data that can create graphs, etc.There are many different plugins available. Each plugin must be configured specifically for the host and service you choose to evaluate. Plugins do not come in the nagios package but are provided in a separate package called nagiosplugins. You can download from these locations.
Nagios PluginsOfficial Nagios Plugins http://nagiosplugins.org/Nagios Plugin Downloads http://www.nagios.org/download/NagiosExchange http://exchange.nagios.org/
Currently the plugins provided in the nagiosplugins package provides about 80 plugins and another 80 in the contrib directory. This certainly provides you with adequate plugins to get started.
If you need to find out more information about a specific plugin you can use the “help” option:
./check_ping help check_ping v1.4.15 (nagiosplugins 1.4.15) Copyright (c) 1999 Ethan Galstad <[email protected]> Copyright (c) 20002007 Nagios Plugin Development Team
<nagiosplug[email protected]>
Use ping to check connection statistics for a remote host.
Usage: check_ping H <host_address> w <wrta>,<wpl>% c <crta>,<cpl>% [p packets] [t timeout] [4|6]
Options: h, help Print detailed help screen V, version Print version information 4, useipv4 Use IPv4 connection 6, useipv6 Use IPv6 connection H, hostname=HOST host to ping w, warning=THRESHOLD warning threshold pair c, critical=THRESHOLD critical threshold pair p, packets=INTEGER number of ICMP ECHO packets to send (Default: 5) L, link
Copyright by Nagios Enterprises, LLC Cannot be reproduced without written permission. P.O. Box 8154, Saint Paul, MN 55108

Chapter 3: Configuration 37
show HTML in the plugin output (obsoleted by urlize) t, timeout=INTEGER Seconds before connection times out (default: 10)
Web Interface The web interface of Nagios Core provides a menu on the left with specific details in the main body of the page which contains more clickable links to information.
The “Home” link provides access to the main page which provides the current version with a link to check on updates as well as links to training and certification options, news items tutorials and links to Nagios plugins at Nagios Exchange. This page will keep you up to date on the changes that happen with Nagios.
Event HandlersEvent handlers are options to use when the host or service changes between an OK state to an error state. An administrator may implement a “selfhealing” script which will repair a situation before anyone is notified. Now “selfhealing” of course is a stretch because situations that arise repeatedly need to be examined by an administrator and fixed properly.
There are several handler types that may be implemented; global service and host event handlers and host and service specific event handlers. If global event handlers are run of course they will run for all hosts and services. Typically
Copyright by Nagios Enterprises, LLC Cannot be reproduced without written permission. P.O. Box 8154, Saint Paul, MN 55108

Chapter 3: Configuration 38
organizations will select specific hosts or services to run event handlers on.
Event Handler for Nagios ServerThis example of setting up an event handler is performed on the localhost, or Nagios server. The goal is to restart the web interface if it fails. There are four elements to setting up an event handler; the service definition, the command definition; the script for the event handler and the permissions required.
The service is the typical check_http service definition but an additional line has been added for the event_handler. This file is the localhost.cfg file and the service shows that this is a servicespecific event handler. The event handler name must match that of the command definition.
define service{ use localservice host_name localhost service_description HTTP check_command check_http event_handler httpdrestart }
The commands.cfg contains definitions of commands and is where the definition for the event handler must be entered. This is an event handler for a service so these macros must be added after the script name:
$SERVICESTATE$ $SERVICESTATETYPE$ $SERVICEATTEMPT$
If it were a host these macros would be required:
$HOSTSTATE$ $HOSTSTATETYPE$ $HOSTATTEMPT$
Note the location and name of the event handler script. Your script name will vary.
define command{ command_name httpdrestart command_line $USER1$/eventhandlers/httpdrestart.sh $SERVICESTATE$ $SERVICESTATETYPE$ $SERVICEATTEMPT$ }
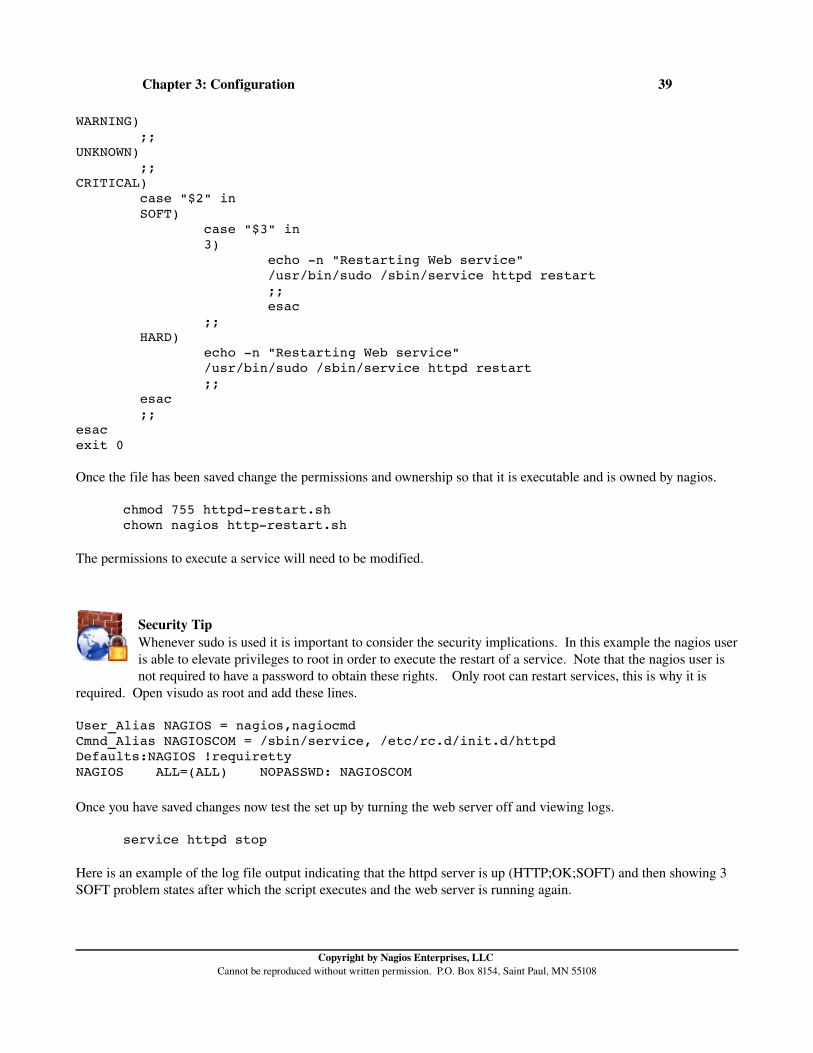
The event handler script in this example will attempt to restart the web server after 3 SOFT problem states and once again after the HARD state is reached if it has not been restarted. Paths for the commands indicated may change based on the Linux distro used so check paths with:
which sudowhich service
#!/bin/sh # Event Handler for Web Server on Nagios
case "$1" in OK) ;;
Copyright by Nagios Enterprises, LLC Cannot be reproduced without written permission. P.O. Box 8154, Saint Paul, MN 55108
Chapter 3: Configuration 39
WARNING) ;; UNKNOWN) ;; CRITICAL) case "$2" in SOFT) case "$3" in 3) echo n "Restarting Web service" /usr/bin/sudo /sbin/service httpd restart ;; esac ;; HARD) echo n "Restarting Web service" /usr/bin/sudo /sbin/service httpd restart ;; esac ;; esac exit 0
Once the file has been saved change the permissions and ownership so that it is executable and is owned by nagios.
chmod 755 httpdrestart.sh chown nagios httprestart.sh
The permissions to execute a service will need to be modified.
Security TipWhenever sudo is used it is important to consider the security implications. In this example the nagios user is able to elevate privileges to root in order to execute the restart of a service. Note that the nagios user is not required to have a password to obtain these rights. Only root can restart services, this is why it is
required. Open visudo as root and add these lines.
User_Alias NAGIOS = nagios,nagiocmdCmnd_Alias NAGIOSCOM = /sbin/service, /etc/rc.d/init.d/httpdDefaults:NAGIOS !requirettyNAGIOS ALL=(ALL) NOPASSWD: NAGIOSCOM
Once you have saved changes now test the set up by turning the web server off and viewing logs.
service httpd stop
Here is an example of the log file output indicating that the httpd server is up (HTTP;OK;SOFT) and then showing 3 SOFT problem states after which the script executes and the web server is running again.
Copyright by Nagios Enterprises, LLC Cannot be reproduced without written permission. P.O. Box 8154, Saint Paul, MN 55108

Chapter 3: Configuration 40
tail /var/log/nagios/nagios.logNov 21 06:59:18 nag2 nagios: SERVICE EVENT HANDLER: localhost;HTTP;OK;SOFT;4;httpdrestart Nov 21 07:04:13 nag2 nagios: SERVICE EVENT HANDLER: localhost;HTTP;CRITICAL;SOFT;1;httpdrestart Nov 21 07:05:16 nag2 nagios: SERVICE EVENT HANDLER: localhost;HTTP;CRITICAL;SOFT;2;httpdrestart Nov 21 07:06:22 nag2 nagios: SERVICE EVENT HANDLER: localhost;HTTP;CRITICAL;SOFT;3;httpdrestart
service httpd status httpd (pid 25826) is running...
Managing Nagios TimeThe correct time on a server is critical, especially for Nagios. Synchronized time with other servers is important to coordinate tasks and discover problems. One easy way to perform this task is to install ntp (Network Time Protocol) and then manually have the system check time once a day in order to manage time.
yum install y ntp
Manually update your time. Here you can see the system is off by 12 seconds so it will be corrected gradually with each check.
ntpdate pool.ntp.org 11 Mar 12:09:55 ntpdate[24725]: step time server 71.245.107.83 offset 10900.806712 sec 12 sec
Create a cron entry so that each day your system is brought up to date.crontab e
45 23 * * * /usr/sbin/ntpdate pool.ntp.org
Nagios Core BackUpBacking up all of the hard work you have completed with Nagios is an imperative. Most of the important information that is used for Nagios is located in the /usr/local/nagios directory. However, if you use additional addons this will make it more difficult to find all of the files you need. Here are some common directories that you may want to add:
/usr/local/pnp4nagios/usr/local/nagvis
You can also search for all files on the system that are owned by Nagios with:
find / user nagios
Nagios Core Backups with Flat Files
Copyright by Nagios Enterprises, LLC Cannot be reproduced without written permission. P.O. Box 8154, Saint Paul, MN 55108
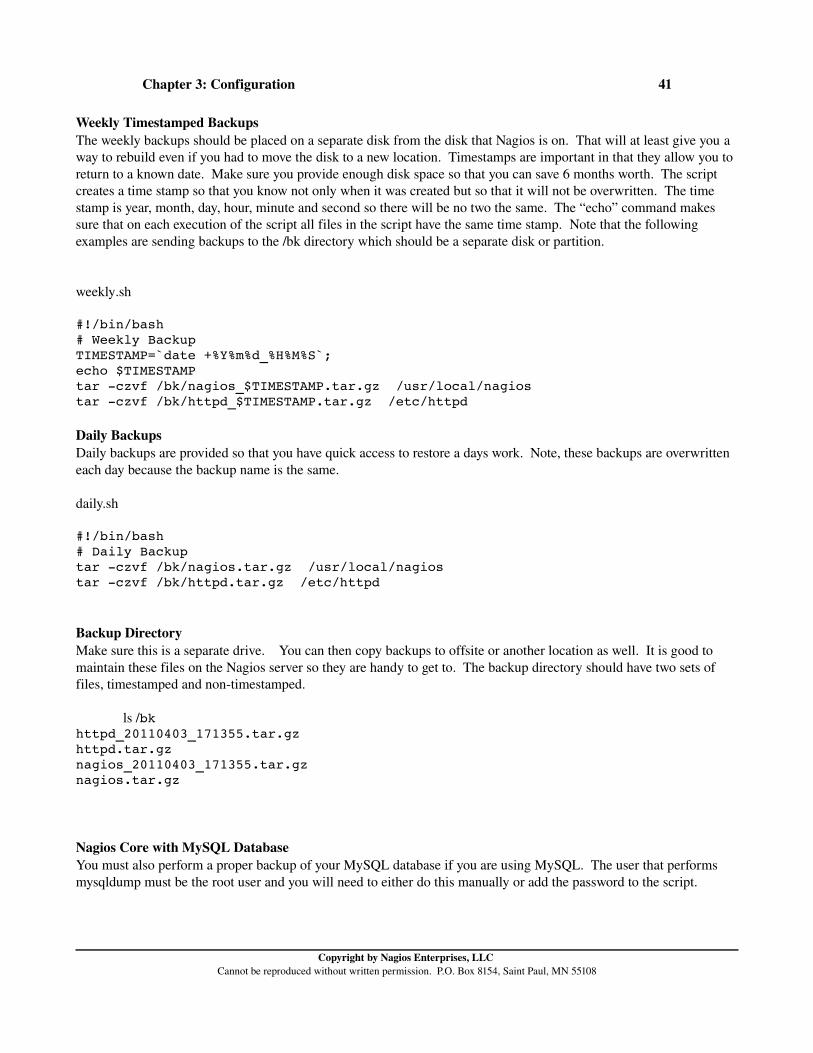
Chapter 3: Configuration 41
Weekly Timestamped BackupsThe weekly backups should be placed on a separate disk from the disk that Nagios is on. That will at least give you a way to rebuild even if you had to move the disk to a new location. Timestamps are important in that they allow you to return to a known date. Make sure you provide enough disk space so that you can save 6 months worth. The script creates a time stamp so that you know not only when it was created but so that it will not be overwritten. The time stamp is year, month, day, hour, minute and second so there will be no two the same. The “echo” command makes sure that on each execution of the script all files in the script have the same time stamp. Note that the following examples are sending backups to the /bk directory which should be a separate disk or partition.
weekly.sh
#!/bin/bash # Weekly Backup TIMESTAMP=`date +%Y%m%d_%H%M%S`; echo $TIMESTAMP tar czvf /bk/nagios_$TIMESTAMP.tar.gz /usr/local/nagios tar czvf /bk/httpd_$TIMESTAMP.tar.gz /etc/httpd
Daily BackupsDaily backups are provided so that you have quick access to restore a days work. Note, these backups are overwritten each day because the backup name is the same.
daily.sh
#!/bin/bash # Daily Backup tar czvf /bk/nagios.tar.gz /usr/local/nagios tar czvf /bk/httpd.tar.gz /etc/httpd
Backup DirectoryMake sure this is a separate drive. You can then copy backups to offsite or another location as well. It is good to maintain these files on the Nagios server so they are handy to get to. The backup directory should have two sets of files, timestamped and nontimestamped.
ls /bk httpd_20110403_171355.tar.gz httpd.tar.gz nagios_20110403_171355.tar.gz nagios.tar.gz
Nagios Core with MySQL DatabaseYou must also perform a proper backup of your MySQL database if you are using MySQL. The user that performs mysqldump must be the root user and you will need to either do this manually or add the password to the script.
Copyright by Nagios Enterprises, LLC Cannot be reproduced without written permission. P.O. Box 8154, Saint Paul, MN 55108

Chapter 3: Configuration 42
Weekly Timestamped Backups with MySQLweekly_mysql.sh
#!/bin/bash # Weekly Backup TIMESTAMP=`date +%Y%m%d_%H%M%S`; echo $TIMESTAMP tar czvf /bk/nagios_$TIMESTAMP.tar.gz /usr/local/nagios tar czvf /bk/httpd_$TIMESTAMP.tar.gz /etc/httpd mysqldump u root password=linux23 nagios > /bk/nagios_sql_$TIMESTAMP
Daily Backups with MySQLdaily_mysql.sh
#!/bin/bash # Daily Backup tar czvf /bk/nagios.tar.gz /usr/local/nagios tar czvf /bk/httpd.tar.gz /etc/httpd mysqldump u root password=linux23 nagios > /bk/nagios.sql
Restore BackupsIf you are going to use backups the actual backup is only half the story. You must practice restoring information that is backed up. When you restore tar files you must tell tar that since the files were created in reference to the “/” directory by using the “C /” option.
tar xzvf /bk/nagios.tar.gz C / tar xzvf /bk/httpd.tar.gz C /
Automatically BackUp It only makes sense to create cron jobs that make the backup process automatic. The tool to use for cronjobs is crontab. The first thing you need to verify is the location of the scripts you will use. This is especially important with the crontab is that you wan to use the full path for all scripts and commands.
Open a cronjob as root with:
crontab e
The “e” is for edit and it will open an empty file in CentOS. You will need to edit the file with vi so in order to add text you must use the “i” to enter edit mode.
cron Format
There are six fields that must be used.
1 minute 059, a between numbers means a range 130, a comma between numbers means individual 1,5,8 2 hour 023 3 day of month 031
Copyright by Nagios Enterprises, LLC Cannot be reproduced without written permission. P.O. Box 8154, Saint Paul, MN 55108

Chapter 3: Configuration 43
4 month 012 5 day of week 07 (both 0 and 7 are Sunday) 6 command
Example: Run a program at 3:14 every day.
14 3 * * * /root/scripts/./bk.sh
Edit the crontab and then save in the normal vi fashion.
ESC to get out of edit mode.
:wq to save and quit
List the crontabs that you currently have with:
crontab l
It is important that you verify the backups are working and that you are capable of restoring them.
Reachability Nagios has the ability to determine if a host is in a down state or if it is in an unreachable state. The practical implications of both of these states is the same, stuff does not work. However, the troubleshooting aspect is quite different. If a host is down, then of course the administrator needs to investigate the host specifically. However, if a network device is down or so heavily loaded it restricts communication (an overloaded switch) then the network administrator needs to focus on the network device and not the devices attached to the switch. So reachability is concerned with the overall network health and how it impacts your monitored hosts.
Nagios is able to discern the network structure and how it alters these down states and unreachable states by understanding the path for data packets on the network. In other words, Nagios needs to know how equipment is connected because that will help determine the situation. This is done by making a reference to the parent/child relationships of connected network devices. This process allows Nagios to take into account the physical topology of the network.
The next step in configuration is to look at the IP Address and hostname of the next network device. If Nagios is connected to a switch then that should be also configured with a host definition. The difference is that you want to tell Nagios that the parent of that switch device is the hostname nagios or localhost.
define host{ host_name ciscoswitch parents localhost
}
You can only add devices that have the ability to be assigned an IP Address and/or a hostname.
Copyright by Nagios Enterprises, LLC Cannot be reproduced without written permission. P.O. Box 8154, Saint Paul, MN 55108

Chapter 3: Configuration 44
The key in the design is recognizing the network configuration and telling Nagios which is the parent, or network device, directly above the host you are working with. Once your data packet hits your external interface on your router you cannot specify routers on the Internet as the path will vary depending upon best route. So if you were tracing the data packet path from Nagios to a remote device you would need to indicate the IP Address of the external router connecting the device to the Internet.
Virtual Hosting ExampleA good example of a parent/child relationship is when a virtual host is used to manage several containers. The concern is if the host goes down of course all of the containers will go down as well. Here is an example of an OpenVZ host with a number of containers listed.
vzlist a CTID NPROC STATUS IP_ADDR HOSTNAME 161 25 running 192.168.5.161 mk 162 22 running 192.168.5.162 nagvis 170 stopped 192.168.5.170 host 172 stopped 192.168.5.172 mail 173 16 running 192.168.5.173 test 174 14 running 192.168.5.174 test2 180 18 running 192.168.5.180 ub 181 9 running 192.168.5.181 ub2 183 9 running 192.168.5.183 ub3 190 17 running 192.168.5.190 bash
Here is an example of the host definitions for several containers as well as the parent. Note that vz is listed as “parents” in the host definition.
vz (parent)nagvis (container)corpmail (container)mk (container)
define host{ use linuxserver host_name vz alias VZ Server address 192.168.5.160 } define host{ use linuxserver host_name nagvis alias Mapping Server address 192.168.5.162 parents vz } define host{ use linuxserver host_name corpmail
Copyright by Nagios Enterprises, LLC Cannot be reproduced without written permission. P.O. Box 8154, Saint Paul, MN 55108

Chapter 3: Configuration 45
alias Mail Server address 192.168.5.172 parents vz } define host{ use linuxserver host_name mk alias Passive Server address 192.168.5.161 parents vz }
This image demonstrates the relationship that the containers have to the parent.
An additional container does not list vz as “parents” and therefore is treated differently.
define host{ use linuxserver host_name bash alias Bash Scripts address 192.168.5.190 }
If an administrator needed to schedule downtime for vz it would certainly impact all of the containers. In this example the “Child Hosts” are triggered with this downtime.
Copyright by Nagios Enterprises, LLC Cannot be reproduced without written permission. P.O. Box 8154, Saint Paul, MN 55108

Chapter 3: Configuration 46
Here the scheduled downtime clearly demonstrates that the containers that have “vz” listed as “parents” are all included. However, the container “bash” is not included in the process as it does not list the child/parent relationship with “vz”.
There is another issue here to consider. As an administrator you understand the topology of the network, it is obvious if “vz” is down the containers will also be down. By default the administrator will not only get a notification that “vz” is down but also get notifications that all containers are down as well, possibly unwanted notifications. However, as an administrator you WILL want notification on a container that is down but the parent is up.
Copyright by Nagios Enterprises, LLC Cannot be reproduced without written permission. P.O. Box 8154, Saint Paul, MN 55108

Chapter 3: Configuration 47
The default notification options in the linuxserver template include notifications for down, unknown and recovery.
notification_options d,u,r
The unknown state relates to the example below where Nagios knows the host is down but does not know the state of the containers because they are “unreachable” or “unknown”. Therefore if you did not want notifications for the containers being down, remove the “u” option from notification_options as in the example.
define host{ use linuxserver host_name nagvis alias Mapping Server address 192.168.5.162 parents vz notification_options d,r}
Copyright by Nagios Enterprises, LLC Cannot be reproduced without written permission. P.O. Box 8154, Saint Paul, MN 55108

Chapter 3: Configuration 48
If the administrator does not enter the parent/child relationship for “bash” which is a container, then there is not going to be an opportunity to disable notifications for the “unreachable” state as Nagios will believe it is a direct connection and as a result will determine the state to be “down” instead of “unreachable”. Obviously, creating the relationships provides better control of accurate notifications and limiting notifications.
Volatile Service A volatile service is a service that will automatically return itself to an "OK" status when it is checked. Or, it is a service that needs to be checked by an administrator on each occurrence, like a security event. Volatile services are different than normal services in that:
* the nonOK state is logged* contacts will be notified on each event* event handlers are run on each event
The is_volatile option in a service definition allows you to specify the service as volatile. Since the state is returned to an OK state after each event, one of the changes that should be made with a volatile service is that the “max_check_attempts” are set to one so that each event will trigger a hard state. If this was set to a higher number than one it would never reach the hard state as it is reset.
is_volatile = 1max_check_attempts =1
State StalkingState stalking provides for detailed logging information. The goal in using state stalking is that as much detail as possible is placed in the logs for further review after the event. Instead of just logging state changes, from OK to WARNING for example, stalking logs any changes from the previous check. So not only state changes are logged but information that occurs during the same state is also logged. Logs will indicate output that is different than the previous check.
stalking_options = [o,d,u]
The stalking directive provides three options: “o” for stalking on up states, “d” for stalking on down states and “u” for stalking on unreachable states.
FlappingA flapping state is when a service or host changes from an OK state to CRITICAL state rapidly. These changing states will send multitudes of notifications to administrators which can be nonproductive. When flapping is detected Nagios will recognize the changing states and move into a state of flapping which provides additional options for an administrator which could allow unwanted notifications.
In order to detect this flapping state Nagios saves in memory 21 checks for each host and service. Nagios reviews the last 20 changes to determine if the host or service is changing states based on a percentage. In this review of states the
Copyright by Nagios Enterprises, LLC Cannot be reproduced without written permission. P.O. Box 8154, Saint Paul, MN 55108

Chapter 3: Configuration 49
more recent checks are provided a greater weight than the older checks as this is probably more important to an administrator. Nagios also provides two thresholds for a service and a host so that an administrator can set an upper and lower threshold which means that when the service or host goes above the upper threshold Nagios recognizes this as state flapping which means notifications will be stopped, an entry in the log is created and a comment is placed in the web interface so it can be reviewed by administrators. Once the percentage goes below the lower limit the comment is removed and the service is returned to a normal state with notifications enabled. This process takes a period of time to occur. Here is an example of a service that is flapping. If you look closely you can see the percentage of state change.
Notifications for this service are being suppressed because it was detected as having been flapping between different states (12.7% change ). When the service state stabilizes and the flapping stops, notifications will be reenabled.
To make changes to the settings for flap detection, first access the nagios.cfg file which provides global settings. The first setting that can be altered is that an administrator can turn flapping off by changing the value to “0”. The thresholds may be modified to meet specific requirements for the organization. Remember these thresholds are percentages so the low end is 5%, or one state change and the upper end is 20% which equals five state changes.
enable_flap_detection=1
low_service_flap_threshold=5.0 high_service_flap_threshold=20.0 low_host_flap_threshold=5.0 high_host_flap_threshold=20.0
Specific changes could be made with the specific service as well. The “flap_detection_enabled” must be included to allow the override of the global settings. The two thresholds then may be modified to meet the needs of the service.
define service{ use genericservice host_name centos
Copyright by Nagios Enterprises, LLC Cannot be reproduced without written permission. P.O. Box 8154, Saint Paul, MN 55108

Chapter 3: Configuration 50
service_description SMTP check_command check_smtp flap_detection_enabled 1
low_flap_threshold 10.0 high_flap_threshold 30.0
}
There is another option that is available with flapping. This option allows an administrator to control which states indicated flapping. The states available are o(OK), w(WARNING), c(CRITICAL) and u(UNKNOWN). States that are not listed are not taken into account to determine flapping.
flap_detection_options o,w,c,u
As you can see in this illustration you can also “Disable flap detection for this host” under the “Host Commands”. This provides the option to just perform the task as it happens. Here is the verification before you commit the change.
Copyright by Nagios Enterprises, LLC Cannot be reproduced without written permission. P.O. Box 8154, Saint Paul, MN 55108

Chapter 3: Configuration 51
ParallelismNagios has the ability to run checks in parallel. Host and service checks are always checked using parallelization. Here is how it works. These checks are scheduled in the Nagios event queue where Nagios makes every effort to complete these checks when the time is scheduled. When an event is scheduled Nagios initiates a fork() to run that particular check. Once that is started Nagios does not wait for it to complete but moves onto the next item on the list. When the process that Nagios started completes the check the results are sent back to Nagios. Nagios will then processes the results of the check. This process of running more than one check at a time is parallelism.
Orphaned ServiceAn orphaned service is when the results of a service check have not been received after a period of time. It is orphaned because the way that Nagios schedules additional checks is that once the results form the service check are collected it schedules the next check. If no results are received the service check may not be scheduled ever again.
FreshnesssOne issue that you will see immediately with passive checks is that the Nagios server will hold a check value for a long time, maybe forever without making any changes to status as it has not received an update from the remote server. Nagios can manage a “freshness test” to evaluate a time interval it should have received a passive check from a host. This must be set globally in the nagios.cfg file. Here are the default settings in nagsio.cfg. Note there is no freshness test for the host.
check_service_freshness=1 service_freshness_check_interval=60 check_host_freshness=0 host_freshness_check_interval=60
Set up the service for the passive check first.
define service{ use passiveservice
Copyright by Nagios Enterprises, LLC Cannot be reproduced without written permission. P.O. Box 8154, Saint Paul, MN 55108
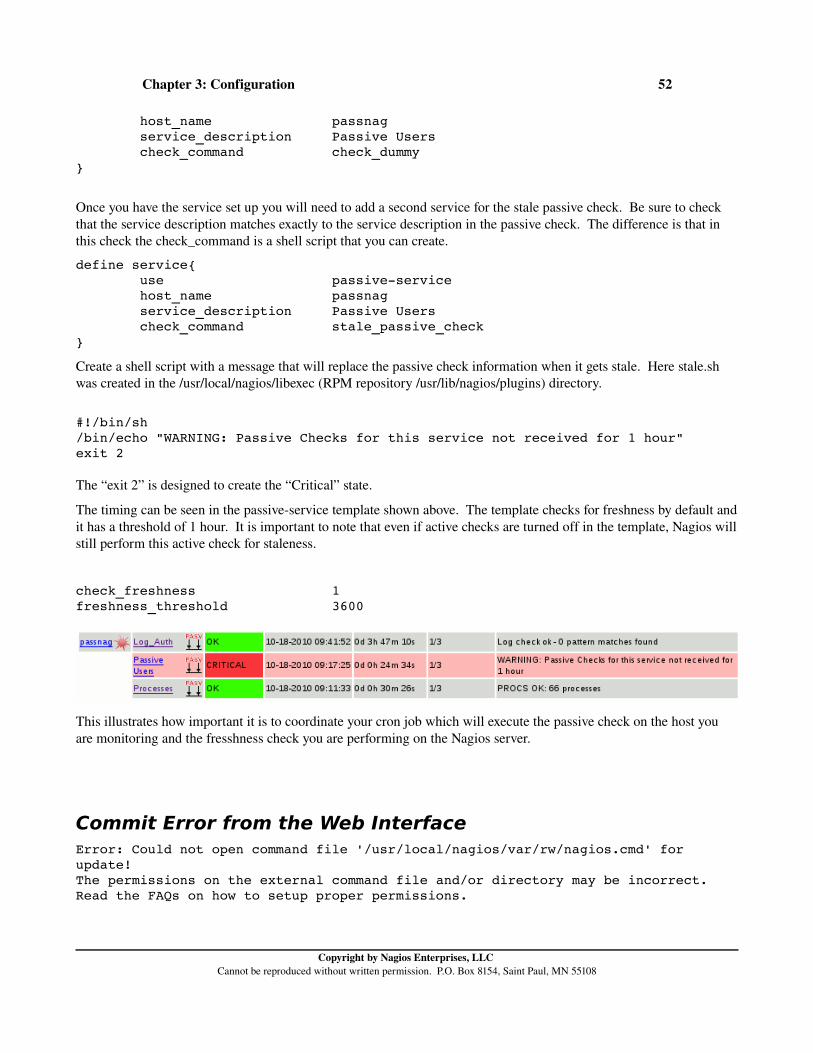
Chapter 3: Configuration 52
host_name passnag service_description Passive Users check_command check_dummy}
Once you have the service set up you will need to add a second service for the stale passive check. Be sure to check that the service description matches exactly to the service description in the passive check. The difference is that in this check the check_command is a shell script that you can create.
define service{ use passiveservice host_name passnag service_description Passive Users check_command stale_passive_check }
Create a shell script with a message that will replace the passive check information when it gets stale. Here stale.sh was created in the /usr/local/nagios/libexec (RPM repository /usr/lib/nagios/plugins) directory.
#!/bin/sh /bin/echo "WARNING: Passive Checks for this service not received for 1 hour" exit 2
The “exit 2” is designed to create the “Critical” state.
The timing can be seen in the passiveservice template shown above. The template checks for freshness by default and it has a threshold of 1 hour. It is important to note that even if active checks are turned off in the template, Nagios will still perform this active check for staleness.
check_freshness 1 freshness_threshold 3600
This illustrates how important it is to coordinate your cron job which will execute the passive check on the host you are monitoring and the fresshness check you are performing on the Nagios server.
Commit Error from the Web Interface Error: Could not open command file '/usr/local/nagios/var/rw/nagios.cmd' for update! The permissions on the external command file and/or directory may be incorrect. Read the FAQs on how to setup proper permissions.
Copyright by Nagios Enterprises, LLC Cannot be reproduced without written permission. P.O. Box 8154, Saint Paul, MN 55108

Chapter 3: Configuration 53
An error occurred while attempting to commit your command for processing.
Here are the permissions on named pipe, which are correct.
ls l /usr/local/nagios/var/rw total 0 prwrw 1 nagios nagcmd 0 Mar 6 15:25 nagios.cmd
However, the problem relates to the apache process being able to make the commit change which would require the user apache to have write access to the pipe. To make that happen add apache to the nagcmd group.
nagcmd:x:501:nagios,apache
Now restart apache and you will see that it works fine.
Nagios Checks: Active/PassiveNagios can perform checks two different ways; active or passive. Understanding which method is being used is key to troubleshooting. When comparing active and passive checks one of the biggest differences is that in active checks Nagios explicitly controls each step but in passive checks Nagios is at the mercy of the external host sending data to be processed. In passive checks the client performs the check itself and provides the information to the Nagios server at the interval determined by the client, not Nagios.
ActiveWith active checks Nagios initiates and manages each step of the process. This means each step of the process is closely monitored and manipulated by Nagios. The schedule for when checks occur, the organization of resources and the initialization of those resources are controlled by Nagios. The scheduling queue is an example. During time of heavy load Nagios may push this schedule to control activity.
Passive Typically passive checks are used when a firewall prevents the Nagios server to make a request to the client or when
Copyright by Nagios Enterprises, LLC Cannot be reproduced without written permission. P.O. Box 8154, Saint Paul, MN 55108

Chapter 3: Configuration 54
the client is running an application that asynchronous, in other words the time schedule for a service is erratic and cannot be fully determined. Security events are one example of a situation where you do not know when the event may occur. Passive checks may also be used for distributed monitoring where you have multiple Nagios servers providing information to a master Nagios server. Another example of passive check use would be when you have unpredictable events occur on the host to be monitored. Active checks could be turned off for the host and a passive check could be created to monitor a check to verify it was complete before sending the results to Nagios. This is a situation where you may have a cron job that performs a backup but the backup has a wide difference of time that it takes to complete.
Generally, passive checks reduce the load, including RAM and CPU, on the Nagios server as most of the work is done on the client. This aspect allows organizations to scale more efficiently.
Passive checks using NSCA, NRDP and DNX can be used to create a distributed model for monitoring as well. Distributed monitoring is where once central Nagios server is used to collect the monitoring results of a number of Nagios servers, usually over a global geographical base.
When Passive Checks are used the client uses a program called NSCA (Nagios Service Check Acceptor) and the evaluation occurs locally on the client and then is sent to the Nagios server using NSCA. NSCA runs on the Nagios server as a daemon protected by xinetd. The daemon will listen for requests on port 5667 sent by the client. When the server receives the request the remote server is authenticated using a password that is shared between the Nagios server and the client. The password is encrypted on one of 22 levels to protect it as it moves over the network.
A similar passive check can be used with NRDP (Nagios Remote Data Processor) which communicates to the Nagios server using a secret token and connects on port 80 or 443.
The Nagios server only processes passive checks that are sent to it. In other words, the client must automate the checks using a cron job or the passive checks must be a response to an event.
Distributed MonitoringDistributed monitoring is a way to distribute checks to multiple Nagios instances which independently check on hosts and services and then send all of the results to a central Nagios instance.
Copyright by Nagios Enterprises, LLC Cannot be reproduced without written permission. P.O. Box 8154, Saint Paul, MN 55108

Chapter 3: Configuration 55
Central Nagios Server Set Up You need to have a working Nagios server to be able to use NSCA. You will need to compile NSCA and the Nagios plugins. The Central Nagios server can use nsca version 2..9.1 but the Noncentral servers must use the older 2.7.2 version as of this writing.
Compile NSCA (Nagios Service Check Adaptor)
yum install y libmcrypt libmcryptdevel xinetd cd /tmp wget http://sourceforge.net/projects/nagios/files/nsca2.x/nsca2.9.1/nsca
2.9.1.tar.gz/download tar zxvf nsca2.9.1.tar.gz cd nsca2.9.1 ./configure make all cp src/nsca /usr/local/nagios/bin/ cp sampleconfig/nsca.cfg /usr/local/nagios/etc/ cp sampleconfig/nsca.xinetd /etc/xinetd.d/nsca
Add the NSCA daemon port to /etc/services. This will allow the operating system to understand which daemon works on that port.
nsca 5667/tcp # NSCA
Alternative: Install Using the RPM Repository
Copyright by Nagios Enterprises, LLC Cannot be reproduced without written permission. P.O. Box 8154, Saint Paul, MN 55108

Chapter 3: Configuration 56
This will assume you have installed Nagios using the RPM repository at rpmforge.com. Note, all paths will be different.
yum install y nsca
When nsca is installed you will see two new files in /etc/nagios.
Interface for External Commands
The interface on the server that accepts external commands is the External Command Files which is a named pipe in /usr/local/nagios/var/rw (RPM repository /var/nagios/rw). When you install NSCA it will create this pipe once it is started.
ls lF /usr/local/nagios/var/rw
(RPM repository ls lF /var/nagios/rw)
total 0
prwrw 1 nagios nagcmd 0 Sep 8 15:31 nagios.cmd|
When you send commands to the interface it will have to have this format:
[epoch timestamp] command;arguments
The “epoch timestamp” is the number of seconds from the January 1, 1970 date as the birth of Linux. The “command” follows the timestamp and then separated by a semicolon any “arguments”. Often when you write shell scripts you will use variables and command substitution to make this process easier.
Verify external commands are set up in /usr/local/nagios/etc/nagios.cfg (RPM repository /etc/nagios/nagios.cfg). These are the lines you need to check, typically they should be ready to go. These lines make it possible to send external commands to the Nagios server.
check_external_commands=1 command_check_interval=1 command_file=/usr/local/nagios/var/rw/nagios.cmd
(RPM repository command_file=/var/nagios/rw/nagios.cmd)
log_passive_checks=1 accept_passive_service_checks=1 accept_passive_host_checks=1
Note the command_check_interval is set up so that it will accept passive communication on any time frame (1), it is not scheduled.
Edit /usr/local/nagios/etc/nsca.cfg (RPM repository /etc/nagios/nsca.cfg)
The password and the decryption method needs to match the password and the encryption method on the Noncentral
Copyright by Nagios Enterprises, LLC Cannot be reproduced without written permission. P.O. Box 8154, Saint Paul, MN 55108
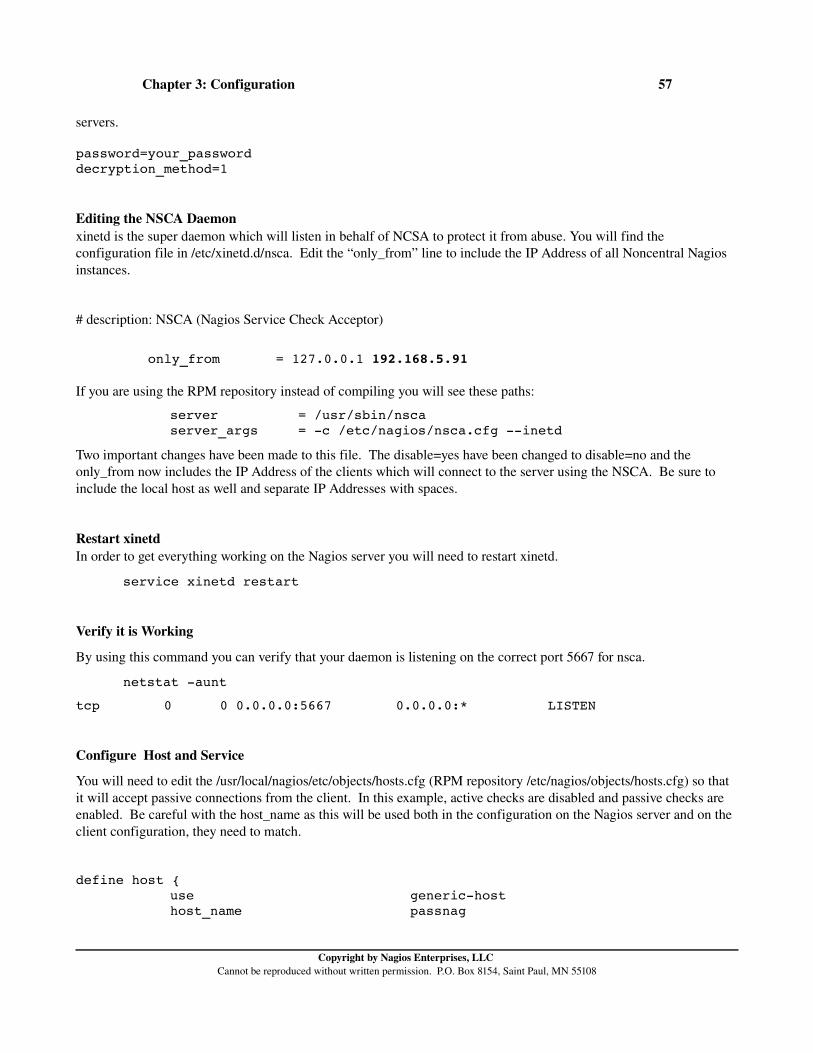
Chapter 3: Configuration 57
servers.
password=your_passworddecryption_method=1
Editing the NSCA Daemon xinetd is the super daemon which will listen in behalf of NCSA to protect it from abuse. You will find the configuration file in /etc/xinetd.d/nsca. Edit the “only_from” line to include the IP Address of all Noncentral Nagios instances.
# description: NSCA (Nagios Service Check Acceptor)
only_from = 127.0.0.1 192.168.5.91
If you are using the RPM repository instead of compiling you will see these paths:
server = /usr/sbin/nsca server_args = c /etc/nagios/nsca.cfg inetd
Two important changes have been made to this file. The disable=yes have been changed to disable=no and the only_from now includes the IP Address of the clients which will connect to the server using the NSCA. Be sure to include the local host as well and separate IP Addresses with spaces.
Restart xinetdIn order to get everything working on the Nagios server you will need to restart xinetd.
service xinetd restart
Verify it is Working
By using this command you can verify that your daemon is listening on the correct port 5667 for nsca.
netstat aunt
tcp 0 0 0.0.0.0:5667 0.0.0.0:* LISTEN
Configure Host and Service
You will need to edit the /usr/local/nagios/etc/objects/hosts.cfg (RPM repository /etc/nagios/objects/hosts.cfg) so that it will accept passive connections from the client. In this example, active checks are disabled and passive checks are enabled. Be careful with the host_name as this will be used both in the configuration on the Nagios server and on the client configuration, they need to match.
define host { use generichost host_name passnag
Copyright by Nagios Enterprises, LLC Cannot be reproduced without written permission. P.O. Box 8154, Saint Paul, MN 55108
Chapter 3: Configuration 58
address 192.168.5.91 active_checks_enabled 0 passive_checks_enabled 1
}
You will also need to set up a service which will provide passive checks. This will be discussed in the client section under the passive service test.
This completes the server configuration.
Non-central Set Up The major goal of the noncentral server is to distribute the results of all service checks to the central server. The noncentral Nagios machines must use OCSP and OCHP in order to send the proper updates to the central server.
OCSP (Obsessive Compulsive Service Processor)
OCHP (Obsessive Compulsive Host Processor)
These are external scripts or commands that are run after every service or host check.
Change the nagios.cfg settings to those below. The timeout prevents your Nagios server from spending too much time on one command.
obsess_over_services=1ocsp_command=service_checkocsp_timeout=5
obsess_over_hosts=1ochp_command=host_checkochp_timeout=5
You will need to create two scripts in the /usr/local/nagios/libexec/eventhandlers (RPM repository /usr/lib/nagios/plugins/eventhandlers/) directory.
#!/bin/bash # Service Check cmd="/usr/local/nagios/bin/send_nsca" cfg="/usr/local/nagios/etc/send_nsca.cfg" host=$1 srv=$2 result=$3 output=$4 /bin/echo e "$host\t$srv\t$result\t$output\n" | $cmd H nagios c $cfg
#!/bin/bash
Copyright by Nagios Enterprises, LLC Cannot be reproduced without written permission. P.O. Box 8154, Saint Paul, MN 55108
Chapter 3: Configuration 59
# Host Check cmd="/usr/local/nagios/bin/send_nsca" cfg="/usr/local/nagios/etc/send_nsca.cfg"host=$1 result=$2 output=$3 /bin/echo e "$host\t$result\t$output\n" | $cmd H nagios c $cfg
chmod 755 service_check chmod 755 host_check chown nagios:nagios *
Create a file called misccommands.cfg in the /usr/local/nagios/etc/objects (RPM repository /etc/nagios/objects) directory so you can add the new commands.
define command{ command_name service_check command_line $USER1$/eventhandlers/service_check $HOSTNAME$ '$SERVICEDESC$' $SERVICESTATEID$ '$SERVICEOUTPUT$' }define command{ command_name host_check command_line $USER1$/eventhandlers/host_check $HOSTNAME$ $SERVICESTATEID$ '$SERVICEOUTPUT$'}
Be sure to add this line to your nagios.cfg file.
cfg_file=/usr/local/nagios/etc/objects/misccommands.cfg
The client can be a server that has NSCA or another Nagios server that is sending passive information to a central Nagios server, so it is called a “client” in that it is sending to the master Nagios server.
Compile NSCA (Nagios Service Check Adaptor)
Note these instructions are different than if you compile for the Nagios server as you will use different binaries. This also assumes that you have compiled the plugins for Nagios, otherwise you may need to create directories that do not exist.
cd /usr/local/src wget http://sourceforge.net/projects/nagios/files/nsca2.x/nsca2.7.2/nsca
2.7.2.tar.gz/downloadtar zxvf nsca2.7.2.tar.gzcd nsca2.7.2
Install several prerequisites for encrypted communication.
Copyright by Nagios Enterprises, LLC Cannot be reproduced without written permission. P.O. Box 8154, Saint Paul, MN 55108

Chapter 3: Configuration 60
yum install y libmcrypt libmcryptdevel
Now compile NSCA../configuremake all
This will create the necessary binaries. Now copy the binaries to the correct location.cp src/send_nsca /usr/local/nagios/bin/cp sampleconfig/send_nsca.cfg /usr/local/nagios/etc/
Alternative: Install from RPM Repositoryyum install y nsca
send_nsca
This application sends a message to the Nagios server. The format requires four elements for a service:
host/service/return_value/output
Note: Passive checks require exacting configuration. Many people experience a lot of frustration because they do not follow these recommendations exactly.
The client is sending the report to the Nagios server. It is important that this hostname is the same one that you have created in the host.cfg on the Nagios server. The service is what you will monitor passively. The return value can be with "0" for OK, "1" for WARNING, "2" for CRITICAL and "3" for UNKNOWN.
Add a password, the same that you have on the server for NSCA. Edit /usr/local/nagios/etc/send_nsca.cfg (RPM repository /etc/nagios/send_nsca.cfg)
password=your_password
Verify the encryption method on the client is the same as the decryption method on the Nagios server.
encryption_method=1
Sending Mail From NagiosEvery Linux server that is installed, uses a mail server to send mail locally. The mail server, whether it is Sendmail or Postfix, is enabled to send mail by default but not to receive mail. In addition, the mail server is configured to run at start up of the server. You can confirm this with the netstat command:
netstat aunttcp 0 0 127.0.0.1:25 0.0.0.0:* LISTEN
Here the fact the mail server is running on port 25 and is listening, but only on the localhost, 127.0.0.1 What this means is that the mail server will be sending reports to the root user on the localhost and could send mail to another
Copyright by Nagios Enterprises, LLC Cannot be reproduced without written permission. P.O. Box 8154, Saint Paul, MN 55108

Chapter 3: Configuration 61
mail server on port 25, but it could not receive any mail outside of the mail server. Nagios is able to use the mail system to send mail notifications to mail recipients and all of it is set up automatically. However, this is only part of the equation. Whenever you have an application sending email the other half of the equation is the receiving mail server.
Solutions for the Nagios Server1. Create a Fully Qualified Domain Name (FQDN) for the Nagios serverThe FQDN looks like this in two parts: mail.example.com. The hostname is mail and the domain is represented in example.com, which when you combine the two becomes the FQDN. The mail server that receives the email from Nagios probably requires a FQDM. So your hostname on the Nagios server must satisfy this requirement.
On a CentOS system you can create a FQDN by editing two files. The first file to edit is /etc/sysconfig/network. Note the “HOSTNAME” is specifically listed.
NETWORKING=yes NETWORKING_IPV6=no HOSTNAME=nagios.example.comGATEWAY=192.168.3.1
The second file to edit is /etc/hosts. Note that the 127.0.0.1 represents the localhost. There are also two examples of the hostname “nagios.example.com” and “nagios”. These both must be listed. Of course change the name of the server and the domain to fit your situation.
127.0.0.1 nagios.example.com nagios localhost.localdomain localhost ::1 localhost6.localdomain6 localhost6
2. Allow Nagios to Resolve Using DNSOne of the tests that most mail servers perform is to see if the DNS resolves correctly for the sending mail server, in this case Nagios. If you create a DNS entry for Nagios so that your Nagios server resolves on the Internet, the mail sent from Nagios is more likely to be received. However, as is often the case, organizations may be more concerned about the security of Nagios so allowing DNS resolution may not be the best choice. In that case, relay the mail sent from Nagios to the corporate mail server. 3. Allow Nagios to Relay Mail Through a Mail ServerOften mail will not be delivered because the mail server that Nagios is sending to will not relay the mail sent from Nagios. By default all mail servers are designed to stop relays. Therefore the organization will need to configure the corporate mail server to be able to relay mail from the Nagios server.
Without making Nagios a full blown mail server, those three options should get the mail working.
Testing Your MailIf you wanted to check to see if you can send mail use this procedure. First, send email from the Nagios server to a gmail account. Gmail is more likely to accept mail from a Nagios as it is not as restricted as the corporate mail server, probably. As a user run the mail command:
mail user@some_gmail_account
Copyright by Nagios Enterprises, LLC Cannot be reproduced without written permission. P.O. Box 8154, Saint Paul, MN 55108

Chapter 3: Configuration 62
Here is what it will look like when you send mail from the command line(note you end the mail body with a “.” on a line by itself:
mail [email protected] Subject: Testing Nagios Mail This is a test of the Nagios mail notifications. . Cc:
That will send mail using Sendmail(CentOS) to the email address you specified. You can check your logs and you should see something like this indicating the mail was sent.
tail /var/log/maillogMar 27 06:52:45 nagios sendmail[24474]: n2RCqjn3024474: to=user@some_email.com, ctladdr=root (0/0), delay=00:00:00, xdelay=00:00:00, mailer=relay, pri=30045, relay=[127.0.0.1] [127.0.0.1], dsn=2.0.0, stat=Sent (n2RCqjDf024475 Message accepted for delivery)
You can test mail locally on the Nagios server with telnet. Be sure to indicate you are connecting on port 25 and on the localhost as it will only allow connections on the localhost. The commands you need for telnet are highlighted. Be sure to use the domain of your Nagios server. The body of the email is the “DATA” and you end that with a “.” on a line by itself.
telnet localhost 25 Trying 127.0.0.1... Connected to localhost.localdomain (127.0.0.1). Escape character is '^]'. 220 nag2.local.net ESMTP Sendmail 8.13.8/8.13.8; Sat, 13 Nov 2010 07:30:29 0700 MAIL FROM:<[email protected]> 250 2.1.0 <[email protected]>... Sender ok RCPT TO:<[email protected]> 250 2.1.5 <[email protected]>... Recipient ok DATA 354 Enter mail, end with "." on a line by itself Testing the Mail System. . 250 2.0.0 oADEUTI6002388 Message accepted for delivery QUIT 221 2.0.0 nag2.local.net closing connection Connection closed by foreign host.
If you cannot telnet to the localhost on port 25 the mail server may not be working.
NagiostatsThe nagiostats is installed with Nagios and is a command that provides you a limited view of what the web interface shows in terms of performance. The metrics or system measurements are divided into minimum/maximum/average
Copyright by Nagios Enterprises, LLC Cannot be reproduced without written permission. P.O. Box 8154, Saint Paul, MN 55108

Chapter 3: Configuration 63
settings. This condensed version can be viewed with the command:
nagiostats c /usr/local/nagios/etc/nagios.cfg(RPM repository nagiostats c /etc/nagios/nagios.cfg )
nagiostats
Nagios Stats 3.4.1 Copyright (c) 20032008 Ethan Galstad (www.nagios.org) Last Modified: 03092010 License: GPL
CURRENT STATUS DATA Status File: /usr/local/nagios/var/status.datStatus File Age: 0d 0h 0m 7s Status File Version: 3.2.1
Program Running Time: 0d 1h 9m 17s Nagios PID: 2301 Used/High/Total Command Buffers: 0 / 1 / 4096
Total Services: 82 Services Checked: 82 Services Scheduled: 78 Services Actively Checked: 78 Services Passively Checked: 4 Total Service State Change: 0.000 / 0.000 / 0.000 % Active Service Latency: 0.007 / 0.681 / 0.176 sec Active Service Execution Time: 0.020 / 10.082 / 3.297 sec Active Service State Change: 0.000 / 0.000 / 0.000 % Active Services Last 1/5/15/60 min: 12 / 47 / 78 / 78 Passive Service Latency: 0.425 / 1.099 / 0.823 sec Passive Service State Change: 0.000 / 0.000 / 0.000 % Passive Services Last 1/5/15/60 min: 0 / 0 / 0 / 0 Services Ok/Warn/Unk/Crit: 27 / 1 / 22 / 32 Services Flapping: 0 Services In Downtime: 0
Total Hosts: 15 Hosts Checked: 15 Hosts Scheduled: 14 Hosts Actively Checked: 14 Host Passively Checked: 1 Total Host State Change: 0.000 / 0.000 / 0.000 % Active Host Latency: 0.049 / 0.274 / 0.137 sec Active Host Execution Time: 0.255 / 4.044 / 3.132 sec Active Host State Change: 0.000 / 0.000 / 0.000 % Active Hosts Last 1/5/15/60 min: 2 / 13 / 14 / 14 Passive Host Latency: 1272539827.500 / 1272539827.500 / 1272539827.500 sec Passive Host State Change: 0.000 / 0.000 / 0.000 %
Copyright by Nagios Enterprises, LLC Cannot be reproduced without written permission. P.O. Box 8154, Saint Paul, MN 55108

Chapter 3: Configuration 64
Passive Hosts Last 1/5/15/60 min: 0 / 0 / 0 / 0 Hosts Up/Down/Unreach: 6 / 9 / 0 Hosts Flapping: 0 Hosts In Downtime: 0
Active Host Checks Last 1/5/15 min: 2 / 14 / 44 Scheduled: 2 / 13 / 41 Ondemand: 0 / 1 / 3 Parallel: 2 / 13 / 41 Serial: 0 / 0 / 0 Cached: 0 / 1 / 3 Passive Host Checks Last 1/5/15 min: 0 / 0 / 0 Active Service Checks Last 1/5/15 min: 10 / 46 / 137 Scheduled: 10 / 46 / 137 Ondemand: 0 / 0 / 0 Cached: 0 / 0 / 0 Passive Service Checks Last 1/5/15 min: 0 / 0 / 0
External Commands Last 1/5/15 min: 0 / 0 / 0
PerformancePerformance can become an issue with Nagios as the number of checks increase. The Disk I/O wait times that are commonly associated with check results and performance data can slow Nagios down substantially. There are several ways to increase Disk I/O including the use of high performance disks which have a cache on the disk. In addition, a RAM disk can be used or rrdcached for performance data.
Create RAM DiskThe typical shared memory is implemented in /dev/shm. This is used to transfer information between programs using this memory which is faster for these applications than the data bus on the motherboard.
tmpfs is the same thing as shm which again is a temporary storage location. Use the mount command to see this information.
mount /dev/sda2 on / type ext3 (rw) proc on /proc type proc (rw) sysfs on /sys type sysfs (rw) devpts on /dev/pts type devpts (rw,gid=5,mode=620) /dev/sda5 on /vz type ext3 (rw) /dev/sdb1 on /bk type ext3 (rw) /dev/sda1 on /boot type ext3 (rw) tmpfs on /dev/shm type tmpfs (rw) none on /proc/sys/fs/binfmt_misc type binfmt_misc (rw)
The df command shows this as well.
Copyright by Nagios Enterprises, LLC Cannot be reproduced without written permission. P.O. Box 8154, Saint Paul, MN 55108

Chapter 3: Configuration 65
df h Filesystem Size Used Avail Use% Mounted on /dev/sda2 19G 2.5G 16G 14% / /dev/sda5 51G 180M 49G 1% /vz /dev/sdb1 73G 267M 69G 1% /bk /dev/sda1 487M 22M 440M 5% /boot tmpfs 2.0G 0 2.0G 0% /dev/shm
The /etc/fstab (CentOS 5.x) will list this to be used again on reboot and mounted automatically.
LABEL=/1 / ext3 defaults 1 1 LABEL=/vz /vz ext3 defaults 1 2 LABEL=/bk /bk ext3 defaults 1 2 LABEL=/boot1 /boot ext3 defaults 1 2 tmpfs /dev/shm tmpfs defaults 0 0 devpts /dev/pts devpts gid=5,mode=620 0 0 sysfs /sys sysfs defaults 0 0 proc /proc proc defaults 0 0 LABEL=SWAPsda3 swap swap defaults 0 0
/etc/fstab (CentOS 6.x note the UUIDs)
/dev/mapper/VolGrouplv_root / ext4 defaults 1 1UUID=2707969007a84953809ff8f4f0f67257 /boot ext4 defaults 1 2/dev/mapper/VolGrouplv_swap swap swap defaults 0 0tmpfs /dev/shm tmpfs defaults 0 0devpts /dev/pts devpts gid=5,mode=620 0 0sysfs /sys sysfs defaults 0 0proc /proc proc defaults 0 0
Create a directory that can be used as the ramdisk. In this example, the choice is on a separate partition from the partition that Nagios is on, which will also provide a small boost in terms of speed.
mkdir /vz/ramdisk
In order to determine the size of the ramdisk you will need to estimate the combined sizes of two files.
ls lh /usr/local/nagios/var rwrr 1 nagios nagios 217K Feb 10 02:28 objects.cache rwrwr 1 nagios nagios 310K Feb 11 07:40 status.dat
Obviously, not much used here but the ramdisk is made for 100MB because the space is available and you always want to think about growth.
mount t tmpfs none /vz/ramdisk/ o size=100m
Copyright by Nagios Enterprises, LLC Cannot be reproduced without written permission. P.O. Box 8154, Saint Paul, MN 55108

Chapter 3: Configuration 66
Mount the ramdisk and then check that it is mounted.
df Filesystem 1Kblocks Used Available Use% Mounted on /dev/sda2 19840924 2535516 16281268 14% / /dev/sda5 53376556 184276 50437136 1% /vz /dev/sdb1 75700148 272968 71519772 1% /bk /dev/sda1 497829 22078 450049 5% /boot tmpfs 2075288 0 2075288 0% /dev/shm none 102400 0 102400 0% /vz/ramdisk
Make sure the user nagios can use the partition. chown nagios /vz/ramdisk/
Edit /etc/fstab and enter this line (note this is for CentOS 5.x and 6.x) tmpfs /vz/ramdisk tmpfs size=100m 0 0
Make sure it will remount correctly:
mount o remount /vz/ramdisk
Edit nagios.cfg so that nagios knows to use the ramdisk, remember you are making modifications for two files.
#object_cache_file=/usr/local/nagios/var/objects.cache object_cache_file=/vz/ramdisk/objects.cache
#status_file=/usr/local/nagios/var/status.dat status_file=/vz/ramdisk/status.dat
Now restart Nagios and you should see the two files sitting in the ramdisk.
ls /vz/ramdisk/ objects.cache status.dat
That should help with performance.
Caching with rrdcachedThis daemon, rrdcached, will receive updates to RRD files that are kept on the server. Once enough updates have been collected, and the time period that was defined has passed, rrdcached will write to the RRD files that exist. This daemon is especially helpful with servers that are performing over 1000 checks or for helping systems that have slow performance due to I/O wait.
CentOS 5.x
Copyright by Nagios Enterprises, LLC Cannot be reproduced without written permission. P.O. Box 8154, Saint Paul, MN 55108

Chapter 3: Configuration 67
Start the daemon rrdcached with:
service rrdcached startrrdcached is stoppedStarting rrdcached: [ OK ]
CentOS 6.x
You will need to install rrdtool by compiling it if you have CentOS 6.x because the repository uses an older verion.
yum install y libxml2 libxml2devel pangodevel cd /usr/local/srcwget http://oss.oetiker.ch/rrdtool/pub/rrdtool1.4.4.tar.gz tar zxf rrdtool1.4.4.tar.gzcd rrdtool1.4.4 ./configure –bindir=/usr/bin make clean make install
Download and copy over the rrdcached init script.
cd /tmp wget http://assets.nagios.com/downloads/general/scripts/rrdcached chmod +x rrdcached mv rrdcached /etc/init.d/ mkdir /var/rrdtool chown nagios:nagios /var/rrdtool
Remove outdated perl package.
yum remove y rrdtoolperl
Edit the /etc/sysconfig/rrdcached file. Here are the default settings:
OPTIONS="l unix:/var/rrdtool/rrdcached/rrdcached.sock s rrdcached m 664 b /var/rrdtool/rrdcached"
RRDC_USER=rrdcached
Change to:
OPTIONS="l unix:/var/rrdtool/rrdcached/rrdcached.sock F s nagios m 0660 w 900 z 90 j /tmp/
b /var/rrdtool/rrdcached P FLUSH,PENDING"
RRDC_USER=nagios
Copyright by Nagios Enterprises, LLC Cannot be reproduced without written permission. P.O. Box 8154, Saint Paul, MN 55108
Chapter 3: Configuration 68
The “l” is used to list the location of the unix socket. The “F” forces rrdcached to flush all data to the RRD files when it is shut down. The “s” is the authorized user or group. The “m” is the socket permissions. These settings will cache data for 15 minutes (w 900) before writing to the RRD files over a 90 second (z 90) interval. This will save on resources but you need to understand it will also create a 15 minute delay in your graphing. The “j” is the location of the temporary file used for storage and “b” is binary cached for the daemon. Finally, “P” lists commands for rrdcached.
Since /var/rrdtool is owned by the user:group rrdcached you will need to add nagios to the group (/etc/group) in order to get it to start:
rrdcached:x:103:nagios
Now restart the daemon:
service rrdcached restart
Start rrdcached at boot time:
chkconfig add rrdcachedchkconfig level 3 rrdcached on
rrdcached for PNP4NagiosPNP also uses rrdtool so it could also be cached. You will need to edit /usr/local/nagios/etc/pnp/process_perfdata.cfg by going to the last line and adding the line you see below. By default this line is commented out.
# RRD_DAEMON_OPTS = unix:/tmp/rrdcached.sockRRD_DAEMON_OPTS = unix:/var/rrdtool/rrdcached/rrdcached.sock
Once it has been saved restart the daemon.
service npcd restart
Once you have completed all of these tasks you will want to verify that there is a journal that is working in the /tmp directory, so you should see a line like this:
rwrr 1 nagios users 4096 Feb 10 05:37 rrd.journal.1328876566.110215
If you see this it is working and you have just reduced the load on your system.
Reaper SettingsThe reaper settings is a setting that determines how often Nagios collects check results as they come in. This setting is found in /usr/local/nagios/etc/nagios.cfg. In this example, the reaper frequency is performed more often in order to process checks faster.
Default Settings:check_result_reaper_frequency=10
Copyright by Nagios Enterprises, LLC Cannot be reproduced without written permission. P.O. Box 8154, Saint Paul, MN 55108

Chapter 3: Configuration 69
max_check_result_reaper_time=30
Modified Settings:check_result_reaper_frequency=3max_check_result_reaper_time=10
AddonsAddons are applications that can be used with Nagios to enhance the features, like mapping, MySQL backend, graphing, etc. If you want to use Addons, compile. The reason for that is most Addons assume you will compile and if you try to use another option you will continually find configuration issues.
NDOUtilsNDOUtils is an addon that provides a MySQL database as a backend to Nagios. NDOUtils (Nagios Data Objects Utilities) uses a MySQL database to maintain the Nagios information. NEB (Nagios Event Broker) is used to maintain the connection between Nagios and NDOUtils. One of the big advantages of NEB is that it will load the Nagios extensions as modules so that you do not have to recompile Nagios.
Since NDOUtils uses the MySQL database you you will need to install that and also install some tools to be able to compile NDOUtils.
yum y install mysql mysqldevel mysqlserver gccc++
You can start mysql with this command:
service mysqld start
When the installation program completes, you can use the netstat utility to verify that MySQL is running correctly:
netstat auntActive Internet connections (servers and established)Proto RecvQ SendQ Local Address Foreign Address Statetcp 0 0 0.0.0.0:3306 0.0.0.0:* LISTEN
Here, you can see that MySQL is active, and is listening on port 3306.
When you first install MySQL, there's no password set for the root account, so you'll be able to log in without one.
mysql u rootWelcome to the MySQL monitor. Commands end with ; or \g.Your MySQL connection id is 5 to server version: 5.0.45
Type 'help;' or '\h' for help. Type '\c' to clear the buffer.
mysql>
mysql> quit
Copyright by Nagios Enterprises, LLC Cannot be reproduced without written permission. P.O. Box 8154, Saint Paul, MN 55108

Chapter 3: Configuration 70
Bye
You can add a password to both the server account and the mysql root account at the same time if for some reason your MySQL server did not get a password set.
mysqladmin h localhost u root password "the_password_you_want"
Now, if you try to log on to MySQL without the password, you'll get this:
mysql u rootERROR 1045 (28000): Access denied for user 'root'@'localhost' (using password: NO)
So, to log on now, you'll need to add a "p" in the commandline. (The "p" just means that you'll be supplying the MySQL password.)
mysql p u rootEnter password:Welcome to the MySQL monitor. Commands end with ; or \g.
Type 'help;' or '\h' for help. Type '\c' to clear the buffer.
mysql> quitBye
There may also be some anonymous user accounts installed that don't have passwords. For best security, you'll want to get rid of them.
mysql p u rootEnter password:Welcome to the MySQL monitor. Commands end with ; or \g.
Type 'help;' or '\h' for help. Type '\c' to clear the buffer.
mysql> use mysql;Reading table information for completion of table and column namesYou can turn off this feature to get a quicker startup with A
Database changedmysql> delete from user where User = '';Query OK, 0 rows affected (0.03 sec)
mysql> delete from db where User = '';Query OK, 0 rows affected (0.00 sec)
mysql> flush privileges;Query OK, 0 rows affected (0.01 sec)
mysql>quitBye
Copyright by Nagios Enterprises, LLC Cannot be reproduced without written permission. P.O. Box 8154, Saint Paul, MN 55108

Chapter 3: Configuration 71
Create the database so it is available when you install NDOUtils.
mysql> create database nagios; Query OK, 1 row affected (0.00 sec)
mysql> show databases;
++ | Database | ++ | information_schema | | mysql | | nagios | | test | ++
4 rows in set (0.00 sec)
mysql>use nagios;Database changed
mysql> GRANT ALL ON nagios.* TO 'nagios'@'localhost' IDENTIFIED BY "your_password"; Query OK, 0 rows affected (0.00 sec)
mysql> quit Bye
Install NDOUtils
cd /tmpwget http://sourceforge.net/projects/nagios/files/ndoutils1.x/ndoutils
1.5.2/ndoutils1.5.2.tar.gz/download tar zxvf ndoutils1.5.2.tar.gz
cd ndoutils1.5.2./configure
If that is OK use make.make
If you see errors fly by you can check the config.log to verify the error and fix it before you go on.You will need to copy the NDOMOD and NDO2DB binaries to /usr/bin. Be sure to use these versions which are the correct ones for version 3.x of Nagios.
cp /tmp/ndoutils1.5.2/src/ndomod3x.o /usr/local/nagios/bin/ndomdo.o cp /tmp/ndoutils1.5.2/src/ndo2db3x /usr/local/nagios/bin/ndo2db
Create the database by moving into /opt/ndoutils1.4b9/db.
Copyright by Nagios Enterprises, LLC Cannot be reproduced without written permission. P.O. Box 8154, Saint Paul, MN 55108

Chapter 3: Configuration 72
u user for databasep password for userh localhostd database name you created
./installdb u nagios p your_password h localhost d nagios DBD::mysql::db do failed: Table 'nagios.nagios_dbversion' doesn't exist at ./installdb line 51. ** Creating tables for version 1.4b9 Using mysql.sql for installation... ** Updating table nagios_dbversion Done!
cp /tmp/ndoutils1.5.2/config/ndo2db.cfgsample /usr/local/nagios/etc/ndo2db.cfg
Edit /usr/local/nagios/etc/ndo2db.cfgEdit the user and database if you do not use a script
#db_user=ndouser #db_pass=ndopassword db_user=nagios db_pass=your_password
cp /opt/ndoutils1.5.2/config/ndomod.cfgsample /usr/local/nagios/etc/ndomod.cfg
Edit /usr/local/nagios/etc/nagios.cfg and add this line.
broker_module=/usr/local/nagios/bin/ndomod.o config_file=/usr/local/nagios/etc/ndomod.cfg
Start the daemon as the nagios user, not root. This should only be done if the daemon is not running. It should start when Nagios is restarted, however sometimes it fails to stop/start correctly.
/usr/local/nagios/bin/ndo2db c /usr/local/nagios/etc/ndo2db.cfg
Check for the process.
ps ef | grep ndo2db nagios 10192 1 0 08:21 ? 00:00:00 /usr/bin/ndo2db c /etc/nagios/ndo2db.cfg
Restart Nagios
Copyright by Nagios Enterprises, LLC Cannot be reproduced without written permission. P.O. Box 8154, Saint Paul, MN 55108
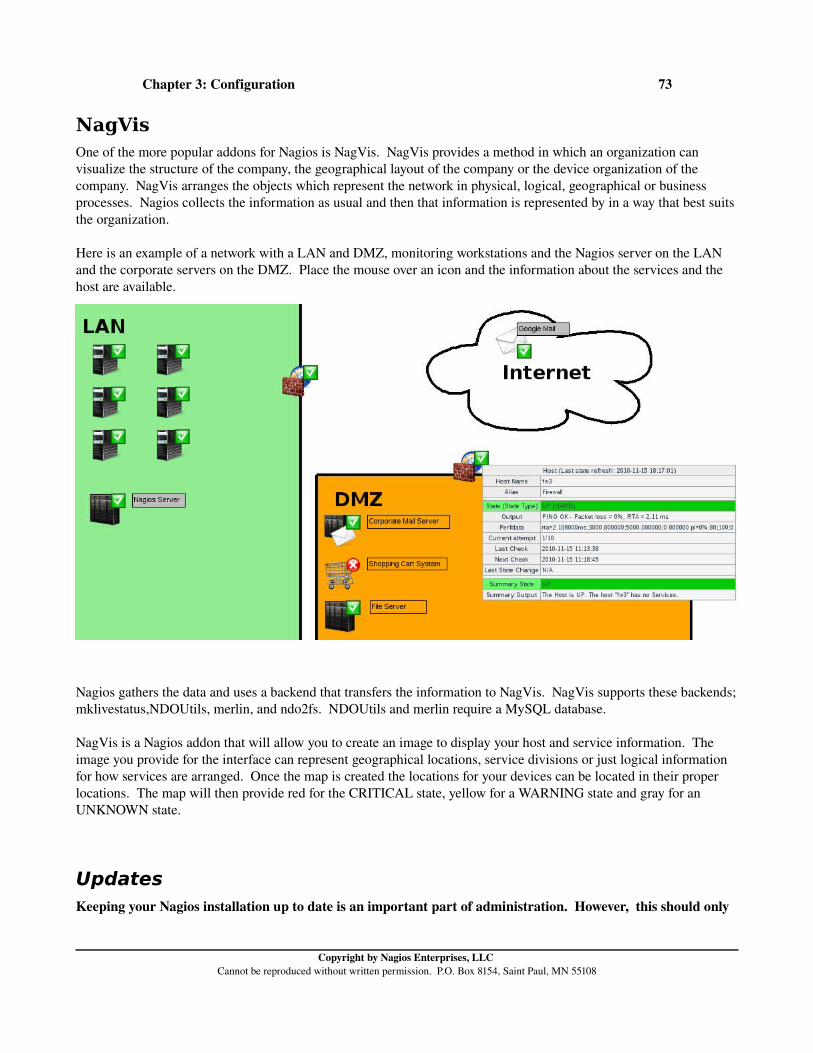
Chapter 3: Configuration 73
NagVisOne of the more popular addons for Nagios is NagVis. NagVis provides a method in which an organization can visualize the structure of the company, the geographical layout of the company or the device organization of the company. NagVis arranges the objects which represent the network in physical, logical, geographical or business processes. Nagios collects the information as usual and then that information is represented by in a way that best suits the organization.
Here is an example of a network with a LAN and DMZ, monitoring workstations and the Nagios server on the LAN and the corporate servers on the DMZ. Place the mouse over an icon and the information about the services and the host are available.
Nagios gathers the data and uses a backend that transfers the information to NagVis. NagVis supports these backends; mklivestatus,NDOUtils, merlin, and ndo2fs. NDOUtils and merlin require a MySQL database.
NagVis is a Nagios addon that will allow you to create an image to display your host and service information. The image you provide for the interface can represent geographical locations, service divisions or just logical information for how services are arranged. Once the map is created the locations for your devices can be located in their proper locations. The map will then provide red for the CRITICAL state, yellow for a WARNING state and gray for an UNKNOWN state.
UpdatesKeeping your Nagios installation up to date is an important part of administration. However, this should only
Copyright by Nagios Enterprises, LLC Cannot be reproduced without written permission. P.O. Box 8154, Saint Paul, MN 55108
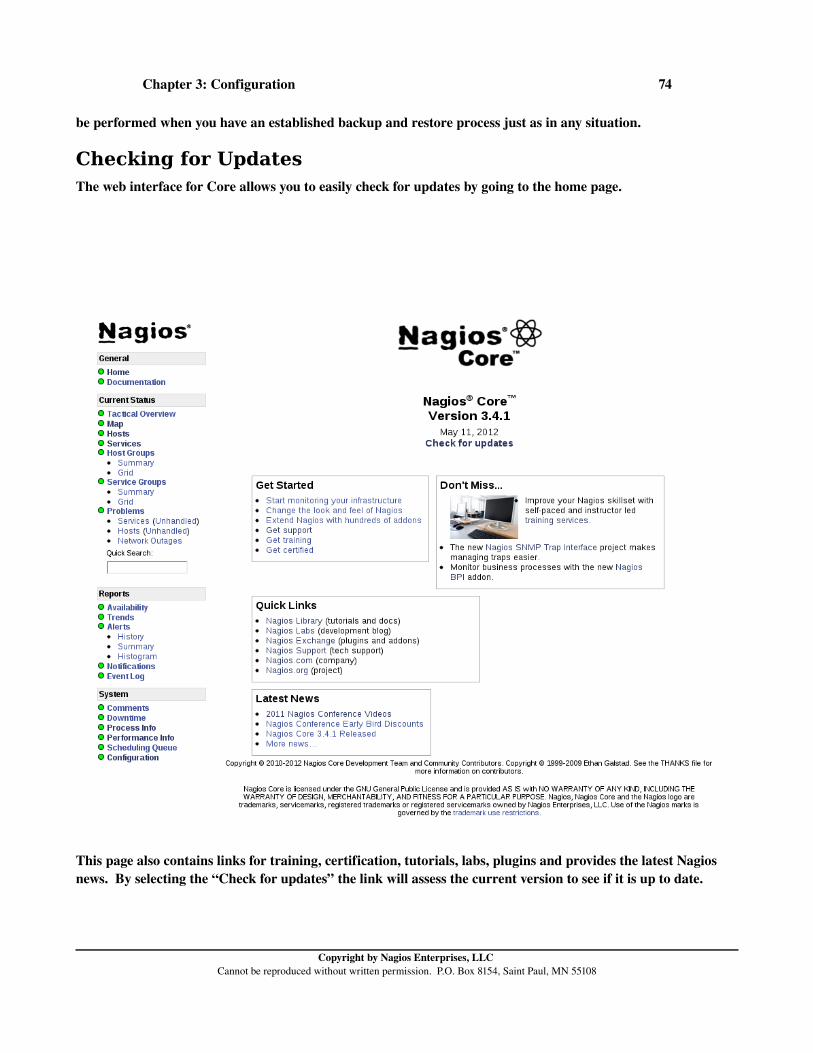
Chapter 3: Configuration 74
be performed when you have an established backup and restore process just as in any situation.
Checking for UpdatesThe web interface for Core allows you to easily check for updates by going to the home page.
This page also contains links for training, certification, tutorials, labs, plugins and provides the latest Nagios news. By selecting the “Check for updates” the link will assess the current version to see if it is up to date.
Copyright by Nagios Enterprises, LLC Cannot be reproduced without written permission. P.O. Box 8154, Saint Paul, MN 55108
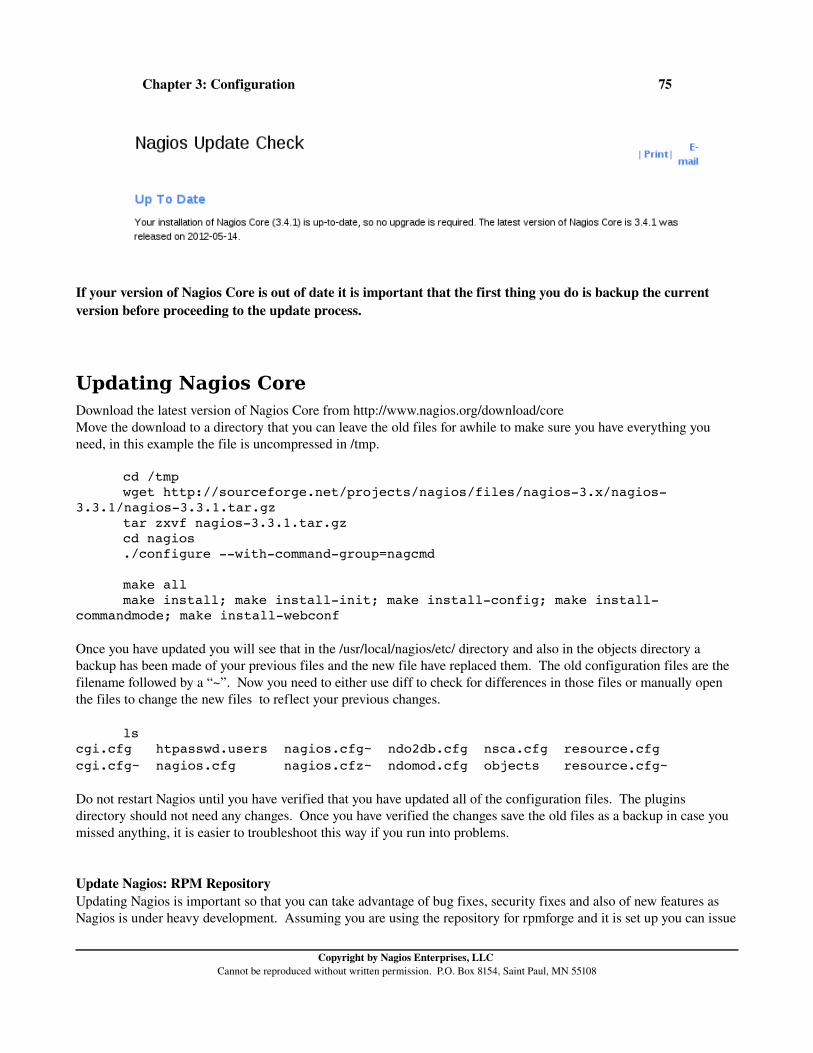
Chapter 3: Configuration 75
If your version of Nagios Core is out of date it is important that the first thing you do is backup the current version before proceeding to the update process.
Updating Nagios CoreDownload the latest version of Nagios Core from http://www.nagios.org/download/coreMove the download to a directory that you can leave the old files for awhile to make sure you have everything you need, in this example the file is uncompressed in /tmp.
cd /tmpwget http://sourceforge.net/projects/nagios/files/nagios3.x/nagios
3.3.1/nagios3.3.1.tar.gztar zxvf nagios3.3.1.tar.gz cd nagios ./configure withcommandgroup=nagcmd
make all make install; make installinit; make installconfig; make install
commandmode; make installwebconf
Once you have updated you will see that in the /usr/local/nagios/etc/ directory and also in the objects directory a backup has been made of your previous files and the new file have replaced them. The old configuration files are the filename followed by a “~”. Now you need to either use diff to check for differences in those files or manually open the files to change the new files to reflect your previous changes.
ls cgi.cfg htpasswd.users nagios.cfg~ ndo2db.cfg nsca.cfg resource.cfg cgi.cfg~ nagios.cfg nagios.cfz~ ndomod.cfg objects resource.cfg~
Do not restart Nagios until you have verified that you have updated all of the configuration files. The plugins directory should not need any changes. Once you have verified the changes save the old files as a backup in case you missed anything, it is easier to troubleshoot this way if you run into problems.
Update Nagios: RPM RepositoryUpdating Nagios is important so that you can take advantage of bug fixes, security fixes and also of new features as Nagios is under heavy development. Assuming you are using the repository for rpmforge and it is set up you can issue
Copyright by Nagios Enterprises, LLC Cannot be reproduced without written permission. P.O. Box 8154, Saint Paul, MN 55108

Chapter 3: Configuration 76
this command to update.
yum update y nagios
Updated: nagios.i386 0:3.2.21.el5.rf
Once it is updated you will find that you have files in the /etc/nagios directory that have rpmnew file endings. These are new config files that are available with the new version but they have not overwritten your old files. You will need to compare the files and move the settings from your old files to the new config files and then overwrite the old files. Of course, it make a lot of sense to get a backup of all files before you start making changes.
ls /etc/nagios cgi.cfg htpasswd.users nagios.cfg.rpmnew resource.cfg.rpmnew cgi.cfg.rpmnew nagios.cfg objects commandplugins.cfg nagios.cfg_bk resource.cfg
The diff command is a handy tool for looking for differences. When you compare the files sidebyside you can view differences as they have a “|” symbol to indicate differences or a “<” to indicate one file has a line and the other file does not. Here is an example of working through all the files that needed changing with an upgrade.
diff sidebyside cgi.cfg cgi.cfg.rpmnew Besides the version number this is the only difference. Note the difference is the addition of fred to these permissions. Note the difference and copy over to replace the old file.
authorized_for_all_services=nagiosadmin,fred | authorized_for_all_services=nagiosadmin authorized_for_all_hosts=nagiosadmin,fred | authorized_for_all_hosts=nagiosadmin
Add the changes and then: mv cgi.cfg.rpmnew cgi.cfg
diff sidebyside nagios.cfg nagios.cfg.rpmnew | less cfg_file=/etc/nagios/objects/hosts.cfg < cfg_file=/etc/nagios/objects/services.cfg <
Add the changes and then: mv nagios.cfg.rpmnew nagios.cfg
diff sidebyside resource.cfg resource.cfg.rpmnew # Sets $USER5$ for path to 64_bit plugins < $USER5$=/usr/lib64/nagios/plugins <
Add the changes to the new file and then: mv resource.cfg.rpmnew resource.cfg
cd /etc/nagios/objects ls commands.cfg contacts.cfg hosts.cfg printer.cfg switch.cfg timeperiods.cfg
Copyright by Nagios Enterprises, LLC Cannot be reproduced without written permission. P.O. Box 8154, Saint Paul, MN 55108

Chapter 3: Configuration 77
commands.cfg.rpmnew contacts.cfg_bk localhost.cfg services.cfg templates.cfg windows.cfg
diff sidebyside commands.cfg commands.cfg.rpmnew # NRPE Commands <
define command{ < command_name check_nrpe < command_line $USER1$/check_nrpe H $HOSTADDRESS$ < } <
define command{ < command_name check_nrpe2 < command_line $USER1$/check_nrpe H $HOSTADDRESS$ < } <
# SSH Commands < define command { < command_name check_ssh_disk < command_line $USER1$/check_by_ssh H $HOSTADDRESS$ < } < define command { < command_name check_ssh_load < command_line $USER1$/check_by_ssh H $HOSTADDRESS$ < } < define command { < command_name check_ssh_users < command_line $USER1$/check_by_ssh H $HOSTADDRESS$ < } < define command { < command_name check_multi_by_ssh < command_line $USER1$/check_by_ssh H $HOSTADDRESS$ < } <
Add the changes to the new file and then: mv commands.cfg.rpmnew commands.cfg
Now restart Nagios and check for errors.
Copyright by Nagios Enterprises, LLC Cannot be reproduced without written permission. P.O. Box 8154, Saint Paul, MN 55108

Chapter 3: Configuration 78
Copyright by Nagios Enterprises, LLC Cannot be reproduced without written permission. P.O. Box 8154, Saint Paul, MN 55108

Chapter 4: User Management 79
Chapter 4: User Management
Users and contacts can be separate functions within Nagios. Users are individual accounts that have access to the web interface. Contacts are users who will be sent notification if there are problems with hosts or services.
Authentication and PrivilegesThe authentication parameters in the cgi.cfg is a way to configure access so that the contacts that log in must match the hosts and services which they are responsible for. This eliminates them being able to access other hosts.
In order to provide access for a user to be able to see all computers and services on the Web Interface you will need to activate these two parameters on the /usr/local/nagios/etc/cgi.cfg (RPM repository /etc/nagios/cgi.cfg).
authorized_for_all_services=fredauthorized_for_all_hosts=fred
If you want to allow a user (like fred) to run any commands on the web interface even if they are not listed with permissions that match a service or host you will need to modify these two parameters.
authorized_for_all_service_commands=nagiosadmin,fredauthorized_for_all_host_commands=nagiosadmin,fred
If you wanted to set up configuration so that all users who authenticate to the web interface can do everything they choose, not recommended, then you would place a “*” at the end of each line for all users.
authorized_for_all_services=*authorized_for_all_hosts=*authorized_for_all_service_commands=*authorized_for_all_host_commands=*
AuthenticationAuthentication is the process that allows users to access the web interface. Authentication is controlled by the use of a database using the htpasswd command. The database, called htpasswd.users, is located in the /usr/local/nagios/etc directory (/etc/nagios if using the RPM repository). The name and location of the database is determined by the configuration options found in /etc/httpd/conf.d/nagios.conf. In this example, from a CentOS install, you can see that several directories require authentication from this database.
Copyright by Nagios Enterprises, LLC Cannot be reproduced without written permission. P.O. Box 8154, Saint Paul, MN 55108

Chapter 4: User Management 80
ScriptAlias /nagios/cgibin "/usr/local/nagios/sbin"
<Directory "/usr/local/nagios/sbin"> # SSLRequireSSL Options ExecCGI AllowOverride None Order allow,deny Allow from all # Order deny,allow # Deny from all # Allow from 127.0.0.1 AuthName "Nagios Access" AuthType Basic AuthUserFile /usr/local/nagios/etc/htpasswd.users Require validuser </Directory>
Alias /nagios "/usr/local/nagios/share"
<Directory "/usr/local/nagios/share"> # SSLRequireSSL Options None AllowOverride None Order allow,deny Allow from all # Order deny,allow # Deny from all # Allow from 127.0.0.1 AuthName "Nagios Access" AuthType Basic AuthUserFile /usr/local/nagios/etc/htpasswd.users Require validuser </Directory>
Access is maintained through the database but the permissions a user has once they authenticate are determined by contacts, contact groups and cgi permissions determined from the cgi.cfg file. An important point to remember when setting up permissions is that the contact is only able to see the host or services that they are responsible for by default. Make sure contact names match the user created for access to the web interface.
These settings represent the default settings in the cgi.cfg file for permissions to the web interface. The user “nagiosadmin” is the default nagios user with access and unlimited permissions to the web interface. The defaults demonstrate why it is so important to correctly set up the nagiosadmin user as part of the initial configuration.
use_authentication=1 use_ssl_authentication=0 #default_user_name=guest authorized_for_system_information=nagiosadmin authorized_for_configuration_information=nagiosadmin authorized_for_system_commands=nagiosadmin authorized_for_all_services=nagiosadmin authorized_for_all_hosts=nagiosadmin
Copyright by Nagios Enterprises, LLC Cannot be reproduced without written permission. P.O. Box 8154, Saint Paul, MN 55108

Chapter 4: User Management 81
authorized_for_all_service_commands=nagiosadmin authorized_for_all_host_commands=nagiosadmin #authorized_for_read_only=user1,user2
Scenario: Turn Off All AuthenticationTurning off all authentication is not recommended under any circumstances. It is only demonstrated here in order to aid in the understanding of how Nagios authentication works. These changes allow anyone to make changes to the Nagios interface, hosts and services.
Security TipWarning, this is a serious security issue and should not be implemented.
There are two steps required to turn off all security. Edit the cgi.cfg file located in /usr/local/nagios/etc (/etc/nagios if using the RPM repository) and change the “use_authentication” to a “0”.
use_authentication=0
The second step required is to access the /etc/httpd/conf.d/nagios.conf file and comment out the lines that require authentication for the Nagios directories.
ScriptAlias /nagios/cgibin "/usr/local/nagios/sbin"
<Directory "/usr/local/nagios/sbin"> # SSLRequireSSL Options ExecCGI AllowOverride None Order allow,deny Allow from all # Order deny,allow # Deny from all # Allow from 127.0.0.1 # AuthName "Nagios Access" # AuthType Basic # AuthUserFile /usr/local/nagios/etc/htpasswd.users # Require validuser </Directory>
Alias /nagios "/usr/local/nagios/share"
<Directory "/usr/local/nagios/share"> # SSLRequireSSL Options None AllowOverride None Order allow,deny Allow from all # Order deny,allow # Deny from all # Allow from 127.0.0.1
Copyright by Nagios Enterprises, LLC Cannot be reproduced without written permission. P.O. Box 8154, Saint Paul, MN 55108
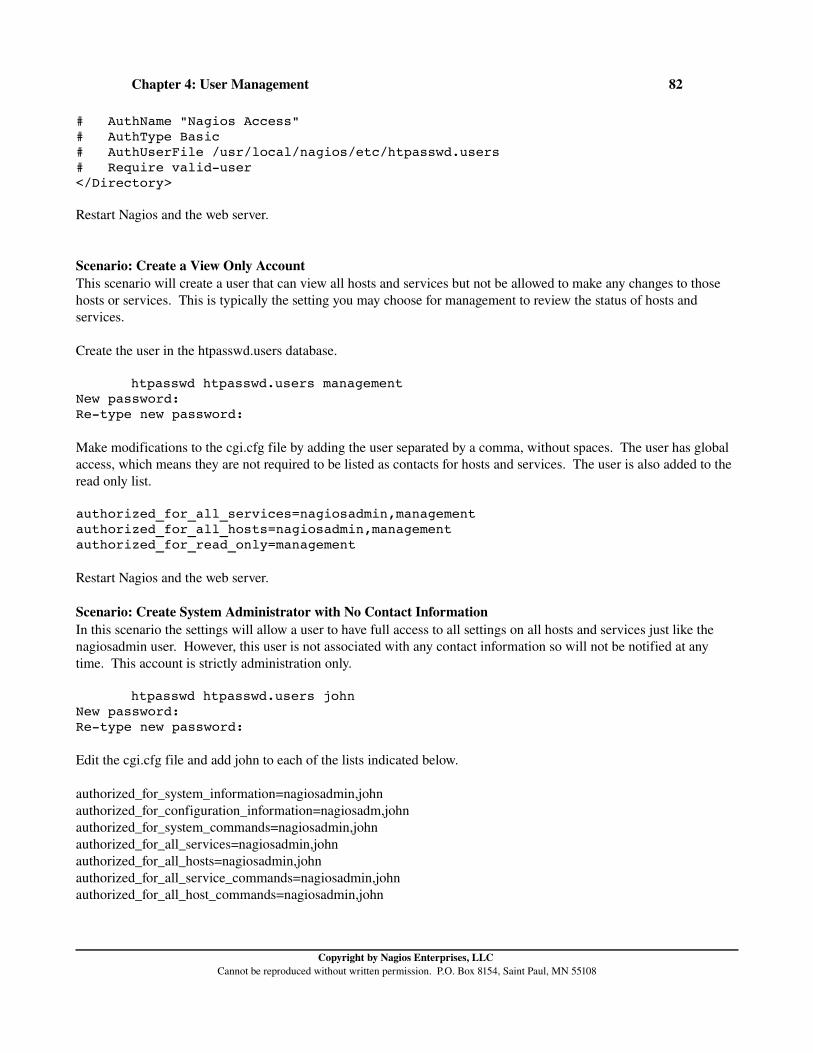
Chapter 4: User Management 82
# AuthName "Nagios Access" # AuthType Basic # AuthUserFile /usr/local/nagios/etc/htpasswd.users # Require validuser </Directory>
Restart Nagios and the web server.
Scenario: Create a View Only AccountThis scenario will create a user that can view all hosts and services but not be allowed to make any changes to those hosts or services. This is typically the setting you may choose for management to review the status of hosts and services.
Create the user in the htpasswd.users database.
htpasswd htpasswd.users management New password: Retype new password:
Make modifications to the cgi.cfg file by adding the user separated by a comma, without spaces. The user has global access, which means they are not required to be listed as contacts for hosts and services. The user is also added to the read only list.
authorized_for_all_services=nagiosadmin,management authorized_for_all_hosts=nagiosadmin,management authorized_for_read_only=management
Restart Nagios and the web server.
Scenario: Create System Administrator with No Contact InformationIn this scenario the settings will allow a user to have full access to all settings on all hosts and services just like the nagiosadmin user. However, this user is not associated with any contact information so will not be notified at any time. This account is strictly administration only.
htpasswd htpasswd.users john New password: Retype new password:
Edit the cgi.cfg file and add john to each of the lists indicated below.
authorized_for_system_information=nagiosadmin,johnauthorized_for_configuration_information=nagiosadm,johnauthorized_for_system_commands=nagiosadmin,johnauthorized_for_all_services=nagiosadmin,johnauthorized_for_all_hosts=nagiosadmin,johnauthorized_for_all_service_commands=nagiosadmin,john authorized_for_all_host_commands=nagiosadmin,john
Copyright by Nagios Enterprises, LLC Cannot be reproduced without written permission. P.O. Box 8154, Saint Paul, MN 55108
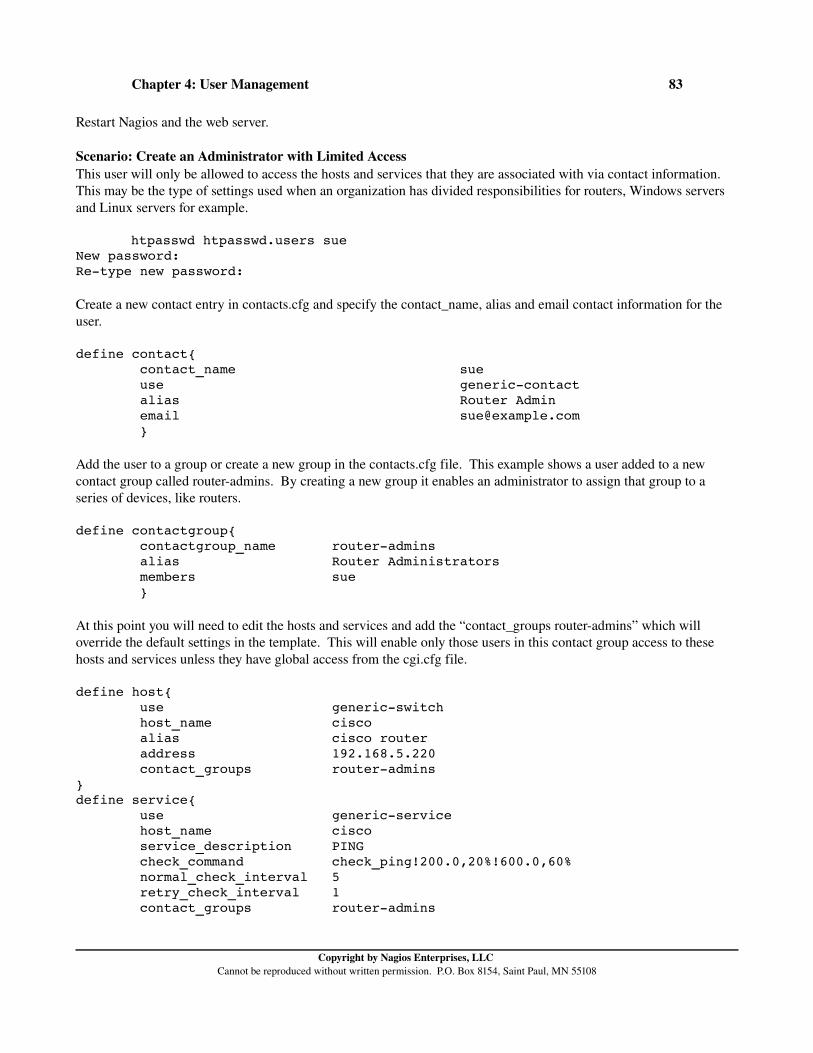
Chapter 4: User Management 83
Restart Nagios and the web server.
Scenario: Create an Administrator with Limited AccessThis user will only be allowed to access the hosts and services that they are associated with via contact information. This may be the type of settings used when an organization has divided responsibilities for routers, Windows servers and Linux servers for example.
htpasswd htpasswd.users sueNew password: Retype new password:
Create a new contact entry in contacts.cfg and specify the contact_name, alias and email contact information for the user.
define contact{ contact_name sue use genericcontact alias Router Admin email [email protected] }
Add the user to a group or create a new group in the contacts.cfg file. This example shows a user added to a new contact group called routeradmins. By creating a new group it enables an administrator to assign that group to a series of devices, like routers.
define contactgroup{ contactgroup_name routeradmins alias Router Administrators members sue }
At this point you will need to edit the hosts and services and add the “contact_groups routeradmins” which will override the default settings in the template. This will enable only those users in this contact group access to these hosts and services unless they have global access from the cgi.cfg file.
define host{ use genericswitch host_name cisco alias cisco router address 192.168.5.220 contact_groups routeradmins } define service{ use genericservice host_name cisco service_description PING check_command check_ping!200.0,20%!600.0,60% normal_check_interval 5 retry_check_interval 1 contact_groups routeradmins
Copyright by Nagios Enterprises, LLC Cannot be reproduced without written permission. P.O. Box 8154, Saint Paul, MN 55108

Chapter 4: User Management 84
}
Restart Nagios and the web server.
Notification Nagios provides the ability to notify administrators when problems develop. The key to working with Nagios on notifications is to avoid false alarms.
Notification is triggered when the max_check_attempts parameter has been reached and a HARD state has occurred. In other words, it is confirmed that the machine has moved from a functioning state to a broken state. So here is also a key to preventing false alarms, move the max_check_attempts for a service or host to a higher number so that it must check a number of times before it notifies administrators. Here is an example that requires 10 attempts.
max_check_attempts 10
Until the max_check_attempts has been reached, Nagios still considers this a SOFT state. The other important point here is that these 10 attempts must all return a CRITICAL status consecutively before a HARD state is reached. In other words, if you change to 10 as the max_check_attempts, the hard state is reached when it returns 10 CRITICAL states in a row.
The notification process flows through a number of filtering options that you can provide for a fine tuned set up.
System Wide Filtering Notifications can be turned on or off by editing the nagios.cfg file, “1” indicating that it is on and “0” indicating it should be off system wide. The default is to have it on.
enable_notifications=1
This setting will automatically take into account downtime which is scheduled in the web interface.
Service / Host Filtering Notifications are sent for host objects for d(down), u(unreachable), r(recovered), f(flappingup then down state) and now with Nagios 3 s(start of planned maintenance). Notifications are sent for service objects for c(critical), w(warning), u(unknown), r(recovered), f(flapping) and s(start planned maintenance). These options can be entered into the options line to select those options that you want notifications for.
notification_options=c,r
If you set notifications to n(none) or "0" it will not send notifications. Each host and service references a template, “use genericswitch”. The specific settings you enter into a host or service definition will override the template settings. In this example, this host will not send notifications regardless of the settings which are in the template and the global settings as well.
define host{ use genericswitch host_name zyxel
Copyright by Nagios Enterprises, LLC Cannot be reproduced without written permission. P.O. Box 8154, Saint Paul, MN 55108

Chapter 4: User Management 85
alias zyzel router notifications_enabled 0 address 192.168.5.79 }
Service GroupsYou will need to create a file called servicegroups.cfg and put an entry in nagios.cfg to indicate where it is. Note the entries are in pairs (first host, then service) “web,HTTP”.
# SERVICE GROUPS define servicegroup{ servicegroup_name webservice alias WebSites members web,HTTP ,web2,HTTP}
Host GroupsCreate an entry in nagios.cfg to the location of hostgroups.cfg.
define hostgroup{
hostgroup_name linuxweb alias LinuxSites hostgroup_members web }
The notification_period parameter allows you to set when these notifications should occur. Here are several examples of timeperiods. Note that time parameters must be defined in the timeperiods.cfg so that these can be used.
notification_period 24x7h
notification_period workhours
notification_period shift2
notification_period shift3
The notification_interval is an parameter that you can adjust so that you will be able to determine how often you will be notified of a situation. The default setting is in minutes. This example will notify the contacts every 60 minutes.
notification_interval 60
If you only wanted one notification sent you can set this parameter to “0”.
define host{
Copyright by Nagios Enterprises, LLC Cannot be reproduced without written permission. P.O. Box 8154, Saint Paul, MN 55108
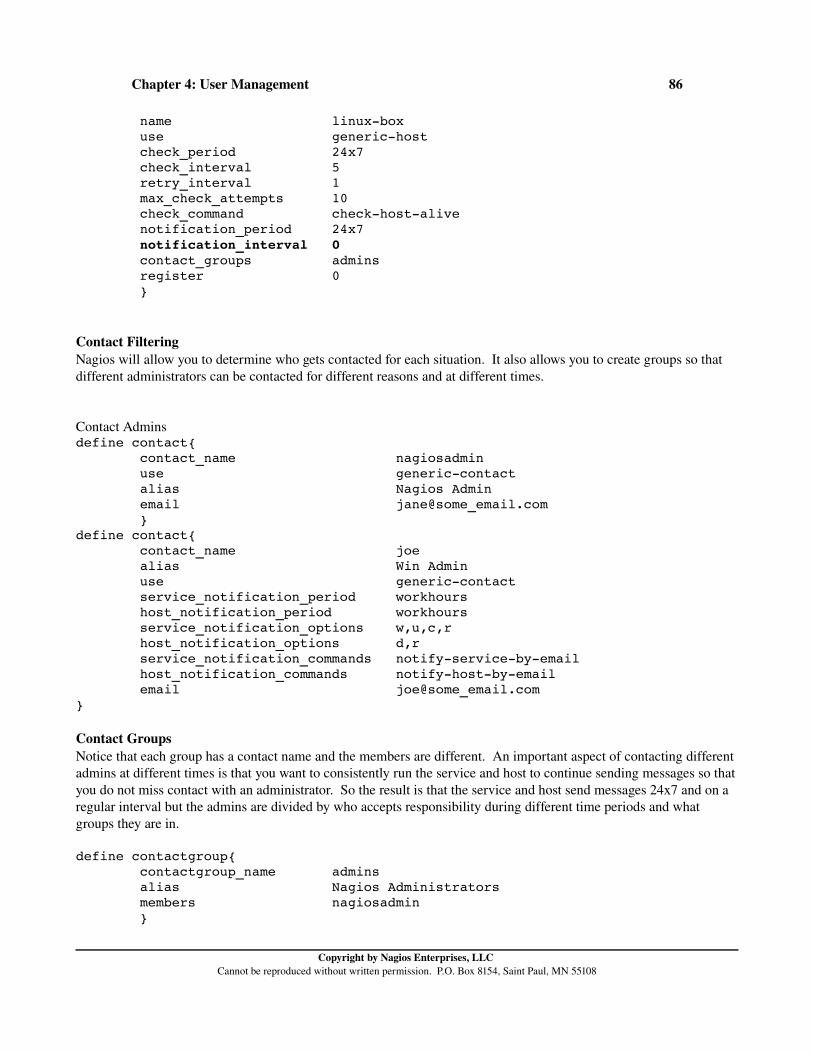
Chapter 4: User Management 86
name linuxbox use generichost check_period 24x7 check_interval 5 retry_interval 1 max_check_attempts 10 check_command checkhostalive notification_period 24x7 notification_interval 0 contact_groups admins register 0 }
Contact Filtering Nagios will allow you to determine who gets contacted for each situation. It also allows you to create groups so that different administrators can be contacted for different reasons and at different times.
Contact Admins define contact{ contact_name nagiosadmin use genericcontact alias Nagios Admin email jane@some_email.com } define contact{ contact_name joe alias Win Admin use genericcontact service_notification_period workhours host_notification_period workhours service_notification_options w,u,c,r host_notification_options d,r service_notification_commands notifyservicebyemail host_notification_commands notifyhostbyemail email joe@some_email.com }
Contact Groups Notice that each group has a contact name and the members are different. An important aspect of contacting different admins at different times is that you want to consistently run the service and host to continue sending messages so that you do not miss contact with an administrator. So the result is that the service and host send messages 24x7 and on a regular interval but the admins are divided by who accepts responsibility during different time periods and what groups they are in.
define contactgroup{ contactgroup_name admins alias Nagios Administrators members nagiosadmin }
Copyright by Nagios Enterprises, LLC Cannot be reproduced without written permission. P.O. Box 8154, Saint Paul, MN 55108

Chapter 4: User Management 87
define contactgroup{ contactgroup_name winadmins alias Windows Administrators members joe }
Here is an example of the many notification options that you have. Notice that the choices are spread widely over the whole spectrum of Nagios.
EscalationEscalation is a process in which if a solution is not produced for a host or service in a specified response time, the problem is referred to the next level. This of course implies that an organization will have a number of levels for administrators. It provides a way to focus resources on those who are capable of solving situations within a reasonable amount of time. Reasonable is determined by the significance of the host or service that is down.
Copyright by Nagios Enterprises, LLC Cannot be reproduced without written permission. P.O. Box 8154, Saint Paul, MN 55108

Chapter 4: User Management 88
In this example you can see the initial contact will be the Nagios administrators who will normally handle Nagios problems. Once the 5th message is sent out the problem is escalated to the Level 2 Engineers who will become the default notification. Once the 9th message is sent out it will be escalated to Level 3 Engineers who will become the default.
It is important to recognize in the example that Nagios does not measure response in time but rather in the number of messages that are sent out, which are measured on a time interval. The genericservice template for example will notify administrators every 60 minutes.
notification_interval 60
Messages are sent to contact groups so those groups and the administrators that are a part of those groups must be created.
Setting up the Contacts and Contact Groups
Create all of the users in the htpasswd.users file so they have access to the web interface. This will be important if one of the administrators leaves a message about the information they found on the problem.
cat htpasswd.users nagiosadmin:fTx/AJMMvBp22 fred:X8agiOot2dRzk management:0e/oiKAJS0Erc john:PwI3eSx5QDCp. sue:YDqeTdQIqn9tE jim:cW790LhQsU3v6 mark:MCCR2eMPWBx4Y tom:WK8dJ8ksJeNtU mary:y4ogaqxCr43OM ralph:zp5jafw5H2.wA
Edit the cgi.cfg file to provide the correct rights so your admins can all fix the same things.
authorized_for_system_information=nagiosadmin,john,sue,mark,tom,mary,ralph authorized_for_configuration_information=nagiosadmin,john,sue,mark,tom,mary,ralph authorized_for_system_commands=nagiosadmin,john,sue,mark,tom,mary,ralph authorized_for_all_services=nagiosadmin,management,john,sue,mark,tom,mary,ralph authorized_for_all_hosts=nagiosadmin,management,john,sue,mark,tom,mary,ralph authorized_for_all_service_commands=nagiosadmin,john,sue,mark,tom,mary,ralph authorized_for_all_host_commands=nagiosadmin,john,sue,mark,tom,mary,ralph
Create your contacts and provide them with email addresses.
define contact{ contact_name nagiosadmin use genericcontact alias Nagios Admin
Copyright by Nagios Enterprises, LLC Cannot be reproduced without written permission. P.O. Box 8154, Saint Paul, MN 55108

Chapter 4: User Management 89
email nagios@localhost } define contact{ contact_name sue use genericcontact alias Linux Admin email sue@localhost }
Define the needed contact groups with the appropriate admins.
define contactgroup{ contactgroup_name admins alias Nagios Administrators members nagiosadmin,sue,john } define contactgroup{ contactgroup_name engineer2 alias Linux Administrators members mark,tom } define contactgroup{ contactgroup_name engineer3 alias Linux Administrators members mary,ralph }
When you set up the notification process you can allow for overlap so that two contact groups could be working on the problem.
Create a new configuration file, or place this information in an existing file in the /usr/local/nagios/etc/objects.
Here you can see serviceescalation is defined. You will need the host, service_description and then when notification will start and end for this group. You also need to enter the notification_interval.
define serviceescalation { host_name bash service_description Procs first_notification 5 last_notification 8 notification_interval 60 contact_groups engineer2 } define serviceescalation { host_name bash service_description Procs first_notification 9 last_notification 12 notification_interval 60
Copyright by Nagios Enterprises, LLC Cannot be reproduced without written permission. P.O. Box 8154, Saint Paul, MN 55108

Chapter 4: User Management 90
contact_groups engineer3 }
If you create notification intervals which which overlap, Nagios will use the interval that is the smallest.
Once that is saved and Nagios is restarted you should be able to go to the web interface and select configuration/service escalations and see your changes.
When you use escalation_period it is important to realize that the notification_period is not removed, rather the escalation_period must intersect the notification_period. If you have a time period defined as 24x7 as the notification_period then anything you place in escalation_period will work. However, if the notification_period is a the 12x4, illustrated below, and the escalation_period is workhours, illustrated below, escalations only occur for where the two time periods intersect. So you would get escalations only from 09:0017:00 on MonThurs.
define timeperiod{ timeperiod_name 12x4 alias Tech Staff Hours monday 06:0018:00 tuesday 06:0018:00 wednesday 06:0018:00 thursday 06:0018:00 } define timeperiod{ timeperiod_name workhours alias Normal Work Hours monday 09:0017:00 tuesday 09:0017:00 wednesday 09:0017:00 thursday 09:0017:00 friday 09:0017:00 }
You may control the escalation time frame but you will always want to take into account the notification_period first. Here you can see the escalation_period is for workhours.
define serviceescalation { host_name localhost service_description Current Users first_notification 5 last_notification 8 notification_interval 60
Copyright by Nagios Enterprises, LLC Cannot be reproduced without written permission. P.O. Box 8154, Saint Paul, MN 55108

Chapter 4: User Management 91
escalation_period workhours contact_groups engineer2 } define serviceescalation { host_name localhost service_description Current Users first_notification 9 last_notification 12 notification_interval 60 escalation_period workhours contact_groups engineer3 }
There may be times when you want the escalation to continue until a resolution of the problem. If that is the case then the last_notification must be “0”. see the example. The final “last_notification” is changed to “0” instead of “12”.
define serviceescalation { host_name localhost service_description Current Users first_notification 5 last_notification 8 notification_interval 60 escalation_period workhours contact_groups engineer2 } define serviceescalation { host_name localhost service_description Current Users first_notification 9 last_notification 0 notification_interval 60 escalation_period workhours contact_groups engineer3 }
Another way to fine tune escalations is when you look at escalation_options. The options that are available are:
Service Optionsw warningu unknownc criticalr recoveredf flapping s scheduled maintenance
Host Optionsd downu unreachable
Copyright by Nagios Enterprises, LLC Cannot be reproduced without written permission. P.O. Box 8154, Saint Paul, MN 55108
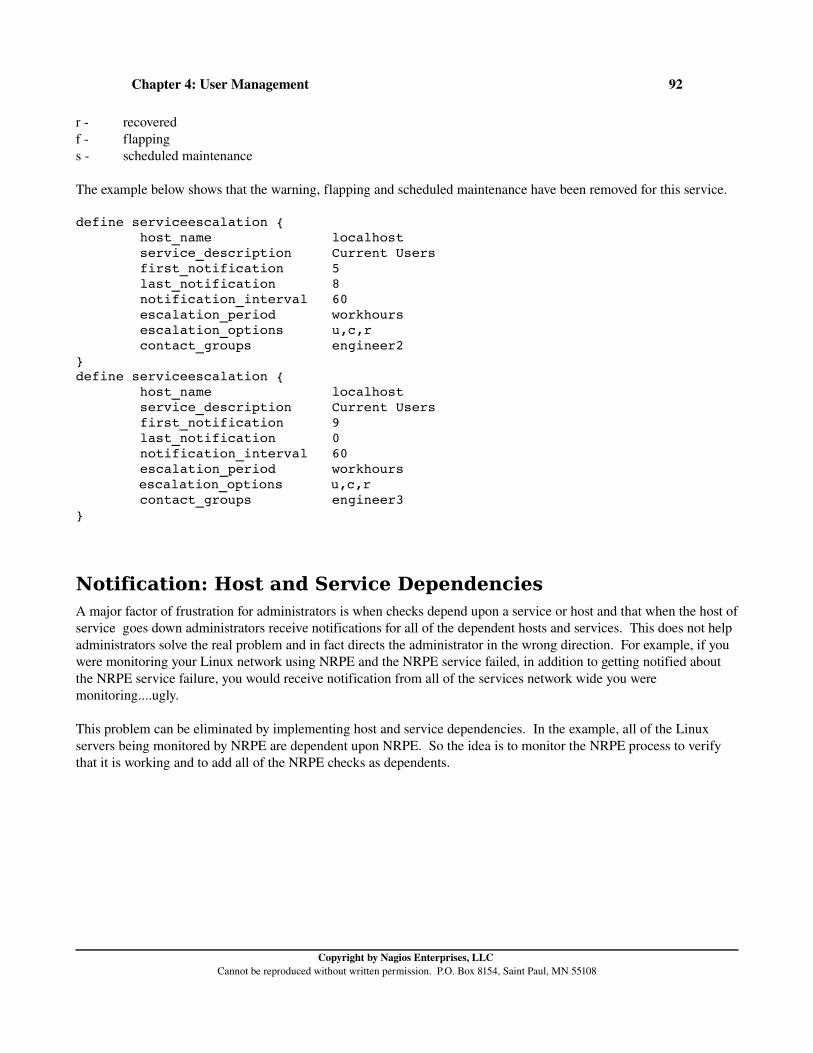
Chapter 4: User Management 92
r recoveredf flapping s scheduled maintenance
The example below shows that the warning, flapping and scheduled maintenance have been removed for this service.
define serviceescalation { host_name localhost service_description Current Users first_notification 5 last_notification 8 notification_interval 60 escalation_period workhours escalation_options u,c,r contact_groups engineer2 } define serviceescalation { host_name localhost service_description Current Users first_notification 9 last_notification 0 notification_interval 60 escalation_period workhours
escalation_options u,c,r contact_groups engineer3 }
Notification: Host and Service DependenciesA major factor of frustration for administrators is when checks depend upon a service or host and that when the host of service goes down administrators receive notifications for all of the dependent hosts and services. This does not help administrators solve the real problem and in fact directs the administrator in the wrong direction. For example, if you were monitoring your Linux network using NRPE and the NRPE service failed, in addition to getting notified about the NRPE service failure, you would receive notification from all of the services network wide you were monitoring....ugly.
This problem can be eliminated by implementing host and service dependencies. In the example, all of the Linux servers being monitored by NRPE are dependent upon NRPE. So the idea is to monitor the NRPE process to verify that it is working and to add all of the NRPE checks as dependents.
Copyright by Nagios Enterprises, LLC Cannot be reproduced without written permission. P.O. Box 8154, Saint Paul, MN 55108

Chapter 4: User Management 93
The first thing you need to do is create a command definition for checking the NRPE process. Here a simple command will determine if the process is functioning correctly.
define command { command_name nrpe_verify command_line $USER1$/check_nrpe H $HOSTADDRESS$}
Next you need to create a service definition.
define service{ host_name bash service_description NRPE check_command nrpe_verify}
You will need to set up the service or host dependencies which are related. Here you can see that the one server has listed 5 services which are dependent upon NRPE.
##### Dependency Checks #####define servicedependency{ host_name bash service_description NRPE dependent_host_name bash
Copyright by Nagios Enterprises, LLC Cannot be reproduced without written permission. P.O. Box 8154, Saint Paul, MN 55108

Chapter 4: User Management 94
dependent_service_description DNS,Load,Mailq,NTP,Procs notification_failure_criteria c,u execution_failure_criteria n}
By setting up these dependencies it will eliminate the unnecessary notifications.
Copyright by Nagios Enterprises, LLC Cannot be reproduced without written permission. P.O. Box 8154, Saint Paul, MN 55108

Chapter 5: Public Ports 95
Chapter 5: Public Ports
Possibly the greatest advantage of using public ports for monitoring is that they do not require an agent to be placed on the client. In addition, in most cases they do not require modifications to the firewall.
Public ports are ports that are freely accessible, like ports for a web server (80), FTP server (21) or mail server (25). Public ports can be monitored by anyone! When a service is started on a server that is a public service, everyone has access to the public port unless firewall rules prevent it.
Monitoring public ports may not provide all of the detail that is desired about internal metrics. Typically, monitoring internal aspects of a machine requires an agent to be installed on the client. The only way to monitor internal aspects of a machine is to install an agent, meaning a piece of software that functions as a daemon allowing connections from the Nagios server so that internal plugins or scripts may be executed and that information recorded and provided to the Nagios server on connection. Here are several agents that can be used:
SSH – the daemon allows connections from the Nagios server and returns information generated by plugins or scripts
NSCLient++ this agent is installed on a Windows server or workstation so that commands executed on the Windows machine can generated information and return that information to the Nagios server when the Nagios server connects to the Windows machine
NRPE (Nagios Remote Plugin Executor) – the NRPE agent is installed on the remote machine to allow Nagios to connect and obtain information generated by plugins that have executed internally or scripts that have executed
Copyright by Nagios Enterprises, LLC Cannot be reproduced without written permission. P.O. Box 8154, Saint Paul, MN 55108
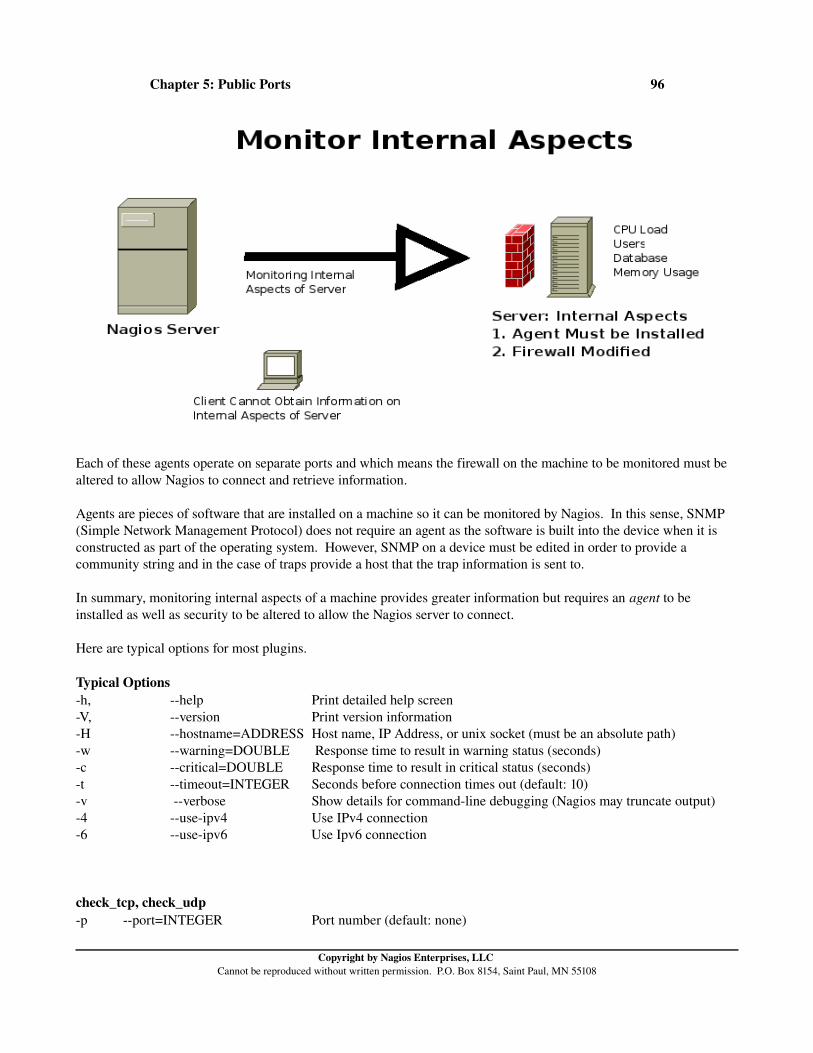
Chapter 5: Public Ports 96
Each of these agents operate on separate ports and which means the firewall on the machine to be monitored must be altered to allow Nagios to connect and retrieve information.
Agents are pieces of software that are installed on a machine so it can be monitored by Nagios. In this sense, SNMP (Simple Network Management Protocol) does not require an agent as the software is built into the device when it is constructed as part of the operating system. However, SNMP on a device must be edited in order to provide a community string and in the case of traps provide a host that the trap information is sent to.
In summary, monitoring internal aspects of a machine provides greater information but requires an agent to be installed as well as security to be altered to allow the Nagios server to connect.
Here are typical options for most plugins.
Typical Optionsh, help Print detailed help screen V, version Print version information H hostname=ADDRESS Host name, IP Address, or unix socket (must be an absolute path) w warning=DOUBLE Response time to result in warning status (seconds) c critical=DOUBLE Response time to result in critical status (seconds) t timeout=INTEGER Seconds before connection times out (default: 10) v verbose Show details for commandline debugging (Nagios may truncate output) 4 useipv4 Use IPv4 connection 6 useipv6 Use Ipv6 connection
check_tcp, check_udpp port=INTEGER Port number (default: none)
Copyright by Nagios Enterprises, LLC Cannot be reproduced without written permission. P.O. Box 8154, Saint Paul, MN 55108
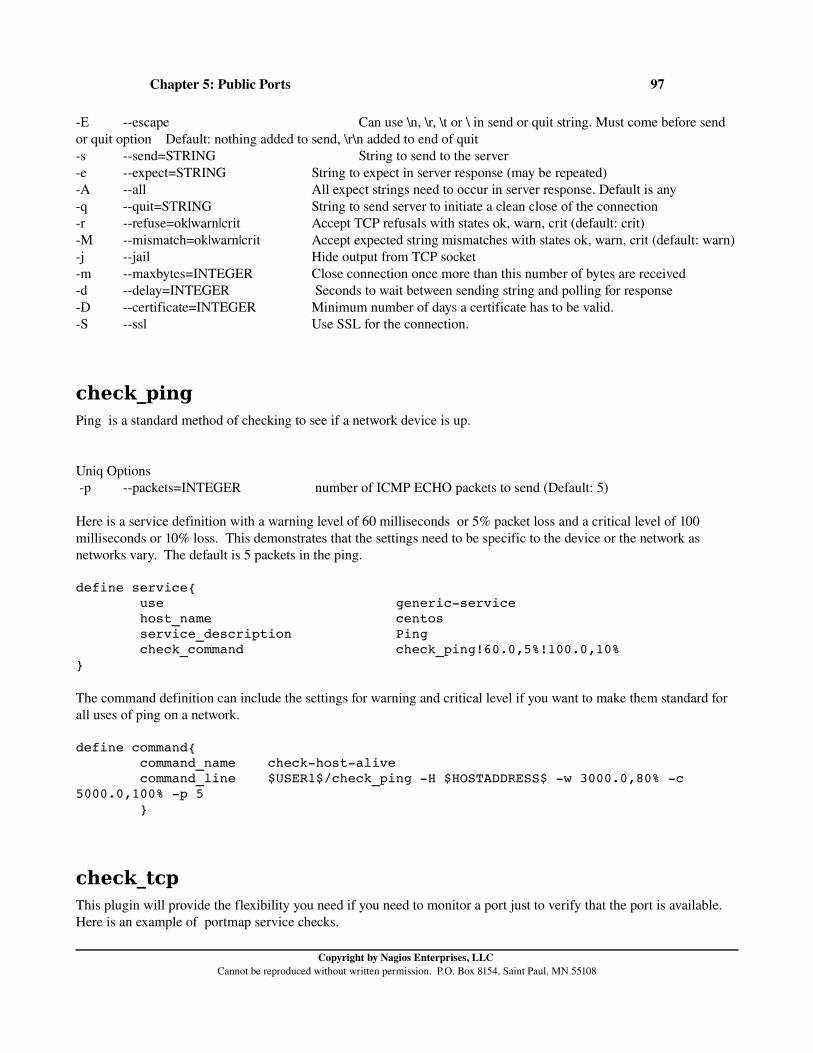
Chapter 5: Public Ports 97
E escape Can use \n, \r, \t or \ in send or quit string. Must come before send or quit option Default: nothing added to send, \r\n added to end of quit s send=STRING String to send to the server e expect=STRING String to expect in server response (may be repeated) A all All expect strings need to occur in server response. Default is any q quit=STRING String to send server to initiate a clean close of the connection r refuse=ok|warn|crit Accept TCP refusals with states ok, warn, crit (default: crit) M mismatch=ok|warn|crit Accept expected string mismatches with states ok, warn, crit (default: warn) j jail Hide output from TCP socket m maxbytes=INTEGER Close connection once more than this number of bytes are received d delay=INTEGER Seconds to wait between sending string and polling for response D certificate=INTEGER Minimum number of days a certificate has to be valid. S ssl Use SSL for the connection.
check_pingPing is a standard method of checking to see if a network device is up.
Uniq Options p packets=INTEGER number of ICMP ECHO packets to send (Default: 5)
Here is a service definition with a warning level of 60 milliseconds or 5% packet loss and a critical level of 100 milliseconds or 10% loss. This demonstrates that the settings need to be specific to the device or the network as networks vary. The default is 5 packets in the ping.
define service{ use genericservice host_name centos service_description Ping check_command check_ping!60.0,5%!100.0,10% }
The command definition can include the settings for warning and critical level if you want to make them standard for all uses of ping on a network.
define command{ command_name checkhostalive command_line $USER1$/check_ping H $HOSTADDRESS$ w 3000.0,80% c 5000.0,100% p 5 }
check_tcpThis plugin will provide the flexibility you need if you need to monitor a port just to verify that the port is available. Here is an example of portmap service checks.
Copyright by Nagios Enterprises, LLC Cannot be reproduced without written permission. P.O. Box 8154, Saint Paul, MN 55108

Chapter 5: Public Ports 98
define service{ use genericservice host_name centos service_description Portmap check_command check_tcp! 111 }
define command{ command_name check_tcp command_line $USER1$/check_tcp H $HOSTADDRESS$ p $ARG1$ $ARG2$ }
Note that a common problem with check_tcp is that often the “p” is added to the service definition. This will create the error “Port must be a positive integer” if the command definition already has the “p”.
If you have any problems run the command from the command line to experiment.
./check_tcp H 192.168.5.1 p 111 TCP OK 0.000 second response time on port 111|time=0.000386s;;;0.000000;10.000000
check_smtpMail server communication on port 25 which is SMTP, Simple Mail Transfer Protocol. In order to check to see if the mail server is able to communicate with other mail server check port 25.
Uniq Optionsp port=INTEGER Port number (default: 25) e expect=STRING String to expect in first line of server response (default: '220') C command=STRING SMTP command (may be used repeatedly) R command=STRING Expected response to command (may be used repeatedly) f from=STRING FROMaddress to include in MAIL command, required by Exchange 2000 F fqdn=STRING FQDN used for HELO D certificate=INTEGER Minimum number of days a certificate has to be valid. S starttls Use STARTTLS for the connection. A authtype=STRING SMTP AUTH type to check (default none, only LOGIN supported) U authuser=STRING SMTP AUTH username P authpass=STRING SMTP AUTH password
Here are two examples of service checks, one default on port 25 and the other on port 587.
define service{ use genericservice host_name centos service_description SMTP check_command check_smtp } define service{ use genericservice
Copyright by Nagios Enterprises, LLC Cannot be reproduced without written permission. P.O. Box 8154, Saint Paul, MN 55108
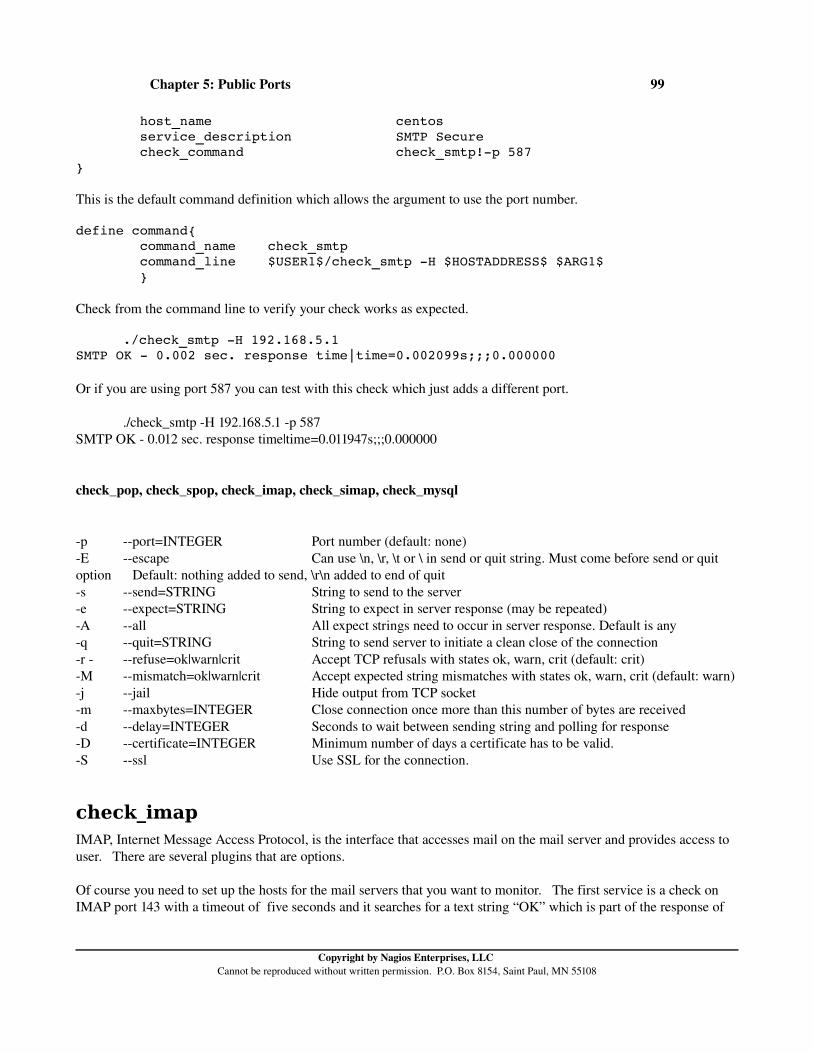
Chapter 5: Public Ports 99
host_name centos service_description SMTP Secure check_command check_smtp!p 587 }
This is the default command definition which allows the argument to use the port number.
define command{ command_name check_smtp command_line $USER1$/check_smtp H $HOSTADDRESS$ $ARG1$ }
Check from the command line to verify your check works as expected.
./check_smtp H 192.168.5.1 SMTP OK 0.002 sec. response time|time=0.002099s;;;0.000000
Or if you are using port 587 you can test with this check which just adds a different port.
./check_smtp H 192.168.5.1 p 587 SMTP OK 0.012 sec. response time|time=0.011947s;;;0.000000
check_pop, check_spop, check_imap, check_simap, check_mysql
p port=INTEGER Port number (default: none) E escape Can use \n, \r, \t or \ in send or quit string. Must come before send or quit option Default: nothing added to send, \r\n added to end of quit s send=STRING String to send to the server e expect=STRING String to expect in server response (may be repeated) A all All expect strings need to occur in server response. Default is any q quit=STRING String to send server to initiate a clean close of the connection r refuse=ok|warn|crit Accept TCP refusals with states ok, warn, crit (default: crit) M mismatch=ok|warn|crit Accept expected string mismatches with states ok, warn, crit (default: warn) j jail Hide output from TCP socket m maxbytes=INTEGER Close connection once more than this number of bytes are received d delay=INTEGER Seconds to wait between sending string and polling for response D certificate=INTEGER Minimum number of days a certificate has to be valid. S ssl Use SSL for the connection.
check_imapIMAP, Internet Message Access Protocol, is the interface that accesses mail on the mail server and provides access to user. There are several plugins that are options.
Of course you need to set up the hosts for the mail servers that you want to monitor. The first service is a check on IMAP port 143 with a timeout of five seconds and it searches for a text string “OK” which is part of the response of
Copyright by Nagios Enterprises, LLC Cannot be reproduced without written permission. P.O. Box 8154, Saint Paul, MN 55108
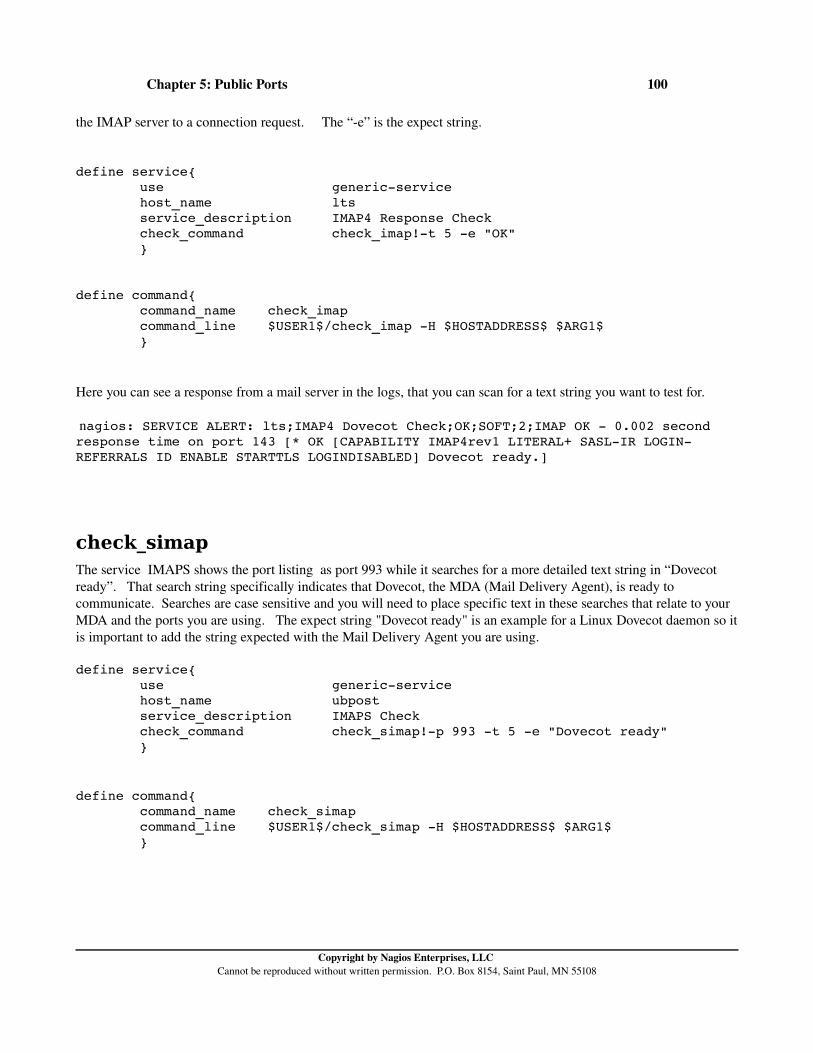
Chapter 5: Public Ports 100
the IMAP server to a connection request. The “e” is the expect string.
define service{ use genericservice host_name lts service_description IMAP4 Response Check check_command check_imap!t 5 e "OK" }
define command{ command_name check_imap command_line $USER1$/check_imap H $HOSTADDRESS$ $ARG1$ }
Here you can see a response from a mail server in the logs, that you can scan for a text string you want to test for.
nagios: SERVICE ALERT: lts;IMAP4 Dovecot Check;OK;SOFT;2;IMAP OK 0.002 second response time on port 143 [* OK [CAPABILITY IMAP4rev1 LITERAL+ SASLIR LOGINREFERRALS ID ENABLE STARTTLS LOGINDISABLED] Dovecot ready.]
check_simapThe service IMAPS shows the port listing as port 993 while it searches for a more detailed text string in “Dovecot ready”. That search string specifically indicates that Dovecot, the MDA (Mail Delivery Agent), is ready to communicate. Searches are case sensitive and you will need to place specific text in these searches that relate to your MDA and the ports you are using. The expect string "Dovecot ready" is an example for a Linux Dovecot daemon so it is important to add the string expected with the Mail Delivery Agent you are using.
define service{ use genericservice host_name ubpost service_description IMAPS Check check_command check_simap!p 993 t 5 e "Dovecot ready" }
define command{ command_name check_simap command_line $USER1$/check_simap H $HOSTADDRESS$ $ARG1$ }
Copyright by Nagios Enterprises, LLC Cannot be reproduced without written permission. P.O. Box 8154, Saint Paul, MN 55108
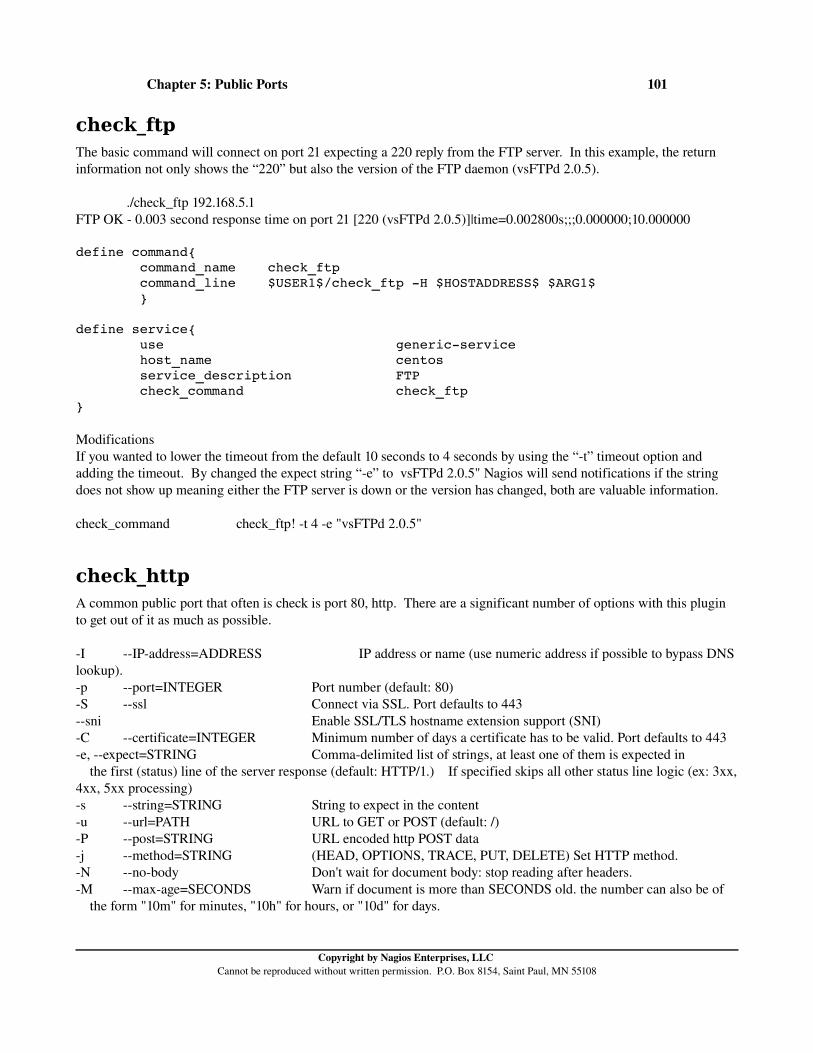
Chapter 5: Public Ports 101
check_ftpThe basic command will connect on port 21 expecting a 220 reply from the FTP server. In this example, the return information not only shows the “220” but also the version of the FTP daemon (vsFTPd 2.0.5).
./check_ftp 192.168.5.1 FTP OK 0.003 second response time on port 21 [220 (vsFTPd 2.0.5)]|time=0.002800s;;;0.000000;10.000000
define command{ command_name check_ftp command_line $USER1$/check_ftp H $HOSTADDRESS$ $ARG1$ }
define service{ use genericservice host_name centos service_description FTP check_command check_ftp }
ModificationsIf you wanted to lower the timeout from the default 10 seconds to 4 seconds by using the “t” timeout option and adding the timeout. By changed the expect string “e” to vsFTPd 2.0.5" Nagios will send notifications if the string does not show up meaning either the FTP server is down or the version has changed, both are valuable information.
check_command check_ftp! t 4 e "vsFTPd 2.0.5"
check_httpA common public port that often is check is port 80, http. There are a significant number of options with this plugin to get out of it as much as possible.
I IPaddress=ADDRESS IP address or name (use numeric address if possible to bypass DNS lookup). p port=INTEGER Port number (default: 80) S ssl Connect via SSL. Port defaults to 443 sni Enable SSL/TLS hostname extension support (SNI) C certificate=INTEGER Minimum number of days a certificate has to be valid. Port defaults to 443 e, expect=STRING Commadelimited list of strings, at least one of them is expected in the first (status) line of the server response (default: HTTP/1.) If specified skips all other status line logic (ex: 3xx, 4xx, 5xx processing) s string=STRING String to expect in the content u url=PATH URL to GET or POST (default: /) P post=STRING URL encoded http POST data j method=STRING (HEAD, OPTIONS, TRACE, PUT, DELETE) Set HTTP method. N nobody Don't wait for document body: stop reading after headers. M maxage=SECONDS Warn if document is more than SECONDS old. the number can also be of the form "10m" for minutes, "10h" for hours, or "10d" for days.
Copyright by Nagios Enterprises, LLC Cannot be reproduced without written permission. P.O. Box 8154, Saint Paul, MN 55108

Chapter 5: Public Ports 102
T contenttype=STRING specify ContentType header media type when POSTing l linespan Allow regex to span newlines (must precede r or R) r regex, ereg=STRING Search page for regex STRING R eregi=STRING Search page for caseinsensitive regex STRING invertregex Return CRITICAL if found, OK if not a authorization=AUTH_PAIR Username:password on sites with basic authentication b proxyauthorization=AUTH_PAIR Username:password on proxyservers with basic authentication A useragent=STRING String to be sent in http header as "User Agent" k header=STRING Any other tags to be sent in http header. Use multiple times for additional headers L link Wrap output in HTML link (obsoleted by urlize) f onredirect=<ok|warning|critical|follow|sticky|stickyport> m, pagesize=INTEGER<:INTEGER> Minimum page size required (bytes) : Maximum page size required (bytes)
This is the standard way to use the check_http. It checks to verify communication is available on port 80 of a web server. This is in fact, a better check on the server than the check_ping which can only determine if the server is up. This simple check provides some peace of mind and a place to start.
define service{ use genericservice host_name centos service_description HTTP check_command check_http }
These two checks are related to the SSL options with the web server. Note that the checks change to port 443 if you use the ssl option, they are testing to see if the web server can serve secure pages and if the web server certificate is valid for the next 21 days. The first check will test for a response within a limited time frame, 5 seconds for a warning or more than 10 seconds for a critical state.
define service{ use genericservice host_name centos service_description Secure HTTP check_command check_http! w 5 c 10 ssl }
This check is focused on the certificate. In this example, if the certificate is good for more than 21 days an “OK” is returned. A warning state is triggered if the certificate has less than 21 days before it expires. A critical state is triggered when the certificate has expired.
define service{ use genericservice host_name centos service_description Certificate check_command check_http! C 21 }
Both of the service checks above will return the following output in the Nagios web interface. OK Certificate will expire on 05/25/2012 23:59.
Copyright by Nagios Enterprises, LLC Cannot be reproduced without written permission. P.O. Box 8154, Saint Paul, MN 55108
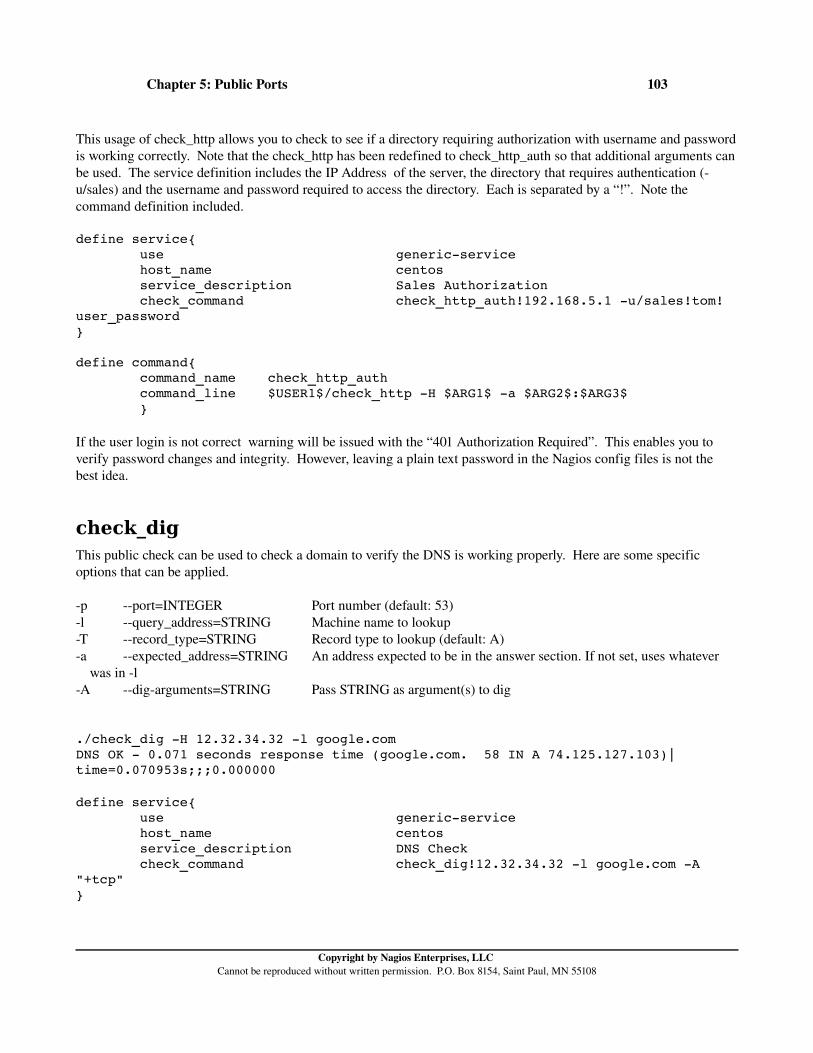
Chapter 5: Public Ports 103
This usage of check_http allows you to check to see if a directory requiring authorization with username and password is working correctly. Note that the check_http has been redefined to check_http_auth so that additional arguments can be used. The service definition includes the IP Address of the server, the directory that requires authentication (u/sales) and the username and password required to access the directory. Each is separated by a “!”. Note the command definition included.
define service{ use genericservice host_name centos service_description Sales Authorization check_command check_http_auth!192.168.5.1 u/sales!tom!user_password}
define command{ command_name check_http_auth command_line $USER1$/check_http H $ARG1$ a $ARG2$:$ARG3$ }
If the user login is not correct warning will be issued with the “401 Authorization Required”. This enables you to verify password changes and integrity. However, leaving a plain text password in the Nagios config files is not the best idea.
check_digThis public check can be used to check a domain to verify the DNS is working properly. Here are some specific options that can be applied.
p port=INTEGER Port number (default: 53) l query_address=STRING Machine name to lookup T record_type=STRING Record type to lookup (default: A) a expected_address=STRING An address expected to be in the answer section. If not set, uses whatever was in l A digarguments=STRING Pass STRING as argument(s) to dig
./check_dig H 12.32.34.32 l google.com DNS OK 0.071 seconds response time (google.com. 58 IN A 74.125.127.103)|time=0.070953s;;;0.000000
define service{ use genericservice host_name centos service_description DNS Check check_command check_dig!12.32.34.32 l google.com A "+tcp" }
Copyright by Nagios Enterprises, LLC Cannot be reproduced without written permission. P.O. Box 8154, Saint Paul, MN 55108

Chapter 5: Public Ports 104
define command{ command_name check_dig command_line $USER1$/check_dig H $HOSTADDRESS$ }
Here is the output you should see in the Nagios interface.DNS OK 0.109 seconds response time (www.google.com. 454959 IN CNAME www.l.google.com.)
; <<>> DiG 9.3.6P1RedHat9.3.64.P1.el5_4.2 <<>> google.com MX ;; global options: printcmd ;; Got answer: ;; >>HEADER<< opcode: QUERY, status: NOERROR, id: 29329 ;; flags: qr rd ra; QUERY: 1, ANSWER: 4, AUTHORITY: 4, ADDITIONAL: 5
;; QUESTION SECTION: ;google.com. IN MX
;; ANSWER SECTION: google.com. 900 IN MX 200 google.com.s9a2.psmtp.com. google.com. 900 IN MX 300 google.com.s9b1.psmtp.com. google.com. 900 IN MX 400 google.com.s9b2.psmtp.com. google.com. 900 IN MX 100 google.com.s9a1.psmtp.com.
;; AUTHORITY SECTION: google.com. 262905 IN NS ns4.google.com. google.com. 262905 IN NS ns1.google.com. google.com. 262905 IN NS ns2.google.com. google.com. 262905 IN NS ns3.google.com.
;; ADDITIONAL SECTION: google.com.s9a1.psmtp.com. 8652 IN A 74.125.148.10 ns1.google.com. 30575 IN A 216.239.32.10 ns2.google.com. 30575 IN A 216.239.34.10 ns3.google.com. 30575 IN A 216.239.36.10 ns4.google.com. 30575 IN A 216.239.38.10
;; Query time: 78 msec ;; SERVER: 12.32.36.123#53(12.32.36.123) ;; WHEN: Fri Nov 12 07:01:31 2010 ;; MSG SIZE rcvd: 314
Copyright by Nagios Enterprises, LLC Cannot be reproduced without written permission. P.O. Box 8154, Saint Paul, MN 55108
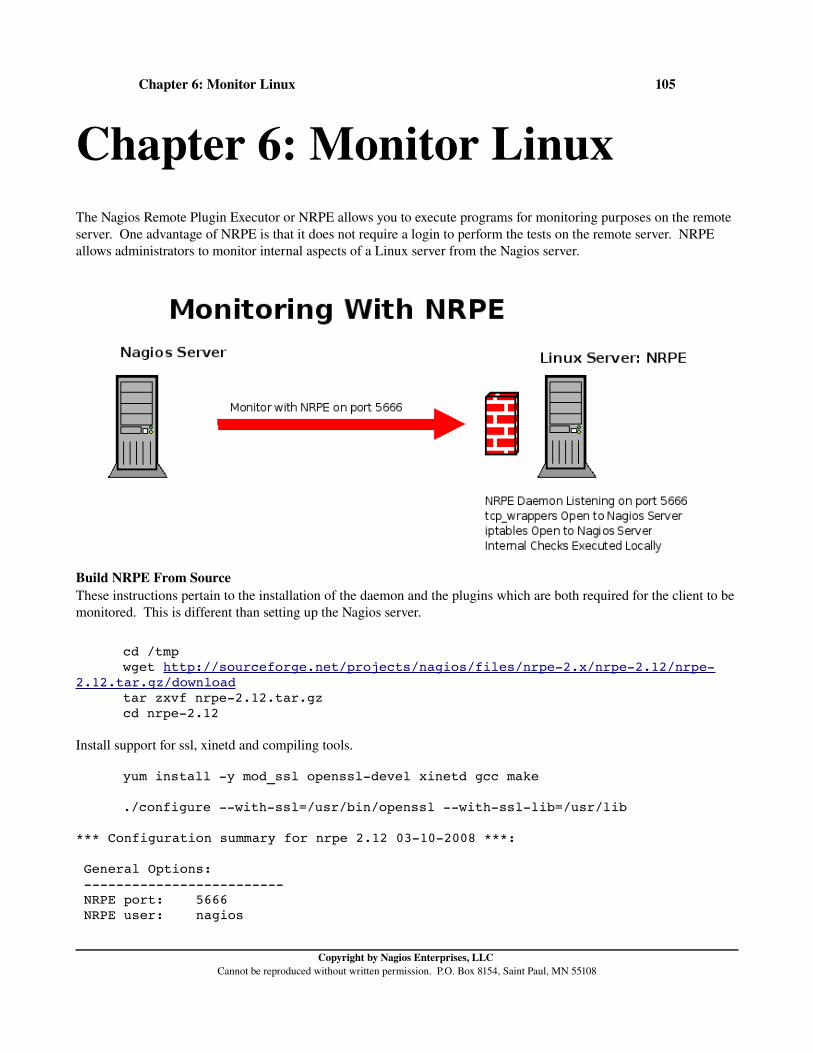
Chapter 6: Monitor Linux 105
Chapter 6: Monitor LinuxThe Nagios Remote Plugin Executor or NRPE allows you to execute programs for monitoring purposes on the remote server. One advantage of NRPE is that it does not require a login to perform the tests on the remote server. NRPE allows administrators to monitor internal aspects of a Linux server from the Nagios server.
Build NRPE From SourceThese instructions pertain to the installation of the daemon and the plugins which are both required for the client to be monitored. This is different than setting up the Nagios server.
cd /tmpwget http://sourceforge.net/projects/nagios/files/nrpe2.x/nrpe2.12/nrpe
2.12.tar.gz/download tar zxvf nrpe2.12.tar.gz
cd nrpe2.12
Install support for ssl, xinetd and compiling tools.
yum install y mod_ssl openssldevel xinetd gcc make
./configure withssl=/usr/bin/openssl withssllib=/usr/lib
*** Configuration summary for nrpe 2.12 03102008 ***:
General Options: NRPE port: 5666 NRPE user: nagios
Copyright by Nagios Enterprises, LLC Cannot be reproduced without written permission. P.O. Box 8154, Saint Paul, MN 55108
Chapter 6: Monitor Linux 106
NRPE group: nagios Nagios user: nagios Nagios group: nagios
makemake install make installplugin make installdaemon make installdaemonconfig make installxinetd
Alternative Install with RPM Respository
On the remote host you must install the plugins for Nagios.
yum install y nagiosplugins nagiospluginsnrpe nagiosnrpe
NRPE ConceptsNRPE is able to perform two types of checks, Direct and Indirect. In Direct checks the Nagios server executes check_nrpe which then connects to the NRPE daemon which is running on the client. The NRPE daemon then will execute the command that was requested from the Nagios server. This command could execute a plugin locally as is illustrated in the example. The command could also execute any script on the client whether it be a bash shell script, a Perl script or any other type of script.
The example also illustrates that NRPE can be used to execute Indirect checks. This may be a situation where the Nagios server has access to the client but not the web server that needs to be monitored. However, the client may have access to the web server. So in this example, the Nagios server executes a plugin or script on the client which in turn monitors another box on the network, thus Nagios is indirectly monitoring the web server.
Copyright by Nagios Enterprises, LLC Cannot be reproduced without written permission. P.O. Box 8154, Saint Paul, MN 55108

Chapter 6: Monitor Linux 107
Install the Daemon xinetd A daemon, or service, is a background process that performs a specific function. Originally all daemons started at boot time, running in the background and providing services when called upon. However, as the number of daemons grew, the resources that these daemons took up increased and began slowing down the server so developers began looking for a way to limit the number of daemons that run on a system. The daemon inetd was developed to help manage other daemons by listening for requests in their behalf. When a request was received for a daemon managed by inetd it was then notified and started up to respond. This has saved considerable resources on servers and it has increased the interest in superdaemons and methods of reducing resources.
The xinetd superdaemon has replaced inetd on most Linux distributions today. xinetd has become more popular because of security restrictions that can be placed on those who access the daemons managed by xinetd. xinetd also provides better protection from denial of service attacks, better log management, and more flexibility. Both inetd and xinetd only work with daemons that provide connections over a network.
You will need to install xinetd and make sure you have a file in /etc/xinetd.d called nrpe on the client and it looks like this:
# default: off # description: NRPE (Nagios Remote Plugin Executor) service nrpe { flags = REUSE type = UNLISTED port = 5666
Copyright by Nagios Enterprises, LLC Cannot be reproduced without written permission. P.O. Box 8154, Saint Paul, MN 55108

Chapter 6: Monitor Linux 108
socket_type = stream wait = no user = nagios group = nagios server = /usr/sbin/nrpe server_args = c /usr/local/nagios/etc/nrpe.cfg inetd log_on_failure += USERID disable = no only_from = 127.0.0.1 192.168.5.50 }
These are the two most important lines. The “only_from” line allows you to determine which machines can monitor this server using NRPE, this is where you will enter the IP Address for the Nagios server as well as the localhost.
disable = no only_from = 127.0.0.1 192.168.5.50
Edit /etc/services and add this line:
nrpe 5666/tcp # Nagios Remote Monitoring
Restart xinetd and view the log at /var/log/daemon.log
service xinetd restarttail /var/log/daemon.log
Look for errors to correct.
Edit the /usr/local/nagios/etc/nrpe.cfg (RPM respository /etc/nagios/nrpe.cfg).The basic plugins that are running for you initially are these listed below. Note the path will be different if you installed using the RPM repository.
command[check_users]=/usr/local/nagios/libexec/check_users w 5 c 10 command[check_load]=/usr/local/nagios/libexec/check_load w 15,10,5 c 30,25,20 command[check_hda1]=/usr/local/nagios/libexec/check_disk w 20 c 10 p /dev/hda1 command[check_zombie_procs]=/usr/local/nagios/libexec/check_procs w 5 c 10 s Z command[check_total_procs]=/usr/local/nagios/libexec/check_procs w 150 c 200
Change ownership on the /usr/local/nagios/etc/nrpe.cfg (RPM repository /etc/nagios/nrpe.cfg) file so that nagios is able to read the file.
chown nagios /usr/local/nagios/etc/nrpe.cfg
Be sure the firewall on the host allows the Nagios server IP Address to access the client on port 5666, TCP.
Copyright by Nagios Enterprises, LLC Cannot be reproduced without written permission. P.O. Box 8154, Saint Paul, MN 55108
Chapter 6: Monitor Linux 109
This completes the basic configuration of the host that you will monitor.
Set Up the Nagios ServerOnce the remote host has been set up, configure the Nagios monitoring server by installing the NRPE plugin.
NRPE From SourceThese instructions pertain to the installation of the plugin only, which is different than that of the client to be monitored. NRPE plugins only, need to be installed on the Nagios server.
cd /tmpwget http://sourceforge.net/projects/nagios/files/nrpe2.x/nrpe2.12/nrpe
2.12.tar.gz/download tar zxvf nrpe2.12.tar.gz
cd nrpe2.12
Install support for ssl and compiling tools.
yum install y mod_ssl openssldevel gcc make
./configure withssl=/usr/bin/openssl withssllib=/usr/lib
*** Configuration summary for nrpe 2.12 03102008 ***:
General Options: NRPE port: 5666 NRPE user: nagios NRPE group: nagios Nagios user: nagios Nagios group: nagios
makemake install make installplugin
Alternative Install from RPM Repository
yum install y nagiospluginsnrpe
Do a Manual Check of the Remote HostIn order to verify that the remote host is functioning correctly perform a manual check. Remember to allow port 5666/tcp on the remote host.
/usr/local/nagios/libexec/./check_nrpe H 192.168.5.49 c check_users(RPM repository /usr/lib/nagios/plugins/./check_nrpe H 192.168.5.49 c check_users )USERS OK 2 users currently logged in |users=2;5;10;0
Copyright by Nagios Enterprises, LLC Cannot be reproduced without written permission. P.O. Box 8154, Saint Paul, MN 55108

Chapter 6: Monitor Linux 110
If you see output that is similar it is functioning correctly.
Create the Host FilesCreate a host entry for each remote box you will monitor. This example is using the linuxserver template, be sure to check that template out to verify the settings are the ones you want to use.
define host{ use linuxserver host_name centos alias Base address 192.168.5.178 }
Configure ServicesEach service you want to monitor on the remote host must be entered individually. Here is an example of monitoring CPU load on the host “centos”. Note: The “service_description” should be entered carefully as you may decide to use other addons for Nagios that are case sensitive to the names of the services. The check_nrpe command is used to access the remote server and then execute the Nagios plugin that is on the remote server and retrieve the information.
define service{ use genericservice host_name centos service_description CPU Load check_command check_nrpe!check_load }
Once this is complete you must restart your nagios server with:
service nagios restart
Correct any errors that appear.
Check the connection by running the following command and using the IP Address of the remote box you want to monitor. You should get the return “NRPE v2.8.1” if all is working.
/usr/local/nagios/libexec/./check_nrpe H 192.168.5.178 NRPE v2.8.1
If you get this return then you have communication between the Nagios monitoring server and the remote host.
Create the NRPE Command DefinitionBefore you can execute commands for NRPE on the Nagios server you will need to edit the commands.cfg and define the commands for NRPE.
# NRPE Commands
Copyright by Nagios Enterprises, LLC Cannot be reproduced without written permission. P.O. Box 8154, Saint Paul, MN 55108

Chapter 6: Monitor Linux 111
define command{ command_name check_nrpe command_line $USER1$/check_nrpe H $HOSTADDRESS$ c $ARG1$ }
Configure the Checks On the Nagios server you can monitor all of the defaults by placing the information in your services file.
define service{ use genericservice host_name centos service_description CPU Load check_command check_nrpe!check_load }
Once you have added these to your server restart Nagios and you should see that they are working.
Modifying NRPEBy default there are several commands that are preconfigured for NRPE in the /usr/local/nagios/etc/nrpe.cfg file. They are listed here.
command[check_users]=/usr/local/nagios/libexec/check_users w 5 c 10 command[check_load]=/usr/local/nagios/libexec/check_load w 15,10,5 c 30,25,20 command[check_hda1]=/usr/local/nagios/libexec/check_disk w 20 c 10 p /dev/hda1 command[check_zombie_procs]=/usr/local/nagios/libexec/check_procs w 5 c 10 s Z command[check_total_procs]=/usr/local/nagios/libexec/check_procs w 150 c 200
In order to add additional commands you will need to construct them in the same format and add them to this file. If any changes are made the xinetd daemon must be restarted.
Copyright by Nagios Enterprises, LLC Cannot be reproduced without written permission. P.O. Box 8154, Saint Paul, MN 55108

Chapter 6: Monitor Linux 112
Copyright by Nagios Enterprises, LLC Cannot be reproduced without written permission. P.O. Box 8154, Saint Paul, MN 55108
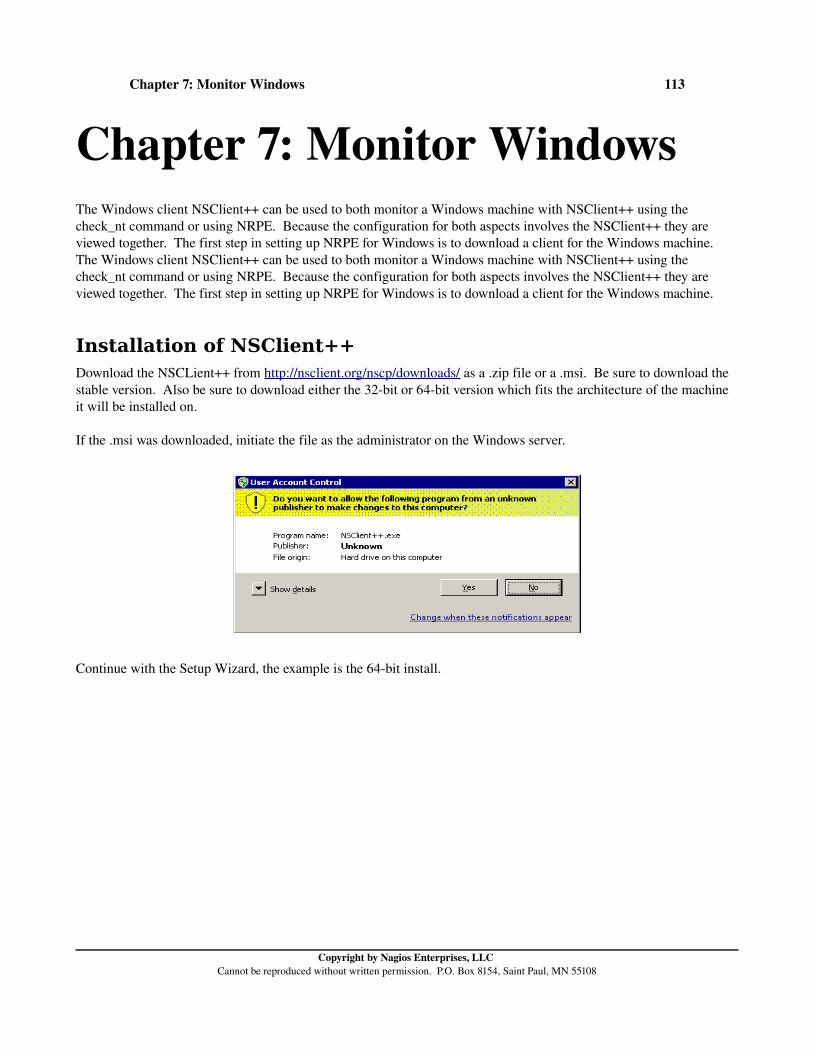
Chapter 7: Monitor Windows 113
Chapter 7: Monitor WindowsThe Windows client NSClient++ can be used to both monitor a Windows machine with NSClient++ using the check_nt command or using NRPE. Because the configuration for both aspects involves the NSClient++ they are viewed together. The first step in setting up NRPE for Windows is to download a client for the Windows machine. The Windows client NSClient++ can be used to both monitor a Windows machine with NSClient++ using the check_nt command or using NRPE. Because the configuration for both aspects involves the NSClient++ they are viewed together. The first step in setting up NRPE for Windows is to download a client for the Windows machine.
Installation of NSClient++Download the NSCLient++ from http://nsclient.org/nscp/downloads/ as a .zip file or a .msi. Be sure to download the stable version. Also be sure to download either the 32bit or 64bit version which fits the architecture of the machine it will be installed on.
If the .msi was downloaded, initiate the file as the administrator on the Windows server.
Continue with the Setup Wizard, the example is the 64bit install.
Copyright by Nagios Enterprises, LLC Cannot be reproduced without written permission. P.O. Box 8154, Saint Paul, MN 55108
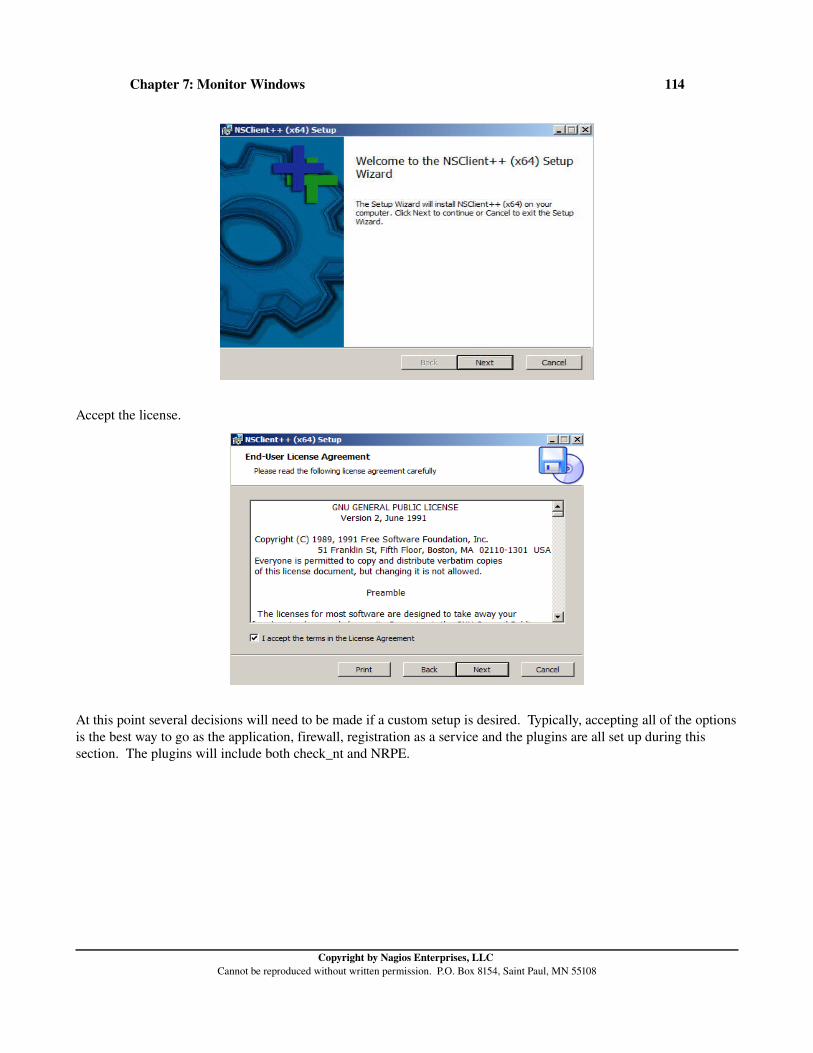
Chapter 7: Monitor Windows 114
Accept the license.
At this point several decisions will need to be made if a custom setup is desired. Typically, accepting all of the options is the best way to go as the application, firewall, registration as a service and the plugins are all set up during this section. The plugins will include both check_nt and NRPE.
Copyright by Nagios Enterprises, LLC Cannot be reproduced without written permission. P.O. Box 8154, Saint Paul, MN 55108
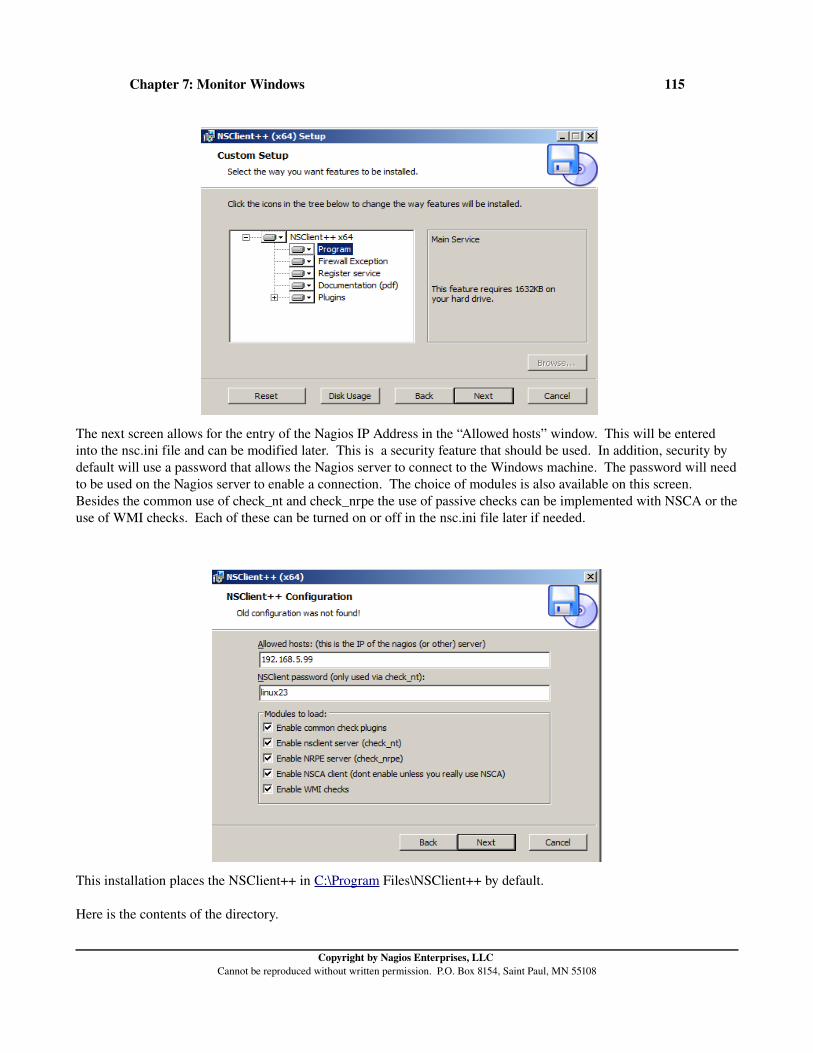
Chapter 7: Monitor Windows 115
The next screen allows for the entry of the Nagios IP Address in the “Allowed hosts” window. This will be entered into the nsc.ini file and can be modified later. This is a security feature that should be used. In addition, security by default will use a password that allows the Nagios server to connect to the Windows machine. The password will need to be used on the Nagios server to enable a connection. The choice of modules is also available on this screen. Besides the common use of check_nt and check_nrpe the use of passive checks can be implemented with NSCA or the use of WMI checks. Each of these can be turned on or off in the nsc.ini file later if needed.
This installation places the NSClient++ in C:\Program Files\NSClient++ by default.
Here is the contents of the directory.
Copyright by Nagios Enterprises, LLC Cannot be reproduced without written permission. P.O. Box 8154, Saint Paul, MN 55108

Chapter 7: Monitor Windows 116
The settings which occur during install should allow check_nt to connect once the nsclient daemon is started on the Windows server.
NSClient++ and check_ntThe check_nt plugin is a standard plugin that is available and ready to go once install is complete. The modules which are used for check_nt are listed below.
[modules] FileLogger.dll CheckSystem.dll CheckDisk.dll NSClientListener.dllCheckEventLog.dll
The msi installation uses the allowed_hosts in the global section. If additional restrictions were required the NSClient section has an allowed_hosts line which takes precedence over the global settings.
[NSClient]allowed_hosts=192.168.4.3
check_net pluginThe check_nt plugin on the Nagios Server is the standard plugin that is used with NSClient++ and is a plugin included in the nagiosplugins install.
H host addressv command that is executedp port, this port is often changed to 12489w integer warning integerc integer critical integerl use a parameterd option, the d SHOWFAIL option shows only checks that fail, the d SHOWALL will show alls password sent to Windows servert timeout, default is 10 seconds
Copyright by Nagios Enterprises, LLC Cannot be reproduced without written permission. P.O. Box 8154, Saint Paul, MN 55108
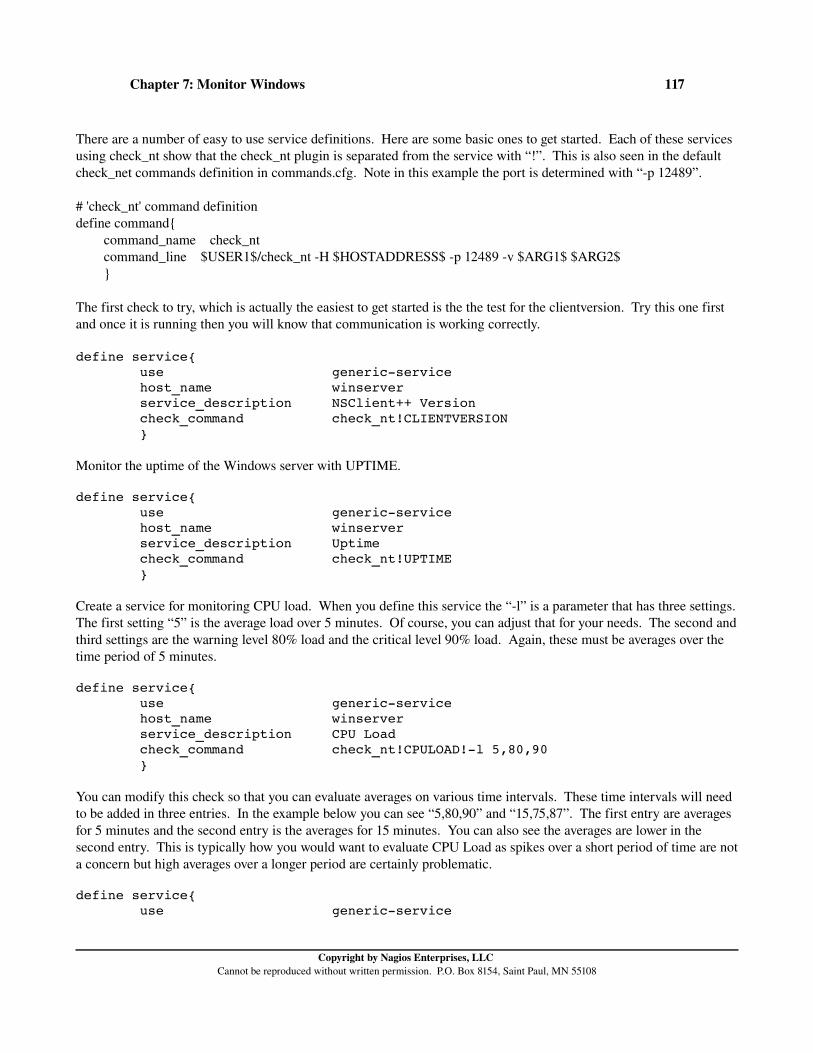
Chapter 7: Monitor Windows 117
There are a number of easy to use service definitions. Here are some basic ones to get started. Each of these services using check_nt show that the check_nt plugin is separated from the service with “!”. This is also seen in the default check_net commands definition in commands.cfg. Note in this example the port is determined with “p 12489”.
# 'check_nt' command definition define command{ command_name check_nt command_line $USER1$/check_nt H $HOSTADDRESS$ p 12489 v $ARG1$ $ARG2$ }
The first check to try, which is actually the easiest to get started is the the test for the clientversion. Try this one first and once it is running then you will know that communication is working correctly.
define service{ use genericservice host_name winserver service_description NSClient++ Version check_command check_nt!CLIENTVERSION }
Monitor the uptime of the Windows server with UPTIME.
define service{ use genericservice host_name winserver service_description Uptime check_command check_nt!UPTIME }
Create a service for monitoring CPU load. When you define this service the “l” is a parameter that has three settings. The first setting “5” is the average load over 5 minutes. Of course, you can adjust that for your needs. The second and third settings are the warning level 80% load and the critical level 90% load. Again, these must be averages over the time period of 5 minutes.
define service{ use genericservice host_name winserver service_description CPU Load check_command check_nt!CPULOAD!l 5,80,90 }
You can modify this check so that you can evaluate averages on various time intervals. These time intervals will need to be added in three entries. In the example below you can see “5,80,90” and “15,75,87”. The first entry are averages for 5 minutes and the second entry is the averages for 15 minutes. You can also see the averages are lower in the second entry. This is typically how you would want to evaluate CPU Load as spikes over a short period of time are not a concern but high averages over a longer period are certainly problematic.
define service{ use genericservice
Copyright by Nagios Enterprises, LLC Cannot be reproduced without written permission. P.O. Box 8154, Saint Paul, MN 55108
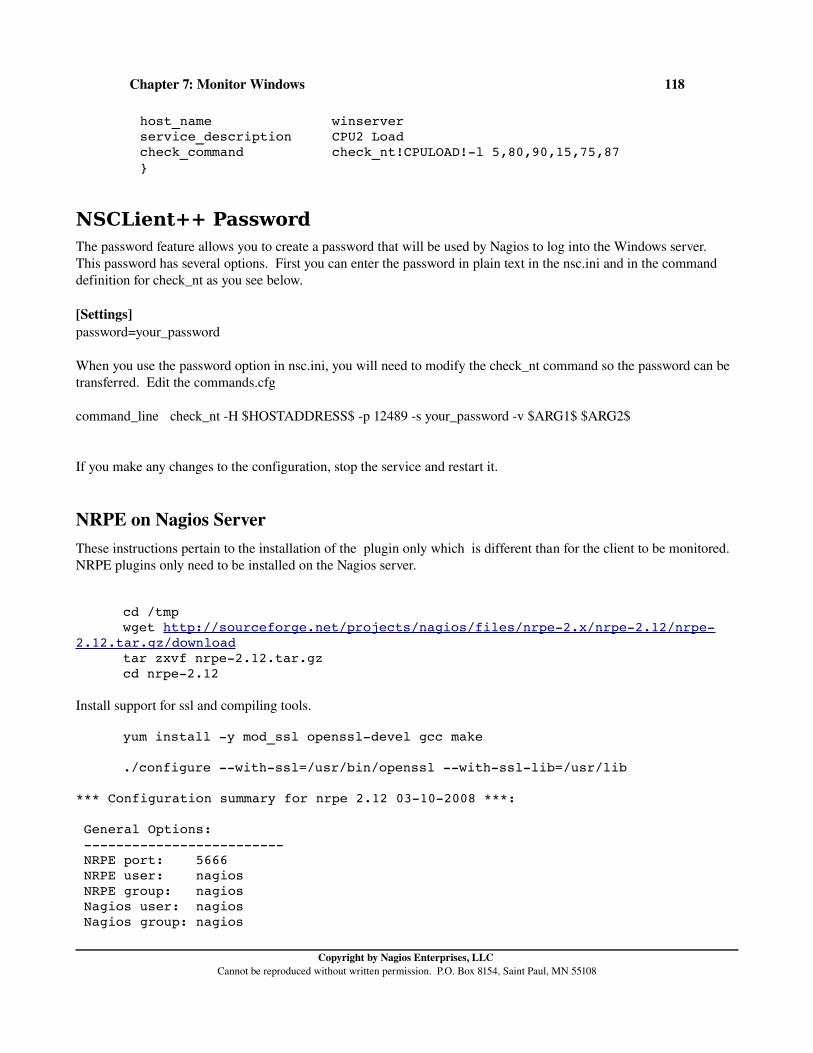
Chapter 7: Monitor Windows 118
host_name winserver service_description CPU2 Load check_command check_nt!CPULOAD!l 5,80,90,15,75,87 }
NSCLient++ Password The password feature allows you to create a password that will be used by Nagios to log into the Windows server.This password has several options. First you can enter the password in plain text in the nsc.ini and in the command definition for check_nt as you see below.
[Settings]password=your_password
When you use the password option in nsc.ini, you will need to modify the check_nt command so the password can be transferred. Edit the commands.cfg
command_line check_nt H $HOSTADDRESS$ p 12489 s your_password v $ARG1$ $ARG2$
If you make any changes to the configuration, stop the service and restart it.
NRPE on Nagios ServerThese instructions pertain to the installation of the plugin only which is different than for the client to be monitored. NRPE plugins only need to be installed on the Nagios server.
cd /tmpwget http://sourceforge.net/projects/nagios/files/nrpe2.x/nrpe2.12/nrpe
2.12.tar.gz/download tar zxvf nrpe2.12.tar.gz
cd nrpe2.12
Install support for ssl and compiling tools.
yum install y mod_ssl openssldevel gcc make
./configure withssl=/usr/bin/openssl withssllib=/usr/lib
*** Configuration summary for nrpe 2.12 03102008 ***:
General Options: NRPE port: 5666 NRPE user: nagios NRPE group: nagios Nagios user: nagios Nagios group: nagios
Copyright by Nagios Enterprises, LLC Cannot be reproduced without written permission. P.O. Box 8154, Saint Paul, MN 55108

Chapter 7: Monitor Windows 119
makemake install make installplugin
Alternative Install from RPM Repository
yum install y nagiospluginsnrpe
Once it is up an running check your connection.
/usr/local/nagios/libexec/./check_nrpe H 192.168.5.14 I (0.3.5.1 20080924) seem to be doing fine...
If you see errors you will need to correct them, use the log for locating the errors.
NSClient++ and NRPEThe NSC.ini file contains several settings for using NRPE. Look for two sections that relate to NRPE and pay attention to the modules section which is also needed. In the modules section the NRPEListener.dll must be uncommented in order for NRPE to work.
[modules] FileLogger.dll CheckSystem.dll CheckDisk.dll NRPEListener.dll CheckEventLog.dll
[NRPE]allow_arguments=1allow_nasty_meta_chars=1allowed_hosts=127.0.0.1/32,192.168.5.50port=5666
This of course assumes you will open port 5666 on the Windows machine. If you can, limit the access to this port only to the Nagios server for security.
The Modules section impacts all of the functionality of NSClient++. Here is a description of the important options.
Module Description
FileLogger.dll FileLogger provides an internal log of NSClient++ but does not actually provide any checks.
CheckSystem.dll This dll allows for checks of the CPU,memory, uptime, services, and process states.
CheckDisk.dll CheckDisk allows checks for file size, and hard drive usage.
Copyright by Nagios Enterprises, LLC Cannot be reproduced without written permission. P.O. Box 8154, Saint Paul, MN 55108

Chapter 7: Monitor Windows 120
NRPEListener.dll The NRPEListener is the key to providing functionality to NRPE.
SysTray.dll The SysTray installs an icon to use for access to NSClient++.
CheckEventLog.dll Enables access to the Windows Event Log.
NRPE: Internal NSClient ++ FunctionsThere are a number of internal functions that can be called with the inject command and NRPE and are usually combined with check_nt. The check_nt plugin makes it easy to use these functions. However, if you want to fine tune the options that are available you may want to use NRPE and the inject command. Following is a list of modules with their functions.
CheckDisk – CheckFileSize, CheckDriveSizeCheckSystem – CheckCPU, CheckUpTime, ChekServiceState, CheckProcState, CheckMem, CheckCounterCheckeventLog – CheckEventLogCheckHelpers – CheckAlwaysOk, CheckAlwaysCRITICAL, CheckAlways,WARNING, CheckMultiple
You can use aliases with external commands to do checks.
./check_nrpe H 192.168.5.14 c CheckCPU a warn=80 crit=90 time=20m time=10s time=4 OK CPU Load ok.|'20m'=0%;80;90; '10s'=0%;80;90; '4'=0%;80;90;
You will need to define Service checks on Nagios server as usual. Note NRPE is used to make the connection and then run the alias that you will set up.
define service{ use genericservice host_name winserver service_description CPU Load check_command check_nrpe!alias_cpu
}
On the Windows server you will need to edit the “External Alias” section and create or uncomment the aliases that are there with the levels.
[External Alias] alias_cpu=checkCPU warn=80 crit=90 time=5m time=1m time=30s alias_disk=CheckDriveSize MinWarn=10% MinCrit=5% CheckAll FilterType=FIXED alias_service=checkServiceState CheckAll
You also need to verify that the “modules” section has the uncommented “CheckExternalScripts.dll ” as you see below so checks can be made.
Copyright by Nagios Enterprises, LLC Cannot be reproduced without written permission. P.O. Box 8154, Saint Paul, MN 55108

Chapter 7: Monitor Windows 121
[modules] CheckExternalScripts.dll
Restart your NSCLient++ on the Windows server and nagios on the Nagios server.
Copyright by Nagios Enterprises, LLC Cannot be reproduced without written permission. P.O. Box 8154, Saint Paul, MN 55108

Chapter 7: Monitor Windows 122
Copyright by Nagios Enterprises, LLC Cannot be reproduced without written permission. P.O. Box 8154, Saint Paul, MN 55108

Chapter 8: Monitor with SSH 123
Chapter 8: Monitor with SSHGenerally there are three good reasons for using SSH to monitor remote Linux servers. First, of course the data transmission and password authentication is always encrypted. This makes it an excellent choice when you are located in a hostile environment. The second reason for using SSH is that you can employ the check_multi command which allows you to check almost an unlimited number of services with one check. This is a powerful way to save on bandwidth as you are only making one check for multiple services and the process is encrypted.
The final reason you may consider SSH to the checking on the remote server is that you may not be able to install applications or compile applications on the remote server.
In order to use SSH you need to use the check_by_ssh plugin which will enable you to perform local checks on the remote machine.
Configure the Nagios ServerThere are a number of steps that you must take to prepare the Nagios server to be able to use SSH without using a password each time. Set up the system as nagios not root. Performing them as root will not only increase security risks but it will also cause some scripts to fail as they must be performed as nagios.
su – nagios sshkeygen b 1024 f id_dsa t dsa N ''
Generating public/private dsa key pair. Your identification has been saved in id_dsa. Your public key has been saved in id_dsa.pub. The key fingerprint is: fd:cd:fe:19:44:9a:95:e8:b7:11:8e:3b:27:63:de:f0 root@fw3
Copyright by Nagios Enterprises, LLC Cannot be reproduced without written permission. P.O. Box 8154, Saint Paul, MN 55108
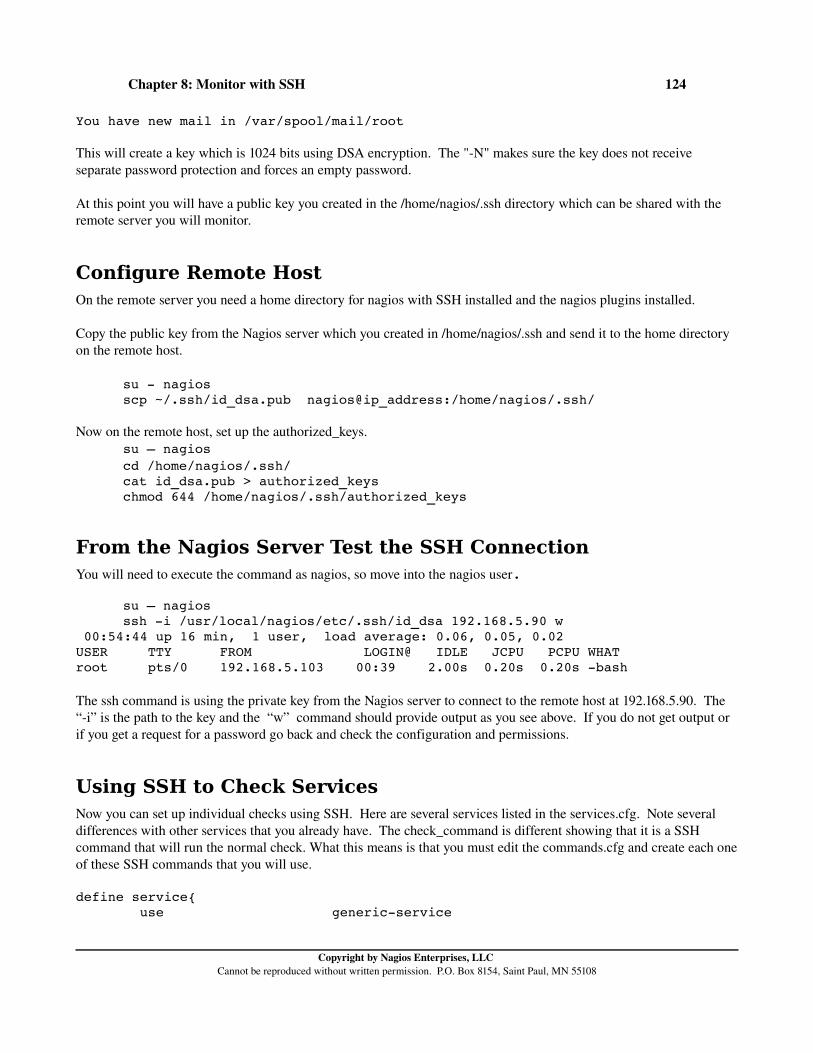
Chapter 8: Monitor with SSH 124
You have new mail in /var/spool/mail/root
This will create a key which is 1024 bits using DSA encryption. The "N" makes sure the key does not receive separate password protection and forces an empty password. At this point you will have a public key you created in the /home/nagios/.ssh directory which can be shared with the remote server you will monitor.
Configure Remote Host On the remote server you need a home directory for nagios with SSH installed and the nagios plugins installed.
Copy the public key from the Nagios server which you created in /home/nagios/.ssh and send it to the home directory on the remote host.
su nagiosscp ~/.ssh/id_dsa.pub nagios@ip_address:/home/nagios/.ssh/
Now on the remote host, set up the authorized_keys.su – nagios cd /home/nagios/.ssh/cat id_dsa.pub > authorized_keys chmod 644 /home/nagios/.ssh/authorized_keys
From the Nagios Server Test the SSH Connection You will need to execute the command as nagios, so move into the nagios user.
su – nagios ssh i /usr/local/nagios/etc/.ssh/id_dsa 192.168.5.90 w
00:54:44 up 16 min, 1 user, load average: 0.06, 0.05, 0.02 USER TTY FROM LOGIN@ IDLE JCPU PCPU WHAT root pts/0 192.168.5.103 00:39 2.00s 0.20s 0.20s bash
The ssh command is using the private key from the Nagios server to connect to the remote host at 192.168.5.90. The “i” is the path to the key and the “w” command should provide output as you see above. If you do not get output or if you get a request for a password go back and check the configuration and permissions.
Using SSH to Check ServicesNow you can set up individual checks using SSH. Here are several services listed in the services.cfg. Note several differences with other services that you already have. The check_command is different showing that it is a SSH command that will run the normal check. What this means is that you must edit the commands.cfg and create each one of these SSH commands that you will use.
define service{ use genericservice
Copyright by Nagios Enterprises, LLC Cannot be reproduced without written permission. P.O. Box 8154, Saint Paul, MN 55108

Chapter 8: Monitor with SSH 125
host_name class service_description SSH Check Disk check_command check_ssh_disk!10%!5%! /dev/mapper/VolGroup00LogVol00 }
Here is the listing in the commands.cfg. It illustrates how you must configure the command to use the SSH key so that you do not need to use a password and it functions just like the check_disk but you must configure it to use SSH. Note that this check is testing for the disk usage on this partition which is a logical volume. Make sure you understand the description of your partition.
dev/mapper/VolGroup00LogVol00
define command { command_name check_ssh_disk command_line $USER1$/check_by_ssh H $HOSTADDRESS$ i /home/nagios/.ssh/id_dsa C "$USER1$/check_disk w $ARG1$ c $ARG2$ p $ARG3$" }
Copyright by Nagios Enterprises, LLC Cannot be reproduced without written permission. P.O. Box 8154, Saint Paul, MN 55108

Chapter 8: Monitor with SSH 126
Copyright by Nagios Enterprises, LLC Cannot be reproduced without written permission. P.O. Box 8154, Saint Paul, MN 55108
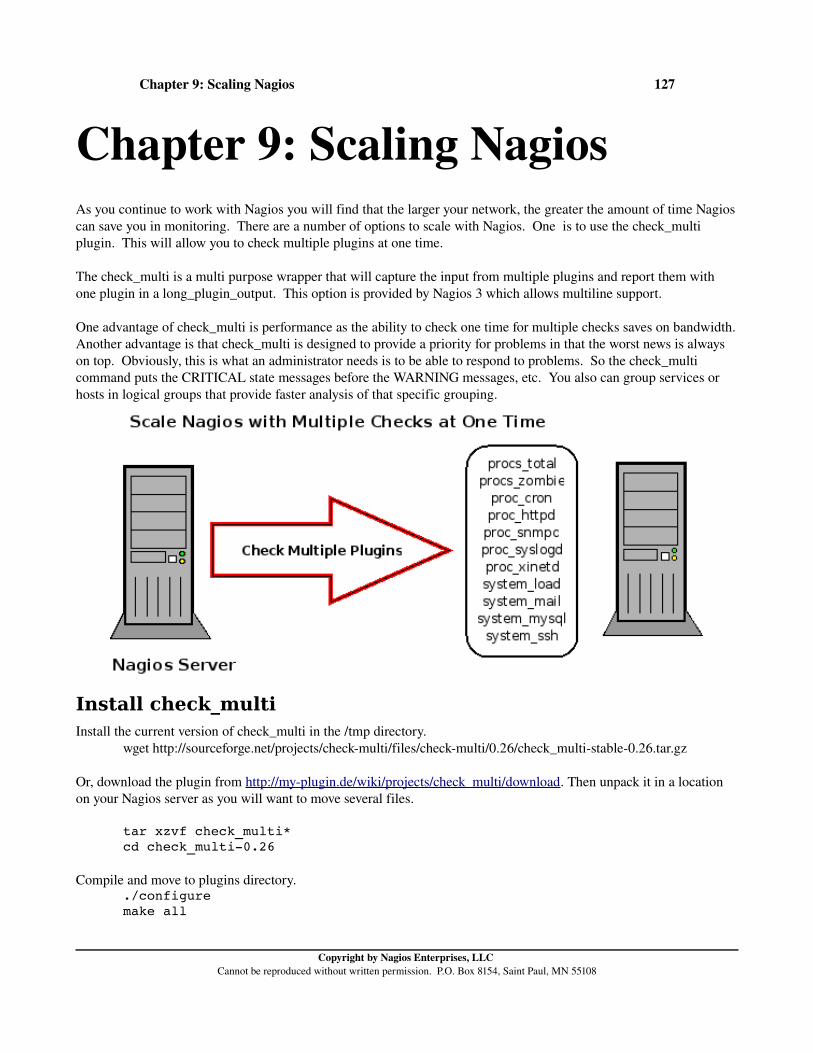
Chapter 9: Scaling Nagios 127
Chapter 9: Scaling NagiosAs you continue to work with Nagios you will find that the larger your network, the greater the amount of time Nagios can save you in monitoring. There are a number of options to scale with Nagios. One is to use the check_multi plugin. This will allow you to check multiple plugins at one time.
The check_multi is a multi purpose wrapper that will capture the input from multiple plugins and report them with one plugin in a long_plugin_output. This option is provided by Nagios 3 which allows multiline support.
One advantage of check_multi is performance as the ability to check one time for multiple checks saves on bandwidth. Another advantage is that check_multi is designed to provide a priority for problems in that the worst news is always on top. Obviously, this is what an administrator needs is to be able to respond to problems. So the check_multi command puts the CRITICAL state messages before the WARNING messages, etc. You also can group services or hosts in logical groups that provide faster analysis of that specific grouping.
Install check_multiInstall the current version of check_multi in the /tmp directory.
wget http://sourceforge.net/projects/checkmulti/files/checkmulti/0.26/check_multistable0.26.tar.gz
Or, download the plugin from http://myplugin.de/wiki/projects/check_multi/download. Then unpack it in a location on your Nagios server as you will want to move several files.
tar xzvf check_multi* cd check_multi0.26
Compile and move to plugins directory../configuremake all
Copyright by Nagios Enterprises, LLC Cannot be reproduced without written permission. P.O. Box 8154, Saint Paul, MN 55108
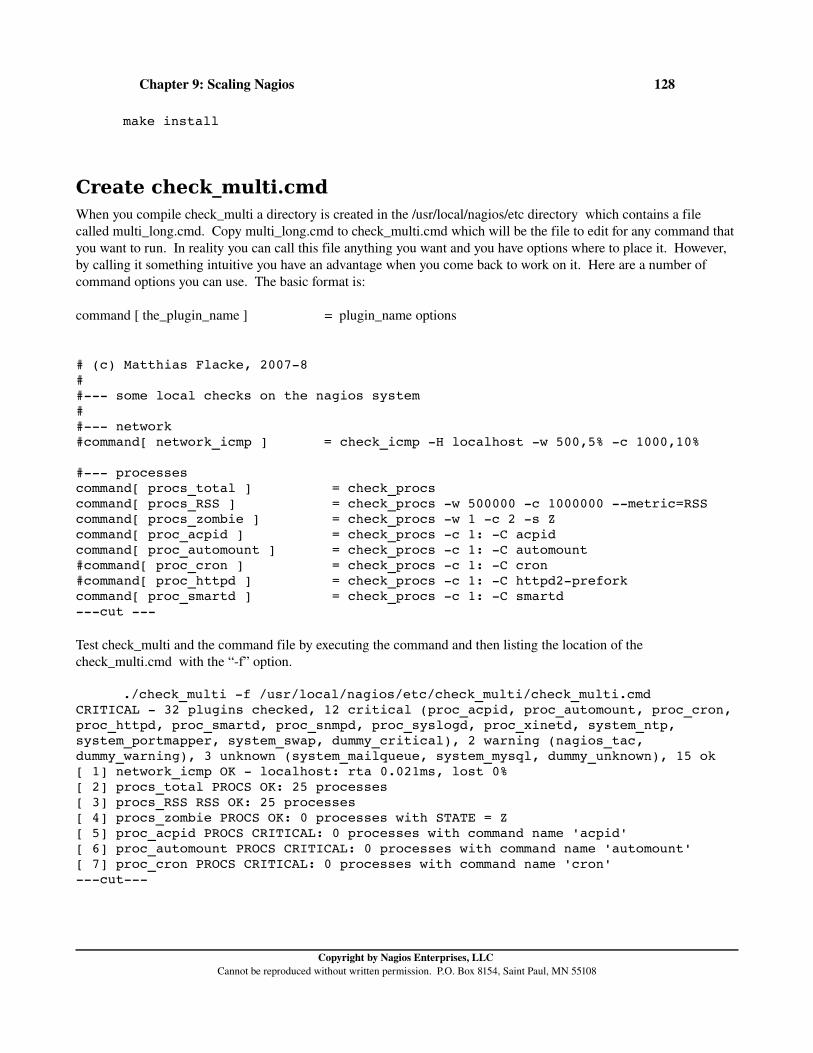
Chapter 9: Scaling Nagios 128
make install
Create check_multi.cmdWhen you compile check_multi a directory is created in the /usr/local/nagios/etc directory which contains a file called multi_long.cmd. Copy multi_long.cmd to check_multi.cmd which will be the file to edit for any command that you want to run. In reality you can call this file anything you want and you have options where to place it. However, by calling it something intuitive you have an advantage when you come back to work on it. Here are a number of command options you can use. The basic format is:
command [ the_plugin_name ] = plugin_name options
# (c) Matthias Flacke, 20078 # # some local checks on the nagios system # # network #command[ network_icmp ] = check_icmp H localhost w 500,5% c 1000,10%
# processes command[ procs_total ] = check_procs command[ procs_RSS ] = check_procs w 500000 c 1000000 metric=RSS command[ procs_zombie ] = check_procs w 1 c 2 s Z command[ proc_acpid ] = check_procs c 1: C acpid command[ proc_automount ] = check_procs c 1: C automount #command[ proc_cron ] = check_procs c 1: C cron #command[ proc_httpd ] = check_procs c 1: C httpd2prefork command[ proc_smartd ] = check_procs c 1: C smartd cut
Test check_multi and the command file by executing the command and then listing the location of the check_multi.cmd with the “f” option.
./check_multi f /usr/local/nagios/etc/check_multi/check_multi.cmd CRITICAL 32 plugins checked, 12 critical (proc_acpid, proc_automount, proc_cron, proc_httpd, proc_smartd, proc_snmpd, proc_syslogd, proc_xinetd, system_ntp, system_portmapper, system_swap, dummy_critical), 2 warning (nagios_tac, dummy_warning), 3 unknown (system_mailqueue, system_mysql, dummy_unknown), 15 ok [ 1] network_icmp OK localhost: rta 0.021ms, lost 0% [ 2] procs_total PROCS OK: 25 processes [ 3] procs_RSS RSS OK: 25 processes [ 4] procs_zombie PROCS OK: 0 processes with STATE = Z [ 5] proc_acpid PROCS CRITICAL: 0 processes with command name 'acpid' [ 6] proc_automount PROCS CRITICAL: 0 processes with command name 'automount' [ 7] proc_cron PROCS CRITICAL: 0 processes with command name 'cron' cut
Copyright by Nagios Enterprises, LLC Cannot be reproduced without written permission. P.O. Box 8154, Saint Paul, MN 55108
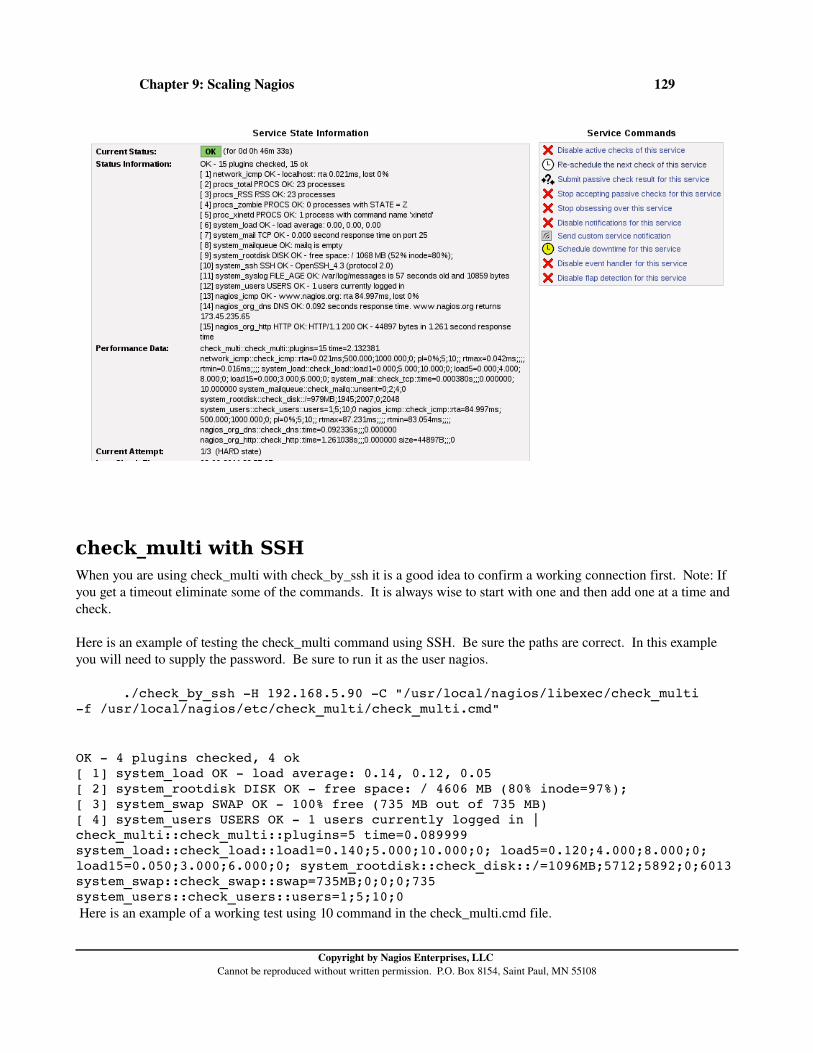
Chapter 9: Scaling Nagios 129
check_multi with SSH When you are using check_multi with check_by_ssh it is a good idea to confirm a working connection first. Note: If you get a timeout eliminate some of the commands. It is always wise to start with one and then add one at a time and check.
Here is an example of testing the check_multi command using SSH. Be sure the paths are correct. In this example you will need to supply the password. Be sure to run it as the user nagios.
./check_by_ssh H 192.168.5.90 C "/usr/local/nagios/libexec/check_multi f /usr/local/nagios/etc/check_multi/check_multi.cmd"
OK 4 plugins checked, 4 ok [ 1] system_load OK load average: 0.14, 0.12, 0.05 [ 2] system_rootdisk DISK OK free space: / 4606 MB (80% inode=97%); [ 3] system_swap SWAP OK 100% free (735 MB out of 735 MB) [ 4] system_users USERS OK 1 users currently logged in |check_multi::check_multi::plugins=5 time=0.089999 system_load::check_load::load1=0.140;5.000;10.000;0; load5=0.120;4.000;8.000;0; load15=0.050;3.000;6.000;0; system_rootdisk::check_disk::/=1096MB;5712;5892;0;6013 system_swap::check_swap::swap=735MB;0;0;0;735 system_users::check_users::users=1;5;10;0 Here is an example of a working test using 10 command in the check_multi.cmd file.
Copyright by Nagios Enterprises, LLC Cannot be reproduced without written permission. P.O. Box 8154, Saint Paul, MN 55108

Chapter 9: Scaling Nagios 130
./check_by_ssh H 192.168.5.20 i /usr/local/nagios/etc/.ssh/id_dsa C "/usr/local/nagios/libexec/check_multi f /usr/local/nagios/etc/check_multi/check_multi.cmd" CRITICAL 10 plugins checked, 2 critical (proc_syslogd, system_ssh), 8 ok [ 1] procs_total PROCS OK: 79 processes [ 2] procs_zombie PROCS OK: 0 processes with STATE = Z [ 3] proc_syslogd PROCS CRITICAL: 0 processes with command name 'syslogng' [ 4] proc_xinetd PROCS OK: 1 process with command name 'xinetd' [ 5] system_load OK load average: 0.01, 0.03, 0.00 [ 6] system_mysql Uptime: 5951 Threads: 1 Questions: 17 Slow queries: 0 Opens: 12 Flush tables: 1 Open tables: 6 Queries per second avg: 0.003 [ 7] system_ssh Server answer: [ 8] system_swap SWAP OK 100% free (703 MB out of 703 MB) [ 9] system_syslog FILE_AGE OK: /var/log/messages is 13 seconds old and 24382 bytes [10] system_users USERS OK 1 users currently logged in |check_multi::check_multi::plugins=10 time=6.885009 system_load::check_load::load1=0.010;5.000;10.000;0; load5=0.030;4.000;8.000;0; load15=0.000;3.000;6.000;0; system_swap::check_swap::swap=703MB;0;0;0;703 system_users::check_users::users=1;5;10;0 Once you have the test working correctly then define the command in commands.cfg. Be careful of paths on the remote server as they may be different than they are on Nagios.
Review closely the command you define for this plugin, check the paths twice as it is a common place to make an error.
define command { command_name check_multi_by_ssh command_line $USER1$/check_by_ssh H $HOSTADDRESS$ i /usr/local/nagios/etc/.ssh/id_dsa C "$USER1$/check_multi f /usr/local/nagios/etc/check_multi/check_multi.cmd" }
This is the check_multi command that you can use with SSH.
define service{ use genericservice host_name class service_description SSH Check_Multi check_command check_multi_by_ssh!check_multi }
Copyright by Nagios Enterprises, LLC Cannot be reproduced without written permission. P.O. Box 8154, Saint Paul, MN 55108

Chapter 9: Scaling Nagios 131
Note that with check multi you may have 9 plugins that are working fine and one critical. The critical issues rise to the top so it will show critical if one is critical and 9 are OK.
Copyright by Nagios Enterprises, LLC Cannot be reproduced without written permission. P.O. Box 8154, Saint Paul, MN 55108

Chapter 9: Scaling Nagios 132
Copyright by Nagios Enterprises, LLC Cannot be reproduced without written permission. P.O. Box 8154, Saint Paul, MN 55108

Chapter 10: Graphing 133
Chapter 10: Graphing There are two different levels of performance data. Nagios manufactures internal performance data which is data on the latency of checks that are performed by Nagios. The second level of performance data is the results of checks that are performed on the clients that is returned to Nagios.
Here is an example of performance data that is plugin output indicating disk space.
This is often the data that is the most important to the administrator as this contains the information about disk drive space, ping times, bandwidth, etc. This is also the data that is used to create graphing as in this example.
The performance data that is collected can be sent to a file or processed by other programs like rrdtool. The first method uses a template to store the output of the information. The second method is the use of external commands to
Copyright by Nagios Enterprises, LLC Cannot be reproduced without written permission. P.O. Box 8154, Saint Paul, MN 55108

Chapter 10: Graphing 134
process the performance data. The performance data is turned on and off in the nagios.cfg file. This is also where the location of the file is indicated if the data is sent there.
nagios.cfg This setting determines if you will process performance data.
process_performance_data=1
Template for Performance Data The template method requires the information to be saved to a file in a specific format. These files are where the data is sent if a file is used. These settings are found in the nagios.cfg file.
#host_perfdata_file=/tmp/hostperfdata #service_perfdata_file=/tmp/serviceperfdata
The templates set up the output format. The format determines the correct output in order to use information.
#host_perfdata_file_template=[HOSTPERFDATA]\t$TIMET$\t$HOSTNAME$\t$HOSTEXECUTIONTIME$\t$HOSTOUTPUT$\t$HOSTPERFDATA$
#service_perfdata_file_template=[SERVICEPERFDATA]\t$TIMET$\t$HOSTNAME$\t$SERVICEDESC$\t$SERVICEEXECUTIONTIME$\t$SERVI CELATENCY$\t$SERVICEOUTPUT$\t$SERVICEPERFDATA$
Location of Performance Data CommandsThe commands.cfg contains the command definitions on how the performance data is processed.
# 'processhostperfdata' command definition #define command{ # command_name processhostperfdata # command_line /usr/bin/printf "%b" "$LASTHOSTCHECK$\t$HOSTNAME$\t$HOSTSTATE$\t$HOSTATTEMPT$\t$HOSTSTATETYPE$\t$HOSTEXECUTIONTIME$\t$HOSTOUTPUT$\t$HOSTPERFDATA$\n" >> /usr/local/nagios/var/hostperfdata.out # }
# 'processserviceperfdata' command definition #define command{ # command_name processserviceperfdata # command_line /usr/bin/printf "%b" "$LASTSERVICECHECK$\t$HOSTNAME$\t$SERVICEDESC$\t$SERVICESTATE$\t$SERVICEATTEMPT$\t$SERVICESTATETYPE$\t$SERVICEEXECUTIONTIME$\t$SERVICELATENCY$\t$SERVICEOUTPUT$\t$SERVICEPERFDATA$\n" >> /usr/local/nagios/var/serviceperfdata.out # }
External Commands for Performance Data These two commands process the performance data with external commands. When you look in the commands.cfg these commands are listed.
Copyright by Nagios Enterprises, LLC Cannot be reproduced without written permission. P.O. Box 8154, Saint Paul, MN 55108

Chapter 10: Graphing 135
host_perfdata_command=processhostperfdata service_perfdata_command=processserviceperfdata
The commands.cfg file contains the settings to interpret the processing. This example is for PNP4Nagios.
define command { command_name processhostperfdata command_line /usr/bin/perl /usr/local/pnp4nagios/libexec/process_perfdata.pl d HOSTPERFDATA }
define command { command_name processserviceperfdata command_line /usr/bin/perl /usr/local/pnp4nagios/libexec/process_perfdata.pl }
When the round robin database rrdtool is used these are the settings for performance data.
RRD Files stored in: /usr/local/pnp4nagios/var/perfdata process_perfdata.pl Logfile: /usr/local/pnp4nagios/var/perfdata.log Perfdata files (NPCD) stored in: /usr/local/pnp4nagios/var/spool
PNP4Nagios PNP4Nagios or PNP is an addon for Nagios that will provide graphical data on performance using the RRD Tool(Round Robin Databases).
yum install y rrdtool autoconf gcc make yumpriorities perlTimeHiRes rrdtoolperl
Download the Latest Version
cd /tmpwget http://sourceforge.net/projects/pnp4nagios/files/PNP0.6/pnp4nagios
0.6.17.tar.gz/download
tar zxvf pnp4nagios0.6.17.tar.gz cd pnp4nagios0.6.17
In order to verify the proper path is created for the web interface provide the option as you see below.
./configure withhttpdconf=/etc/httpd/conf.d
You will receive a summary of the paths that you should check, make note of and verify that they are correct before you continue.
Copyright by Nagios Enterprises, LLC Cannot be reproduced without written permission. P.O. Box 8154, Saint Paul, MN 55108

Chapter 10: Graphing 136
General Options: Nagios user/group: nagios nagios Install directory: /usr/local/pnp4nagios HTML Dir: /usr/local/pnp4nagios/share Config Dir: /usr/local/pnp4nagios/etc Location of rrdtool binary: /usr/bin/rrdtool Version 1.4.4 RRDs Perl Modules: FOUND (Version 1.4004) RRD Files stored in: /usr/local/pnp4nagios/var/perfdata process_perfdata.pl Logfile: /usr/local/pnp4nagios/var/perfdata.log Perfdata files (NPCD) stored in: /usr/local/pnp4nagios/var/spool
Web Interface Options: HTML URL: http://localhost/pnp4nagios Apache Config File: /etc/httpd/conf.d/pnp4nagios.conf
make all make install
make installwebconf make installconfig
The last option again verifies that the web interface is installed so you may edit that file.
Edit /usr/local/nagios/etc/nagios.cfg (RPM repository /etc/nagios/nagios.cfg) in order to allow the processing of performance data. To enable it change the "0" to one on this line and save the file.
process_performance_data=1
Verify this line is enabled. enable_environment_macros=1
Uncomment or add these lines.
host_perfdata_command=processhostperfdata service_perfdata_command=processserviceperfdata
This will enable performance data for all services and hosts. If there is a service that you do not want performance data for you will need to add this line to the service definition.
define service{ use genericservice host_name mail service_description SMTP check_command check_smtp
process_perf_data 0 }
Copyright by Nagios Enterprises, LLC Cannot be reproduced without written permission. P.O. Box 8154, Saint Paul, MN 55108

Chapter 10: Graphing 137
Edit the commands.cfg and add these lines.
define command { command_name processserviceperfdata command_line /usr/bin/perl
/usr/local/pnp4nagios/libexec/process_perfdata.pl }
define command { command_name processhostperfdata command_line /usr/bin/perl
/usr/local/pnp4nagios/libexec/process_perfdata.pl d HOSTPERFDATA }
Comment out these lines which are duplicates at the end of the file.
# 'processhostperfdata' command definition #define command{ # command_name processhostperfdata # command_line /usr/bin/printf "%b" "$LASTHOSTCHECK$\t$HOSTNAME$\t$HOSTSTATE$\t$HOSTATTEMPT$\t$HOSTSTATETYPE$\t$HOSTEXECUTIONTIME$\t$HOSTOUTPUT$\t$HOSTPERFDATA$\n" >> /var/nagios/hostperfdata.out # }
# 'processserviceperfdata' command definition #define command{ # command_name processserviceperfdata # command_line /usr/bin/printf "%b" "$LASTSERVICECHECK$\t$HOSTNAME$\t$SERVICEDESC$\t$SERVICESTATE$\t$SERVICEATTEMPT$\t$SERVICESTATETYPE$\t$SERVICEEXECUTIONTIME$\t$SERVICELATENCY$\t$SERVICEOUTPUT$\t$SERVICEPERFDATA$\n" >> /var/nagios/serviceperfdata.out # }
Edit the /usr/local/nagios/etc/objects/templates.cfg to add the necessary template information for pnp.
define host { name hostpnp action_url /pnp4nagios/index.php/graph?host=$HOSTNAME$&srv=_HOST_ register 0 }
define service { name srvpnp action_url /pnp4nagios/index.php/graph?host=$HOSTNAME$&srv=$SERVICEDESC$ register 0
Copyright by Nagios Enterprises, LLC Cannot be reproduced without written permission. P.O. Box 8154, Saint Paul, MN 55108
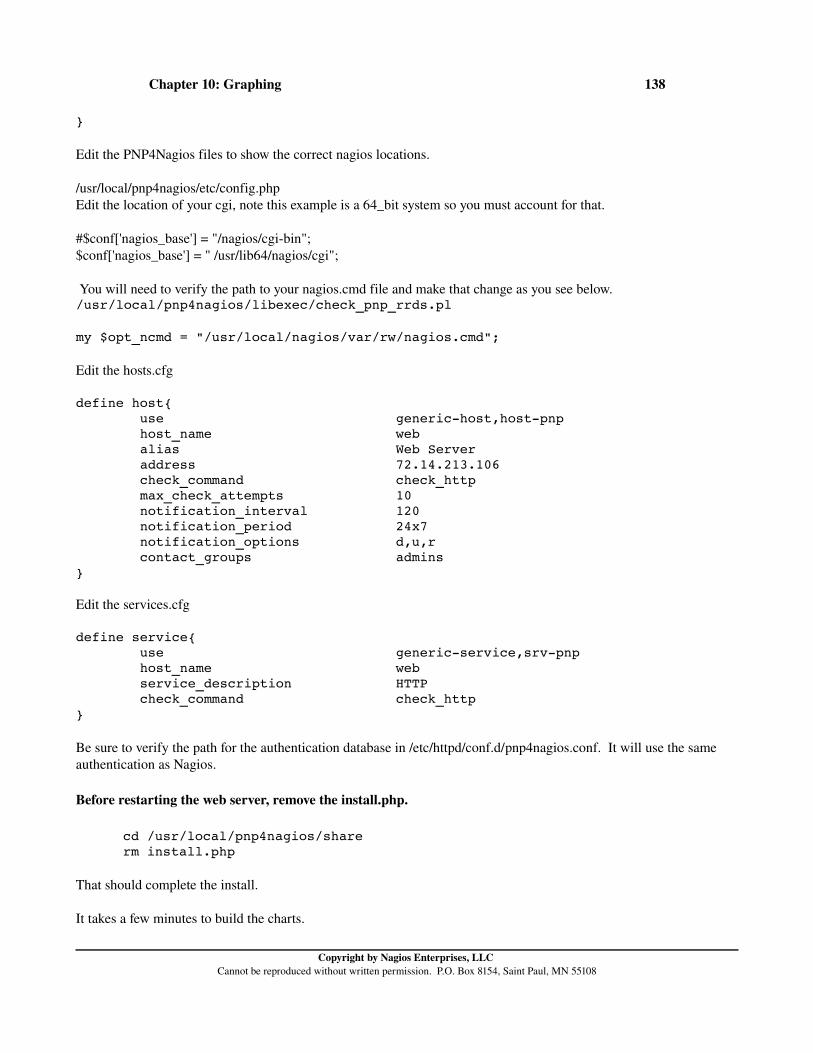
Chapter 10: Graphing 138
}
Edit the PNP4Nagios files to show the correct nagios locations.
/usr/local/pnp4nagios/etc/config.phpEdit the location of your cgi, note this example is a 64_bit system so you must account for that.
#$conf['nagios_base'] = "/nagios/cgibin"; $conf['nagios_base'] = " /usr/lib64/nagios/cgi";
You will need to verify the path to your nagios.cmd file and make that change as you see below./usr/local/pnp4nagios/libexec/check_pnp_rrds.pl
my $opt_ncmd = "/usr/local/nagios/var/rw/nagios.cmd";
Edit the hosts.cfg
define host{ use generichost,hostpnp host_name web alias Web Server address 72.14.213.106 check_command check_http max_check_attempts 10 notification_interval 120 notification_period 24x7 notification_options d,u,r contact_groups admins }
Edit the services.cfg
define service{ use genericservice,srvpnp host_name web service_description HTTP check_command check_http }
Be sure to verify the path for the authentication database in /etc/httpd/conf.d/pnp4nagios.conf. It will use the same authentication as Nagios.
Before restarting the web server, remove the install.php.
cd /usr/local/pnp4nagios/sharerm install.php
That should complete the install.
It takes a few minutes to build the charts.
Copyright by Nagios Enterprises, LLC Cannot be reproduced without written permission. P.O. Box 8154, Saint Paul, MN 55108

Chapter 10: Graphing 139
NagiosGraphNagiosGraph is another way to view performance data. It is based on two primary Perl scripts, insert.pl and show.cgi, that use RRDtool to process data in a roundrobin database format. The insert.pl writes the performance data to the database and the show.cgi creates the graphs from the data in a dynamic HTML page. The map file provides a way to create new options to graph for your hosts.
The first tool you need to install is RRDtool. This tool allows the creation of graphs and functions as a unique database that overwrites old data as it reaches the starting point of a circular progression of data, thus is is called “Round Robin”. RRDtool calculates the rate of change from the value that it had previously. It uses timestamps on all of the information in order to due the necessary calculations.
You can either download the source code from http://oss.oetiker.ch/rrdtool/ or if you are using CentOS with the rpmforge repositories you can use yum to install it.
yum install rrdtool perl
Copyright by Nagios Enterprises, LLC Cannot be reproduced without written permission. P.O. Box 8154, Saint Paul, MN 55108

Chapter 10: Graphing 140
Download Nagiosgraph from sourceforge.net http://sourceforge.net/projects/nagiosgraph/files/
Download nagiosgraph1.4.4.tar.gz and save it in /usr/lib/nagios/
The map allows you to create or modify performance data.
MRTGMRTG (Multi Router Traffic Grapher) offers you a graph of your information that is collected with Nagios. There are typically two values displayed with MRTG used to visualize network bandwidth, green for incoming traffic and blue for outgoing traffic. When used with Nagios MRTG displays data that is provided by the command nagiostats.
Copyright by Nagios Enterprises, LLC Cannot be reproduced without written permission. P.O. Box 8154, Saint Paul, MN 55108

Chapter 10: Graphing 141
Cacti on Nagios Cacti is a performance data graphing system that can gather data from a number of different sources. It uses its own authentication system and its own MySQL database, so it can be used either as a standalone product or in combination with Nagios. For purposes of this tutorial, we'll assume that you're installing this on a server on which Nagios, Apache, and MySQL Server have already been installed. We'll also assume that you've already installed the rpmforge repository, which you'll need for installing the prerequisite packages. Our installation platform is CentOS 5.7.
Copyright by Nagios Enterprises, LLC Cannot be reproduced without written permission. P.O. Box 8154, Saint Paul, MN 55108

Chapter 10: Graphing 142
Copyright by Nagios Enterprises, LLC Cannot be reproduced without written permission. P.O. Box 8154, Saint Paul, MN 55108

Chapter 11: Monitor with SNMP 143
Chapter 11: Monitor with SNMP
SNMP or Simple Network Management Protocol will allow you to monitor many different kinds of network devices. In fact, most network devices are capable of working with SNMP not just routers and switches. Though you can use NRPE or SSH to monitor servers, devices like switches and routers will require SNMP to monitor what is happening internally with them.
Nagios provides for two different types of usage with SNMP, passive and active. In the active role Nagios can use plugins to request information from the device. Using the passive aspect Nagios can receive traps, or messages from the agent to the manager to process the information. An addon SNMPTT (SNMP Trap Translator) translates these traps for Nagios to use. Nagios can integrate with other network monitoring systems using traps.
Install SNMP yum install y netsnmp netsnmputils netsnmplibs
If you are going to use SNMP you will need a basic understanding of how the hierarchical namespace of SNMP is configured. SNMP uses a tree of numbers which represent the structure. At the top of the tree is root or “1” which is the International Organization for Standardization (iso). The next level represents the “org” for organizations. The Department of defense is the third level, “dod”. Under “dod” is the Internet node, “1.3.6.1”. The SNMP tree starts with the number 1 and flows outward like a tree with subnumbers.
1 iso1.3 – org
1.3.6 – dod1.3.6.1 – internet
1.3.6.1.1 – directory1.3.6.1.2 – mgmt
1.3.6.1.2.1 mib21.3.6.1.3 – experimental1.3.6.1.4 – private1.3.6.1.5 – security1.3.6.1.6 SNMPv2
Each of these numbers represents a node or OID, (Object Identifier). When you use SNMP you will often see references to OIDs.
SNMP has several protocol versions which will be significant in communication. The first version was developed in 1988 and named SNMPv1. This version is very insecure in that the two passwords, which are represented by community, are typically “public” so that anyone can access them and to make it worse, usually are transferred plain text so they can be captured by a network sniffer.
SNMPv2 was designed to address some of the security issues. Since it never really became popular it really did not make much impact. However, the current version SNMPv3 now implements some improvements. SNMPv3 is
Copyright by Nagios Enterprises, LLC Cannot be reproduced without written permission. P.O. Box 8154, Saint Paul, MN 55108

Chapter 11: Monitor with SNMP 144
backward compatible to version 1 and 2. Whenever you work with SNMP you will need to indicate the version that you are working with.
This command should show you the available OIDs (object identifiers) on a host. This command is assuming that the host supports version 2c and the public string.
snmpwalk <ipaddress> v 2c c public
SNMPv2MIB::sysDescr.0 = STRING: HP ETHERNET MULTIENVIRONMENT,ROM R.22.01,JETDIRECT,JD95,EEPROM R.25.09,CIDATE 07/24/2003 SNMPv2MIB::sysObjectID.0 = OID: SNMPv2SMI::enterprises.11.2.3.9.1 DISMANEVENTMIB::sysUpTimeInstance = Timeticks: (40150) 0:06:41.50 SNMPv2MIB::sysContact.0 = STRING: SNMPv2MIB::sysName.0 = STRING: NPIB15C1D SNMPv2MIB::sysLocation.0 = STRING: SNMPv2MIB::sysServices.0 = INTEGER: 64 IFMIB::ifNumber.0 = INTEGER: 2 IFMIB::ifIndex.1 = INTEGER: 1 cut
The sections in the SNMP tree are labeled with the term MIB (Management Information Base). One of the most significant MIBs or sections is MIBII which has subsections. One of the subsections is interfaces (mib2.2) which provides you information about each of the interfaces on the machine you want to monitor.
One of the basic tools for reviewing the SNMP tree is snmpwalk. Here is an example of how it can be used.
snmpwalk commandversion the SNMP library comes in three versions, v1, v2c and version 3,community string this is like a password, snmp devices usually are installed by default with the community string “public”, however your organization may have changed this stringip_address this is the IP Address of the device you want to review, this is where the library is
When you run this command it is like getting a list of “all” of the books in the library at one time, overwhelming for
Copyright by Nagios Enterprises, LLC Cannot be reproduced without written permission. P.O. Box 8154, Saint Paul, MN 55108

Chapter 11: Monitor with SNMP 145
sure.
snmpwalk v2c c public 192.168.5.45SNMPv2MIB::sysDescr.0 = STRING: Linux db 2.6.325686 #1 SMP Wed May 18 07:08:50 UTC 2011 i686SNMPv2MIB::sysObjectID.0 = OID: NETSNMPMIB::netSnmpAgentOIDs.10DISMANEVENTMIB::sysUpTimeInstance = Timeticks: (3422723) 9:30:27.23SNMPv2MIB::sysContact.0 = STRING: rootSNMPv2MIB::sysName.0 = STRING: dbSNMPv2MIB::sysLocation.0 = STRING: UnknownSNMPv2MIB::sysORLastChange.0 = Timeticks: (0) 0:00:00.00SNMPv2MIB::sysORID.1 = OID: SNMPFRAMEWORKMIB::snmpFrameworkMIBComplianceSNMPv2MIB::sysORID.2 = OID: SNMPMPDMIB::snmpMPDComplianceSNMPv2MIB::sysORID.3 = OID: SNMPUSERBASEDSMMIB::usmMIBCompliancecut
The way to start building checks is to go to the plugins directory and start executing the plugin manually to see if you have the check set correctly. The standard plugin for checking SNMP is check_snmp. This is a flexible plugin that will not require a lot of changes. The output of “h” provides the basic options.Here is an example of checking to see if the port is up.
The “o” is the reference to the OID in the tree.
./check_snmp H 192.168.5.45 C public o ifAdminStatus.2SNMP OK 1 | IFMIB::ifAdminStatus.2=1
Next step is to create the check. Be sure to verify the host and the check_command. The check_command lists the plugin that is used followed by a “!” which indicates an argument separator. So the argument that is used for this check is the community string “C public” and the OID for the check “o ifAdminStatus.2”.
define service{ use genericservice host_name db service_description Ethernet Port check_command check_snmp!C public o ifAdminStatus.2}
Save and restart Nagios and the check should now be functional.
Copyright by Nagios Enterprises, LLC Cannot be reproduced without written permission. P.O. Box 8154, Saint Paul, MN 55108

Chapter 11: Monitor with SNMP 146
SNMP for Servers
Activate SNMP on Windows ServerDepending upon the version of Windows server that you are using this process will vary somewhat, but the basic idea is simple enough and you will be able to make the changes from the images. You first have to make sure that the SNMP is installed on the server and that it is running.
The community string for the device will need to be set. Nagios only requires ro (read only) access. Once this is complete restart your SNMP service.
Checking SNMP on a Windows ServerA good resource for SNMP checks for Windows machines is found at the website listed below. These plugins can work for Windows and Linux so they can save some setup time.
http://nagios.manubulon.com/index_snmp.html
Download the plugins to the plugins directory and make them executable on the Nagios server.cd /tmpwget http://nagios.manubulon.com/nagiossnmpplugins.1.1.1.tgztar zxvf nagiossnmp*cd nagios_pluginscp *.pl /usr/local/nagios/libexec/
Once they are in place use the command line on the Nagios server to do testing to make sure they work before you place them in the services.cfg and commands.cfg or if you use a windows.cfg.
./check_snmp_storage.pl H 192.168.5.14 C public m ^C: w 80% c 90% C:\ Label: Serial Number 508ccc88: 42%used(8500MB/20003MB) (<80%) : OK
Copyright by Nagios Enterprises, LLC Cannot be reproduced without written permission. P.O. Box 8154, Saint Paul, MN 55108

Chapter 11: Monitor with SNMP 147
define command { command_name check_snmp_storage command_line $USER1$/check_snmp_storage.pl H $HOSTADDRESS$ C $ARG1$ m $ARG2$ w 95 c 97 f } define command { command_name check_snmp_memory command_line $USER1$/check_snmp_mem.pl H $HOSTADDRESS$ C $ARG1$ w $ARG2$ c $ARG3$ } define command { command_name check_snmp_load command_line $USER1$/check_snmp_load.pl H $HOSTADDRESS$ C $ARG1$ w $ARG2$ c $ARG3$ } define command { command_name check_snmp_process command_line $USER1$/check_snmp_process.pl H $HOSTADDRESS$ C $ARG1$ } define command { command_name check_snmp_interface command_line $USER1$/check_snmp_int.pl H $HOSTADDRESS$ C $ARG1$ n $ARG2$ w $ARG3$ c $ARG4$ }
define service{ use genericservice host_name winserver check_command check_snmp_storage!public!C: service_description SNMP Check Disk Space C: } define service{ use genericservice host_name winserver check_command check_snmp_storage!public!E: service_description SNMP Check Disk Space E: } define service{ use genericservice,srvpnp host_name winserver check_command check_snmp_load!public!90%!95% service_description SNMP CPU usage }
Copyright by Nagios Enterprises, LLC Cannot be reproduced without written permission. P.O. Box 8154, Saint Paul, MN 55108

Chapter 11: Monitor with SNMP 148
SNMP Checks with Linux ServersSNMP allows you to monitor a Linux server using UDP on port 161. This will reduce the load on your network bandwidth and still provide you with great monitoring options. On the desktop or server you want to monitor you will need to install netsnmputils (CentOS).
yum install y netsnmputils netsnmp
When you install netsnmputils it will create a configuration file that can be used to set up the snmpd server. When you configure the /etc/snmp/snmpd.conf file the first thing you should do is create a backup. This can be the place that will make it very hard to recover changes. Having a backup to review can help you get it up and going faster. The example will show you how to get a basic snmpd daemon working on your Linux server with restricted access and limited information available from the Linux server. This is a good place to start.
Gaining Permission on a Linux Server You will need to install the SNMP daemon and configure the file /etc/snmp/snmpd.conf. Save the original snmpd.conf and replace it with these few lines, make sure that your network is listed here or a single IP Address as you see below. Note the “public” is setting the community string.
com2sec notConfigUser 192.168.5.4 public group notConfigGroup v1 notConfigUser group notConfigGroup v2c notConfigUser view all included .1 80 access notConfigGroup "" any noauth exact all none none
Once the file is saved, start the daemon with:
service snmpd start
That should provide access to the Linux server.
Check that you server is listening on port 161 UDP.netstat aunt
Active Internet connections (servers and established) Proto RecvQ SendQ Local Address Foreign Address State
udp 0 0 127.0.0.1:161 0.0.0.0:*
Once you begin to understand the OIDs that you are looking for you can begin to write commands which will search for that information from the command line. This will give you the option to create passive scripts that can find this data and return it to the Nagios server. Here are a few examples using grep to locate information that you may want. Notice that when you pipe to grep you must use the “\” for grep to work.
snmpwalk v 1 c public O e 192.168.5.66 mib2.interfaces |\grep eth IFMIB::ifDescr.2 = STRING: eth1 IFMIB::ifDescr.3 = STRING: eth0
snmpwalk v 1 c public O e 192.168.5.66 mib2.system |\grep
Copyright by Nagios Enterprises, LLC Cannot be reproduced without written permission. P.O. Box 8154, Saint Paul, MN 55108

Chapter 11: Monitor with SNMP 149
sysUpTimeInstance DISMANEVENTMIB::sysUpTimeInstance = Timeticks: (1158212) 3:13:02.12
snmpwalk v 1 c public O e 192.168.5.66 mib2.host |\grep hrMemorySize HOSTRESOURCESMIB::hrMemorySize.0 = INTEGER: 1025460 KBytes
A good resource for SNMP plugins is this website:http://nagios.manubulon.com/index_snmp.html
Once you download the plugins and make them executable you can start using them with SNMP. Check the commands that you want to use with SNMP from the command line first to verify that they are working like expected.
Check storage with "m" as the partition indicator. ./check_snmp_storage.pl H 192.168.5.131 C public m / w 80 c 90
/home: 5%used(411MB/7875MB) /boot: 42%used(41MB/99MB) /sys/fs/fuse/connections: 0%used(0MB/0MB) /: 14%used(1339MB/9844MB) (<80%) : OK
./check_snmp_storage.pl H 192.168.5.131 C public m /boot w 80 c 90 /boot: 42%used(41MB/99MB) (<80%) : OK
Check interface will verify if a port is up and in time be able to provide traffic data. Note it may take more than 5 minutes to build traffic data. The "k" are default settings and "q" is extended settings.
./check_snmp_int.pl H 192.168.5.131 C public n eth0 q w 200,400 c 0,600 eth0:UP:1 UP: OK
Check processes can check processes of a specific daemon. ./check_snmp_process.pl H 192.168.5.131 C public n apache2
3 process matching apache2 (> 0)
Check processes can check the daemon processes and set up WARNING and CIRITCAL state levels for the number of processes. ./check_snmp_process.pl H 192.168.5.131 C public n apache2 w 3,8 c 0,15 3 process matching apache2 (<= 3 : WARNING) (<= 8):OK
Check load will provide load information. ./check_snmp_load.pl H 192.168.5.131 C public w 80 c 90
2 CPU, average load 1.0% < 80% : OK
Check load on a Linux server allows for 1,5, and 15 minute interval checks. ./check_snmp_load.pl H 192.168.5.131 C public w 2,2,1 c 3,3,2 T netsl
Load : 0.00 0.03 0.00 : OK
./check_snmp_load.pl H 192.168.5.131 C public w 2,2,1 c 3,3,2 T netsl Load : 0.00 0.03 0.00 : OK
Check for RAM at 85 and 95% and SWAP at 10, 20%
Copyright by Nagios Enterprises, LLC Cannot be reproduced without written permission. P.O. Box 8154, Saint Paul, MN 55108

Chapter 11: Monitor with SNMP 150
./check_snmp_mem.pl H 192.168.5.131 C public w 85,10 c 95,20 Ram : 45%, Swap : 0% : ; OK
define service{ use genericservice host_name amail check_command check_snmp_storage!public!/boot service_description SNMP Check Disk Space /boot } define service{ use genericservice host_name amail check_command check_snmp_storage!public!/home service_description SNMP Check Disk Space /home } define service{ use genericservice host_name amail check_command check_snmp_storage!public!/ service_description SNMP Check Disk Space / } define service{ use genericservice host_name amail check_command check_snmp_memory!public!85,10!95,20 service_description SNMP Memory usage } define service{ use genericservice host_name amail check_command check_snmp_load!public!90%!95% service_description SNMP CPU usage } define service{ use genericservice host_name amail check_command check_snmp_process!public n apache2 w 3,8 c 0,9 service_description SNMP Apache Processes } define service{ use genericservice host_name amail check_command check_snmp_interface!public!eth0!200,400!0,600 service_description SNMP ETH0 Traffic }
Define your commands in the commands.cfg.
define command { command_name check_snmp_storage command_line $USER1$/check_snmp_storage.pl H $HOSTADDRESS$ C $ARG1$ m
Copyright by Nagios Enterprises, LLC Cannot be reproduced without written permission. P.O. Box 8154, Saint Paul, MN 55108

Chapter 11: Monitor with SNMP 151
$ARG2$ w 95 c 97 f } define command { command_name check_snmp_memory command_line $USER1$/check_snmp_mem.pl H $HOSTADDRESS$ C $ARG1$ w $ARG2$ c $ARG3$ } define command { command_name check_snmp_load command_line $USER1$/check_snmp_load.pl H $HOSTADDRESS$ C $ARG1$ w $ARG2$ c $ARG3$ } define command { command_name check_snmp_process command_line $USER1$/check_snmp_process.pl H $HOSTADDRESS$ C $ARG1$ } define command { command_name check_snmp_interface command_line $USER1$/check_snmp_int.pl H $HOSTADDRESS$ C $ARG1$ n $ARG2$ w $ARG3$ c $ARG4$ }
Restart your Nagios server and make sure the firewalls on both the Nagios server and the Linux server to be checked are not blocking your SNMP connections.
Copyright by Nagios Enterprises, LLC Cannot be reproduced without written permission. P.O. Box 8154, Saint Paul, MN 55108

Chapter 11: Monitor with SNMP 152
Copyright by Nagios Enterprises, LLC Cannot be reproduced without written permission. P.O. Box 8154, Saint Paul, MN 55108

Chapter 12: Exercises 153
Chapter 12: Exercises
Exercise #1: Installation From SourceYour company has decided to implement Nagios Core and has asked you to install the latest versions of Nagios and the Plugins on a CentoOS 6 system.
Download Nagios and the plugin packages to /tmp directory.
cd /usr/local/srcwget http://prdownloads.sourceforge.net/sourceforge/nagios/nagios3.4.1.tar.gz
wget http://sourceforge.net/projects/nagiosplug/files/nagiosplug/1.4.15/nagiosplugins1.4.15.tar.gz/download
Install the necessary applications to compileyum install y httpd php gcc glibc glibccommon gd gddevel
Add users and groups
useradd nagios groupadd nagcmd
usermod a G nagcmd nagios
Compile Nagios and plugins
tar zxvf nagios3.4.1.tar.gz
cd nagios./configure withcommandgroup=nagcmd
make all make install; make installinit; make installconfig; make install
commandmode; make installwebconf
Now install the plugins.
cd /tmptar zxvf nagiosplugins1.4.15.tar.gzcd nagiosplugins1.4.15
Install several dependencies so you can check mysql and use snmp.
yum install y mysqlserver netsnmp netsnmputilsNow compile the plugins.
Copyright by Nagios Enterprises, LLC Cannot be reproduced without written permission. P.O. Box 8154, Saint Paul, MN 55108
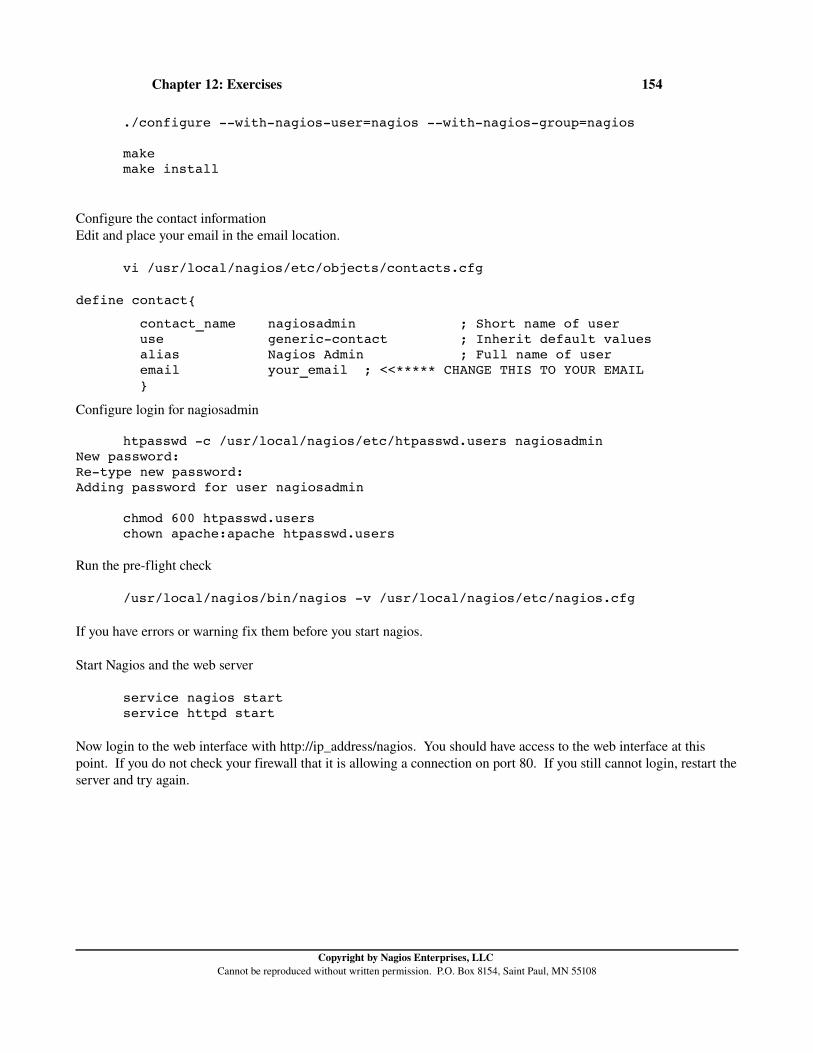
Chapter 12: Exercises 154
./configure withnagiosuser=nagios withnagiosgroup=nagios
make make install
Configure the contact informationEdit and place your email in the email location.
vi /usr/local/nagios/etc/objects/contacts.cfg
define contact{
contact_name nagiosadmin ; Short name of user use genericcontact ; Inherit default values alias Nagios Admin ; Full name of user email your_email ; <<***** CHANGE THIS TO YOUR EMAIL }
Configure login for nagiosadmin
htpasswd c /usr/local/nagios/etc/htpasswd.users nagiosadmin New password: Retype new password: Adding password for user nagiosadmin
chmod 600 htpasswd.users chown apache:apache htpasswd.users
Run the preflight check
/usr/local/nagios/bin/nagios v /usr/local/nagios/etc/nagios.cfg
If you have errors or warning fix them before you start nagios.
Start Nagios and the web server
service nagios startservice httpd start
Now login to the web interface with http://ip_address/nagios. You should have access to the web interface at this point. If you do not check your firewall that it is allowing a connection on port 80. If you still cannot login, restart the server and try again.
Copyright by Nagios Enterprises, LLC Cannot be reproduced without written permission. P.O. Box 8154, Saint Paul, MN 55108

Chapter 12: Exercises 155
Exercise #2: Increasing Nagios PerformanceYour organization has grown and with it the use of Nagios as a tool to monitor the network has increased dramatically. You have seen some system slowness and you would like to start taking steps to increase the speed. The first decision you make is to install a RAM disk in order to use the speed which comes with memory and not disk reads/writes.
Create a directory that can be used as the ramdisk. You decide to just create a directory on the / partition.
mkdir /ramdisk
In order to determine the size of the ramdisk you will need to estimate the combined sizes of two files.
ls lh /usr/local/nagios/var rwrr 1 nagios nagios 217K Feb 10 02:28 objects.cache rwrwr 1 nagios nagios 310K Feb 11 07:40 status.dat
Obviously, not much used here but the ramdisk is made for 100MB because the space is available and you always want to think about growth.
mount t tmpfs none /ramdisk/ o size=100m
Mount the ramdisk and then check that it is mounted.
dfFilesystem 1Kblocks Used Available Use% Mounted on/dev/simfs 2581260 801336 1779924 32% /none 1087956 4 1087952 1% /devnone 102400 0 102400 0% /ramdisk
Make sure the user nagios can use the partition.
chown nagios /ramdisk/
Now edit /etc/fstab to make sure on reboot it will mount automatically. Be sure to double check all entries as an error here will give you problems when you boot. (note this is for CentOS 5.x and 6.x)
tmpfs /ramdisk tmpfs size=100m 0 0
Make sure it will remount correctly on reboot:
mount o remount /ramdisk
Edit nagios.cfg so that nagios knows to use the ramdisk, remember you are making modifications for two files.
#object_cache_file=/usr/local/nagios/var/objects.cache object_cache_file=/ramdisk/objects.cache
#status_file=/usr/local/nagios/var/status.dat status_file=/ramdisk/status.dat
Copyright by Nagios Enterprises, LLC Cannot be reproduced without written permission. P.O. Box 8154, Saint Paul, MN 55108
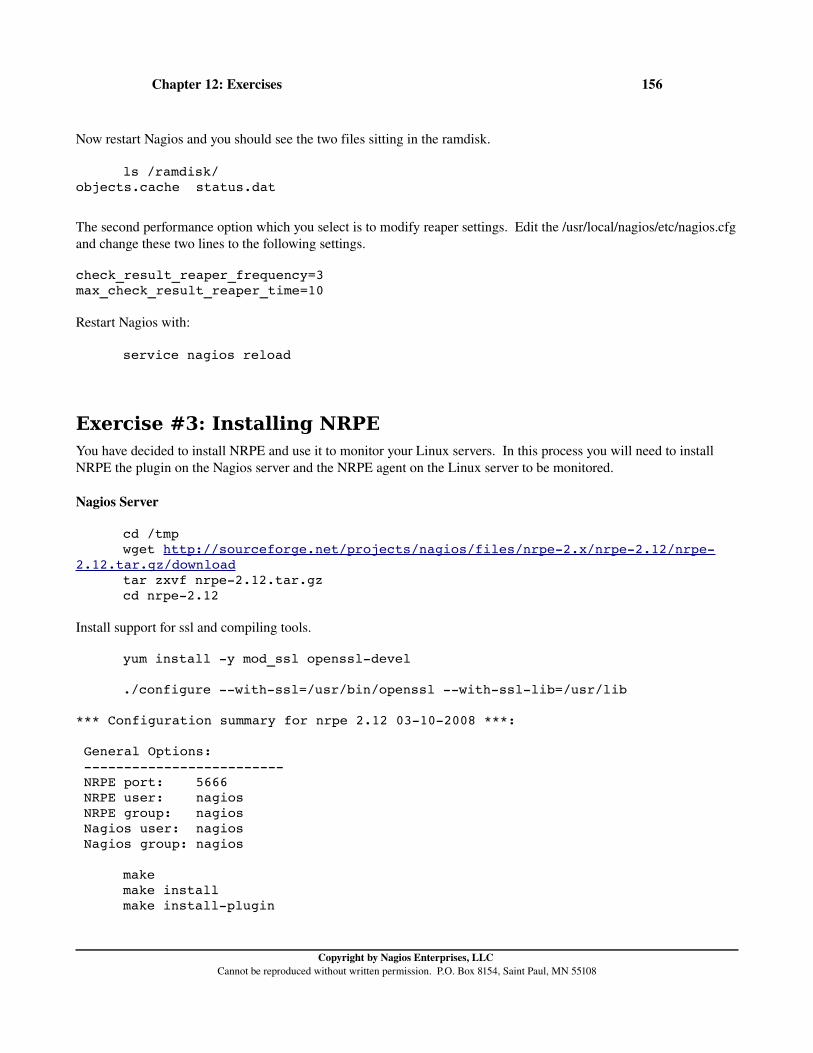
Chapter 12: Exercises 156
Now restart Nagios and you should see the two files sitting in the ramdisk.
ls /ramdisk/ objects.cache status.dat
The second performance option which you select is to modify reaper settings. Edit the /usr/local/nagios/etc/nagios.cfg and change these two lines to the following settings.
check_result_reaper_frequency=3max_check_result_reaper_time=10
Restart Nagios with:
service nagios reload
Exercise #3: Installing NRPEYou have decided to install NRPE and use it to monitor your Linux servers. In this process you will need to install NRPE the plugin on the Nagios server and the NRPE agent on the Linux server to be monitored.
Nagios Server
cd /tmpwget http://sourceforge.net/projects/nagios/files/nrpe2.x/nrpe2.12/nrpe
2.12.tar.gz/download tar zxvf nrpe2.12.tar.gz
cd nrpe2.12
Install support for ssl and compiling tools.
yum install y mod_ssl openssldevel
./configure withssl=/usr/bin/openssl withssllib=/usr/lib
*** Configuration summary for nrpe 2.12 03102008 ***:
General Options: NRPE port: 5666 NRPE user: nagios NRPE group: nagios Nagios user: nagios Nagios group: nagios
makemake install make installplugin
Copyright by Nagios Enterprises, LLC Cannot be reproduced without written permission. P.O. Box 8154, Saint Paul, MN 55108

Chapter 12: Exercises 157
Linux ClientThe agent NRPE must be installed on the client so log into the client and install the agent.
cd /tmpwget http://sourceforge.net/projects/nagios/files/nrpe2.x/nrpe2.12/nrpe
2.12.tar.gz/download tar zxvf nrpe2.12.tar.gz
cd nrpe2.12
You will need to install support for ssl, xinetd and compiling tools.
yum install y mod_ssl openssldevel xinetd gcc make
./configure withssl=/usr/bin/openssl withssllib=/usr/lib
*** Configuration summary for nrpe 2.12 03102008 ***:
General Options: NRPE port: 5666 NRPE user: nagios NRPE group: nagios Nagios user: nagios Nagios group: nagios
makemake install make installplugin make installdaemon make installdaemonconfig make installxinetd
You will need to install xinetd and make sure you have a file in /etc/xinetd.d called nrpe on the client and it looks like this:
# default: off # description: NRPE (Nagios Remote Plugin Executor) service nrpe { flags = REUSE type = UNLISTED port = 5666 socket_type = stream wait = no user = nagios group = nagios server = /usr/sbin/nrpe server_args = c /usr/local/nagios/etc/nrpe.cfg inetd
Copyright by Nagios Enterprises, LLC Cannot be reproduced without written permission. P.O. Box 8154, Saint Paul, MN 55108
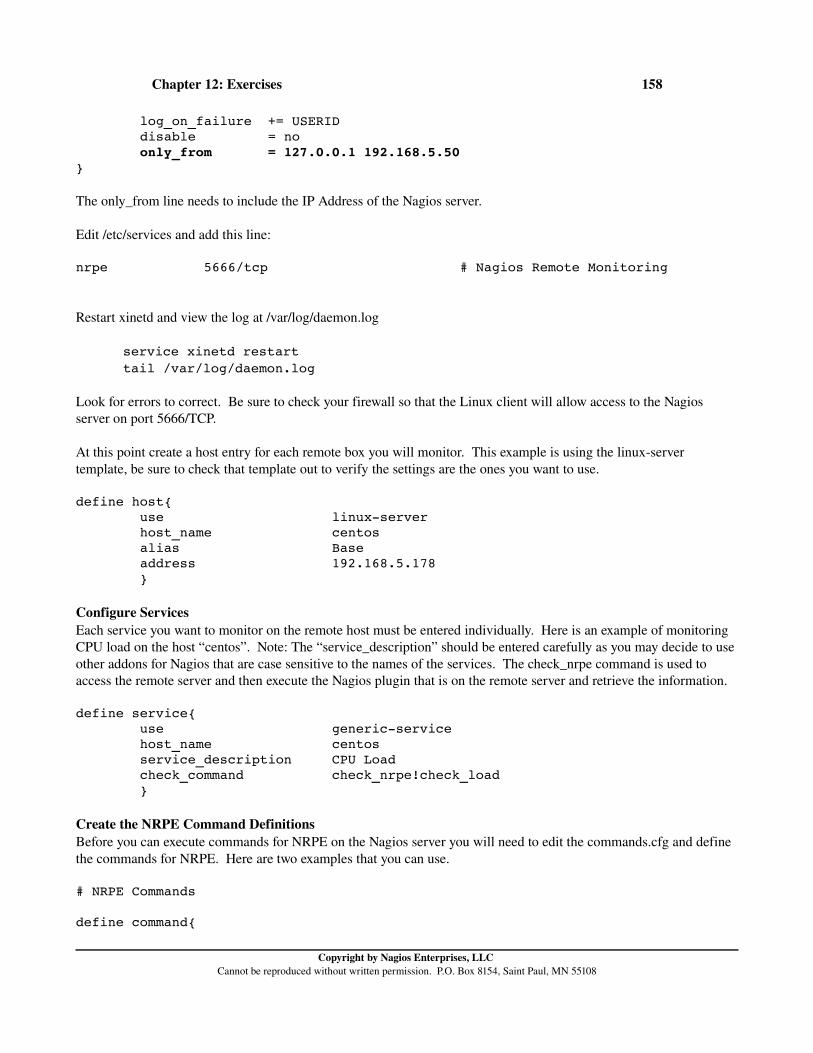
Chapter 12: Exercises 158
log_on_failure += USERID disable = no only_from = 127.0.0.1 192.168.5.50 }
The only_from line needs to include the IP Address of the Nagios server.
Edit /etc/services and add this line:
nrpe 5666/tcp # Nagios Remote Monitoring
Restart xinetd and view the log at /var/log/daemon.log
service xinetd restarttail /var/log/daemon.log
Look for errors to correct. Be sure to check your firewall so that the Linux client will allow access to the Nagios server on port 5666/TCP.
At this point create a host entry for each remote box you will monitor. This example is using the linuxserver template, be sure to check that template out to verify the settings are the ones you want to use.
define host{ use linuxserver host_name centos alias Base address 192.168.5.178 }
Configure ServicesEach service you want to monitor on the remote host must be entered individually. Here is an example of monitoring CPU load on the host “centos”. Note: The “service_description” should be entered carefully as you may decide to use other addons for Nagios that are case sensitive to the names of the services. The check_nrpe command is used to access the remote server and then execute the Nagios plugin that is on the remote server and retrieve the information.
define service{ use genericservice host_name centos service_description CPU Load check_command check_nrpe!check_load }
Create the NRPE Command DefinitionsBefore you can execute commands for NRPE on the Nagios server you will need to edit the commands.cfg and define the commands for NRPE. Here are two examples that you can use.
# NRPE Commands
define command{
Copyright by Nagios Enterprises, LLC Cannot be reproduced without written permission. P.O. Box 8154, Saint Paul, MN 55108

Chapter 12: Exercises 159
command_name check_nrpe command_line $USER1$/check_nrpe H $HOSTADDRESS$ c $ARG1$ }
Once this is complete you must restart your nagios server with:
service nagios restart
If you get errors correct them.
Now you can check your connection by running the following command and using the IP Address of the remote box you want to monitor. You should get the return “NRPE v2.8.1” if all is working.
/usr/local/nagios/libexec/./check_nrpe H 192.168.5.178 NRPE v2.8.1
If you get this return then you have communication between the Nagios monitoring server and the remote host.
Copyright by Nagios Enterprises, LLC Cannot be reproduced without written permission. P.O. Box 8154, Saint Paul, MN 55108