n r agarwal industries limited (1)
TRANSCRIPT

8/7/2019 N R AGARWAL INDUSTRIES LIMITED (1)
http://slidepdf.com/reader/full/n-r-agarwal-industries-limited-1 1/18
8/7/2019 N R AGARWAL INDUSTRIES LIMITED (1)
http://slidepdf.com/reader/full/n-r-agarwal-industries-limited-1 2/18
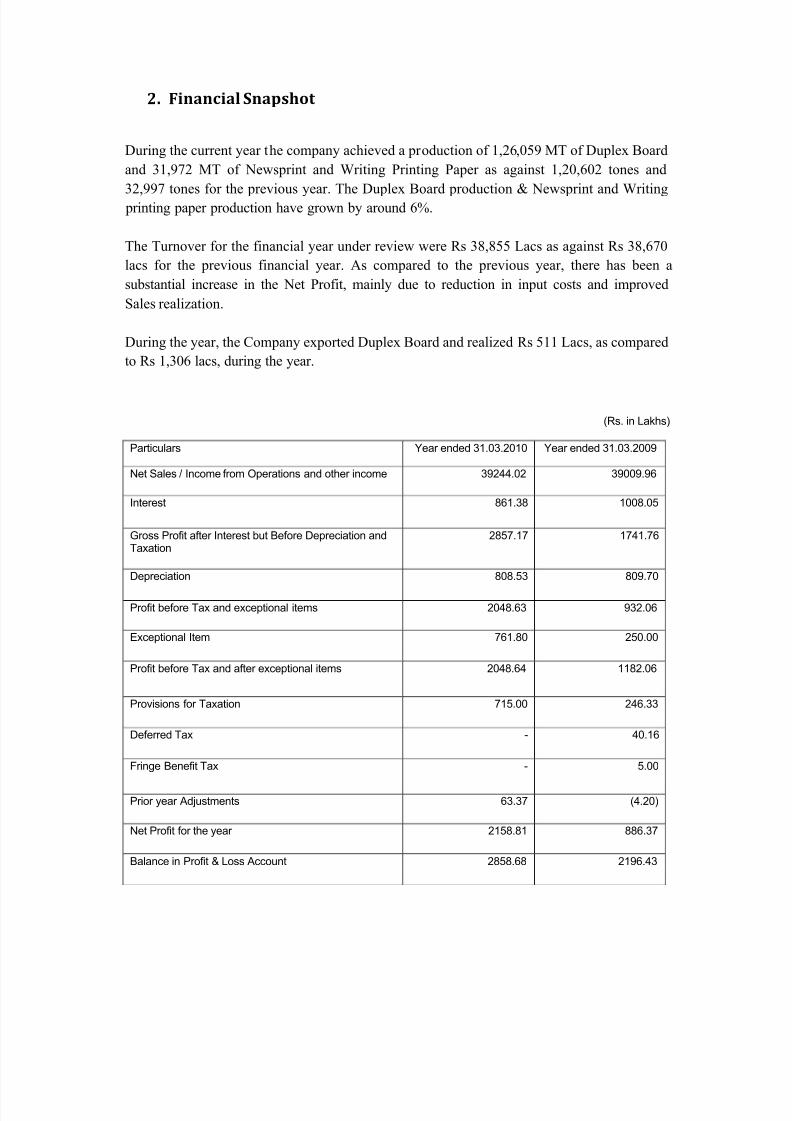
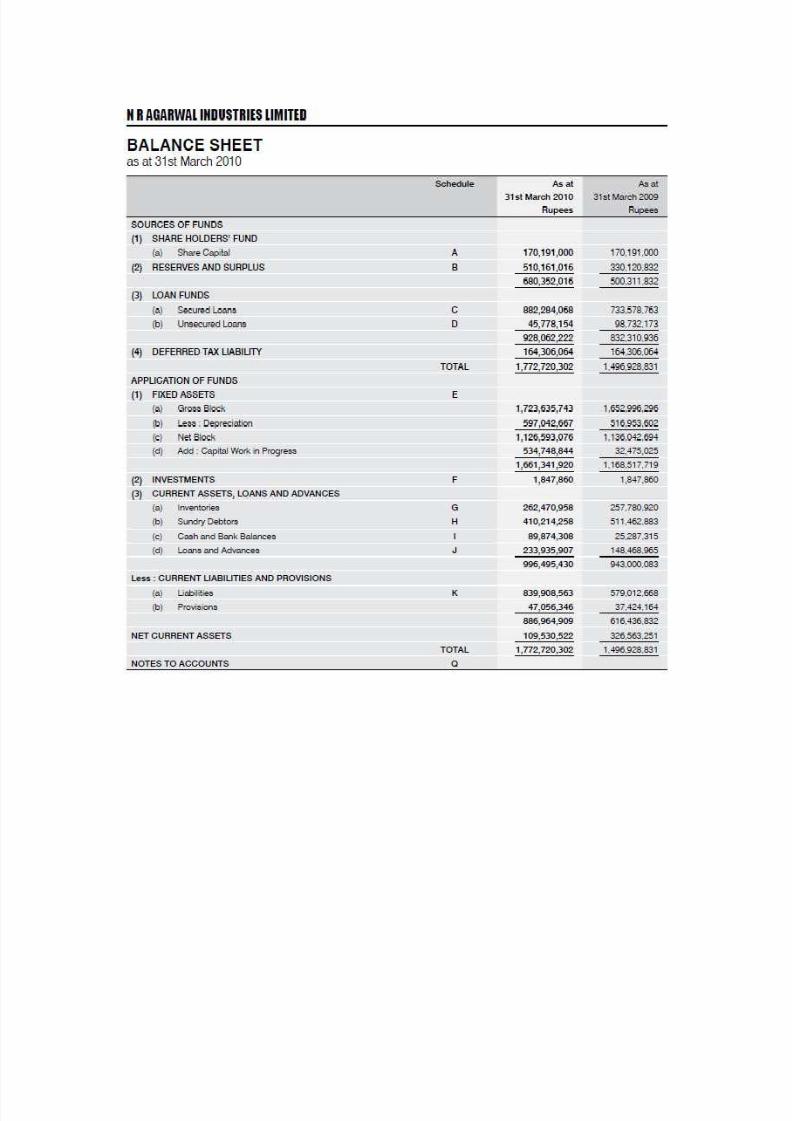
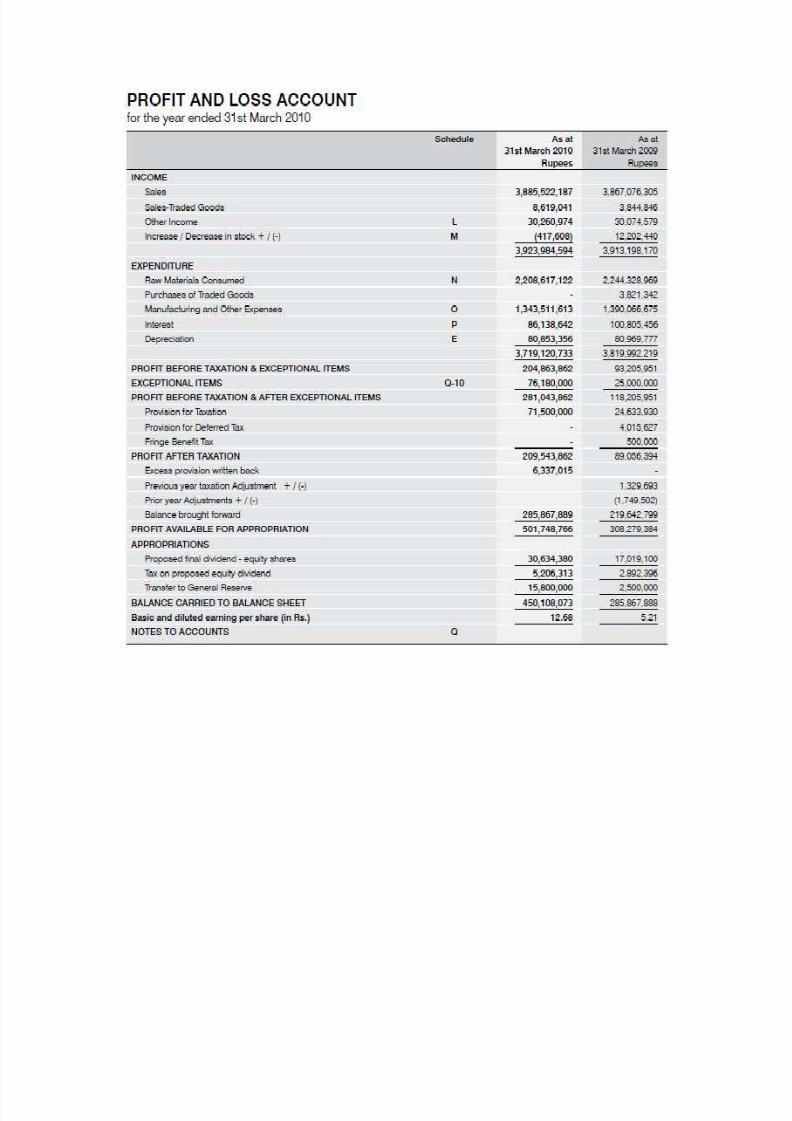
2. Financial Snapshot
During the current year the company achieved a production of 1,26,059 MT of Duplex Board
and 31,972 MT of Newsprint and Writing Printing Paper as against 1,20,602 tones and
32,997 tones for the previous year. The Duplex Board production & Newsprint and Writing printing paper production have grown by around 6%.
The Turnover for the financial year under review were Rs 38,855 Lacs as against Rs 38,670
lacs for the previous financial year. As compared to the previous year, there has been a
substantial increase in the Net Profit, mainly due to reduction in input costs and improved
Sales realization.
During the year, the Company exported Duplex Board and realized Rs 511 Lacs, as compared
to Rs 1,306 lacs, during the year.
(Rs. in Lakhs)
Particulars Year ended 31.03.2010 Year ended 31.03.2009
Net Sales / Income from Operations and other income 39244.02 39009.96
Interest 861.38 1008.05
Gross Profit after Interest but Before Depreciation andTaxation
2857.17 1741.76
Depreciation 808.53 809.70
Profit before Tax and exceptional items 2048.63 932.06
Exceptional Item 761.80 250.00
Profit before Tax and after exceptional items 2048.64 1182.06
Provisions for Taxation 715.00 246.33
Deferred Tax - 40.16
Fringe Benefit Tax - 5.00
Prior year Adjustments 63.37 (4.20)
Net Profit for the year 2158.81 886.37
Balance in Profit & Loss Account 2858.68 2196.43
8/7/2019 N R AGARWAL INDUSTRIES LIMITED (1)
http://slidepdf.com/reader/full/n-r-agarwal-industries-limited-1 3/18
8/7/2019 N R AGARWAL INDUSTRIES LIMITED (1)
http://slidepdf.com/reader/full/n-r-agarwal-industries-limited-1 4/18
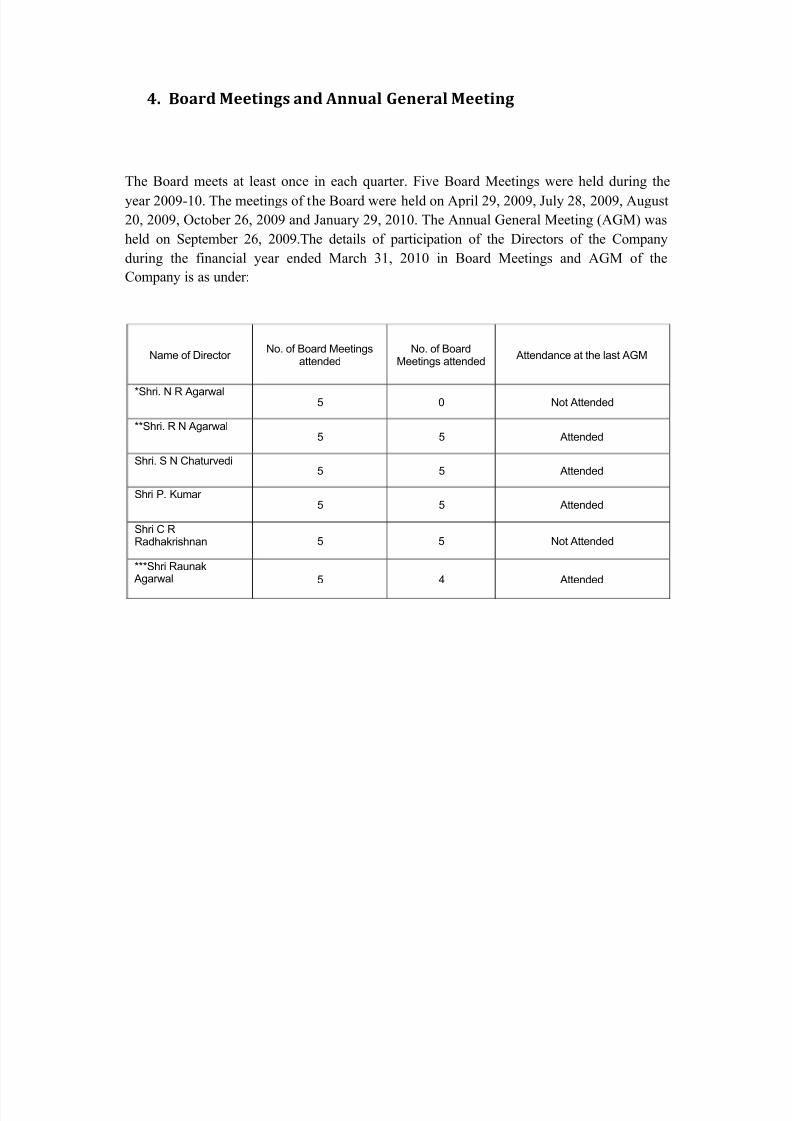
4. Board Meetings and Annual General Meeting
The Board meets at least once in each quarter. Five Board Meetings were held during the
year 2009-10. The meetings of the Board were held on April 29, 2009, July 28, 2009, August
20, 2009, October 26, 2009 and January 29, 2010. The Annual General Meeting (AGM) was
held on September 26, 2009.The details of participation of the Directors of the Company
during the financial year ended March 31, 2010 in Board Meetings and AGM of the
Company is as under:
Name of Director No. of Board Meetings
attendedNo. of Board
Meetings attended Attendance at the last AGM
*Shri. N R Agarwal5 0 Not Attended
**Shri. R N Agarwal5 5 Attended
Shri. S N Chaturvedi5 5 Attended
Shri P. Kumar 5 5 Attended
Shri C RRadhakrishnan 5 5 Not Attended
***Shri Raunak Agarwal 5 4 Attended
8/7/2019 N R AGARWAL INDUSTRIES LIMITED (1)
http://slidepdf.com/reader/full/n-r-agarwal-industries-limited-1 5/18
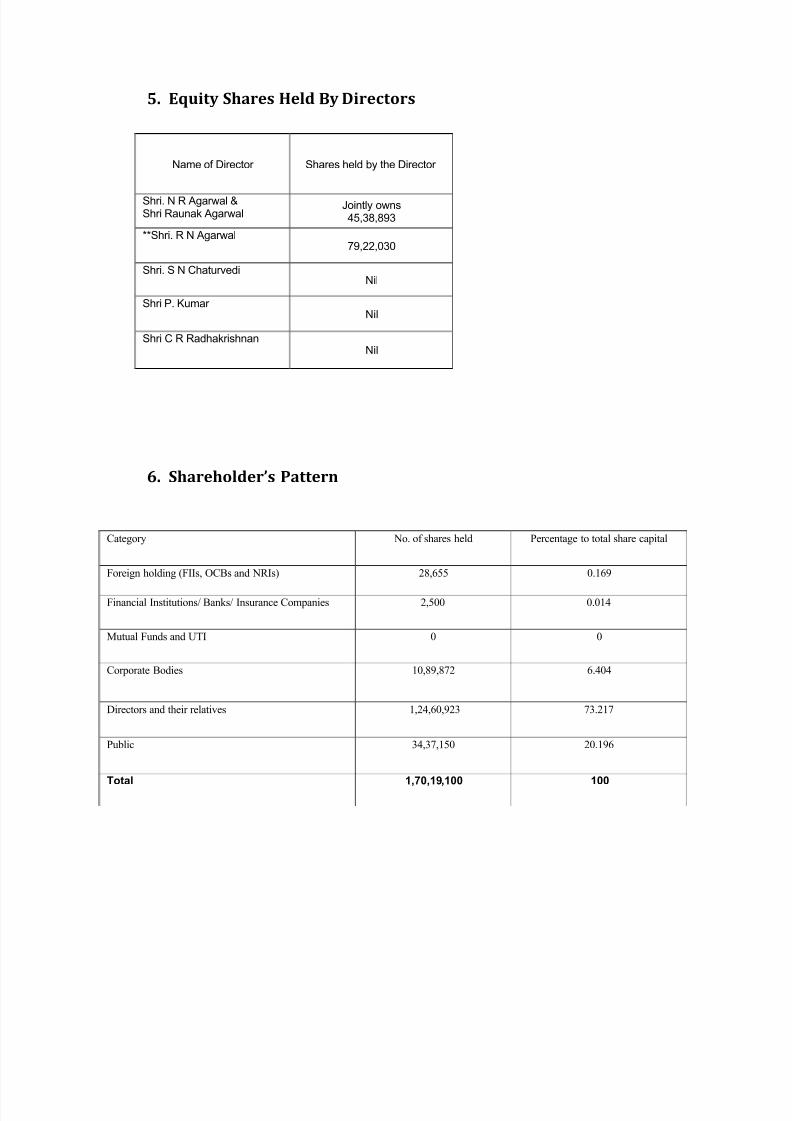
5. Equity Shares Held By Directors
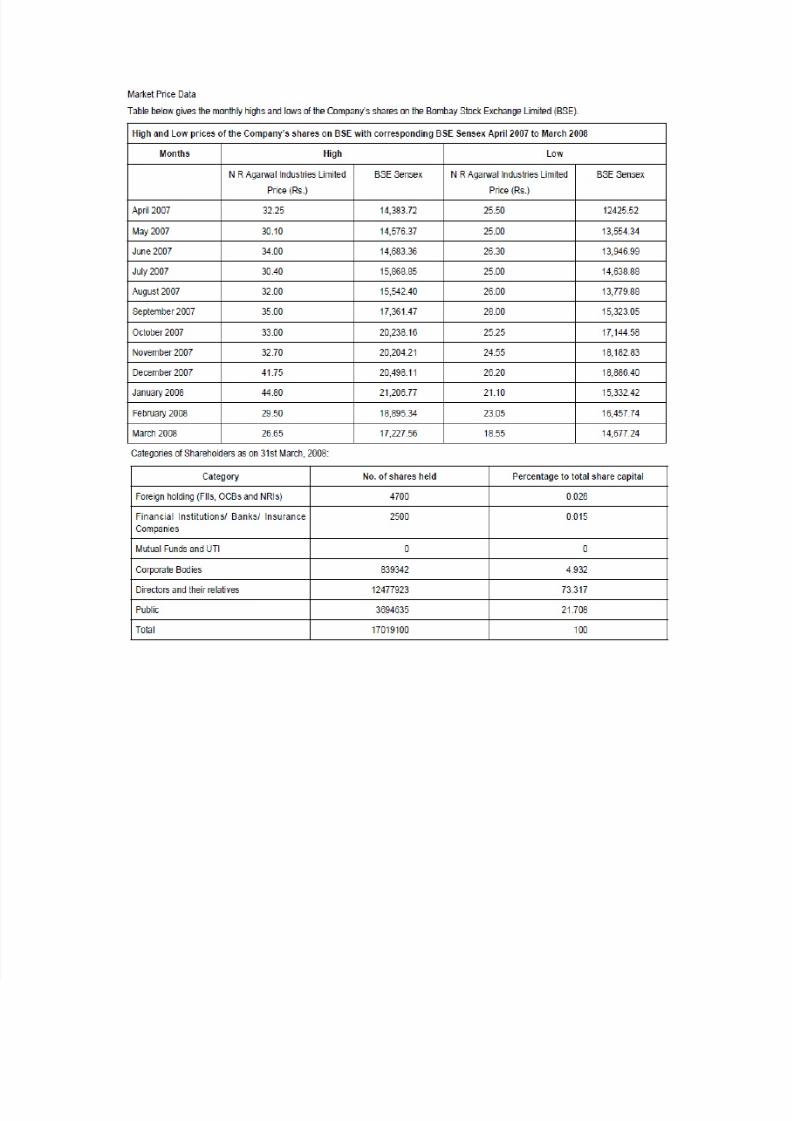
6. Shareholders Pattern
Name of Director Shares held by the Director
Shri. N R Agarwal &Shri Raunak Agarwal
Jointly owns45,38,893
**Shri. R N Agarwal79,22,030
Shri. S N ChaturvediNil
Shri P. Kumar Nil
Shri C R RadhakrishnanNil
Category No. of shares held Percentage to total share capital
Foreign holding (FIIs, OCBs and NRIs) 28,655 0.169
Financial Institutions/ Banks/ Insurance Companies 2,500 0.014
Mutual Funds and UTI 0 0
Corporate Bodies 10,89,872 6.404
Directors and their relatives 1,24,60,923 73.217
Public 34,37,150 20.196
Total 1,70,19,100 100
8/7/2019 N R AGARWAL INDUSTRIES LIMITED (1)
http://slidepdf.com/reader/full/n-r-agarwal-industries-limited-1 6/18
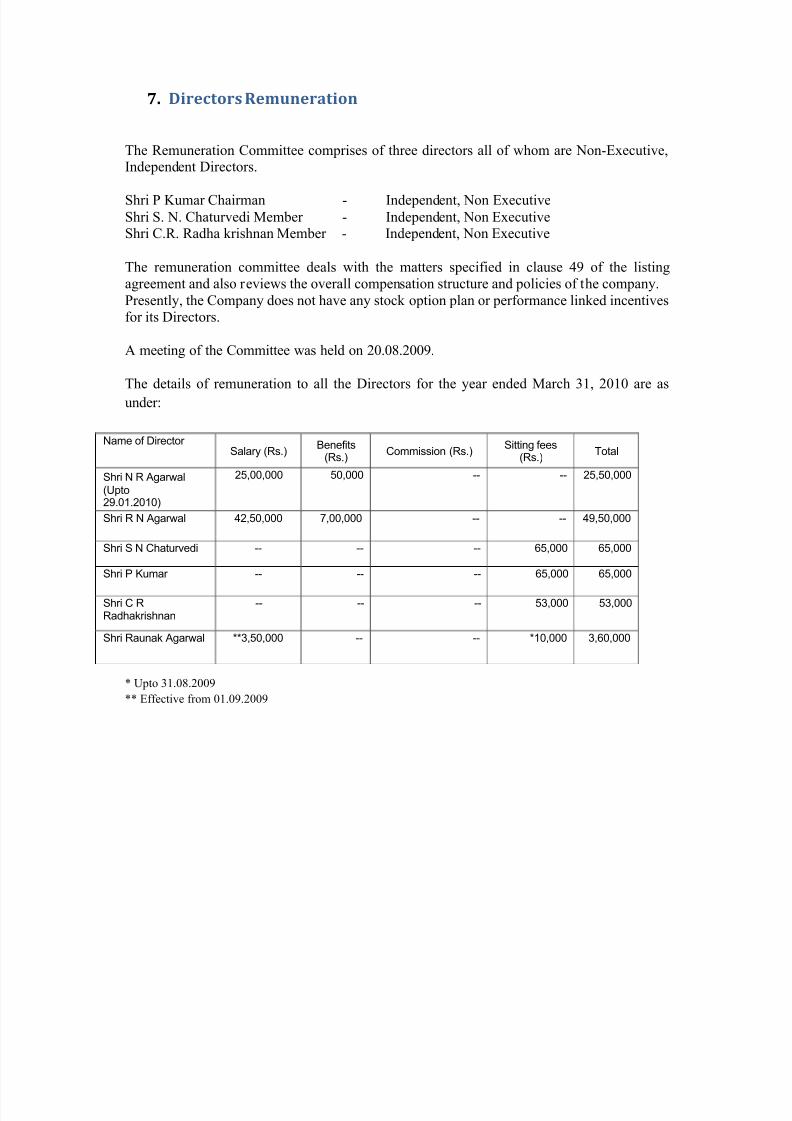
7. Directors Remuneration
The Remuneration Committee comprises of three directors all of whom are Non-Executive,Independent Directors.
Shri P Kumar Chairman - Independent, Non ExecutiveShri S. N. Chaturvedi Member - Independent, Non ExecutiveShri C.R. Radha krishnan Member - Independent, Non Executive
The remuneration committee deals with the matters specified in clause 49 of the listing
agreement and also reviews the overall compensation structure and policies of the company.
Presently, the Company does not have any stock option plan or performance linked incentives
for its Directors.
A meeting of the Committee was held on 20.08.2009.
The details of remuneration to all the Directors for the year ended March 31, 2010 are as
under:
* Upto 31.08.2009
** Effective from 01.09.2009
Name of Director Salary (Rs.)
Benefits(Rs.)
Commission (Rs.)Sitting fees
(Rs.)Total
Shri N R Agarwal
(Upto29.01.2010)
25,00,000 50,000 -- -- 25,50,000
Shri R N Agarwal 42,50,000 7,00,000 -- -- 49,50,000
Shri S N Chaturvedi -- -- -- 65,000 65,000
Shri P Kumar -- -- -- 65,000 65,000
Shri C RRadhakrishnan
-- -- -- 53,000 53,000
Shri Raunak Agarwal **3,50,000 -- -- *10,000 3,60,000
8/7/2019 N R AGARWAL INDUSTRIES LIMITED (1)
http://slidepdf.com/reader/full/n-r-agarwal-industries-limited-1 7/18
8. Governance Report Overview
Corporate Governance is about commitment to values and ethical business conduct. It is also
about how an organisation is managed viz., its corporate and business structures, its culture,
policies and the manner in which it deals with various stakeholders. Timely and accuratedisclosure of information regarding the financial position of the company, its performance
and ownership forms part of the corporate governance.
N R Agarwal Industries Limited (NRAIL) continues to uphold its commitment to high
standards of corporate governance. In all its operations and processes, the Company adheres
to stringent governance norms so that its stakeholders are ensured of superior financial
performance.
Through its corporate governance measures, the Company aims to maintain transparency in
its financial reporting and keep all its stakeholders informed about its policies, performanceand developments. NRAIL will contribute to sustain and strengthen stakeholder¶s confidence
by adopting and continuously improving good corporate practices.
The Company¶s Board has laid down identifiable policies and guidelines related to the key
elements of corporate governance-transparency, disclosure, supervision and internal control,
risk management, internal and external communications, high standard of safety, accounting
fidelity, product and service quality. It has also introduced adequate review processes.
Related Party Transactions:
There were no transactions of Material nature with related parties i.e. with its promoters,
directors or the management, their subsidiaries or relatives etc. that may have potential
conflict with the interest of the company at large. The transactions with related parties as per
Accounting Standard AS-18, are set out in notes to accounts in the Annual Report and were
placed before the Audit Committee periodically.
Risk Management:
The Board of Directors have been informed from time to time the business risks faced by the
Company and the steps taken by the management to face them.
Management
The management discussion and analysis report forms part of this annual report.

8/7/2019 N R AGARWAL INDUSTRIES LIMITED (1)
http://slidepdf.com/reader/full/n-r-agarwal-industries-limited-1 8/18
The Company has complied with the requirements of regulatory authorities on matters relatedto capital markets and no penalties/strictures have been imposed against the Company during
the last three years.
Whistle Blowing Policy:
The company has not framed whistle blower policy. However, no personnel has been
denied access to the audit committee
8/7/2019 N R AGARWAL INDUSTRIES LIMITED (1)
http://slidepdf.com/reader/full/n-r-agarwal-industries-limited-1 9/18
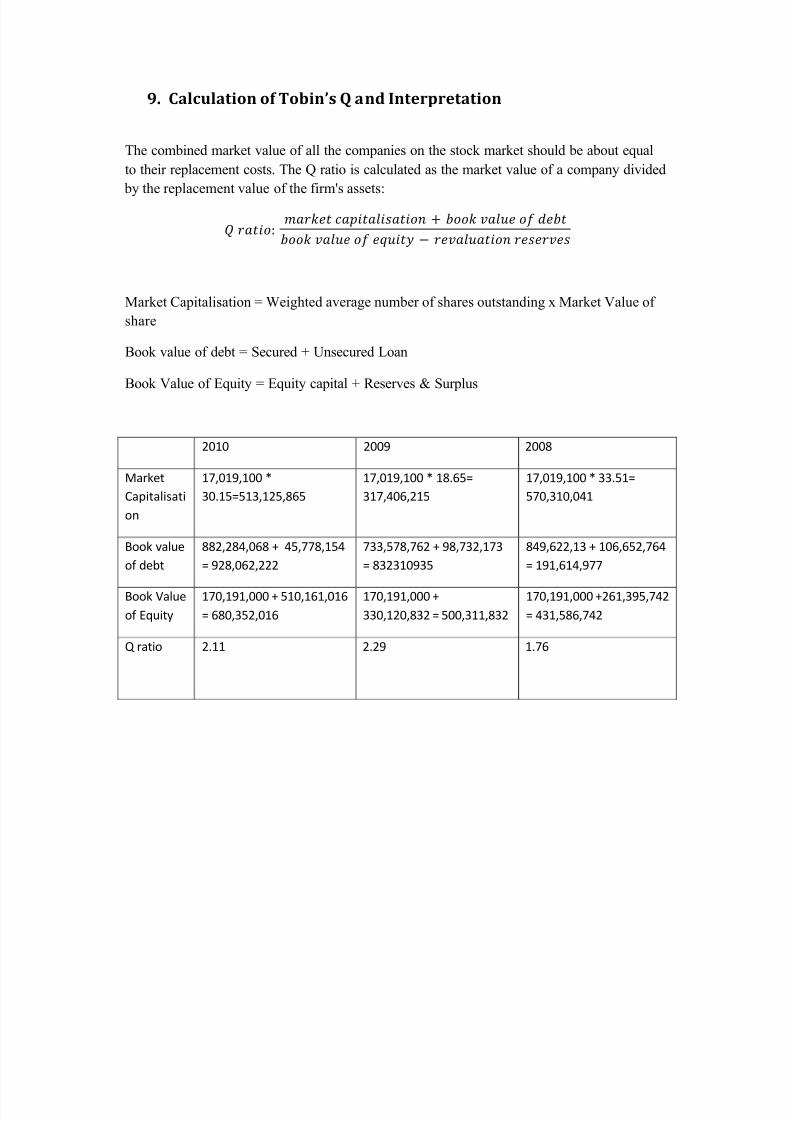
9. Calculation of Tobins Q and Interpretation
The combined market value of all the companies on the stock market should be about equal
to their replacement costs. The Q ratio is calculated as the market value of a company divided
by the replacement value of the firm's assets:
Market Capitalisation = Weighted average number of shares outstanding x Market Value of
share
Book value of debt = Secured + Unsecured Loan
Book Value of Equity = Equity capital + Reserves & Surplus
2010 2009 2008
Market
Capitalisati
on
17,019,100 *
30.15=513,125,865
17,019,100 * 18.65=
317,406,215
17,019,100 * 33.51=
570,310,041
Book value
of debt
882,284,068 + 45,778,154
= 928,062,222
733,578,762 + 98,732,173
= 832310935
849,622,13 + 106,652,764
= 191,614,977
Book Value
of Equity
170,191,000 + 510,161,016
= 680,352,016
170,191,000 +
330,120,832 = 500,311,832
170,191,000 +261,395,742
= 431,586,742
Q ratio 2.11 2.29 1.76

8/7/2019 N R AGARWAL INDUSTRIES LIMITED (1)
http://slidepdf.com/reader/full/n-r-agarwal-industries-limited-1 10/18
Inference:
y A low Q (between 0 and 1) means that the cost to replace a firm's assets is greater
than the value of its stock. This implies that the stock is undervalued.
y Conversely, a high Q (greater than 1) implies that a firm's stock is more expensive
than the replacement cost of its assets, which implies that the stock is overvalued.
y This measure of stock valuation is the driving factor behind investment decisions in
Tobin's model.
y From here where we infer that in 2008 stocks were overvalued as Q ratio comes out to
be 1.76 but in the next fiscal year 2008-09 Q value increased from to 2.29, which
means that stocks were overvalued compared to last year.
y In the latest fiscal 2009-10 company has performed better as Q ratio has come down
to 2.11. As market capitalisation came down because of the share price has declined.
This indicates the company has improved in terms of firm performance.

8/7/2019 N R AGARWAL INDUSTRIES LIMITED (1)
http://slidepdf.com/reader/full/n-r-agarwal-industries-limited-1 11/18
Regression Data
TOBIN's
Q
Board
Composition
2008 1.76 0.571428571
2009 2.29 0.571428571
2010 2.11 0.5
SUMMARY
OUTPUT
Regression
Statistics
Multiple R 0.7605
R Square 0.57836
Adjusted R
Square 0.15672
Standard Error 0.24749
Observations 3
ANOVA
df SS MS F
Significance
F Regression 1 0.084016667 0.084017 1.3717007 0.44990692
Residual 1 0.06125 0.06125
Total 2 0.145266667
Coefficients St. Error t Stat P-value Lower 95%
Upper
95%
Lower
95%
Upper
95%
Intercept 4.775 2.33 2.05 0.29 -24.81 34.36 -24.81 34.36
-4.97 4.24 -1.17 0.45 -58.89 48.95 -58.89 48.95
Inference:
Regression analysis has been conducted to find out the effect of board composition on firm
performance.Seeing the analysis we found that R square =57% which means that 57% of the
variation in tobin¶s q is being explained by variation in board composition.Further we find
that there is a inverse relationship between board composition and tobin¶s q denoted by beta
coefficient = - 4.97
8/7/2019 N R AGARWAL INDUSTRIES LIMITED (1)
http://slidepdf.com/reader/full/n-r-agarwal-industries-limited-1 12/18
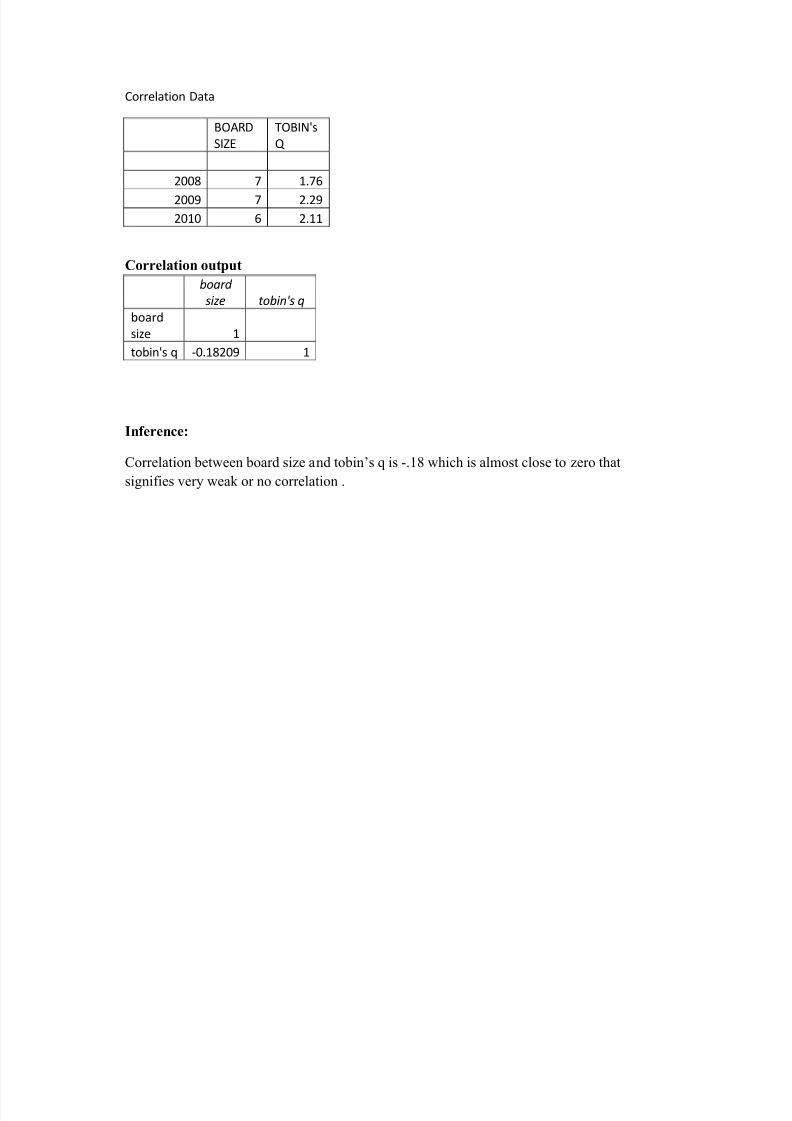
Correlation Data
BOARD
SIZE
TOBIN's
Q
2008 7 1.76
2009 7 2.29
2010 6 2.11
Correlation output
board
size tobin's q
board
size 1
tobin's q -0.18209 1
Inference:
Correlation between board size and tobin¶s q is -.18 which is almost close to zero that
signifies very weak or no correlation .

8/7/2019 N R AGARWAL INDUSTRIES LIMITED (1)
http://slidepdf.com/reader/full/n-r-agarwal-industries-limited-1 13/18

8/7/2019 N R AGARWAL INDUSTRIES LIMITED (1)
http://slidepdf.com/reader/full/n-r-agarwal-industries-limited-1 14/18
Annexure
8/7/2019 N R AGARWAL INDUSTRIES LIMITED (1)
http://slidepdf.com/reader/full/n-r-agarwal-industries-limited-1 15/18
8/7/2019 N R AGARWAL INDUSTRIES LIMITED (1)
http://slidepdf.com/reader/full/n-r-agarwal-industries-limited-1 16/18

8/7/2019 N R AGARWAL INDUSTRIES LIMITED (1)
http://slidepdf.com/reader/full/n-r-agarwal-industries-limited-1 17/18
8/7/2019 N R AGARWAL INDUSTRIES LIMITED (1)
http://slidepdf.com/reader/full/n-r-agarwal-industries-limited-1 18/18