n overview of spectral in vivo fluorescence …
TRANSCRIPT
www.jerico-fp7.eu
AN OVERVIEW OF SPECTRAL IN VIVO FLUORESCENCEMETHODS FOR PHYTOPLANKTON TAXONOMY
JUKKA SEPPÄLÄ, SEPPO KAITALA, MIKA RAATEOJA, STEFAN SIMIS, PASI YLÖSTALO
FINNISH ENVIRONMENT INSTITUTE
5th FerryBox Workshop - Celebrating 20 Years of Alg@lineApril 24-25, 2013 Helsinki

Pigment taxonomy Spectral fluorescenceTaxonomic spectral groups
Phycobilin fluorescence Origins of Phycocyanin /Phycoerythrin fluorescenceInstrumentationExamples for Baltic Sea
Spectral fluorescence Measuring techniquesInstrumentationData analysisExamples
AN OVERVIEW OF SPECTRAL IN VIVO FLUORESCENCEMETHODS FOR PHYTOPLANKTON TAXONOMY

SPECTRAL FLUORESCENCE: two wavelengthdimensions - excitation and emission - allowingbetter separation of various substances.
Babichenko et al 2000

TAXONOMIC SPECTRAL GROUPS: In living phytoplankton,accessory pigments in PSII transfer energy to Chla but do not emitfluorescence, only Chla in PSII and phycobilin pigments emitfluorescence
Sepp
älä
2009

TAXONOMIC SPECTRAL GROUPS: Group-specificExcitation-Emission Matrix is the basis forfluorescence based taxonomy
Nodularia Aphanizomenon Green Synechococcus
Red Synechococcus Cryptomonad Green algae
Seppälä et al 2007

Babi
chen
ko,P
oryv
kina
,Kai
tala
1995
Sepp
älä
&Ba
lode
1998
PHYCOBILIN FLUORESCENCE, EARLY YEARS”We may not know exactly what we are measuring, but the patternsobserved are too strong to ignore” Cullen & Renger 1979.
Seppälä, Ylöstalo, Kuosa 2005

PHYCOCYANIN FLUORESCENCE, Operationaldetection of filamentous cyanobacteria started2005
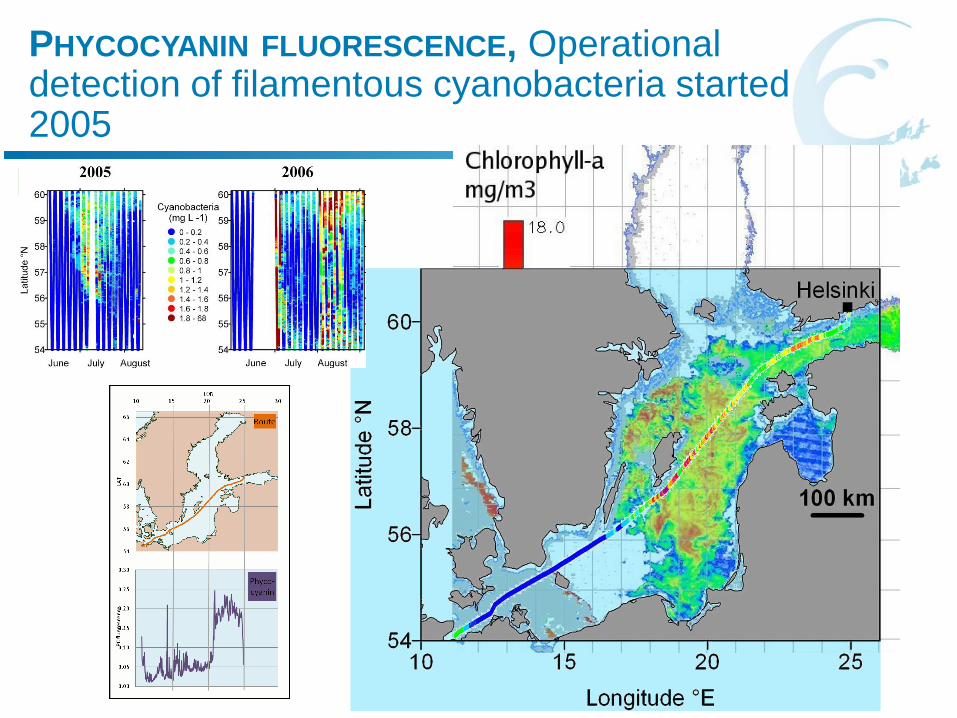
PHYCOCYANIN FLUORESCENCE, Operationaldetection of filamentous cyanobacteria started2005
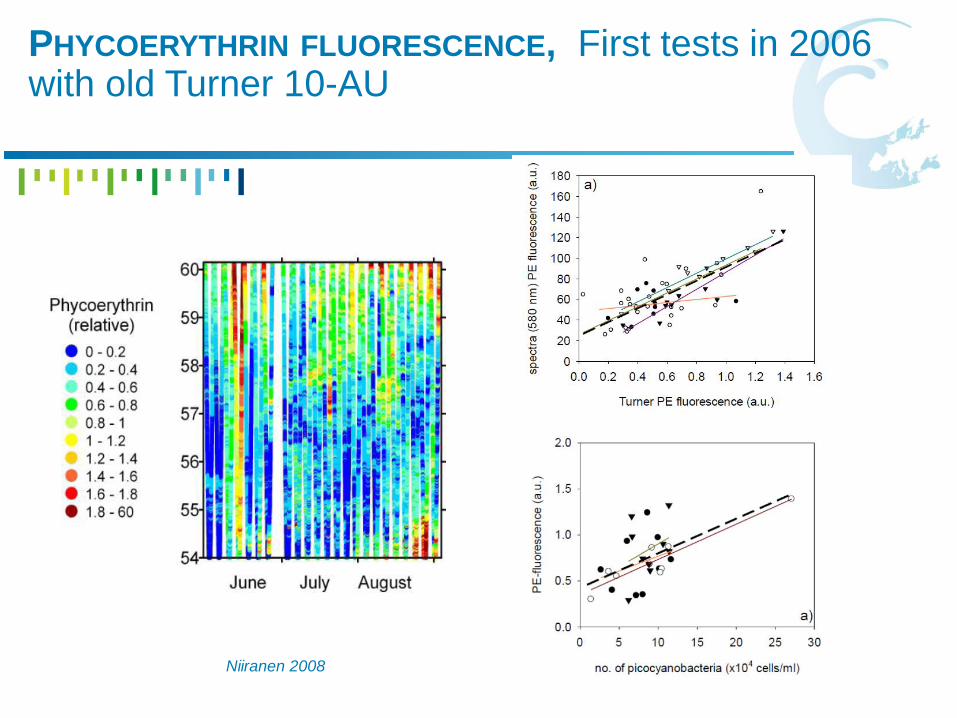
PHYCOERYTHRIN FLUORESCENCE, First tests in 2006with old Turner 10-AU
Niiranen 2008
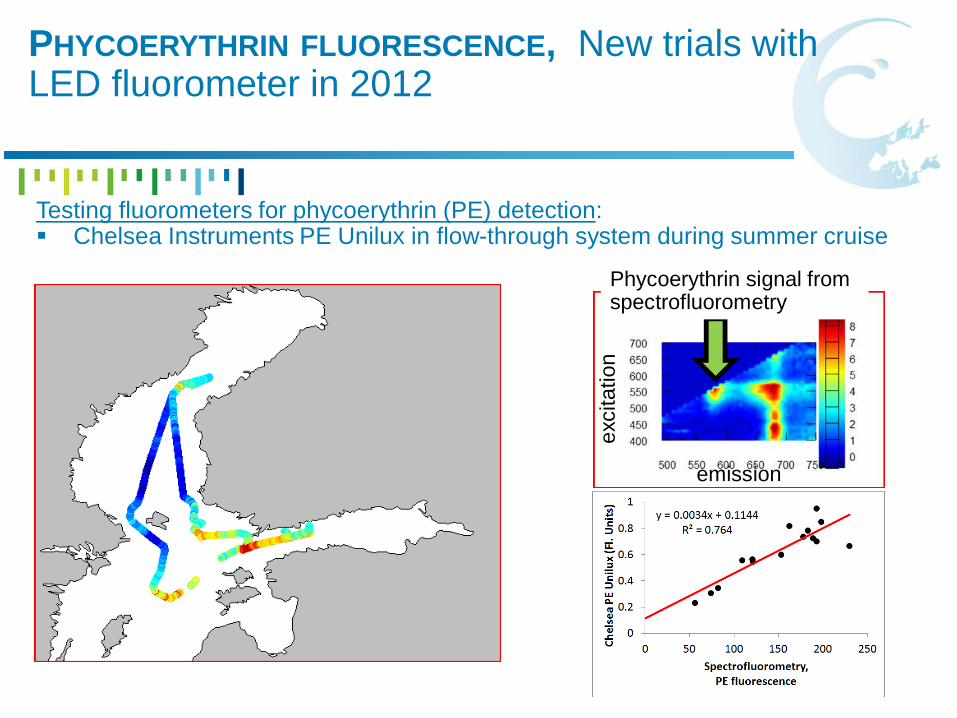
PHYCOERYTHRIN FLUORESCENCE, New trials withLED fluorometer in 2012
Testing fluorometers for phycoerythrin (PE) detection:Chelsea Instruments PE Unilux in flow-through system during summer cruise
Phycoerythrin signal fromspectrofluorometry
exci
tatio
n
emission

PHYCOERYTHRIN FLUORESCENCE, New trials withLED fluorometer in 2012 2013 FerryBox.
FlowCAM to identify and count PE containinglarger cells (>5 µm)PE containing species: Mesodinium rubrum,Dinophysis norvegica, Cryptomonads, colonialcyanobacteria
Picocyanobacteria counts (microscopy, flowcytometry)
Photos: Baltic Sea Portal; nordicmicroalgae.org
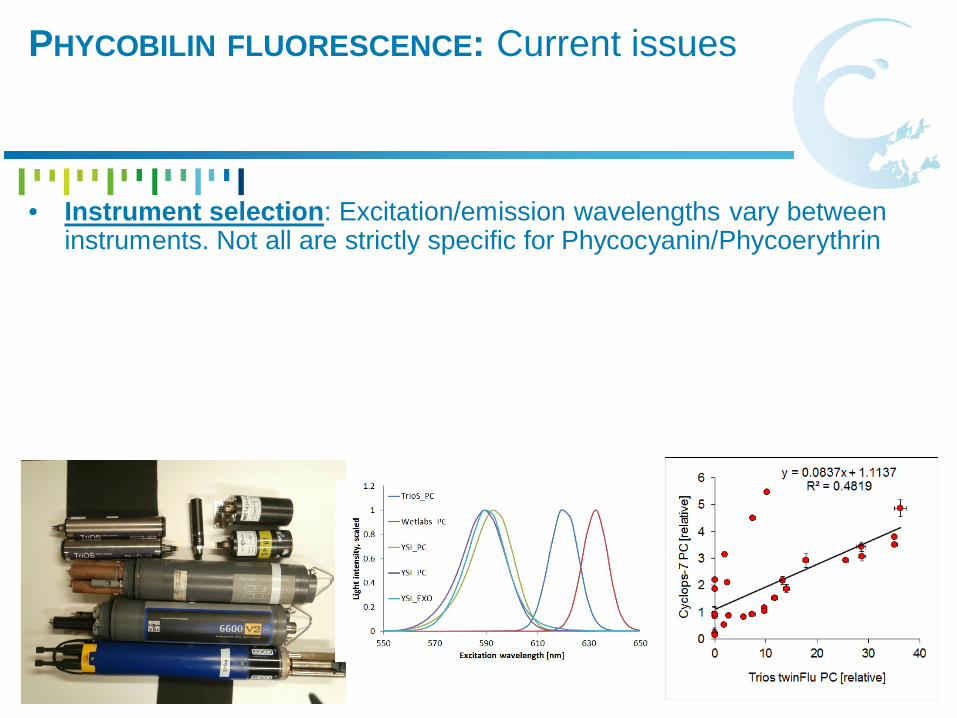
PHYCOBILIN FLUORESCENCE: Current issues
• Instrument selection: Excitation/emission wavelengths vary betweeninstruments. Not all are strictly specific for Phycocyanin/Phycoerythrin

PHYCOBILIN FLUORESCENCE: Current issues
• Instrument selection: Excitation/emission wavelenghts vary betweeninstruments. Not all are strictly specific for Phycocyanin/Phycoerythrin
• Calibration: Solid secondary standards provide stable and traceable wayfor monitoring instrument performance, but chemical standards would beneeded for instrument comparisons and concentration measurements.
• Validation: More information is needed for biomass-fluorescencerelationship
Izydorczyk etal 2005Bowling etal 2010
Seppälä et al 2007

PHYCOBILIN FLUORESCENCE: Current issues
Attil
aet
al.u
npub
l.
• Instrument selection: Excitation/emission wavelenghts vary betweeninstruments. Not all are strictly specific for Phycocyanin/Phycoerythrin
• Calibration: Solid secondary standards provide stable and traceable wayfor monitoring instrument performance, but chemical standards would beneeded for instrument comparisons and concentration measurements.
• Validation: More information is needed for biomass-fluorescencerelationship
• Use of data: EO validation, Ecosystem model validation, visualization
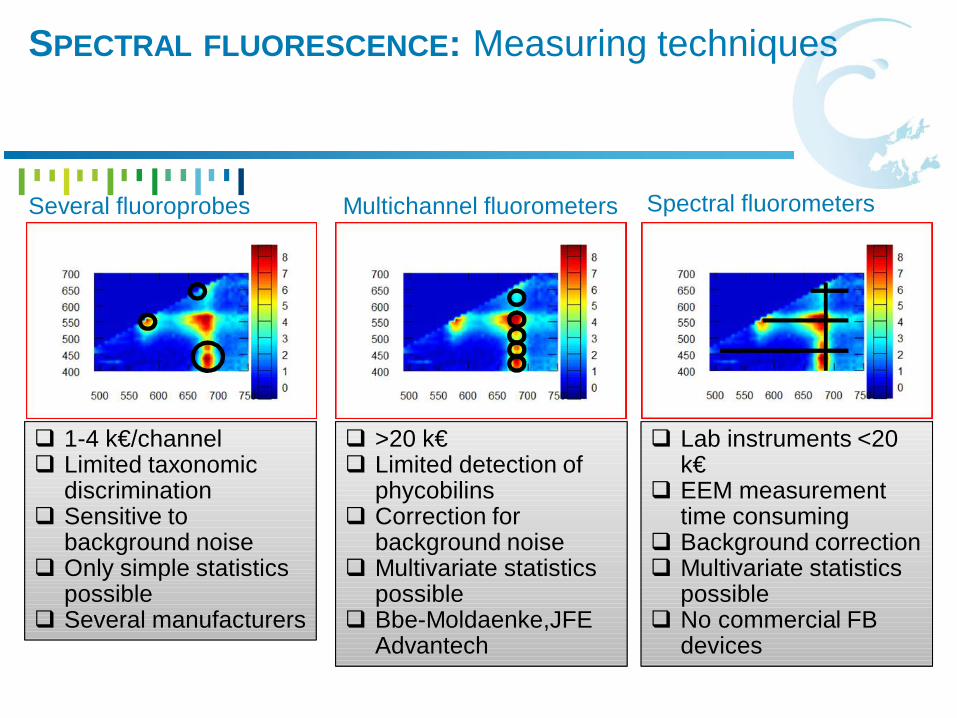
SPECTRAL FLUORESCENCE: Measuring techniques
Several fluoroprobes Multichannel fluorometers Spectral fluorometers
1-4 k€/channelLimited taxonomicdiscriminationSensitive tobackground noiseOnly simple statisticspossibleSeveral manufacturers
>20 k€Limited detection ofphycobilinsCorrection forbackground noiseMultivariate statisticspossibleBbe-Moldaenke,JFEAdvantech
Lab instruments <20k€EEM measurementtime consumingBackground correctionMultivariate statisticspossibleNo commercial FBdevices

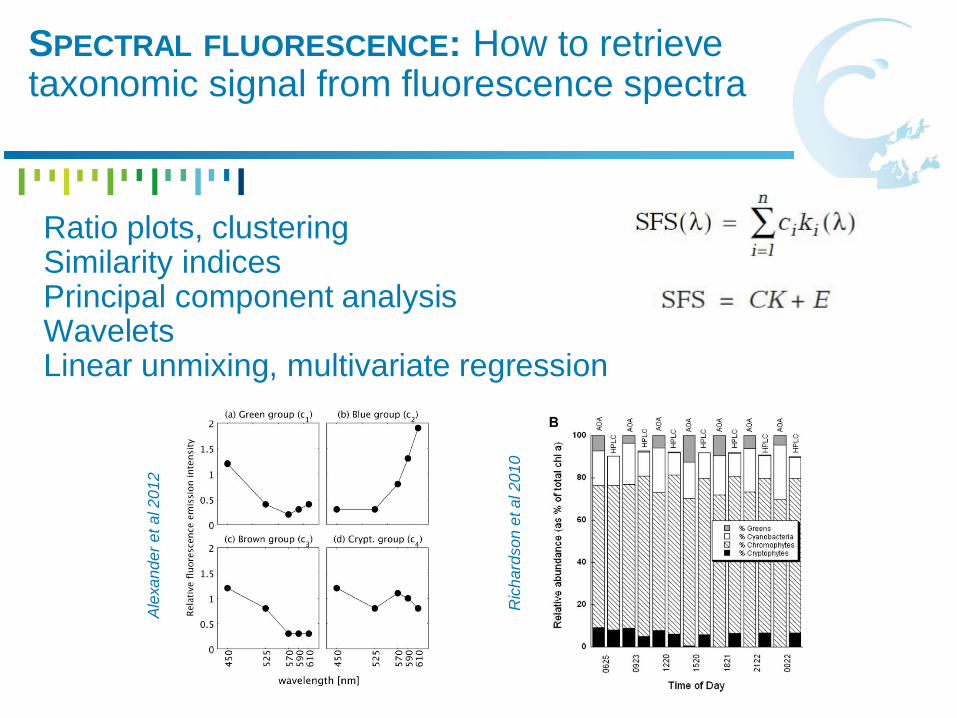
SPECTRAL FLUORESCENCE: How to retrievetaxonomic signal from fluorescence spectra
Ratio plots, clusteringSimilarity indicesPrincipal component analysisWaveletsLinear unmixing, multivariate regression
22 23 24
E longitude
Riga
LATVIA
Saaremaa
10 Nm
ESTONIAD
Mac
Inty
reet
al20
10
Sepp
älä
&Ba
lode
1998
SPECTRAL FLUORESCENCE: How to retrievetaxonomic signal from fluorescence spectra
Ratio plots, clusteringSimilarity indicesPrincipal component analysisWaveletsLinear unmixing, multivariate regression
Alex
ande
reta
l201
2
Ric
hard
son
etal
2010

SPECTRAL FLUORESCENCE: How to retrievetaxonomic signal from fluorescence spectra
Ratio plots, clusteringSimilarity indicesPrincipal component analysisWaveletsLinear unmixing, multivariate regression
Sepp
älä
2009
CHL a [µg L-1], observed
0 5 10 15 20 25
CH
La
[µg
L-1
]pr
edic
ted
0
5
10
15
20
25R2 = 0.98
CHL a in <2µm [µg L-1], observed
0 1 2 3
CH
La
in<2
µm[µ
gL
-1] ,
pred
icte
d
0
1
2
3R2 = 0.86
RMSECV = 0.23RMSECV = 0.69
Observed biomass [µg / L]10 100 1000
Pred
icte
dbi
omas
s[µ
g/L
]
10
100
1000R2 = 0.69
RMSECVFil. Cyano = 164Diatoms = 279Dinoflagellates = 459

SPECTRAL FLUORESCENCE: Identifying spatialstructures to locate patches and facilitate sampling
Alex
ande
reta
l201
2
PCA identifies 4spectral clusters,or species groups
Clusters arehorizontallyseparated (colorcoding)
…as well asvertically (colorcoding)
Study at Lake Victoria;
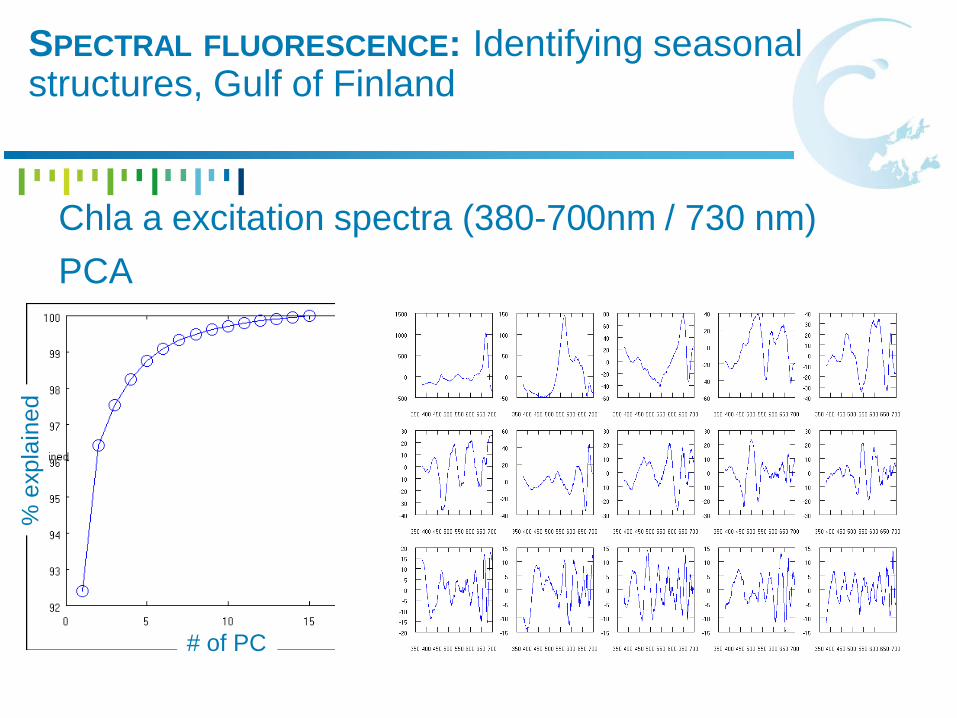
SPECTRAL FLUORESCENCE: Identifying seasonalstructures, Gulf of Finland
Chla a excitation spectra (380-700nm / 730 nm)PCA
%ex
plai
ned
# of PC

SPECTRAL FLUORESCENCE: Identifying seasonalstructures, Gulf of Finland
Chla a excitation spectra (380-700nm / 730 nm)PCA
3. PC
Season
Dep
th2. PC
1. PC
4. PC
5. PC
Wavelength
%ex
plai
ned
# of PC

AN OVERVIEW OF SPECTRAL IN VIVO FLUORESCENCEMETHODS FOR PHYTOPLANKTON TAXONOMY
What next?
Calibration / validation (HPLC, FlowCAM, FCM, EO)Collection of validation data (intelligence)Instrumentation (preferably spectral)New algorithms (multivariate)Use of data