n n first wave pick - the loadstar · first wave pick . the business of warehousing in . north...
TRANSCRIPT

Phone: +1-800-525-3915 Website: www.3PLogistics.com Email: [email protected]
TRENDS IN 3PL / CUSTOMER RELATIONSHIPS
November 2016February 2018
Market Size, Major 3PLs, Benchmarking Costs, Prices and Practices
FIRST WAVE PICK The Business of Warehousing in North America - 2018
All Rights Reserved.
No part of this publication may be reproduced, stored in a retrieval system or transmitted in any form by any means, electronic, mechanical, photocopied, recorded or otherwise, without the prior permission of the publisher, Armstrong & Associates, Inc.
The facts of this report are believed to be correct at the time of publication but cannot be guaranteed. Please note that the findings, conclusions and recommendations that Armstrong & Associates delivers will be based on information gathered in good faith from both primary and secondary sources, whose accuracy we are not always in a position to guarantee. As such, Armstrong & Associates can accept no liability whatsoever for actions taken based on any information that may subsequently prove to be incorrect.
©2018 Armstrong & Associates
ABOUT ARMSTRONG & ASSOCIATES, INC.Armstrong & Associates, Inc. (A&A) was established in 1980 to meet the needs of a newly deregulated domestic transportation market. Since then, through its leading third-party logistics (3PL) market research and history of helping companies outsource logistics functions, A&A has become an internationally recognized key information resource for 3PL market research and consulting.
A&A’s mission is to have leading proprietary supply chain knowledge and market research not available anywhere else. As proof of its continued work in supporting its mission, A&A’s 3PL market estimates are the most often cited in securities filings by publicly traded 3PLs, media articles and trade publications. In addition, A&A’s email newsletter currently has over 46,000 subscribers globally.
A&A’s research complements its consulting activities by providing a continually updated detailed database for analysis. Based upon its unsurpassed knowledge of the 3PL market and the operations of leading 3PLs, A&A has provided strategic planning consulting services to over 30 3PLs, supported 17 closed investment transactions, and provided advice to numerous companies looking to benchmark existing 3PL operations or outsource logistics functions.

©2018 Armstrong & Associates
ContentsNorth American Warehousing Overview 1Answers to Big Questions 9Transactional Pricing Guidelines 12Modeling Storage Rates for Transactional Pricing 13Calculating Market Storage Rates per Pallet 13Metrics 16Contract Warehousing – Size, Commodities, Operating Margins 17Owned vs. Leased 21WMS, Handling, Etc. 21Size and Handling 22VAWD 3PL Customers 24Public Warehousing 26Current Warehouse Rental and Vacancy Rates 29E-Commerce Fulfillment/Pick and Pack Value-AddedWarehousing and Distribution 32Appendix A 40

1
OvervIew
©2018 Armstrong & Associates
North American Warehousing OverviewSince 2004, Armstrong and Associates, Inc. (A&A) has published reports on warehousing in North America. Our concentration has been on commercial warehousing particularly contract warehousing. Contract warehousing has grown rapidly over the last 40 years.
Figure 1 provides basics concerning the U.S. warehousing market. A&A’s estimate of the U.S. warehousing Market is $148.7 billion through 2017.
The gray line reflects modern warehousing space. Len Sahling developed this estimate while at Prologis using the 31 largest U.S. markets. we have carried it forward.
The light blue line is value‐Added warehousing & Distribution (vAwD). we estimate vAwD revenue each year as part of our financial report on third‐party logistics.1 vAwD reflects the contracted warehousing market in North America. This estimate is based on the financial results of third‐party logistics providers (3PLs) comprising over half of the total vAwD market. Many of the companies are private and report the revenues to us annually. Others are publicly held, have public annual reports and are generally helpful with clarifications.
Public warehousing, which was the dominant form of warehousing in the U.S., now accounts for only 40% of the commercial warehousing market.
Figure 1. U.S. Warehousing Market – 1996-2020E
0
1
2
3
4
5
6
7
8
9
10
$0.0
$20.0
$40.0
$60.0
$80.0
$100.0
$120.0
$140.0
$160.0
$180.0
(BillionSq.Ft.)(US$
Bill
ions
)
U.S. Warehousing - A&A (US$ Billions) Commercial Warehouse Revenue (US$ Billions)
Public Warehouse Revenue (US$ Billions) VAWD Gross Revenue (US$ Billions)
Inventory Space (Billion Sq. Ft.)
1 Third-Party Logistics Market results and Trends for 2017 – June 2017

2
OvervIew
©2018 Armstrong & Associates
Table 1. U.S. Warehousing Market – Recent Values (US$ Billions)
2010 2011 2012 2013 2014 2015 2016 2017E 2018E 2019E 2020E
VAWD Gross Revenue 31.4 34.0 36.0 36.5 37.4 38.4 39.1 40.5 41.9 43.4 44.9
Commercial Warehousing Revenue 52.3 56.7 60.0 61.0 63.0 65.0 66.2 68.6 71.0 73.4 76.0
U.S. Warehousing – A&A 112.0 120.0 127.2 132.0 137.5 141.0 143.7 148.7 153.9 159.3 164.9
Inventory Space (Sq. Ft. Billions) 6.9 7.0 7.1 7.3 7.7 8.2 8.4 8.6 8.9 9.3 9.6
The figures in Table 1 are A&A estimates. The estimates reflect stronger growth in U.S. warehousing than in Commercial warehousing. This growth can be attributed in part to e-commerce expansions particularly by Amazon. Amazon is in the private warehousing sector as is much of e-commerce B2C (business-to-consumer) expansion. Amazon had $17.6 billion in fulfillment costs in 2016 and 159.9 million square feet of space, including fulfillment, data centers, and other space.
Our Top 50 vAwD 3PLs have 3,827 facilities between them totaling 829 million square feet. we estimate that there are 9,000 U.S. commercial warehousing facilities of size with 1.9 billion square feet of space. The Top 50 have an average of 77 warehouses with an average size of 216,593 square feet. The vAwD market segment grew 1.9% in 2016.
DHL’s warehouses follow uniform practices and are true vAwD facilities. The number of facilities for ryder are inflated by many smaller multiclient operations associated with integrated transportation management operations.
UPS SCS reports 144 warehouses in North America. Of those, U.S. distribution is 32% of the total, U.S. post sales is 45%, U.S. mail innovations is 12%, and Canada – distribution & post sales is 12%. UPS has almost 17.3 million square feet of space in North America which makes it 14th on our list. The average U.S. distribution warehouse is 267,904 square feet, U.S. post sales warehouse is 18,507 square feet, U.S. mail innovations is 99,717 square feet, and Canada – distribution & post sales is 147,125 square feet. Healthcare accounts make up 27% of UPS SCS’s total North America warehouse space. The average North America utilization is 90%.
For our Top 50 sample, the smallest company is Netherlands-based global supply chain manager Damco. Its 18 warehouses, covering 3.9 million square feet, are all located in the U.S.

3
OvervIew
©2018 Armstrong & Associates
Table 2. A&A’s Top 50 North American VAWD 3PLs by Warehousing Space within North AmericaW
MS
Rank
Third-Party Logistics Providers (3PLs)
Number of Warehouses
Total Sq. Ft. (Millions)
Avg. Sq. Ft. (000's)
Whse. Mgmt.
Frozen
Refrigerated
Temp. Control
Rail Siding
Call Centers
Cross Docking
Customization
Inventory Control/ Vendor Mgmt.
KanBan
Kitting
Labeling
Lot Control
Merge-in-Transit
Mfg. Support
Pick/Pack
Pool Dist.
Repair/Refurb.
Returnable Container Mgmt.
Reverse Logistics
Store Support/ Delivery
Sequencing/ Metering
Specialty Packaging
Sub Assembly
Main Brand(s) Used
1D
HL Supply C
hain North A
merica
673119.0
176.8●
●●
●●
●●
●●
●●
●●
●●
●●
●●
●●
●●
●RedPrairie, M
anhattan, HK System
s, Insight, Proprietary
2XPO
Logistics392
81.6208.2
●●
●●
●●
●●
●●
●●
●●
●●
●●
●●
●Proprietary, Infor Provia, SIM
S, Reflex 400, Infolog, RedPrairie, C
adre-Accuplus, SA
P, Nulogy
3R
yder Supply Chain Solutions
24643.7
177.6●
●●
●●
●●
●●
●●
●●
●●
●●
●●
●●
●Servigistics V3, M
anhattan, RedPrairie, A
ccellos, Flux
4G
EOD
IS North A
merica
15038.2
254.7●
●●
●●
●●
●●
●●
●●
●●
●●
●●
●●
●●
●Infor/EXC
EED 4000, M
anhattan, JD
A/RedPrairie, Proprietary
5A
mericold
14538.0
262.1●
●●
●●
●●
●●
●●
●●
●●
●●
●●
●●
JDA
6FedEx Supply C
hain129
34.5267.4
●●
●●
●●
●●
●●
●●
●●
●●
●●
●●
●●
●M
anhattan, JDA
, Proprietary
7N
FI100
33.5335.0
●●
●●
●●
●●
●●
●●
●●
●●
●●
●●
●●
Manhattan, RedPrairie, Infor W
MS
4000, FourSite
8K
enco Logistic Services90
28.0311.1
●●
●●
●●
●●
●●
●●
●●
●●
●●
●●
●●
●Proprietary, RedPrairie, SA
P WM
, M
anhattan
9Lineage Logistics
11426.0
228.1●
●●
●●
●●
●●
●●
●●
●●
●●
●H
ighJump, Infor, Proprietary
10D
B Schenker N
orth Am
erica91
23.7260.4
●●
●●
●●
●●
●●
●●
●●
●●
●●
●●
●●
Infor, TECSYS, SA
P, RedPrairie
11D
SC Logistics
6323.0
365.1●
●●
●●
●●
●●
●●
●●
●●
●●
●●
Proprietary, RedPrairie
12C
EVA
Logistics North A
merica
14719.7
134.0●
●●
●●
●●
●●
●●
●●
●●
●●
●●
●●
●RedPrairie, M
anhattan Associates
13Saddle C
reek Logistics Services75
17.5233.3
●●
●●
●●
●●
●●
●●
●●
●●
●●
●●
Infor WM
S, RedPrairie WM
S, Softeon
14U
PS Supply Chain Solutions
14417.3
120.1●
●●
●●
●●
●●
●●
●●
●●
●●
●●
●●
●●
Infor/EXE, Manhattan, LM
S, Proprietary
15Penske Logistics
6516.8
258.5●
●●
●●
●●
●●
●●
●●
●●
●●
●●
●●
●●
JDA
(i2), Flux, RT Systems, M
ARC
, Proprietary
16D
SV N
orth Am
erica50
16.0320.0
●●
●●
●●
●●
●●
●●
●●
●●
●●
●●
●●
●RedPrairie, Infor/EXE, Logim
ax
17K
uehne + N
agel North A
merica
8315.6
188.0●
●●
●●
●●
●●
●●
●●
●●
●●
●●
●●
●●
CIEL W
arehouse, Provia FourSite
18W
arehouse Services30
14.0466.7
●●
●●
●●
●●
●●
●●
●●
●●
●●
●●
●●
●●
Oracle
18W
SI52
14.0269.2
●●
●●
●●
●●
●●
●●
●●
●●
●●
●●
Oracle--EnterpriseO
ne
19A
PL Logistics North A
merica
3713.7
370.3●
●●
●●
●●
●●
●●
●●
●●
●●
●●
●M
anhattan WM
i, LogFire, OW
MS,
Proprietary-WM
Sp & W
MSz, eLM
S, C
MS, Irista
20Ingram
Micro C
omm
erce &
Fulfillment
15412.4
80.5●
●●
●●
●●
●●
●●
●●
●●
●●
●●
Proprietary
21R
adial24
11.8491.7
●●
●●
●●
●●
●●
●●
●●
●●
●●
Manhattan A
ssociates
22Expeditors
11711.5
98.3●
●●
●●
●●
●●
●●
●●
●●
●●
●●
●●
●Proprietary-Expeditors D
istribution M
anagement System
23Preferred Freezer Services
3411.0
323.5●
●●
●●
●●
Proprietary
24N
eovia Logistics Services49
10.2208.2
●●
●●
●●
●●
●●
●●
●●
●●
●●
●●
●SA
P, JDA
RedPrairie, Proprietary
Third-Party Logistics Providers (3PLs)W
arehouse/D
C C
apabilitiesV
alue-Added Services C
apabilities

9
ANSwerS TO BIg QUeSTIONS
©2018 Armstrong & Associates
Answers to Big Questionswe asked survey respondents for their responses to changes and trends they have seen recently in value-added warehousing. The answers below reflect the consensus.
Table 6. Comments by VAWD 3PL Survey Respondents
1
In some instances, shippers are leveraging 3PLs to expand and bring their networks closer to major populations, procuring additional warehouses. By establishing these nearby distribution centers, shippers are able to reduce shipping times as the demand for overnight and same day shipping increases. The increased demand for warehouses has also impacted the real estate market, causing tightened capacity and heightened need for real estate capabilities from logistics providers.
Decreased Capacity/Need for Innovative Solutions: This trend isn’t a surprise, however, with decreasing capacity and highly competitive labor markets in the U.S. we have seen an increased need to drive efficiency within the four walls of the warehouse. Whether through Labor Management Systems or new mechanization/technology, innovative solutions for warehouses and the “warehouse of the future” will be crucial to maintain a competitive edge in a very competitive landscape.
Sharing Economies/Infrastructure with Visibility: The idea of idle capacity used to be a way of life for many 3PLs and operators. Today, many companies are looking at how can they leverage that space effectively. Some providers like Flexe have been able to build models, but we are seeing more and more customers wanting to leverage multiple locations, providers or drop-ship locations, but needing visibility for all, which has caused us to enable our technology to have that visibility, but this will continue to be the new reality for many companies.
3
Shippers report on current studies, surveys that reliability and/or service is paramount, however, we see that price is usually the main driver of logistics and supply chain decisions. This "race to the bottom" is the main reason why there is a disconnect between what shippers expect of the 3PLs and the value that 3PLs believe they deliver. Ecom/omni-channel capability is a hot topic as the shipper and retail communities figure out how best to swiftly and economically provide for their customers/consumers.
The first trend involves multiple topics in and around food safety. From security to sanitary storage and transport, food safety is critical not only to our customers’ brand reputation, but also our own. Hitting even closer to home, the impending implementation of the Food Safety Modernization Act holds executives personally liable (with fines and jail time!) for breaches. Like a lot of things in life, if we do everything in food safety right, no one notices – but if we fall short, everyone will.
The final trend surrounds transportation. Some of these ideas are new, while others are seeing fresh wind behind them. Delivery requirements by shippers and their customer are changing, moving to tighter schedules to optimize their capital resources and inventory management. Complying with state and federal regulations on everything from hours of service to requirements for data recorders impacts not only the driver shortage but also many of the operation of systems in the distribution center. And, of course, there is sustainability, a topic that continues to ebb and flow over the years, often reflecting our nation’s economic health.
Companies wanting full logistic warehouse services and closing their warehouses.
5 New warehouse opening creating challenges in labor force.
Warehouse availability is tightening up further, driving higher levels of new construction.
Technology enablers are reshaping the industry, but the path to profitability needs critical mass.
Product lifecycles are shortening. Near-shoring supply chains to be more nimble.
What important changes have you seen in the last 2-3 years?
2
4
6

12
PrICINg gUIDeLINeS
©2018 Armstrong & Associates
hope that the overall pricing is high enough to make up for absorbing startup costs; however, when combined with the potential for operational scope creep, this is a risky approach.
Transactional Pricing GuidelinesPricing for contract warehousing services has become more tailored by location. The process is driven by customer demands and unique circumstances. Over time pricing schemes have become more varied, but according to our recent surveys the guidelines below are reasonable for basic warehousing and value-added services.
Table 7. Handling Charges
Table 8. Storage per Month
13
STOrAge rATeS
©2018 Armstrong & Associates
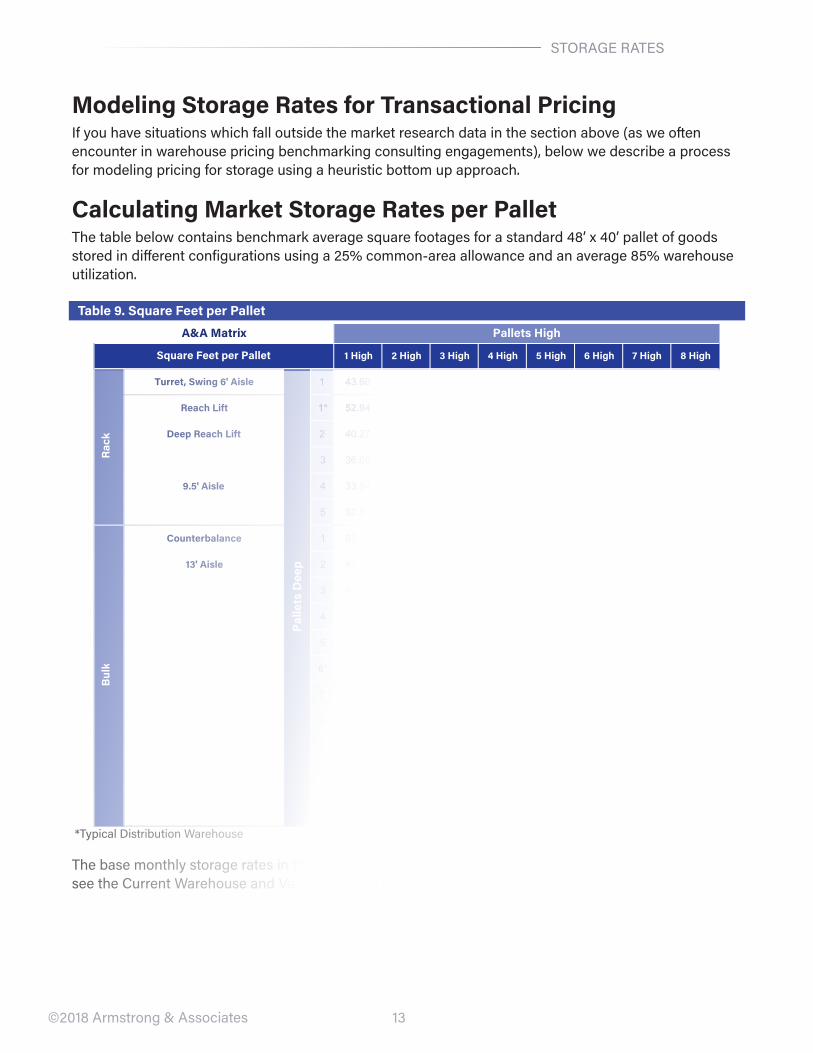
Modeling Storage Rates for Transactional PricingIf you have situations which fall outside the market research data in the section above (as we often encounter in warehouse pricing benchmarking consulting engagements), below we describe a process for modeling pricing for storage using a heuristic bottom up approach.
Calculating Market Storage Rates per PalletThe table below contains benchmark average square footages for a standard 48’ x 40’ pallet of goods stored in different configurations using a 25% common-area allowance and an average 85% warehouse utilization.
Table 9. Square Feet per Pallet
1 High 2 High 3 High 4 High 5 High 6 High 7 High 8 High
Turret, Swing 6' Aisle 1 43.60 21.80 14.53 10.90 8.72 7.27 6.23 5.45
Reach Lift 1* 52.94 26.47 17.65 13.23 10.59 8.82 7.56 6.62
Deep Reach Lift 2 40.27 20.14 13.42 10.07 8.05 6.71 5.75 5.03
3 36.05 18.02 12.02 9.01 7.21 6.01 5.15 4.51
9.5' Aisle 4 33.94 16.97 11.31 8.48 6.79 5.66 4.85 4.24
5 32.67 16.34 10.89 8.17 6.53 5.45 4.67 4.08
Counterbalance 1 67.88 33.94 22.63 16.97 13.58 11.32 9.70 8.49
13' Aisle 2 47.66 23.83 15.89 11.92 9.54 7.95 6.81 5.96
3 40.92 20.46 13.64 10.24 8.19 6.83 5.85 5.12
4 37.55 18.78 12.52 9.39 7.52 6.26 5.37 4.70
5 35.53 17.77 11.85 8.89 7.11 5.93 5.08 4.45
6* 34.18 17.09 11.40 8.55 6.84 5.70 4.89 4.28
7 33.22 16.61 11.08 8.31 6.65 5.54 4.75 4.16
8 32.50 16.25 10.84 8.13 6.51 5.42 4.65 4.07
9 31.93 15.97 10.65 7.99 6.40 5.33 4.57 4.00
10 31.48 15.75 10.50 7.88 6.31 5.26 4.51 3.95
11 31.12 15.56 10.38 7.79 6.23 5.20 4.46 3.90
12 30.81 15.41 10.28 7.71 6.17 5.15 4.41 3.86
A&A Matrix Pallets High
Square Feet per Pallet
Rac
k
Palle
ts D
eep
Bul
k
*Typical Distribution warehouse
The base monthly storage rates in the table below are triple net, or NNN, lease rates. (For a specific city, see the Current warehouse and vacancy rental rates section of this report.)

17
CONTrACT wAreHOUSINg
©2018 Armstrong & Associates
Contract Warehousing – Size, Commodities, Operating MarginsFrom the survey, there were five warehouses under 5,000 square feet and four between 5,001 and 6,000 square feet. we left these smaller warehouses in the data. The size distribution for all 536 warehouses is given in the figure below.
Figure 4. Contract Warehouses by Size
Table 17. Contract Warehouses by Size
The trend in new contract warehouses is for them to be larger in size. However, in our sample, 59% are smaller than 200,000 square feet. Overall, the mean is 252,110 and the median is 150,000 square feet. eleven percent are “big boxes” at 600,000 square feet or greater.
Thirteen vertical industries/commodity classifications were used in analyzing the contract warehouses in our sample. retail/Consumer goods was the largest vertical accounting for 21% of all contract warehousing operations. Food/Beverage was second at 15%. High-tech/Computers was next at 14%. refrigerated and Frozen warehouses comprised 9% of the total and of those, 10 handled frozen products. The average cooler cubic footage was 1.8 million. For frozen warehouse space, the average was 2.3 million cubic feet.
19
CONTrACT wAreHOUSINg
©2018 Armstrong & Associates
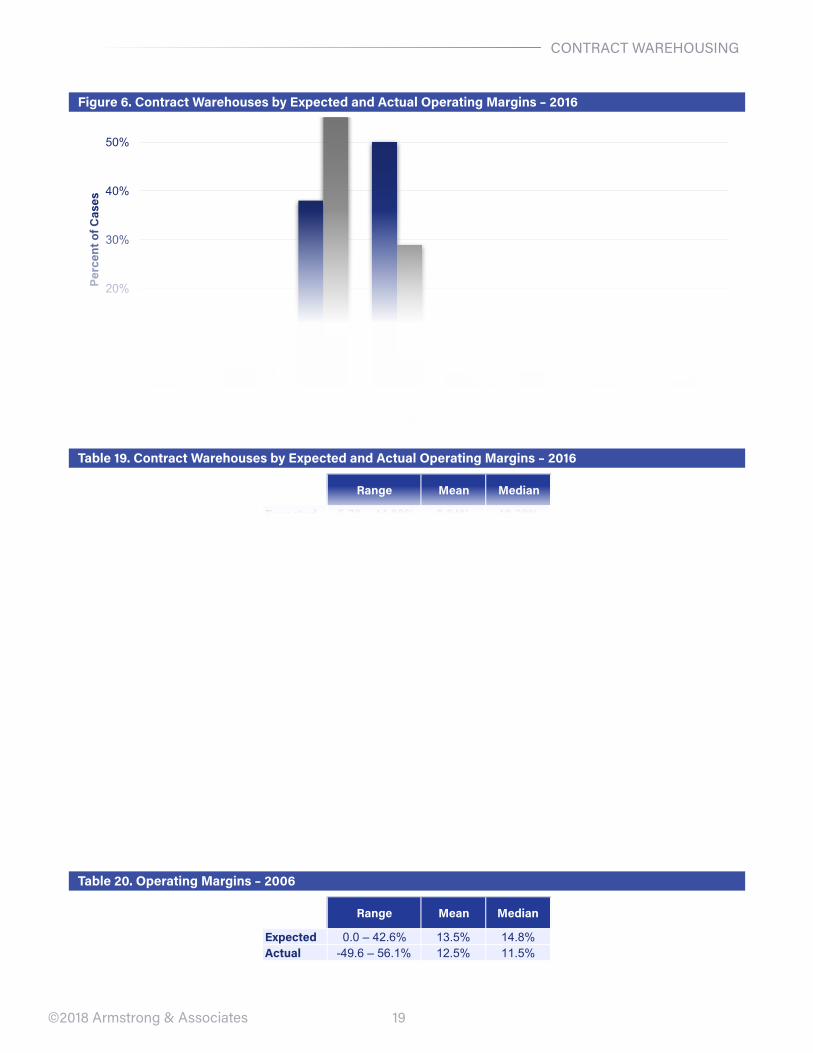
Figure 6. Contract Warehouses by Expected and Actual Operating Margins – 2016
0%
10%
20%
30%
40%
50%
60%
<0 0 – 4.9 5 – 9.9 10 – 14.9 15 – 19.9 20 – 24.9 25 – 29.9 ≥30
Perc
ent o
f Cas
es
Operating Margin Percent
Expected ActualTable 19. Contract Warehouses by Expected and Actual Operating Margins – 2016
Range Mean Median
Expected -5.70 – 44.00% 9.84% 10.00%Actual -13.40 – 44.00% 9.71% 9.00%
expected operating margins averaged 9.84% for 2016. eBITDAs (earnings before interest, tax, depreciation, and amortization) were estimated at 12.17%. For 2016, actual operating margins were 9.71%, and eBITDAs were estimated at 10.66%.
In 2006, we reported on expected and actual operating margins. Here is our analysis from that study.
Operating margins usually include components for administrative costs and profit. 3PLs expect, 33% of the time, their operating margins will be 15-19.9%. 3PLs expect, 10% of the time, their margins will be 20% or greater. Surprisingly, 3PLs sign deals, 30% of the time, where the operating margins will be less than 10%. The high expected operating margins cluster by company as do all the related financial measures. Similarly, low expected operating margins cluster by company. The data indicate that companies with higher operating margin expectations have higher operating margin results. Put another way, company cultures and their expectations significantly affect margins. Company choices with regard to verticals served are highly correlated with these results. In our analysis, we found the following summary statistics.
Table 20. Operating Margins – 2006
Range Mean Median
Expected 0.0 – 42.6% 13.5% 14.8%Actual -49.6 – 56.1% 12.5% 11.5%

24
vAwD 3PL CUSTOMerS
©2018 Armstrong & Associates
Figure 10. Contract Warehouses by Value-Added Services Provided
Table 25. Contract Warehouses by Value-Added Services Provided
VAWD 3PL CustomersOur sample includes 396 customers of vAwD 3PLs. The ratio of warehouses to customers is 1.47. Customers have one to twenty-three locations. Only 14% of customers have arrangements involving multiple locations. The average (mean) customer utilizes 280,987 square feet. The median is 94,240. The largest allocation is for 4.5 million square feet.
revenues per customer range from $500 to $52 million per year. The average (mean) is $3.9 million and the median is $1.6 million.

28
PUBLIC wAreHOUSINg
©2018 Armstrong & Associates
Table 34. Public Warehouses – Storage per Month
Table 35. Public Warehouses – Other Services

29
reNTAL AND vACANCy rATeS
©2018 Armstrong & Associates
Current Warehouse Rental and Vacancy RatesThe most expensive warehousing markets with the lowest vacancy rates cluster along coastal areas. Los Angeles, San Francisco/Oakland, Long Island, South Florida from Miami to west Palm Beach, Houston and Northern New Jersey all have average rates exceeding $8 per square foot per year. Average U.S. vacancy rates are declining, averaging 5.2%, which is the lowest in over a decade. The highest vacancy markets with inventory over 100 million square feet are Birmingham, AL at 10.8% vacancy and average revenue per square foot of $3.71, and Phoenix at 8.3% vacancy and $5.02 per square foot. In addition, net absorption (filling empty space) was high. The top 5 (in million square feet) were Los Angeles at 17.3, Atlanta at 16.7, Dallas/Ft. worth at 15.9, Inland empire at 14.1 and eastern PA-Lehigh valley at 12.9 million.
Big box leases driven by e-commerce and 3PLs in major markets are the driving force. warehouse constructions for the U.S. at the end of 4Q17 was 230+ million square feet. Inland empire, Dallas/Ft. worth, eastern PA-Lehigh valley, Atlanta and Chicago are the top 5 for new construction. The following table provides a comparison of data from three major sources.
Table 36. Top 5 Markets by Vacancy Rate

30
reNTAL AND vACANCy rATeS
©2018 Armstrong & Associates
Table 37. Vacancy Rate and Price Per Square Foot by Market

32
e-COMMerCe FULFILLMeNT
©2018 Armstrong & Associates
E-Commerce Fulfillment/Pick and Pack Value-Added Warehousing and DistributionThe percent of North American Top 50 warehousing 3PLs that offer pick and pack services is 98% which is also the percent in A&A’s who’s who in Logistics Online guide to 3PLs. In our last report, 96.7% of the top North American warehousing 3PLs offered pick and pack services.
Figure 18. Percent of Top 50 North American VAWD 3PLs Offering Service
North America e-commerce growth from 2016 to 2020e is more than double for e-commerce logistics costs and 3PL e-commerce revenue.
Table 38. E-Commerce Logistics Costs, 3PL Revenue, and Growth (US$ Billions)*
*Includes countries with $500 million or more in 2020e e-commerce logistics costs; included countries represent 87% of global gDP and ~98% of 2016 global e-commerce sales.