myths & realities of diversity in nh. thank you to our founding members!
TRANSCRIPT

Myths & Realities of Diversity In NH

Thank you to our Founding Members!

Thank you to our Corporate Members!
Thank You!
• Elaine Krause; Krause + Company Creative• Todd Mayo• Cleveland Waters and Bass• Dan Troy• Carole Copeland-Thomas

Evolution of the DWC
DWCMission
Promote diversity in the workplace through education, training, enhanced
networking opportunities, and to identify and connect resources to its
members and the public
Our Panel
• Steve Norton– Executive Director; NH Center for Public Policy
Studies• Cathy Chesley
– Director of NH Catholic Charities; Office of Immigration
• Andrew Smith– New Hampshire DMC Coordinator

Board of DirectorsWilliam H. Dunlap, Chair
David Alukonis
Eric Herr
Dianne Mercier
James Putnam
Todd I. Selig
Michael Whitney
Daniel Wolf
Martin L. Gross, Chair Emeritus
Directors Emeritus Sheila T. Francoeur
Stuart V. Smith, Jr.
Donna Sytek
Brian F. Walsh
Kimon S. Zachos“…to raise new ideas and improve policy debates through quality information and analysis on issues shaping New Hampshire’s future.”
New Hampshire Demographics
The Economic Value of Diversity
Demonstrating The Economic Value of Diversity: Arizona – SB 1062
• Greg Aiello (NFL) – “Our policies emphasize tolerance and inclusiveness, and prohibit discrimination based on age, gender, race, religion, sexual orientation, or any other improper standard. We are following the issue in Arizona and will continue to do so should the bill be signed into law, but will decline further comment at this time."
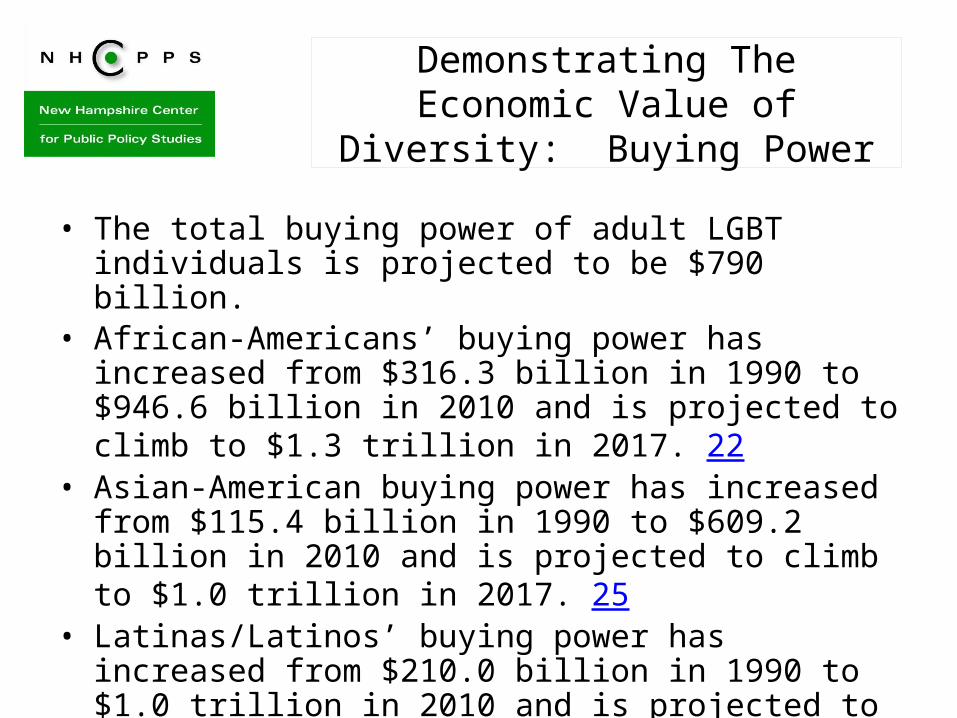
Demonstrating The Economic Value of Diversity: Buying Power
• The total buying power of adult LGBT individuals is projected to be $790 billion.
• African-Americans’ buying power has increased from $316.3 billion in 1990 to $946.6 billion in 2010 and is projected to climb to $1.3 trillion in 2017. 22
• Asian-American buying power has increased from $115.4 billion in 1990 to $609.2 billion in 2010 and is projected to climb to $1.0 trillion in 2017. 25
• Latinas/Latinos’ buying power has increased from $210.0 billion in 1990 to $1.0 trillion in 2010 and is projected to climb to $1.7 trillion in 2017. 28

Immigration reduces bottlenecks caused by labor shortages, both in the
high- and low-skill areas
http://www.manhattan-institute.org/html/ib_18.htm#.Ux9Kez-zHow

Ray Burton’s Definition of Diverse
Party Registration in New HampshireSource: NH Secretary of State
0.1
0.15
0.2
0.25
0.3
0.35
0.4
0.45
0.5
1980
1982
1984
1986
1988
1990
1992
1994
1996
1998
2000
2002
2004
2006
2008
2010
2012
Republican Democrat Undeclared
Republican
Democrat
Undeclared
Foreign Born
• In 2005, New Hampshire had approximately 72,000 foreign-born persons according to Census figures. This represents about 6 percent of the state’s total population.
• After growing at an average rate of 2.8 percent per year in the 1990s, New Hampshire’s foreign-born population growth has doubled between 2000 and 2005, to 6 percent per year.
• New Hampshire’s foreign-born population has relatively high educational achievement and high income.

NH’s Growing Diversity7.7% Minority in 2010

NH Minority Population Continues to Increase
Change in New Hampshire Population 2010 to 2012
-1,201
660
-3,434
3,087
1,783
2,980
-4,000
-3,000
-2,000
-1,000
0
1,000
2,000
3,000
4,000
Hillsborough Rockingham Balance of NH
White Alone, Not Hispanic
Minority (Non White, andHispanic)

NH’s Growing Diversity
“Developing programs and policies to address such economic disparities and to meet the needs of an increasingly diverse population is particularly challenging when these pockets of economic and racial diversity exist in a state that is generally affluent, well-educated, and non-Hispanic white.”[1]
[1] “New Hampshire Demographic Trends in the Twenty-First
Century”, Kenneth M. Johnson, The Carsey Institute, University of New Hampshire, May 2012.
Available at www.carseyinstitute.unh.edu

State Minority Population Concentrated in Cities
• There are15,035 Black or African- American residents in New Hampshire– 4,476 reside in Manchester – 2,306 reside in Nashua
• There are 36,704 Hispanic or Latino residents – 8,883 in Manchester – 8,510 in Nashua
• (Source: 2010 Census)

An Imperative? Increasing Diversity

Ten Year Percent Change in New Hampshire Population by Decade End
8.5%
13.8%
21.5%
24.8%
20.5%
11.4%
6.5%
3.3% 3.8%
1.1%
1950 1960 1970 1980 1990 2000 2010 2020 2030 2040
ActualForecast
Can NH attract Millennials? They are the most diverse generation in history.
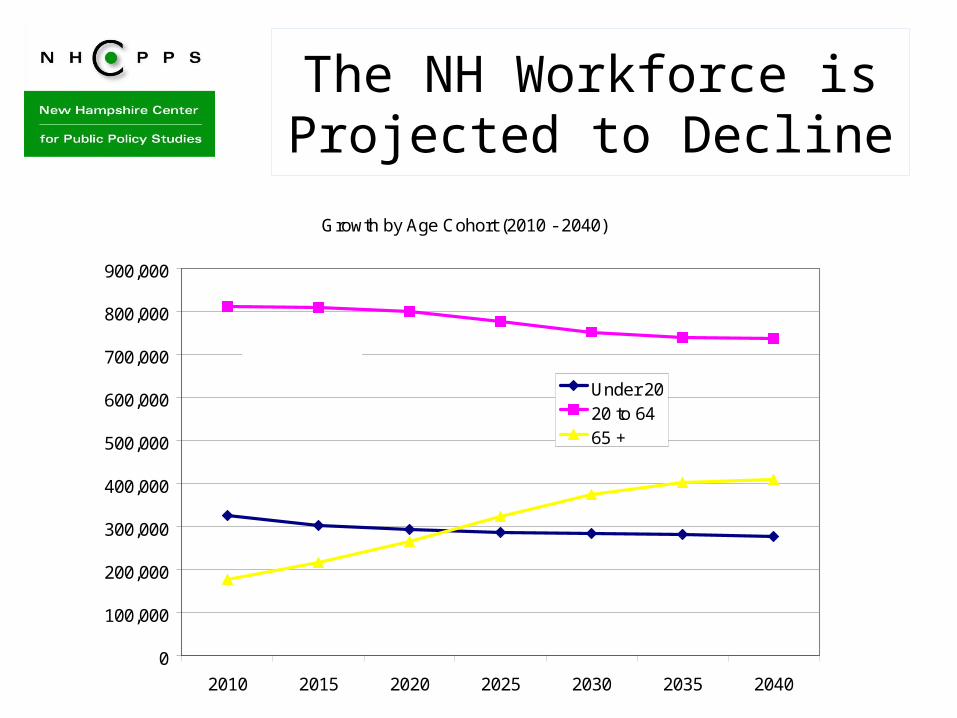
The NH Workforce is Projected to Decline
Growth by Age Cohort (2010 - 2040)
0
100,000
200,000
300,000
400,000
500,000
600,000
700,000
800,000
900,000
2010 2015 2020 2025 2030 2035 2040
Under 2020 to 6465 +
NH Workforce

But much of the growth in the labor force nationally is Hispanic
Census Bureau Projections by Race and Ethnicity
0
50,000
100,000
150,000
200,000
250,000
300,000
350,000
400,000
450,000
2015 2020 2025 2030 2035 2040 2045 2050 2055 2060
Hispanic, Black.White
New Hampshire Center for Public Policy Studies
Want to learn more?• Online: nhpolicy.org• Facebook: facebook.com/nhpolicy• Twitter: @nhpublicpolicy• Our blog: policyblognh.org• (603) 226-2500
“…to raise new ideas and improve policy debates through quality information and analysis on issues shaping New Hampshire’s future.”
Board of DirectorsWilliam H. Dunlap, Chair
David Alukonis
Eric Herr
Dianne Mercier
James Putnam
Todd I. Selig
Michael Whitney
Daniel Wolf
Martin L. Gross, Chair Emeritus
Directors Emeritus Sheila T. Francoeur
Stuart V. Smith, Jr.
Donna Sytek
Brian F. Walsh
Kimon S. Zachos
Immigrant Strength, Resiliency & Resourcefulness
Cathy ChesleyMarch 27, 2014Manchester, NH
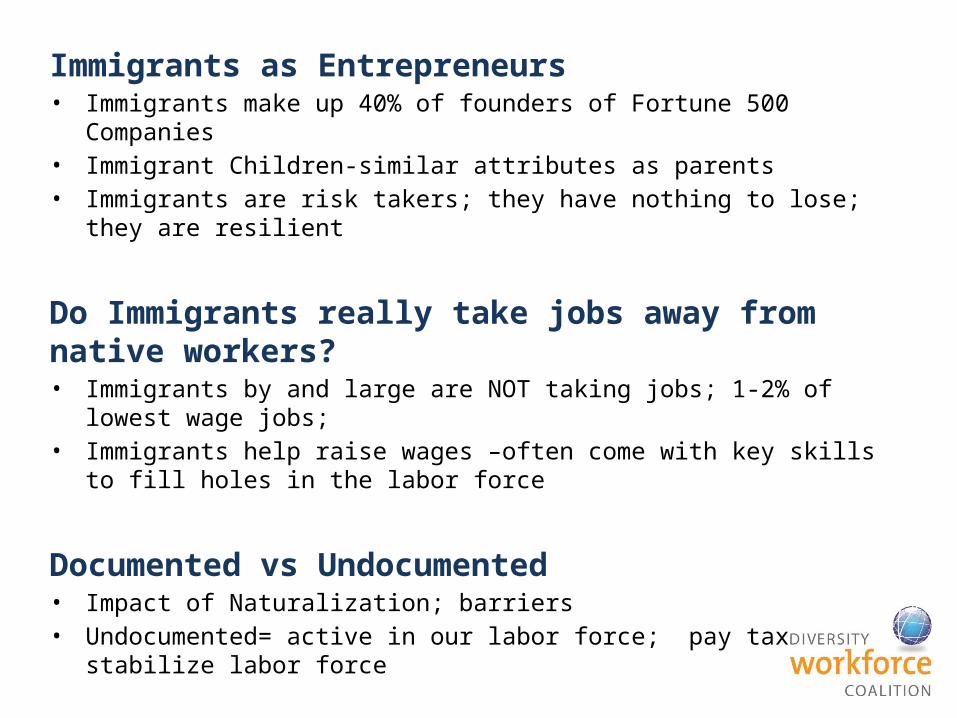
Immigrants as Entrepreneurs• Immigrants make up 40% of founders of Fortune 500 Companies • Immigrant Children-similar attributes as parents• Immigrants are risk takers; they have nothing to lose; they are resilient
Do Immigrants really take jobs away from native workers? • Immigrants by and large are NOT taking jobs; 1-2% of lowest wage jobs; • Immigrants help raise wages –often come with key skills to fill holes in the labor
force
Documented vs Undocumented• Impact of Naturalization; barriers • Undocumented= active in our labor force; pay taxes; stabilize labor force
Comprehensive Immigration Reform

The Role of Leadership in NH Diversity Education
Andrew SmithMarch 27, 2014Manchester, NH
Table of Contents
• What is Diversity?• What is Inclusion?• Why do they matter in NH now? • The Role of Leadership in Diversity• The Challenges of Diversity facing us • The Benefits of an Inclusive State Culture
What is Diversity?
Differences that–matter–affect our interactions with others–allow us to accomplish our goals

What is Inclusion?
• Diversity working for everyone’s benefit• Cultures of mutual respect as a norm of how
things work• Differences contributing to the greater good• An attractive environment where everyone is
able to succeed or fail.

Why do they Matter in New Hampshire Now?
• Changing Demographics
• Immigrants & Refugees
• Quality of Life• Building a Better NH• Contrasting
Generations
• Attracting the Best and Brightest
• Business & Economic Growth
• Education & Learning
• All of the differences that matter are here to stay!
The Role of Leadership in Diversity Initiatives
• Leadership sets the tone for accepting or beginning to respect differences in healthier ways.
• When leaders understand the value of differences, they can help address the tough issues.
• Without leadership commitment, negative stereotypes and divisiveness prevail.
The Challenges of Diversity
• Resistance to Change (and Technology)• Our personal negative stories about
difference• What is the thinking of my leadership?• The “W & H Strategy”• Not understanding the bigger picture

The Benefits of an Inclusive State Culture
• Innovation & Creativity
• Attracting & Retaining the best talent available
• Improved Health & Safety
• Business & Economic Growth
• Educational & Intellectual Growth
• Improving Quality of Life

Panel DiscussionQ & A
Steve NortonCathy ChesleyAndrew Smith
Thank you!