“myths and facts” in african agriculture: what we now know christopher b. barrett cornell...
TRANSCRIPT

“Myths and Facts” in African Agriculture:
What We Now KnowChristopher B. Barrett
Cornell University
African Development Bank workshop on Structural Transformation in African
Agriculture and Rural Spaces (STAARS)
Nairobi, Kenya, April 8, 2015

The world in which African agriculture operates has changed…
High and volatile food pricesUrbanizationIncome growthSoil erosionCell phonesIncreased investment
… but our evidence base remains often inadequate or rooted in the
past.

1. Represents 40 percent of Sub-Saharan Africa’s population
2. 8 countries with cross-country comparable information
3. Strong focus on agricultural data collection, but also consumption, expenditures, etc.
4. Plot, household, and community level information
5. Nationally-representative statistics as well as within-country (and even within-household) analysis
6. Statistics derived from farmers’ accounts
7. Coupled with growing collection of geo-referenced data sets
8. Repeated visits to households (panel data)
An opportunity to update our understanding of African agriculture!
• Provide a solid, updated, and bottom-up picture of Africa’s agriculture and farmers’ livelihoods using cross-sectional data
• Create a harmonized and easy-to-use database of core agricultural variables for tabulation and regional cross-country benchmarking
• Build a community of practice• Partnering institutions: World Bank, African Development Bank,
Cornell University, Food and Agriculture Organization, Maastricht School of Management, Trento University, University of Pretoria, Yale University
• Mentorship program for young African scholars from US and African institutions
A G R I C U L T U R E
I N A F R I C AT E L L I N G FA C T SF R O M M Y T H S
“Myths and Facts” project objectives:

1) Use of modern inputs remains dismally low
2) Land, labor and capital markets remain largely incomplete
3) Agricultural labor productivity is low
4) Land is abundant and land markets are poorly developed
5) Rural entrepreneurs largely operate in survival mode.
6) Extension services are poor7) Agroforestry is gaining
traction8) African agriculture is
intensifying
9) Women perform the bulk of
Africa’s agricultural tasks10) Seasonality continues to
permeate rural livelihoods11)Smallholder market
participation remains limited
12)Post harvest losses are large
13)Droughts dominate Africa’s risk environment
14)African farmers are increasingly diversifying their incomes
15)Agricultural commercialization and diversification improves nutritional outcomes
Common wisdoms revisited…

1. Agricultural InputsSheahan and Barrett
Ten new (or newly confirmed) facts about agricultural input use in Africa … a preview of
five1. Modern input use may be relatively low in aggregate, but is not uniformly low across (and within) these countries, especially for inorganic fertilizer and agro-chemicals (although not for irrigation and mechanization).
Ethiopia Malawi Niger Nigeria Tanzania Uganda 0
10
20
30
40
50
60
70
80
90
31
38
33
13 11
56
77
17
41
17
3
Share of cultivating households (%) using input on fields
any agro-chemical inorganic fertilizer
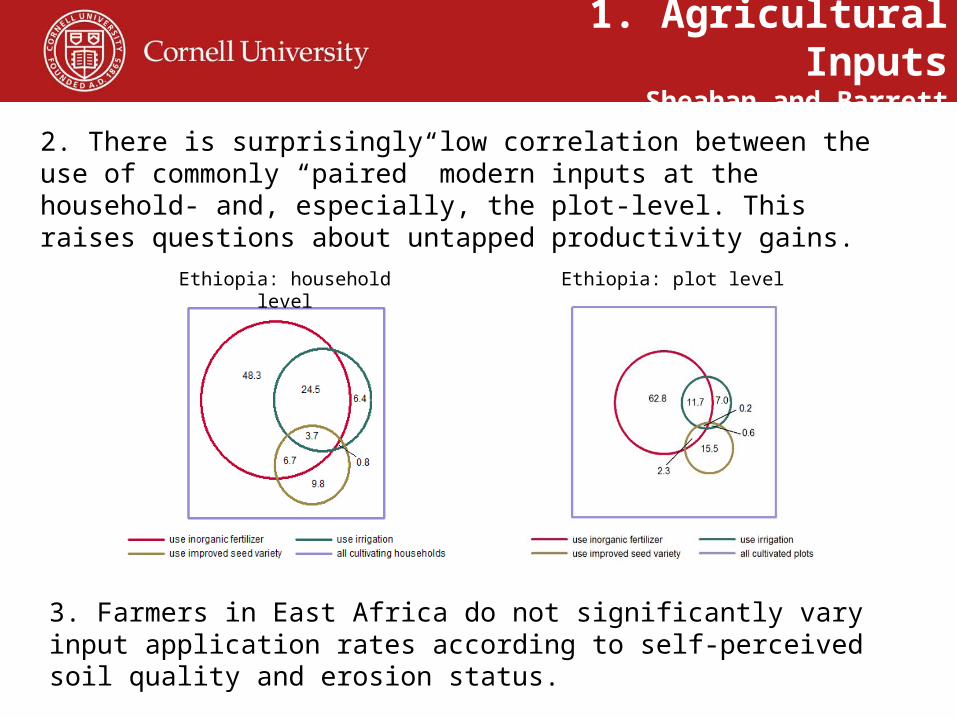
2. There is surprisingly low correlation between the use of commonly “paired” modern inputs at the household- and, especially, the plot-level. This raises questions about untapped productivity gains.
Ethiopia: household level Ethiopia: plot level
1. Agricultural InputsSheahan and Barrett
3. Farmers in East Africa do not significantly vary input application rates according to self-perceived soil quality and erosion status.

1. Agricultural InputsSheahan and Barrett
4. An inverse relationship consistently exists between farm or plot size and input use intensity.
-50
0
50
100
150
200
Ave
rage
ino
rga
nic
fert
ilize
r u
se (
kg/h
a)
0 1 2 3 4Total hectares of land under cultivation
95% CI lpoly smooth
kernel = epanechnikov, degree = 1, bandwidth = .34, pwidth = .51
Local polynomial smooth
0
50
100
150
200
kg/h
a o
f in
org
anic
fert
ilize
r ap
plie
d to
fiel
d
0 .5 1 1.5plot size in hectares
95% CI lpoly smooth
kernel = epanechnikov, degree = 1, bandwidth = .2, pwidth = .3
Local polynomial smooth
Nigeria: farm level Nigeria: plot level
In most cases, this relationship is more pronounced at the plot level, therefore inter-household variation cannot explain relationship.
Suggests need to better understand intra-household agricultural input allocation decisions.

5. National-level factors explain nearly half of the farm-level variation in inorganic fertilizer and agro-chemical use.
Categories of variables Shapley value
Bio-physical variables: rain, soil, elevation, maximum greenness, agro-ecological zones
24
Socio-economic variables: consumption level, sex of household head, household size and dependency ratio
4
Farm operation characteristic variables: farm size, number of crops, type of crops
16
Market and accessibility variables: distance to market and road, prices of fertilizer and main grain
11
Country dummy variables 45
Variation in household-level inorganic fertilizer use
• Ultimately interested to learn where most of the variation in input use comes from: biophysical, infrastructure, market, socio-economic, or policy-specific variables?
• Binary use at household level (avoids bias from survey design)
• 45 percent of variation in inorganic fertilizer use can be explained by country level (similar for agro-chem)
Suggests the policy and operating environments facilitated by governments and regional processes (e.g., CAADP) are critically
important for ushering in a Green Revolution in Sub-Saharan Africa.
1. Agricultural InputsSheahan and Barrett

2. Factor MarketsDillon and Barrett
Agricultural Factor Markets in Sub-Saharan Africa: An Updated View with Formal Tests for Market Failure … a preview
1. Provide a summary overview of land and labor market participation in Ethiopia, Malawi, Niger, Tanzania, and Uganda
2. Implement a simple test of market failures in data from five African countries (testing whether the separation hypothesis holds)
Main findings: in spite of widespread participation in rural land and labor markets, we strongly reject the null hypothesis of complete and competitive markets in all study countries … both input market participation and failure are widespread

2. Factor MarketsDillon and Barrett
Labor markets exist and are active.
Percent of agricultural households hiring labor
Country Activity Number of households
Percent hiring workers
Ethiopia Cultivation 3091 18.5%Harvest 2666 20.9%
Overall 2666 30.2%
Malawi Non-harvest 2605 32.6%
Harvest 2605 16.0% Overall 2605 42.0%
Niger Preparation 2339 19.5%
Cultivation 2339 37.4%Harvest 2339 18.6%
Overall 2339 47.8%Tanzania Planting 2630 18.5%
Weeding 2630 18.9%Fertilizing 2630 2.6%Harvest 2630 16.0%
Overall 2630 30.8%Uganda Overall 2109 46.8%

2. Factor MarketsDillon and Barrett
Land markets exist and are active, too.
Participation in land rental markets Ethiopia Malawi Niger Tanzania UgandaN 3094 2666 2339 2630 2135
Household rents land out 6.10% 0.90% 1.20% 3.40% 0.40%
Household rents land in 19.50% 13.10% 7.30% 6.20% 18.10%
Household rents or borrows land in
30.30% 28.40% 27.70% 23.20% 36.60%
Clearly these markets have sufficient transactors to be competitive. But adequate transactional density is merely a necessary condition for the separation hypothesis to hold.

2. Factor MarketsDillon and Barrett
However, clear evidence of market failure across all countries and multiple specifications (Benjamin 1992, Udry 1999):
But it’s not clear which markets are failing (next step), nor why (search, supervision or transactions costs? That’s the next phase of research …
OLS regression results of farm labor use Ethiopia Malawi Niger Tanzania Uganda
Log area (acres) 0.489*** 0.528*** 0.343*** 0.444*** 0.379***
-0.04 -0.048 -0.026 -0.027 -0.033
Log median wage 0.036 -0.121** -0.155 -0.077 0.012
-0.051 -0.052 -0.107 -0.065 -0.043Log HH size 0.379*** 0.399*** 0.635*** 0.399*** 0.211***
-0.055 -0.061 -0.061 -0.043 -0.044R-squared 0.33 0.278 0.301 0.321 0.312N 2499 2556 2183 2346 2047

3. Women in Agriculture
Christiaensen, Kilic, Palacios-López
Common rhetoric:
“….women are responsible for 60-80 [percent] of the agricultural labour supplied on the continent of Africa.” (UNECA, 1972; FAO, 1995)
Women produce 60 to 80 percent of the food in developing countries and 50 percent of the world’s food supply. (Momsen, 1991)
Female share of agricultural labor documented in LSMS-ISA
surveys:
Uganda 56%
Tanzania 53%
Malawi 52%
Nigeria 37%
Ethiopia 29%
Niger 24%
Cross-country average 40%
How Much Do Women in Africa Contribute to Agriculture? … a preview

3. Women in Agriculture
Christiaensen, Kilic, Palacios-López
Agricultural activities appear to be gendered.
Activity Tanzania Malawi Niger UgandaNorthern Nigeria
Southern Nigeria
Ethiopia
Land Preparation 52 53 18 31 51 26Planting, Weeding 53 53 25 31 51 26
Harvesting 54 51 28 34 51 37Total 53 52 24 56 32 51 29
Female share of agricultural labor by activity
• Women are relatively more involved in harvesting and less in land preparation in the countries in which men have the higher share of agricultural labor.

3. Women in Agriculture
Christiaensen, Kilic, Palacios-López
Age Category
Tanzania Malawi Niger UgandaNorthern Nigeria
Southern Nigeria
Ethiopia
0-15 52 49 25 54 30 46 4315-30 51 54 27 55 32 54 3030-45 56 52 24 56 38 61 3045-60 52 52 23 61 29 50 2660+ 51 52 10 54 21 40 15
Total 53 52 24 56 32 51 29
No systematic evidence of gender differences in youth’s engagement in agriculture.
Female share of agricultural labor by age group
3. Women in Agriculture
Christiaensen, Kilic, Palacios-López
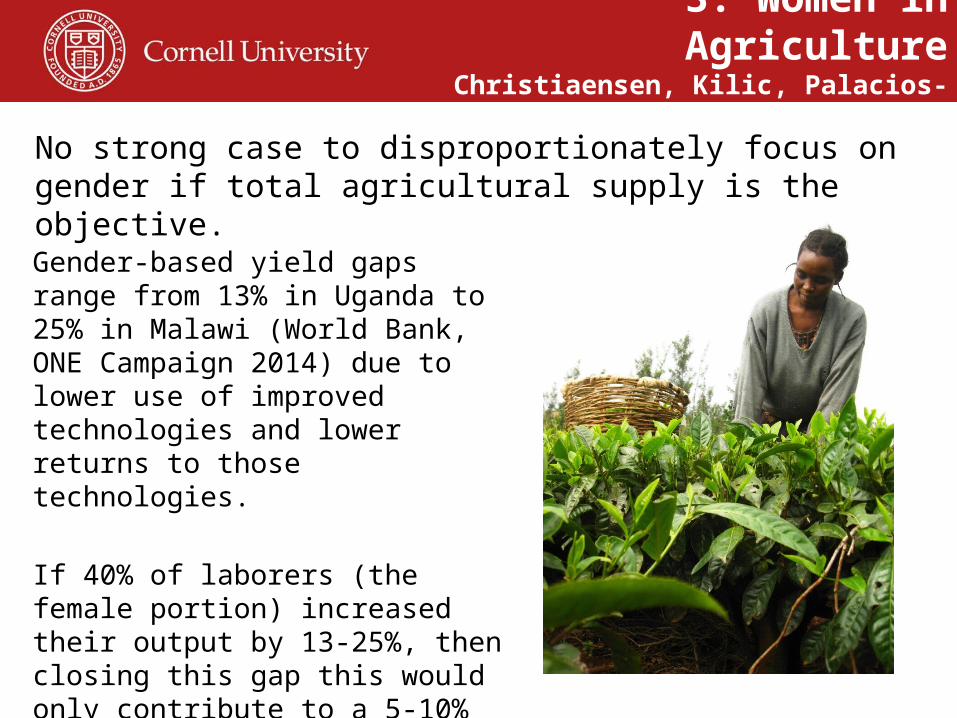
No strong case to disproportionately focus on gender if total agricultural supply is the objective.
Gender-based yield gaps range from 13% in Uganda to 25% in Malawi (World Bank, ONE Campaign 2014) due to lower use of improved technologies and lower returns to those technologies.
If 40% of laborers (the female portion) increased their output by 13-25%, then closing this gap this would only contribute to a 5-10% increase in total agricultural production.

4. Post-harvest LossesKaminski and Christiaensen
Common wisdoms about post harvest losses:
“Worldwide 32 % of all food produced is lost. In SSA, it amounts to 37%.” (FAO, 2011)
Post harvest losses for cereals alone is estimated at 20.5% (FAO, 2011).
Goal of this analysis: Focus on farmer-reported post harvest losses of maize (more perishable than sorghum and millet) in East Africa.
Post Harvest Loss in Sub-Saharan Africa:
What do farmers say? … a preview

4. Post-harvest LossesKaminski and Christiaensen
• Between 7 (Malawi) and 22 (Uganda) percent of maize farmers report to incur on-farm PHL for maize, losing between 20 to 27 percent of their harvest.
• Adds up to between 1 and 6 percent of total national maize harvest.
• Insects and rodents/pests (biotic factors) as the most important reasons for reported losses.
Proportions (%) UG 2009-10 TZ 2010-11 TZ 2008-09 MW 2010-11Post harvest losses, portion of harvest (unconditional)
5.9 2.9 4.4 1.4
Probability of reporting post harvest losses 21.5 14.7 19.0 6.8
Post harvest losses, portion of harvest (conditional)
27.4 19.7 23.1 20.6
# maize producing hhs 1,853 1,520 1,301 10,331

4. Post-harvest LossesKaminski and Christiaensen
• Increases with • Humidity and
temperature
• Declines with• Seasonal price gap• Proximity to market place• Post primary education • Female headed
households
• Not associated with• Poverty• Rural/urban areas
Correlates of self-reported post harvest maize losses:

4. Post-harvest LossesKaminski and Christiaensen
Use of improved storage technology is low.
UG 2009-10 TZ 2010-11 TZ 2008-09 MWI 2010-
11
Traditional storage 1.4 24.8 19.2 17.9
Improved storage 0.6 11.5 5.9 2.0
Spraying/ smoking 63.1 49.0 37.2 10.8• Uptake of improved grain storage facilities (modern stores,
improved local structures, air-tight drums) is minimal.• Crop protection sprays and smoking, however, are widely used,
further adding to the already higher than expected agro-chemical use on fields.
• Taken together, these facts suggest limited aggregate food supply gains to attempting reductions in on-farm loss or storage technology promotion.

5. Labor and Productivity
McCullough
• Labor allocation and productivity are key features of structural transformation because they describe the incentives households face when making decisions about time use
Time use and labor productivity in Africa … a preview

5. Labor and Productivity
McCullough
• Micro-measures of labor shares are relatively similar to national accounts-based measures
• However, note that hours based measures offer lower agriculture shares than participation based measures do

5. Labor and Productivity
McCullough
• Agricultural workers supply far fewer hours of labor per year than do workers in other sectors
• Individuals participating in other sectors also work in agriculture; the reverse is much less true of primarily agriculture workers

5. Labor and Productivity
McCullough• Labor productivity gaps are pronounced when only focusing
on primary sector of participation• But gaps virtually vanish or are reversed when accounting
for hours worked (except Tanzania)
• What look like productivity gaps (left) could actually just be employment gaps
• Highlights the continued importance of agriculture in Africa’s structural transformation and the need to interrogate the data

Concluding remarks
• Solid descriptive statistics are key to guide policy debates
• We’ve learned a lot about the current status of African agriculture and livelihoods from this new descriptive evidence.
• Times are changing, and so is rural Africa. We must keep up to date
• Now, with emerging panel data, we have the opportunity to further contribute to evidence-based policy making by moving from descriptive work to research on the causes of change.

Thank you for your time, interest and comments!
Thank you