myp algebra i s1 exam overview proportions, percentages & conversion rates...
TRANSCRIPT
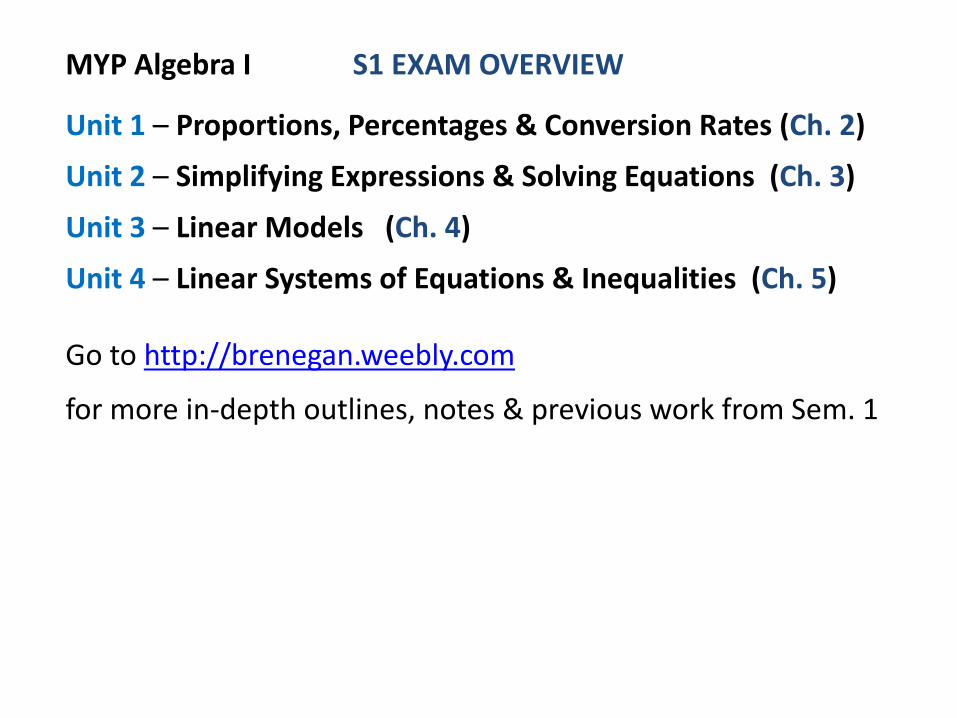
MYP Algebra I S1 EXAM OVERVIEW
Unit 1 – Proportions, Percentages & Conversion Rates (Ch. 2)
Unit 2 – Simplifying Expressions & Solving Equations (Ch. 3)
Unit 3 – Linear Models (Ch. 4)
Unit 4 – Linear Systems of Equations & Inequalities (Ch. 5) Go to http://brenegan.weebly.com
for more in-depth outlines, notes & previous work from Sem. 1
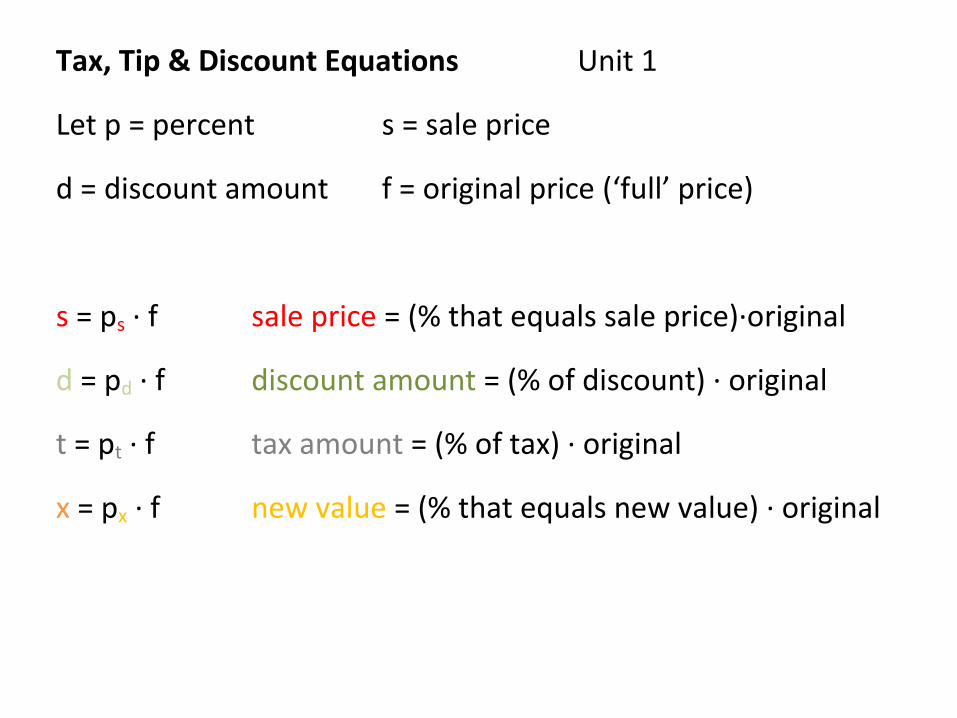
Tax, Tip & Discount Equations Unit 1
Let p = percent s = sale price
d = discount amount f = original price (‘full’ price)
s = ps ∙ f sale price = (% that equals sale price)∙original
d = pd ∙ f discount amount = (% of discount) ∙ original
t = pt ∙ f tax amount = (% of tax) ∙ original
x = px ∙ f new value = (% that equals new value) ∙ original
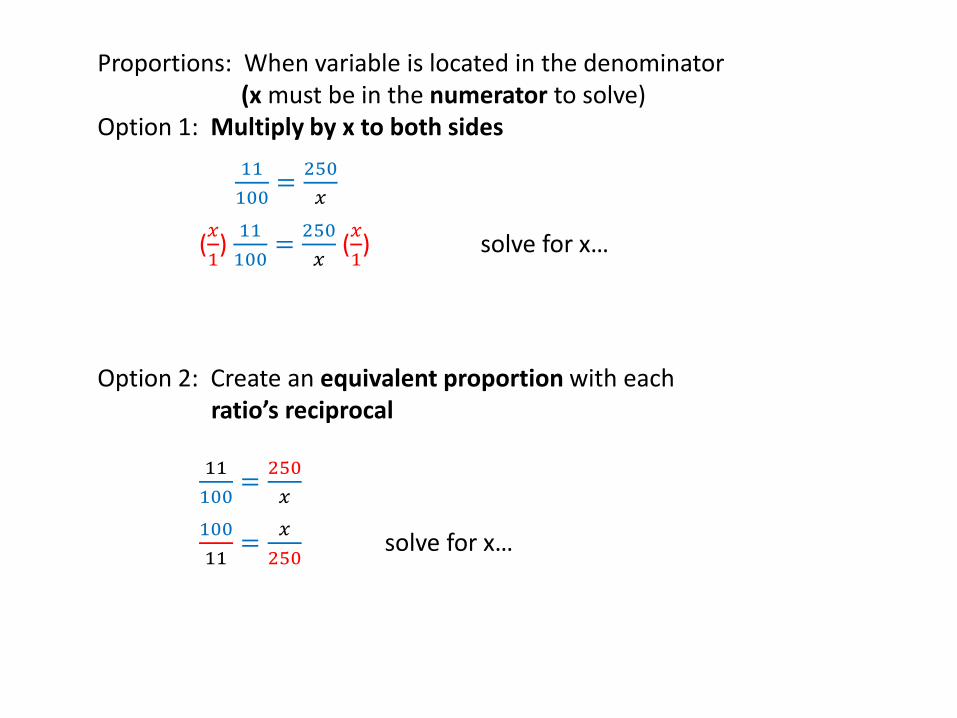
Proportions: When variable is located in the denominator (x must be in the numerator to solve)
Option 1: Multiply by x to both sides
11
100=
250
𝑥
(𝑥
1)
11
100=
250
𝑥 (𝑥
1) solve for x…
Option 2: Create an equivalent proportion with each ratio’s reciprocal
11
100=
250
𝑥
100
11=
𝑥
250 solve for x…

MYP Algebra I Unit I Evidence Review Name: KEY Block:
1. Give a definition and example of each of the following vocabulary words…
Ratio: a comparison of two quantities. Ex.) 1: 100,000 chance of winning the lottery
1
100,000 = 0.00001 = 0.001%
Proportion: an equation stating that two ratios are equivalent. Ex.) 1
2 =
3
6 or
1
2 =
𝑥
30
2. Compare the given fractions. Prove your answers.
a. 2
5 <
3
7 b.
6
13 =
12
26 c.
12
14 >
17
25
(𝟕
𝟕)
2
5<
3
7(𝟓
𝟓) (
𝟐
𝟐)
6
13=
12
26(𝟏
𝟏) (
𝟐𝟓
𝟐𝟓)
12
14>
17
25(𝟏𝟒
𝟏𝟒)
6
35 <
15
35
12
26 =
12
26
300
350 >
238
350
3. Find the value of the unknown in each proportion. Show all work when solving for x.
a. 24
40=
𝑡
30 b.
100
30=
7
𝑥 c.
6
𝑛=
62
217
(𝟑𝟎
𝟏)
24
40=
𝑡
30(𝟑𝟎
𝟏)
30
100=
𝑥
7
𝑛
6=
217
62
18 = t (𝟕
𝟏)
30
100=
𝑥
7(𝟕
𝟏) (
𝟔
𝟏)𝑛
6=
217
62(𝟔
𝟏)
2.1 = x n = 21
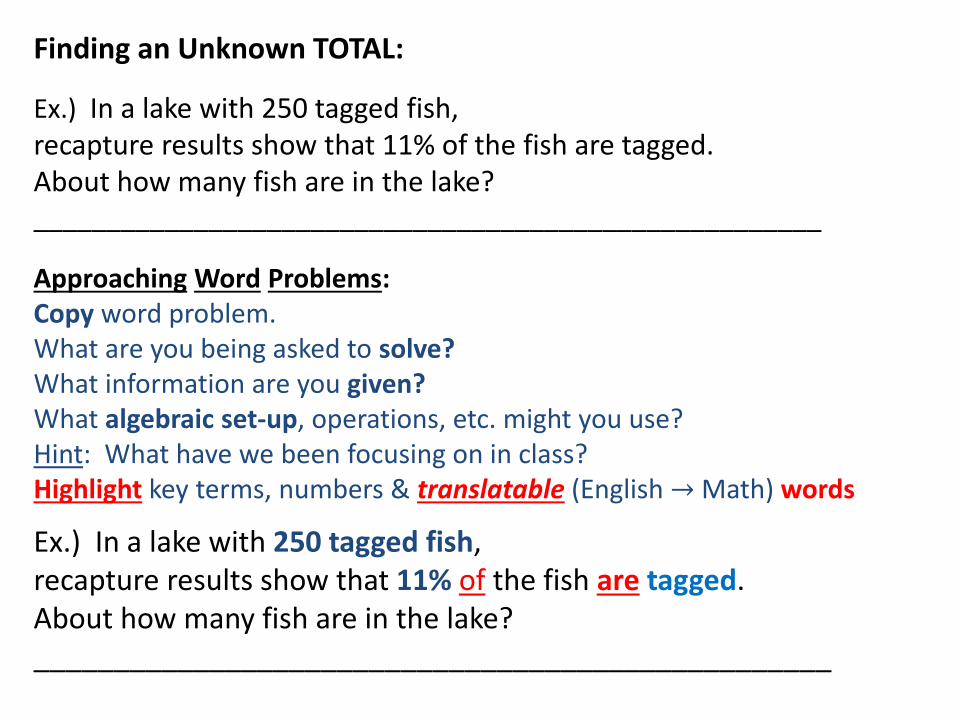
Finding an Unknown TOTAL:
Ex.) In a lake with 250 tagged fish, recapture results show that 11% of the fish are tagged. About how many fish are in the lake? ______________________________________________________
Approaching Word Problems: Copy word problem. What are you being asked to solve? What information are you given? What algebraic set-up, operations, etc. might you use? Hint: What have we been focusing on in class? Highlight key terms, numbers & translatable (English → Math) words
Ex.) In a lake with 250 tagged fish, recapture results show that 11% of the fish are tagged. About how many fish are in the lake? __________________________________________________

SOLUTION:
Ex.) In a lake with 250 tagged fish, recapture results show that 11% of the fish are tagged. About how many fish are in the lake?
Let x = total # of fish in the lake
𝑡𝑎𝑔𝑔𝑒𝑑 𝑓𝑖𝑠ℎ
𝑡𝑜𝑡𝑎𝑙 𝑓𝑖𝑠ℎ
11
100=
250
𝑥
(𝑥
1)
11
100=
250
𝑥 (𝑥
1)
11
100x = 250
(100
11)
11
100x =
250
1 (100
11)
x = 2272.𝟕𝟐 ≈ 𝟐, 𝟐𝟕𝟑 𝐭𝐨𝐭𝐚𝐥 fish
x must be in the numerator to solve multiply by the reciprocal of a fraction if it’s being multiplied to x

Ch. 2 Proportion Application
You estimate that two out of every three students will attend the class party. You know there are 750 students in your class. Set up a proportion & solve for the estimated number of people that will attend. Hint: to set up the proportion, be sure both ratios make the same comparison.
𝑠𝑡𝑢𝑑𝑒𝑛𝑡𝑠 𝑤ℎ𝑜 𝑤𝑖𝑙𝑙 𝑎𝑡𝑡𝑒𝑛𝑑
𝑠𝑡𝑢𝑑𝑒𝑛𝑡𝑠 𝑤ℎ𝑜 𝑎𝑟𝑒 𝑖𝑛𝑣𝑖𝑡𝑒𝑑=
𝑡𝑜𝑡𝑎𝑙 𝑠𝑡𝑢𝑑𝑒𝑛𝑡𝑠 𝑤ℎ𝑜 𝑤𝑖𝑙𝑙 𝑎𝑡𝑡𝑒𝑛𝑑
𝑡𝑜𝑡𝑎𝑙 𝑠𝑡𝑢𝑑𝑒𝑛𝑡𝑠 𝑖𝑛𝑣𝑖𝑡𝑒𝑑
2
3=
𝑥
750
x = 500 students will attend
After the party, you found out that 70% of the total class = attended. How many students attended? 0.70 (total class) = attended 0.70 (750) = x OR 525 = x
Proportion Set – up: 70
100=
𝑥
750
(750
1)
70
100=
𝑥
750 (750
1)
525 = x

Ch. 2.3 Dimensional Analysis & Conversion Rates
Slide 1- 8


Multi-Step Equations: which operation should you perform first?
ex. 5x + 9 = 24 subtract 9 or divide by 5?
Answer: Perform the operations in the REVERSE order of operations. Order of Operations Solving for x
1.) Parentheses 1.) Add or Subtract any numbers to solve for x
2.) Powers (Exponents: x2) 2.) Multiply or Divide any numbers to solve for x
3.) Multiplication & Division 3.) Find the root (√ ) if x is to a power (x2)
4.) Addition & Subtraction 4.) Finally, eliminate the parentheses around x with
the necessary inverse operations

A term is a number, a variable, or the product
of a number and variable(s). The two terms in
−2x + 4y are − 2x and 4y.
Terms with exactly the same variable factor are
called like terms. In − 3x + 4y + 5x, −3x and
5x are like terms.
One way to combine like terms is by addition
or subtraction.
• Add to combine like terms in 4y + y.
4y + y = 4y + 1y = 5y
• Subtract to combine like terms in 2m − 5m.
2m − 5m = (2 − 5)m = −3m
To simplify an expression, combine its like
terms. Perform as many of its operations as
possible.
Simplify: 3a + 5b − a + 2b
=> 3a − a + 5b + 2b
=> 2a + 7b
Distribute: 2(x − 4)
=>2x − 2(4)
=>2x − 8

Inequality Graph How to Read the Graph
x > 2
x is greater
than 2
An open dot at 2 shows that 2 is not included. All numbers greater than 2 are included.
x < 2
x is less
than 2
An open dot at 2 shows that 2 is not included. All numbers less than 2 are included.
x ≥ 2
x is equal to or
greater than 2
A solid dot at 2 shows that 2 is included. All numbers greater than 2 are also included.
x ≤ 2
x is equal to or
less than 2
A solid dot at 2 shows that 2 is included. All numbers less than 2 are also included.
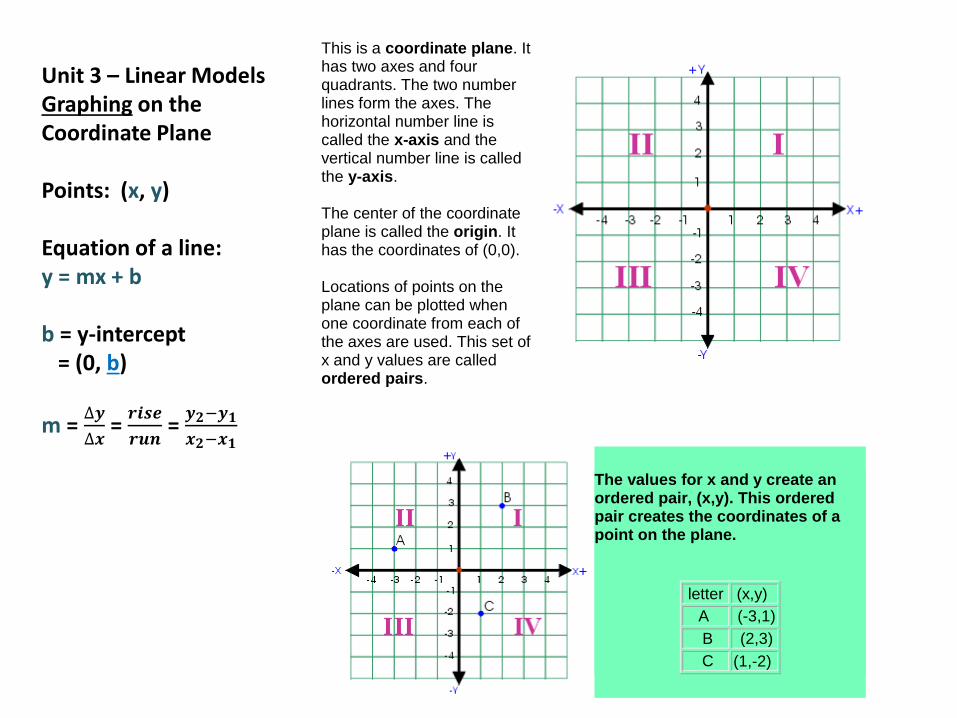
This is a coordinate plane. It has two axes and four quadrants. The two number lines form the axes. The horizontal number line is called the x-axis and the vertical number line is called the y-axis. The center of the coordinate plane is called the origin. It has the coordinates of (0,0). Locations of points on the plane can be plotted when one coordinate from each of the axes are used. This set of x and y values are called ordered pairs.
The values for x and y create an ordered pair, (x,y). This ordered pair creates the coordinates of a point on the plane.
letter (x,y)
A (-3,1)
B (2,3)
C (1,-2)
Unit 3 – Linear Models Graphing on the Coordinate Plane Points: (x, y) Equation of a line: y = mx + b b = y-intercept = (0, b)
m = ∆𝒚
∆𝒙 =
𝒓𝒊𝒔𝒆
𝒓𝒖𝒏 =
𝒚𝟐−𝒚𝟏
𝒙𝟐−𝒙𝟏

Unit 3 Solving Equations (Ch. 3.6) Solve each equation using inverse operations.
1.) 0.5x + 2.2 = 101 2.) 2(2x + 2) = 7 3.) 𝟒+𝟎.𝟎𝟏𝒙
𝟔.𝟐 - 6.2 = 0
-2.2 -2.2 4x + 4 = 7 𝟒+𝟎.𝟎𝟏𝒙
𝟔.𝟐 = 6.2
-4 -4
0.5x = 98.8 4x = 3 (6.2) 𝟒+𝟎.𝟎𝟏𝒙
𝟔.𝟐 =6.2(6.2)
x = 197.6 x = ¾ 4 + 0.01x = 38.44 0.01x = 34.44 x = 3,444
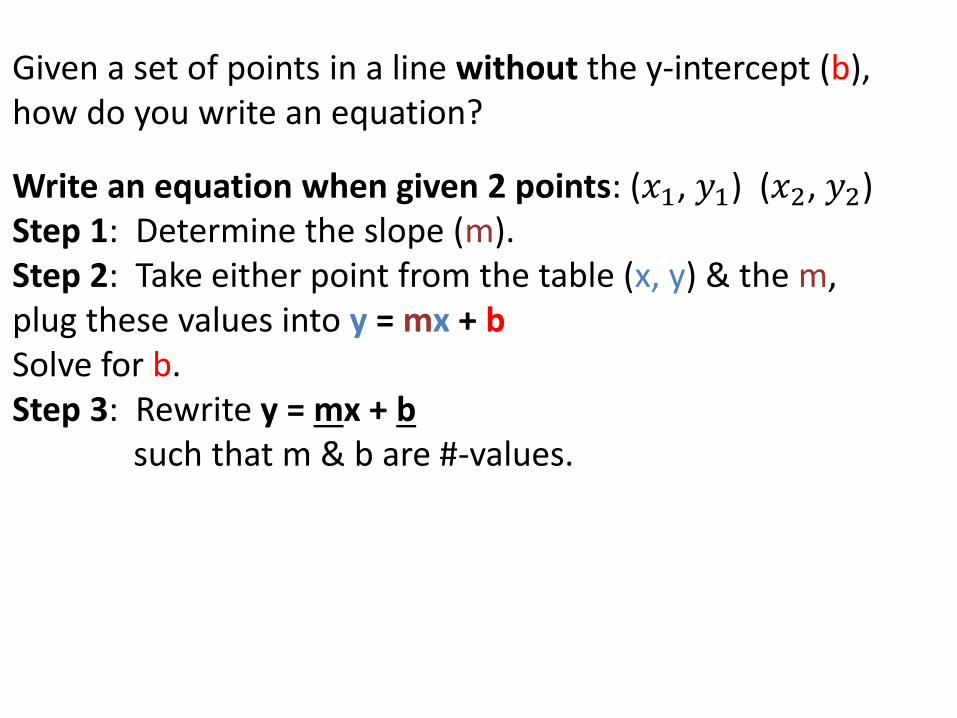
Given a set of points in a line without the y-intercept (b), how do you write an equation?
Write an equation when given 2 points: (𝑥1, 𝑦1) (𝑥2, 𝑦2) Step 1: Determine the slope (m). Step 2: Take either point from the table (x, y) & the m, plug these values into y = mx + b Solve for b. Step 3: Rewrite y = mx + b such that m & b are #-values.

Ex.) Write an equation that connects the given points.
x y
-4 -5
-2 -3.5
4 1
12 7
Step 1: Choose 2 points; solve for m.
Step 2: Solve for b. (4, 1) m = ¾ y = m x + b 1 = ¾(4) + b 1 = 3 + b -2 = b
Step 3: Rewrite y = mx + b
y = 𝟑
𝟒 x – 2
Step 1: (-4, -5) and (-2, -3.5) 𝑥1 𝑦1 𝑥2 𝑦2
m = 𝒚𝟐 − 𝒚𝟏
𝒙𝟐 − 𝒙𝟏
m = −3.5 −(−5)
−2 −(−4)
m = 1.5
2
m = 𝟑
𝟒
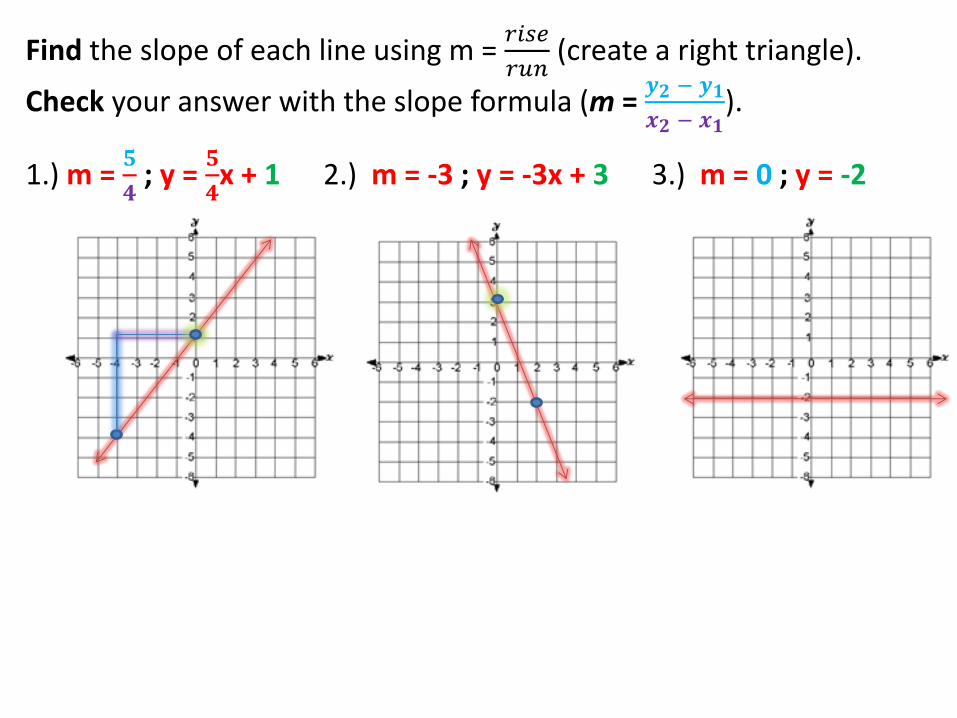
Find the slope of each line using m = 𝑟𝑖𝑠𝑒
𝑟𝑢𝑛 (create a right triangle).
Check your answer with the slope formula (m = 𝒚𝟐 − 𝒚𝟏
𝒙𝟐 − 𝒙𝟏).
1.) m = 𝟓
𝟒 ; y =
𝟓
𝟒x + 1 2.) m = -3 ; y = -3x + 3 3.) m = 0 ; y = -2
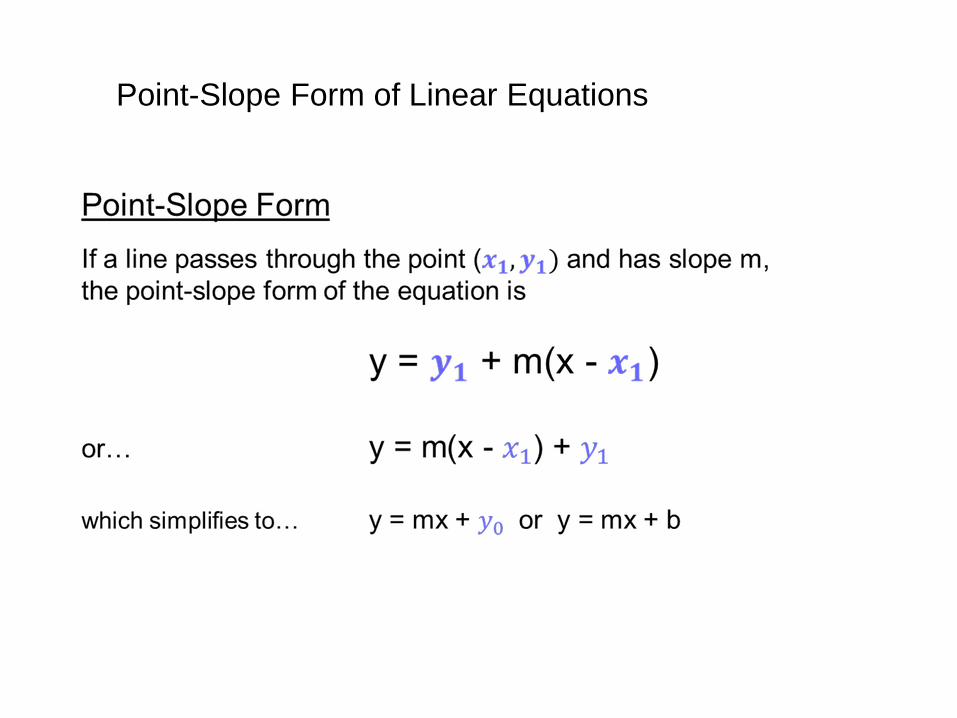
Point-Slope Form of Linear Equations

MYP Alg. I Ch. 4.1 – 4.5 Linear Models REVIEW KEY Name: ____________ ______________Block: B-___
1.) Given line a & line b: Identify the following & write an equation for each line in slope-intercept form.
2.) The equation of a line, in point-slope form, is y = 8 – 3(x + 3).
a.) Identify the slope & point used to create this equation. m = -3 (x1, y1) = ( -3 , 8 )
b.) Write the given equation in slope-intercept form. y = 8 – 3(x + 3) y = 8 – 3x – 9
y = -3x – 1 y = -3x – 1
Line a Line b
m = −
m =
b-value = 3 b-value = -1
Equation: y = −
x + 3 Equation: y =
x – 1

Using any two points on a graph or in a table, write an equation in point-slope
form.

)2(7
34 xy )5(
7
31 xy
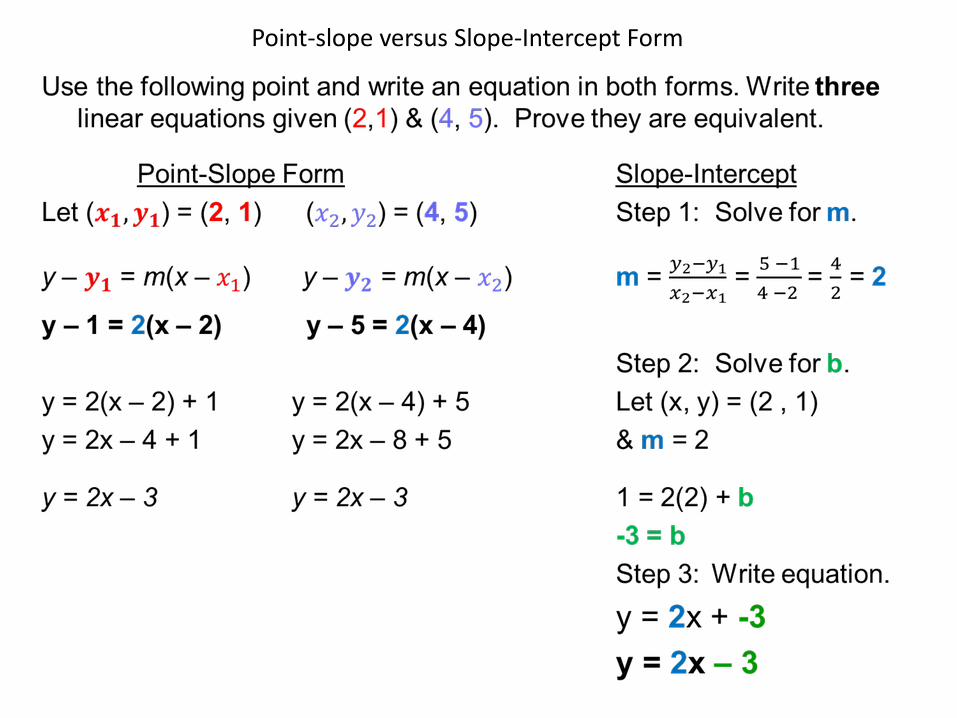
Point-slope versus Slope-Intercept Form

Unit 4 – Linear Systems – Graphing Method Solve the following systems graphically.
3
62
yx
yx
Write each condition in slope-intercept form.
𝑦 = 2𝑥 − 6𝑦 = −𝑥 + 3
Graph each line & find the point of intersection.
Solution: (3, 0)
Check: −2(3) + (0) = −6
(3) + (0) = 3
−6 = −63 = 3
√
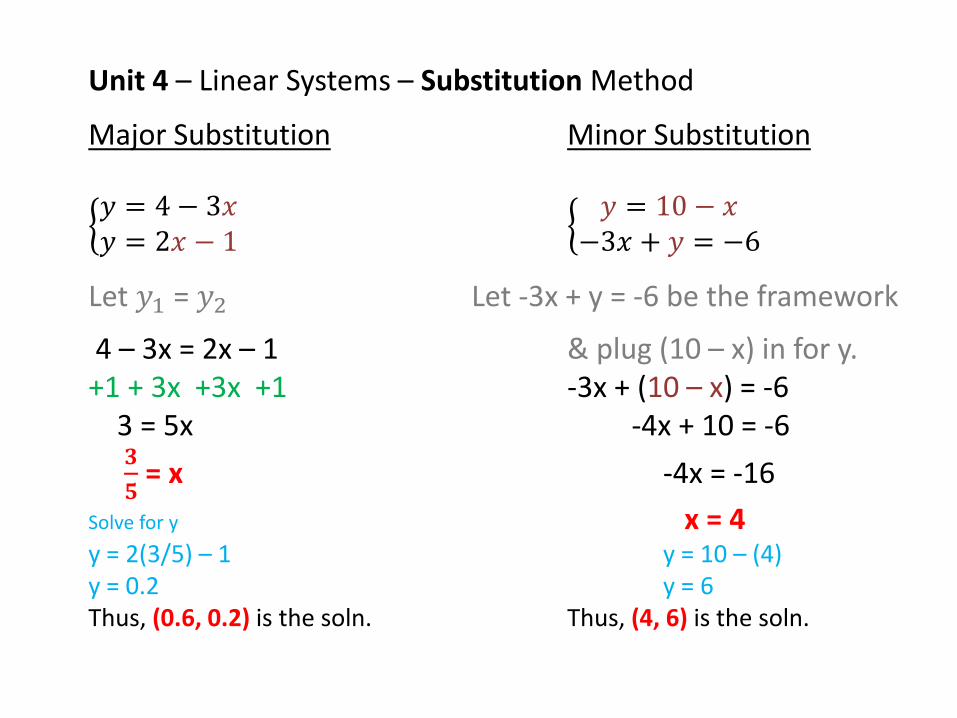
Unit 4 – Linear Systems – Substitution Method
Major Substitution Minor Substitution
𝑦 = 4 − 3𝑥𝑦 = 2𝑥 − 1
𝑦 = 10 − 𝑥
−3𝑥 + 𝑦 = −6
Let 𝑦1 = 𝑦2 Let -3x + y = -6 be the framework
4 – 3x = 2x – 1 & plug (10 – x) in for y. +1 + 3x +3x +1 -3x + (10 – x) = -6 3 = 5x -4x + 10 = -6
𝟑
𝟓 = x -4x = -16
Solve for y x = 4 y = 2(3/5) – 1 y = 10 – (4) y = 0.2 y = 6 Thus, (0.6, 0.2) is the soln. Thus, (4, 6) is the soln.
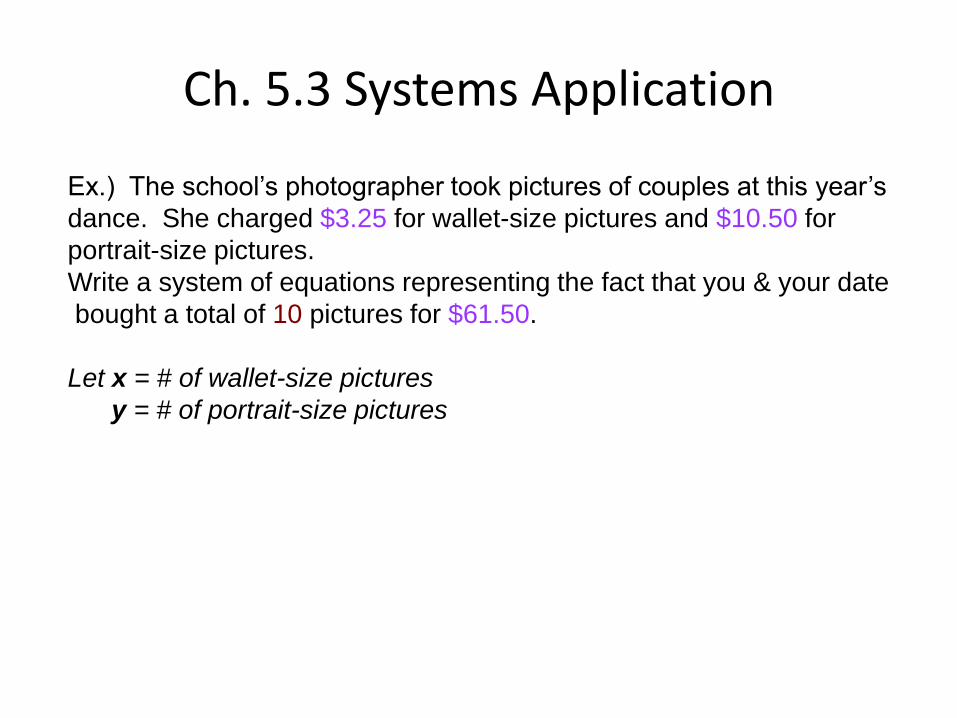
Ch. 5.3 Systems Application
Ex.) The school’s photographer took pictures of couples at this year’s
dance. She charged $3.25 for wallet-size pictures and $10.50 for
portrait-size pictures.
Write a system of equations representing the fact that you & your date
bought a total of 10 pictures for $61.50.
Let x = # of wallet-size pictures
y = # of portrait-size pictures

Ch. 5.3 Systems Application Solution:
-3.25(x + y = 10)
-3.25x – 3.25y = -32.5
+(3.25x + 10.50y = 61.50)
7.25y = 29
y = 4
Solve for x: ( _, 4)
x + y = 10
x + 4 = 10
x = 6
Thus, you purchased 6 wallet-sized & 4 portrait-sized pics.

Graphing Inequalities Steps:
1.) Graph the boundary lines: Draw a dashed line on the boundary for inequalities with > or < signs. Draw a solid line on the boundary for inequalities with ≥ or ≤ signs.
2.) Shade to represent the inequality: If y is less than (y <__ or y ≤ __), shade BELOW the boundary line. If y is greater than (y >__ or y ≥__), shade ABOVE the boundary line.

4
4
yx
yx
5.7 Systems of Inequalities:
Graph the following inequalities on the same coordinate plane.
Inequalities MUST be in y = mx + b form to graph & shade properly. Solution: Overlapping shaded region (red stripes AND blue)