myeloid zinc finger 1 (mzf-1) suppresses prostate tumor ... · 1 supplementary info myeloid zinc...
TRANSCRIPT

1
Supplementary Info
Myeloid zinc finger 1 (MZF-1) suppresses prostate tumor growth
through enforcing ferroportin-conducted iron egress
Yue Chen1, 2, Zhihong Zhang1, Kuo Yang 1, Jin Du3, Yong Xu1,*, Sijin Liu2,*
1. Department of Urology, the Second Hospital of Tianjin Medical University,
Tianjin Institute of Urology, Tianjin 300211, China.
2. State Key Laboratory of Environmental Chemistry and Ecotoxicology, Research
Center for Eco-Environmental Sciences, Chinese Academy of Sciences, Beijing
100085, China.
3. School of Life Sciences, Tsinghua University, Beijing 100084, China
Correspondence to Sijin Liu, Ph.D, or Yong Xu, MD
Email: [email protected]

2
Supplementary Figure Legends
S Fig. 1 Increased intracellular iron promotes PC3 cell growth. (A) Cell number
counting of PC3 cells after treatment with 200 μM Fe-NTA at different time points as
indicated (n=4). (B) The MTT assay indicated the cell viability upon 200 μM Fe-NTA
treatment at different time points as indicated (n=6).
S Fig. 2 MZF-1 regulates FPN expression in DU145 cells. (A) FPN and ferritin
concentrations in DU145 cells upon downregulation of endogenous MZF-1. (B)
Western blot of FPN and ferritin concentrations in DU145 cells with forced
expression of MZF-1.
S Fig. 3 MZF-1 regulates DU145 cell growth and cell viability. (A) Cell growth
reflected by cell number counting after knocking-down MZF-1 for 48h (n=4). (B)
Cell viability determined by the MTT assay upon knocking-down MZF-1 for 48h
(n=6). (C) Cell number counting upon forced expression of MZF-1 for 48h (n=4). (D)
Cell viability assessed by the MTT assay after 48-h transfection of MZF-1
overexpression plasmid (n=6).
S Fig. 4 DNA replication and intracellular ATP levels in DU145 cells. (A)&(B)
DNA replication was evaluated by the BrdU assay upon downregulation or forced
expression of MZF-1 for 48 h (n=6). (C)&(D) Relative ATP levels were assayed with
a microplate reader in DU145 cells in response to MZF-1 knockdown or
overexpression for 48 h (n=4).
S Fig. 5 Relative MZF-1 mRNA levels in PC3 cells upon miR-492 mimic molecule
transfection. qRT-PCR analysis of MZF-1 expression in PC3 cells after 48-h

3
transfection of miR-492 mimic molecules (n=4).
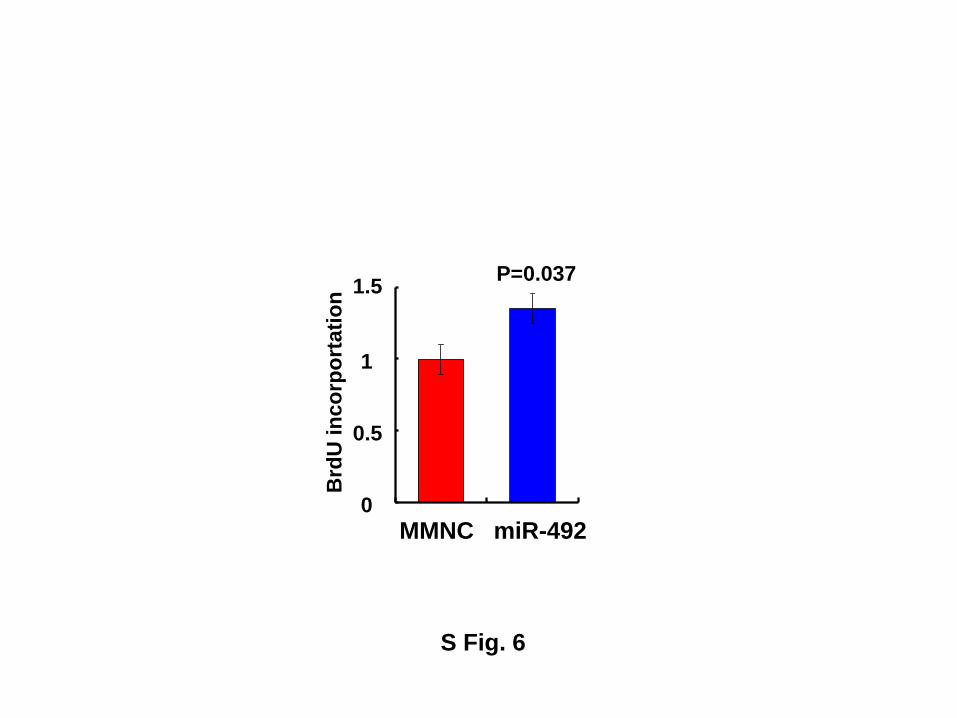
S Fig. 6 miR-492 enhances PC3 cell proliferation. Cell proliferation assessed by the
BrdU incorporation assay after transfection of miR-492 mimic molecules for 48 h
(n=4).

4
S Table 1. Predicted transcription factors that potentially regulate MZF-1
Gene Scroe Gene Score
HSF 100.0 Sn 93.1
AML-1a 100.0 HSF2 92.9
Lyf-1 100.0 GATA-2 92.2
c-Rel 99.2 Hb 92.0
NIT2 98.8 GC box 91.9
CdxA 98.6 STRE 91.5
ADR1 98.5 CREB 91.0
GATA-1 98.4 SRY 90.9
CDP CR 97.6 StuAp 90.8
Nkx-2 97.1 USF 90.8
MyoD 96.8 c-Myb 90.7
cap 96.2 GATA-3 90.5
AP4 94.6 Sp1 90.4
Dfd 93.4 STATx 90.4
Ttk 69 93.3 HNF-3b 90.2
NF-kap 93.1

5
S Table 2. Predicted miRNAs that potentially regulate MZF-1
miRNA
miR-1228 miR-4292
miR-128 miR-452
miR-1291 miR-491-5p
miR-139-5p miR-492
miR-147b miR-581
miR-181a miR-591
miR-21 miR-600
miR-30b miR-615-3p
miR-3130-5p miR-661
miR-3165 miR-92a -2
miR-3187 miR-934
miR-3191 miR-98
miR-3194 let-7a
miR-330-5p let-7b
miR-363 let-7c
miR-3652 let-7d
miR-3681 let-7e
miR-3689a-3p let-7f
miR-380 let-7g
miR-4256 let-7i

6
S Table 3. Oligonucleotide primers for knock-down and ChIP assays
Name Sequence (5’ -> 3’)
siRNA-MZF-1 pr1 Sense GAGGUCCUAUCAGAGAAGA
siRNA-MZF-1 pr1 Anti-Sense UCUUCUCUGAUAGGACCUC
siRNA-MZF-1 pr1 Sense CUACUGUAGGUGUCCAAUA
siRNA-MZF-1 pr1 Anti-Sense UAUUGGACACCUACAGUAG
siRNA-AP4 Sense GUGAUAGGAGGGCUCUGUAG
siRNA-AP4 Anti-Sense CUACAGAGCCCUCCUAUCAC
siRNA-c-Myb Sense AAGCACUUAAAGGGGAGAAUU
siRNA-c-Myb Anti-Sense UUCUCCCCUUUAAGUGCUUGG
MZF-1 Sense TGCAAGCCTCCGTTTGCTCCT
MZF-1 Anti-Sense CGGTCGCAGTGCAAAGCTCC
AP4 Sense ACCCAGACTCAGATCAGCAC
AP4 Anti-Sense CAGCTAAAGCAGACGGCTCG
c-Myb Sense CCCATCCTTCTCTCTCCCACA
c-Myb Anti-Sense TCCACCCAGACTTCGTGAGG

7
S Table 4. Oligonucleotide primers for qRT-PCR analyses
Name Sequence (5’ -> 3’)
MZF-1 Sense AGTGTAAGCCCTCACCTCC
MZF-1 Anti-Sense GGGTCCTGTTCACTCCTCAG
AP4 Sense GCTTCTCAGAGTTGCTGTGC
AP4 Anti-Sense CAGCATCGGTTCTTCCTCTG
c-Myb Sense GCACCAGCATCAGAAGATGA
c-Myb Anti-Sense CTTTCCACAGGATGCAGGTT
GAPDH Sense GAAGGTGAAGGTCGGAGT
GAPDH Anti-Sense GAAGATGGTGATGGGATTTC
miR-98 Sense CGGCGGTGAGGTAGTAAGTTGTA
miR-147b Sense CGGCGGGTGTGCGGAAATGCTTC
miR-380 Sense CGGCGGTGGTTGACCATAGAACA
miR-452 Sense CGGCGGAACTGTTTGCAGAGGAA
miR-491 Sense CGGCGGAGTGGGGAACCCTTCCA
miR-492 Sense CGGCGGAGGACCTGCGGGACAAGA
microRNA Anti-Sense GTGCAGGGTCCGAGGT
U6 Sense GTGCTCGCTTCGGCAGCACA
U6 Anti-Sense GCAAATTCGTGAAGCGTTCC

S. Fig 1
Re
lati
ve
ab
so
rba
nc
e
48h
(A)
(B)
Re
lati
ve
ab
so
rba
nc
e
24h
0.5
1.0
1.5
0Cont Fe-NTA
P<0.001
Cont Fe-NTA
0.5
1.0
1.5
0
P=0.001
24h
0.25
0.75
1.0
0Cont Fe-NTA
P<0.001
Ce
ll n
um
be
r (×
10
5)
0.5
48h
Cont Fe-NTA
0.5
1.0
1.5
0
P<0.001
Ce
ll n
um
be
r (×
10
5)
2.0

S. Fig 2
MZF-1
FPN
Ferritin
GAPDH
(A) (B)
FPN
MZF-1
Ferritin
GAPDH
MZF-1-siRNAScrambled MZF-1-plasmidVector

MZF-1-siRNAScrambled
Re
lati
ve
ab
so
rba
nc
e
0.4
0.8
0
1.2 P<0.001
MZF-1-siRNAScrambled
1
0
1.5C
ell
nu
mb
er
(×10
5)
0.5
2P=0.024
Vector MZF-1-plasmid
P<0.001
Re
lati
ve
ab
so
rba
nc
e
0.4
0.8
0
1.2
Vector MZF-1-plasmid
1
0
1.2
Ce
ll n
um
be
r (×
10
5)
0.5
P=0.005
S Fig. 3
(A) (B)
(C) (D)

Scrambled
0.5
1
0
1.5
Brd
U i
nc
orp
ort
ati
on P<0.001
MZF-1-siRNA Vector MZF-1-plasmid
0.5
1
0
1.5
Brd
U i
nc
orp
ort
ati
on
P<0.001
0.5
1
0
1.5
AT
Pp
rod
ucti
on
MZF-1-siRNAScrambled
P=0.04
P=0.029
0.5
1
0
1.5
AT
P p
rod
ucti
on
Vector MZF-1-plasmid
S Fig. 4
(A) (B)
(C) (D)

S Fig. 5
MMNC miR-4920
2.5
2
1
0.5
1.5
MZ
F-1
mR
NA P=0.956
S Fig. 6
MMNC miR-492
0.5
1
0
1.5
Brd
U in
co
rpo
rtati
on
P=0.037