mycotoxins in the environment: ii. occurrence and origin
TRANSCRIPT
SUPPORTING INFORMATION TO ARTICLE:
Mycotoxins in the environment: II. Occurrence and origin in Swiss river waters
Judith Schenzel 1,2
, Konrad Hungerbühler 2, Thomas D. Bucheli
1 *
1) Research Station Agroscope Reckenholz-Taenikon ART, CH-8046 Zurich, Switzerland
2) Institute for Chemical and Bioengineering; Swiss Federal Institute of Technology (ETH), CH-8093
Zurich, Switzerland
* Corresponding author.
Content:
SI-1 Geographical situation within the sampling area.
Figure S1: Map of Switzerland including the location of the river water sampling stations:
river Glatt catchment (A-E); river Töss catchment (F-I) all from the AWEL monitoring
program (▲). NADUF (■) river sampling stations J) Thur; K) Rhine; L) Aare. The
agricultural area cropped with winter wheat of the total municipal area is given in percentage.
Figure S2: Map of the Canton of Zurich and the Canton of Aargau, including the location of
the river water sampling stations in the river Glatt (A-E), Töss (F-I; all from the AWEL
monitoring program (▲)), Thur (J), Rhine (K), and Aare (L; all from the NADUF monitoring
program (■)) catchments. The agricultural area cropped with silage maize of the total
agricultural area is given in percentage. (Source: Swiss Federal Statistical Office; Statistic of
the agricultural area of Switzerland for the year 2010),
Figure S3: Map of the Canton of Zurich and the Canton of Aargau, including the location of
the river water sampling stations in the river Glatt (A-E), Töss (F-I; all from the AWEL
monitoring program (▲)), Thur (J), Rhine (K), and Aare (L; all from the NADUF monitoring
program (■)) catchments. The agricultural area cropped with seed corn of the total municipal
area is given in percentage. (Source: Swiss Federal Statistical Office; Statistic of the
agricultural area of Switzerland for the year 2010)
SI-2 Analytical procedures and figures of merit.
Table S1: Ion suppressions, absolute recoveries, relative recoveries, and precisions of
mycotoxins in river water.
Table S2: Ion suppressions, absolute recoveries, relative recoveries, and precisions of
mycotoxins in waste water treatment plant effluents (WWTP effluents).
Table S3: Method detection limits [ng/L] of mycotoxins in river, and waste water.

SI-3 Concentrations for all detected mycotoxins [ng/L] at all sampling sites during the
investigation period January 2010 till end of October 2011.
Table S4: Concentrations of nivalenol [ng/L] at all sampling sites during the investigation
period from January 2010 till end of October 2011.
Table S5: Concentrations of 3-acetyl-deoxynivalenol [ng/L] at all sampling sites during the
investigation period from January 2010 till end of October 2011.
Table S6: Concentrations of beauvericin [ng/L] at all sampling sites during the investigation
period from January 2010 till end of October 2011.
SI-4 Concentration versus discharge: dilution as concentration determinant.
Figure S4: Mycotoxin concentrations depicted versus the average weekly river discharge
[m3/s] in the rivers Glatt, Töss, and the three sampled NADUF rivers (Thur, Rhine and Aare)
showing the dilution as one of the main determinant. A) Deoxynivalenol, B) Nivalenol, C) 3-
Acetyl-deoxynivalenol, and D) Beauvericin. LOD = limit of detection; LOQ = limit of
quantification.
SI-5 Occurrence of mycotoxins in all sampled river water stations from January 2010 until
November 2011.
Figure S5: Occurrence of mycotoxins in river water samples from AWEL station Aa at
Niederuster (Station A).
Figure S6: Occurrence of mycotoxins in river water samples from AWEL station Aabach at
Mönchaltorf (Station B).
Figure S7: Occurrence of mycotoxins in river water samples from AWEL station Glatt at
Fällanden (Station C).
Figure S8: Occurrence of mycotoxins in river water samples from AWEL station Glatt at
Rheinsfelden (Station E).
Figure S9: Occurrence of mycotoxins in river water samples from AWEL station Töss at
Rämismühle (Station F).
Figure S10: Occurrence of mycotoxins in river water samples from AWEL station Kempt at
Winterthur (Station G).
Figure S11: Occurrence of mycotoxins in river water samples from AWEL station Eulach at
Wülfingen (Station H).
Figure S12: Occurrence of mycotoxins in river water samples from AWEL station Töss at
Freienstein (Station I).
SI-6 Seasonal load fractions of mycotoxins.
Figure S13: Seasonal load fraction (SLF) of each mycotoxin versus the ratio of total cropped
wheat area and number of inhabitants. A) Deoxynivalenol, B) Nivalenol, C) 3-Acetyl-
deoxynivalenol, and D) Beauvericin.
Table S7: Robust linear regression analysis of cumulative mycotoxin loads over the period of
nearly two years of investigation and during summertime 2010 vs. total cropped wheat area
and population equivalents in the corresponding river catchment. The cumulative mycotoxin
loads are at log scale.
SI-7 Mycotoxin fractions emitted from agricultural areas cropped with winter wheat and
from human excretion via WWTP effluents over an investigation period from January
2010 until November 2011 in the river Glatt and Töss catchment. The width of green and
blue boxes represent winter wheat area per catchment [km2] and average water flow Q
[m3/s] as observed during the period of investigation, respectively.
Table S8: Predicted loads [g] for the whole investigation period of mycotoxins coming from
human emission via WWTP and from agricultural areas cropped with small grain cereals.
Figure S14: Surface waters of the Canton of Zurich with the river Glatt and Töss highlighted
in dark blue. Inserted bar charts show the estimated amounts from WWTP effluents (blue),
and from agricultural areas cropped with winter wheat (green). They are compared to the total
nivalenol load [g] observed (red) at each sampling station over an investigation period from
January 2010 until November 2011.
Figure S15: Surface waters of the Canton of Zurich with the river Glatt and Töss highlighted
in dark blue. Inserted bar charts show the estimated amounts from WWTP effluents (blue),
and from agricultural areas cropped with winter wheat (green). They are compared to the total
3-acetyl-deoxynivalenol load [g] observed (red) at each sampling station over an investigation
period from January 2010 until November 2011.
Figure S16: Surface waters of the Canton of Zurich with the river Glatt and Töss highlighted
in dark blue. Inserted bar charts show the estimated amounts from WWTP effluents (blue),
and from agricultural areas cropped with winter wheat (green). They are compared to the total
beauvericin load [g] observed (red) at each sampling station over an investigation period from
January 2010 until November 2011.

SI-1 Geographical situation within the sampling area.
Figure S1: Map of Switzerland including the location of the river water sampling stations: river Glatt
catchment (A-E); river Töss catchment (F-I) all from the AWEL monitoring program (▲). NADUF
(■) river sampling stations J) Thur; K) Rhine; L) Aare. The agricultural area cropped with winter
wheat of the total municipal area is given in percentage (Source: Swiss Federal Statistical Office;
Statistic of the agricultural area of Switzerland for the year 2010).
Figure S2: Map of the Canton of Zurich and the Canton of Aargau including the location of the river
water sampling stations: river Glatt catchment (A-E); river Töss catchment (F-I) all from the AWEL
monitoring program (▲). NADUF (■) river sampling stations J) Thur; K) Rhine; L) Aare. The
agricultural area cropped with silage maize of the total municipal area is given in percentage (Source:
Swiss Federal Statistical Office; Statistic of the agricultural area of Switzerland for the year 2010).
Percentage of the total agricultural area cropped with silage maize
Percentage of the total agricultural area cropped with winter wheat
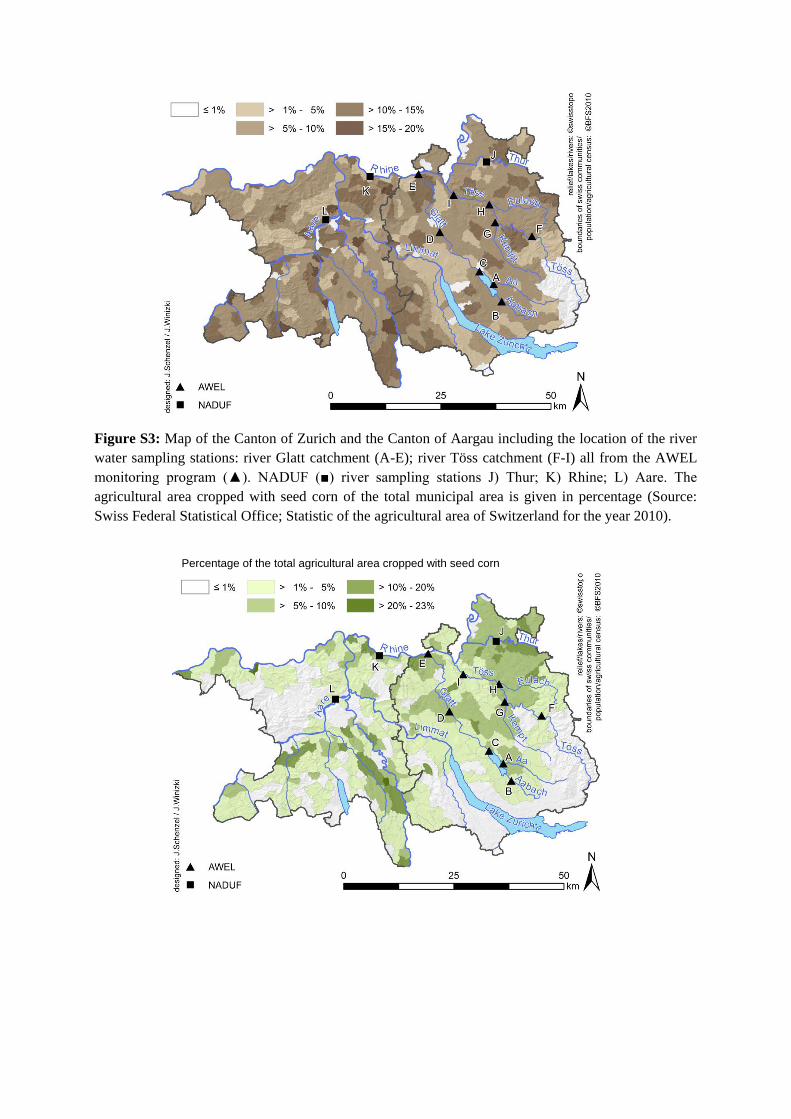
Figure S3: Map of the Canton of Zurich and the Canton of Aargau including the location of the river
water sampling stations: river Glatt catchment (A-E); river Töss catchment (F-I) all from the AWEL
monitoring program (▲). NADUF (■) river sampling stations J) Thur; K) Rhine; L) Aare. The
agricultural area cropped with seed corn of the total municipal area is given in percentage (Source:
Swiss Federal Statistical Office; Statistic of the agricultural area of Switzerland for the year 2010).
Percentage of the total agricultural area cropped with seed corn
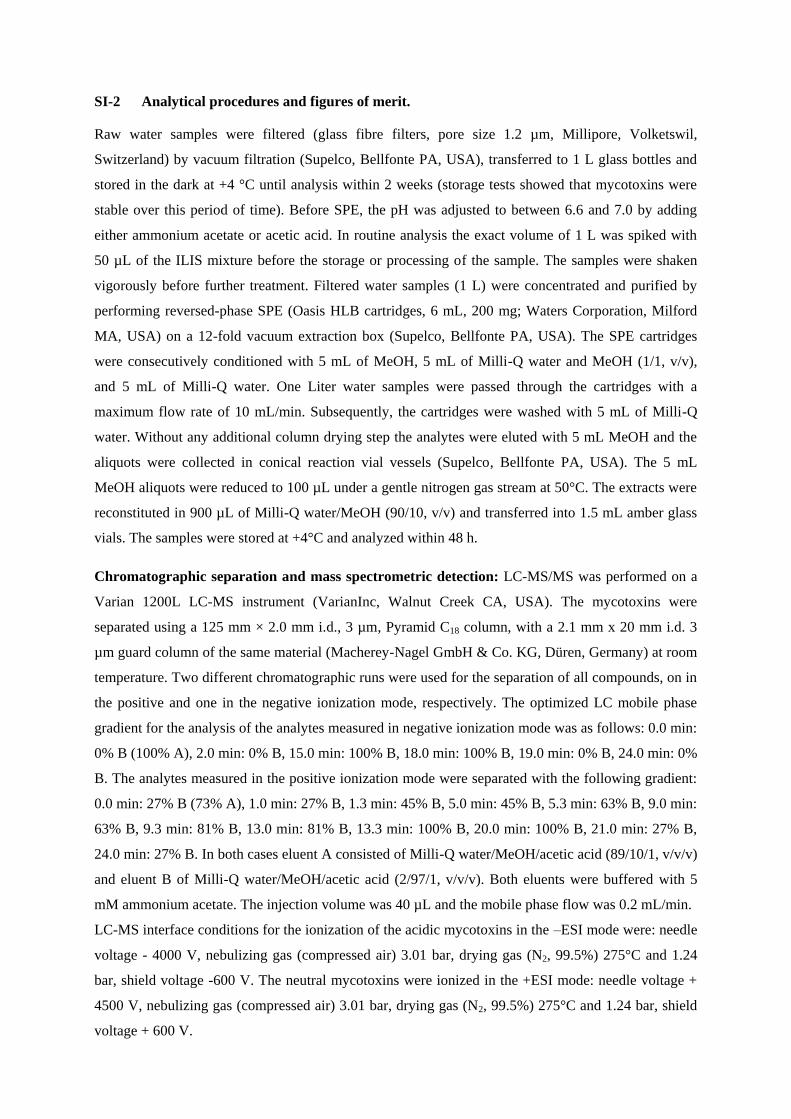
SI-2 Analytical procedures and figures of merit.
Raw water samples were filtered (glass fibre filters, pore size 1.2 µm, Millipore, Volketswil,
Switzerland) by vacuum filtration (Supelco, Bellfonte PA, USA), transferred to 1 L glass bottles and
stored in the dark at +4 °C until analysis within 2 weeks (storage tests showed that mycotoxins were
stable over this period of time). Before SPE, the pH was adjusted to between 6.6 and 7.0 by adding
either ammonium acetate or acetic acid. In routine analysis the exact volume of 1 L was spiked with
50 µL of the ILIS mixture before the storage or processing of the sample. The samples were shaken
vigorously before further treatment. Filtered water samples (1 L) were concentrated and purified by
performing reversed-phase SPE (Oasis HLB cartridges, 6 mL, 200 mg; Waters Corporation, Milford
MA, USA) on a 12-fold vacuum extraction box (Supelco, Bellfonte PA, USA). The SPE cartridges
were consecutively conditioned with 5 mL of MeOH, 5 mL of Milli-Q water and MeOH (1/1, v/v),
and 5 mL of Milli-Q water. One Liter water samples were passed through the cartridges with a
maximum flow rate of 10 mL/min. Subsequently, the cartridges were washed with 5 mL of Milli-Q
water. Without any additional column drying step the analytes were eluted with 5 mL MeOH and the
aliquots were collected in conical reaction vial vessels (Supelco, Bellfonte PA, USA). The 5 mL
MeOH aliquots were reduced to 100 µL under a gentle nitrogen gas stream at 50°C. The extracts were
reconstituted in 900 µL of Milli-Q water/MeOH (90/10, v/v) and transferred into 1.5 mL amber glass
vials. The samples were stored at +4°C and analyzed within 48 h.
Chromatographic separation and mass spectrometric detection: LC-MS/MS was performed on a
Varian 1200L LC-MS instrument (VarianInc, Walnut Creek CA, USA). The mycotoxins were
separated using a 125 mm × 2.0 mm i.d., 3 µm, Pyramid C18 column, with a 2.1 mm x 20 mm i.d. 3
µm guard column of the same material (Macherey-Nagel GmbH & Co. KG, Düren, Germany) at room
temperature. Two different chromatographic runs were used for the separation of all compounds, on in
the positive and one in the negative ionization mode, respectively. The optimized LC mobile phase
gradient for the analysis of the analytes measured in negative ionization mode was as follows: 0.0 min:
0% B (100% A), 2.0 min: 0% B, 15.0 min: 100% B, 18.0 min: 100% B, 19.0 min: 0% B, 24.0 min: 0%
B. The analytes measured in the positive ionization mode were separated with the following gradient:
0.0 min: 27% B (73% A), 1.0 min: 27% B, 1.3 min: 45% B, 5.0 min: 45% B, 5.3 min: 63% B, 9.0 min:
63% B, 9.3 min: 81% B, 13.0 min: 81% B, 13.3 min: 100% B, 20.0 min: 100% B, 21.0 min: 27% B,
24.0 min: 27% B. In both cases eluent A consisted of Milli-Q water/MeOH/acetic acid (89/10/1, v/v/v)
and eluent B of Milli-Q water/MeOH/acetic acid (2/97/1, v/v/v). Both eluents were buffered with 5
mM ammonium acetate. The injection volume was 40 µL and the mobile phase flow was 0.2 mL/min.
LC-MS interface conditions for the ionization of the acidic mycotoxins in the –ESI mode were: needle
voltage - 4000 V, nebulizing gas (compressed air) 3.01 bar, drying gas (N2, 99.5%) 275°C and 1.24
bar, shield voltage -600 V. The neutral mycotoxins were ionized in the +ESI mode: needle voltage +
4500 V, nebulizing gas (compressed air) 3.01 bar, drying gas (N2, 99.5%) 275°C and 1.24 bar, shield
voltage + 600 V.

Table S1: Ion suppressions, relative recoveriesª, absolute recoveries a, and precision of mycotoxins in
river water.
Compound Ion suppression
[%]
Concentration
level [ng/L]
Relative Recoveries
[%]
Absolute Recoveries
[%] Precision [%]
5 n.a. n.a.
3-Acetyl-DON -10 25 76 (7) 75 (7) 7
100 87 (7) 77 (6)
5 100 (6) 71 (7)
Deoxynivalenol -8 25 109 (2) 91 (4) 6
100 106 (3) 104 (3)
5 n.a.
Nivalenol 39 25 22 (2) 7
100 21 (2)
5 56 (8)
Beauvericin -19 25 73 (11) 1
100 44 (8)
n.a. not available due to higher method detection limit; a Absolute standard deviation (five replicates) in parenthesis
Table S2: Ion suppressions, relative recoveriesª, absolute recoveries a, and precision of mycotoxins in
waste water treatment plant effluent.
Compound Ion suppression
[%]
Concentration
level [ng/L]
Relative Recoveries
[%]
Absolute Recoveries
[%] Precision [%]
5 n.a. n.a.
3-Acetyl-DON -42 25 104 (7) 79 (7) 9
100 94 (5) 85 (2)
5 106 (12) 33 (8)
Deoxynivalenol -61 25 105 (5) 69 (7) 10
100 96 (6) 72 (3)
5 n.a.
Nivalenol -28 25 20 (1) 6
100 11 (0)
5 76 (6)
Beauvericin 18 25 77 (4) 7
100 104 (8)
n.a. not available due to higher method detection limit; a Absolute standard deviation (five replicates) in parenthesis
Table S3: Method detection limit [ng/L]ª of mycotoxins in river water and waste
water treatment plant effluent (WWTP).
Compound MDL river water MDL WWTP effluent
3-Acetyl-Deoxynivalenol 6.1b 6.0b
Deoxynivalenol 1.3 1.2
Nivalenol 1.5b 1.6b
Beauvericin 1.3 3.4
a Three times the absolute standard deviation at 5 ng/L; b Three times the absolute standard
deviation at 25 ng/L.

SI-3 Concentrations for all detected mycotoxins [ng/L] at all sampling sites during the investigation period January 2010 till end of October 2011.
Table S4: Concentrations of nivalenol [ng/L] in the weekly and fortnightly collected flow-proportional surface water
samples from the AWEL and NADUF sampling sites from January 2010 to November 2011.
River location detected/#
samples
analyzed
min
concentration
[ng/L]c
max
concentration
[ng/L]c
median
concentration
[ng/L]c
cumulative NIV
load [kg]d
SLFe [%]
River Glatta
Aa at Niederuster (A) 41/95 1.5 f 15.8 5.6 0.4 74 ± 7
Aabach at Mönchaltorf (B) 51/95 1.5 f 20.1 6.4 0.2 74 ± 8
Glatt at Fällanden (C) 21/95 1.5 f 11.8 5.7 0.4 63 ± 4
Glatt at Oberglatt (D) 51/95 1.5 f 17.2 5.9 1.1 74 ± 7
Glatt at Rheinsfelden (E) 57/95 1.5 f 16.8 5.9 1.2 71 ± 7
River Tössa
Töss at Rämismühle (F) 14/95 1.5 f 8.8 1.5 0.1 80 ± 2
Kempt at Winterthur (G) 37/95 1.5 f 24.1 3.4 0.1 72 ± 4
Eulach at Wülflingen (H) 45/95 1.5 f 15.1 5.2 0.1 83 ± 5
Töss at Freienstein (I) 42/95 1.5 f 13.8 3.2 0.6 60 ± 4
Larger Rivers in the Swiss Midlandsb
Thur at Andelfingen (J) 23/78 1.5 f 16.0 6.4 4.7 91 ± 3
Rhine at Rekingen (K) 4/73 1.5 f 10.5 7.6 13.6 63 ± 1
Aare at Brugg (L) 4/48 1.5 f 8.0 2.8 2.5 85 ± 1
amonitoring network: AWEL (Office for waste, water, energy and air, Canton Zurich, Switzerland); bmonitoring network:
NADUF (National River Monitoring and Survey Program); Letter in parenthesis indicate abbreviations in Figure 1. cout of
detected samples. d cumulative loads were obtained by a simple addition of all quantified loads which were detected after 22
months. e SLF: seasonal load fraction, sum of the NIV loads detected in summer and autumn at each specific station ± uncertainty
obtained by an error propagation based on the analytical method precision.10
f above LOD of 1.5 ng/L, but below LOQ of 4.5
ng/L.
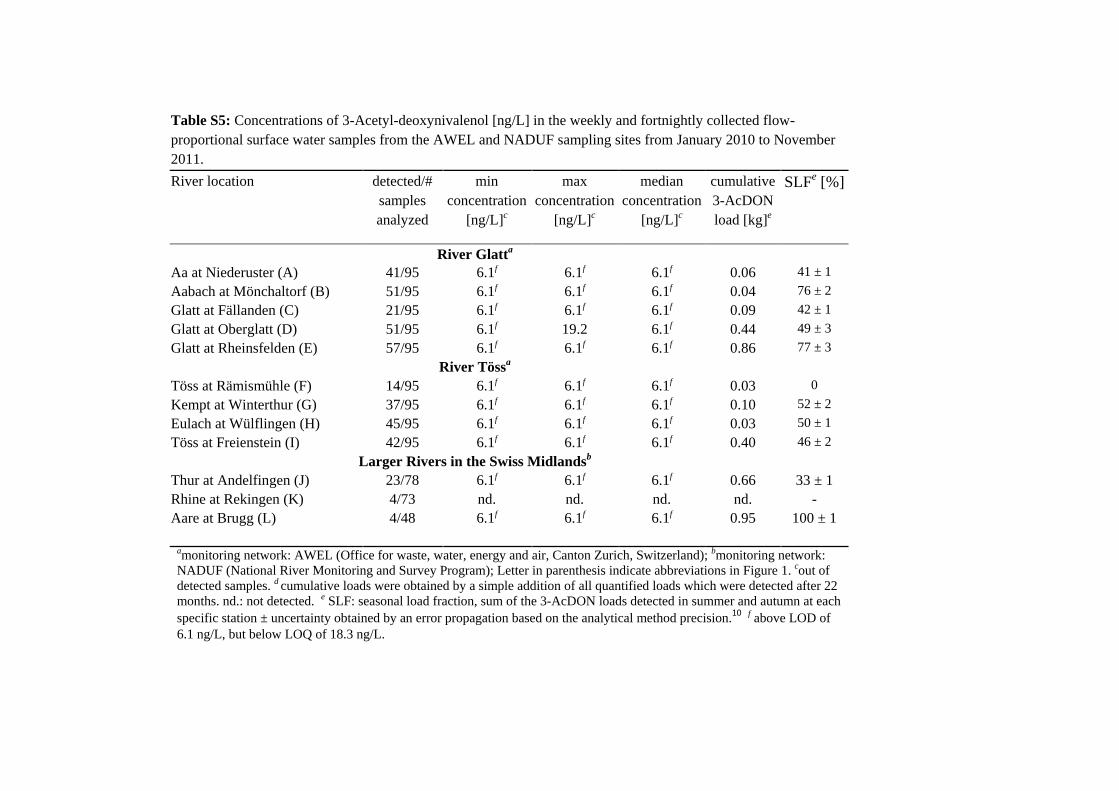
Table S5: Concentrations of 3-Acetyl-deoxynivalenol [ng/L] in the weekly and fortnightly collected flow-
proportional surface water samples from the AWEL and NADUF sampling sites from January 2010 to November
2011.
River location detected/#
samples
analyzed
min
concentration
[ng/L]c
max
concentration
[ng/L]c
median
concentration
[ng/L]c
cumulative
3-AcDON
load [kg]e
SLFe [%]
River Glatta
Aa at Niederuster (A) 41/95 6.1f 6.1f 6.1f 0.06 41 ± 1
Aabach at Mönchaltorf (B) 51/95 6.1f 6.1f 6.1f 0.04 76 ± 2
Glatt at Fällanden (C) 21/95 6.1f 6.1f 6.1f 0.09 42 ± 1
Glatt at Oberglatt (D) 51/95 6.1f 19.2 6.1f 0.44 49 ± 3
Glatt at Rheinsfelden (E) 57/95 6.1f 6.1f 6.1f 0.86 77 ± 3
River Tössa
Töss at Rämismühle (F) 14/95 6.1f 6.1f 6.1f 0.03 0
Kempt at Winterthur (G) 37/95 6.1f 6.1f 6.1f 0.10 52 ± 2
Eulach at Wülflingen (H) 45/95 6.1f 6.1f 6.1f 0.03 50 ± 1
Töss at Freienstein (I) 42/95 6.1f 6.1f 6.1f 0.40 46 ± 2
Larger Rivers in the Swiss Midlandsb
Thur at Andelfingen (J) 23/78 6.1f 6.1f 6.1f 0.66 33 ± 1
Rhine at Rekingen (K) 4/73 nd. nd. nd. nd. -
Aare at Brugg (L) 4/48 6.1f 6.1f 6.1f 0.95 100 ± 1
amonitoring network: AWEL (Office for waste, water, energy and air, Canton Zurich, Switzerland); bmonitoring network:
NADUF (National River Monitoring and Survey Program); Letter in parenthesis indicate abbreviations in Figure 1. cout of
detected samples. d cumulative loads were obtained by a simple addition of all quantified loads which were detected after 22
months. nd.: not detected. e SLF: seasonal load fraction, sum of the 3-AcDON loads detected in summer and autumn at each
specific station ± uncertainty obtained by an error propagation based on the analytical method precision.10
f above LOD of
6.1 ng/L, but below LOQ of 18.3 ng/L.

Table S6: Concentrations of beauvericin [ng/L] in the weekly and fortnightly collected flow-proportional surface water
samples from the AWEL and NADUF sampling sites from January 2010 to November 2011.
River location detected/#
samples
analyzed
min
concentration
[ng/L]c
max
concentration
[ng/L]c
median
concentration
[ng/L]c
cumulative
BEA load [kg]e
SLFe [%]
River Glatta
Aa at Niederuster (A) 41/95 1.3f 10.5 1.3f 0.03 33 ± 1
Aabach at Mönchaltorf (B) 51/95 1.3f 22.0 1.3f 0.03 23 ± 2
Glatt at Fällanden (C) 21/95 1.3f 1.3f 1.3f 0.03 51 ± 2
Glatt at Oberglatt (D) 51/95 1.3f 20.7 1.3f 0.13 10 ± 2
Glatt at Rheinsfelden (E) 57/95 1.3f 17.3 1.3f 0.24 12 ± 2
River Tössa
Töss at Rämismühle (F) 14/95 1.3f 18.0 1.3f 0.07 17 ± 2
Kempt at Winterthur (G) 37/95 1.3f 7.0 1.3f 0.03 25 ± 2
Eulach at Wülflingen (H) 45/95 1.3f 5.3 1.3f 0.01 8 ± 1
Töss at Freienstein (I) 42/95 1.3f 4.8 1.3f 0.09 16 ± 2
Larger Rivers in the Swiss Midlandsb
Thur at Andelfingen (J) 23/78 1.3f 5.5 1.3f 0.22 90 ± 1
Rhine at Rekingen (K) 4/73 nd. nd. nd. nd. -
Aare at Brugg (L) 4/48 1.3f 12.4 4.6 4.39 24 ± 1
amonitoring network: AWEL (Office for waste, water, energy and air, Canton Zurich, Switzerland); bmonitoring network: NADUF
(National River Monitoring and Survey Program); Letter in parenthesis indicate abbreviations in Figure 1. cout of detected samples. d cumulative loads were obtained by a simple addition of all quantified loads which were detected after 22 months. nd.: not detected. e SLF: seasonal load fraction, sum of the BEA loads detected in summer and autumn at each specific station ± uncertainty obtained
by an error propagation based on the analytical method precision.10
f above LOD of 1.3 ng/L, but below LOQ of 3.9 ng/L.
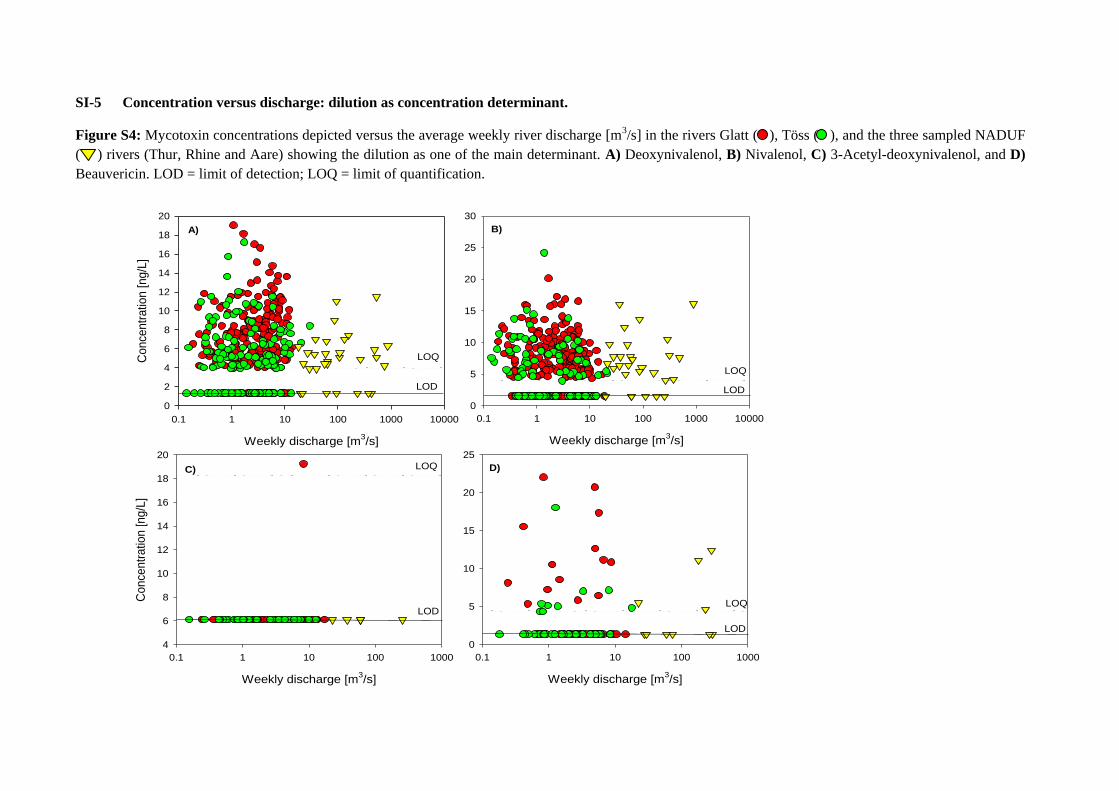
SI-5 Concentration versus discharge: dilution as concentration determinant.
Figure S4: Mycotoxin concentrations depicted versus the average weekly river discharge [m3/s] in the rivers Glatt ( ), Töss ( ), and the three sampled NADUF
( ) rivers (Thur, Rhine and Aare) showing the dilution as one of the main determinant. A) Deoxynivalenol, B) Nivalenol, C) 3-Acetyl-deoxynivalenol, and D)
Beauvericin. LOD = limit of detection; LOQ = limit of quantification.
Weekly discharge [m3/s]
0.1 1 10 100 1000 10000
Co
nce
ntr
atio
n [
ng/L
]
0
2
4
6
8
10
12
14
16
18
20
Weekly discharge [m3/s]
0.1 1 10 100 1000 10000
0
5
10
15
20
25
30
Weekly discharge [m3/s]
0.1 1 10 100 1000
Co
nce
ntr
atio
n [
ng/L
]
4
6
8
10
12
14
16
18
20
Weekly discharge [m3/s]
0.1 1 10 100 1000
0
5
10
15
20
25
A) B)
C) D)
LOD
LOQ
LOD
LOQ
LOD
LOQLOD
LOQ

SI-6 Occurrence of mycotoxins in all sampled river water stations from January 2010 until
November 2011.
Figure S5: Occurrence of mycotoxins [ng/L] in river water samples from AWEL station Aa at
Niederuster (Station A). Left axis (A) 3-acetyl-deoxynivalenol [ng/L]; (B) nivalenol [ng/L]; (C)
deoxynivalenol [ng/L]; (D) beauvericin [ng/L]; (E) weekly river water discharge [m3/s]. The colored
stripes indicate the seasons: spring: green; summer: red; autumn: yellow; winter: white. LOD: limit of
detection; points under LOD-level: not detected. Note that on the right axis of the graph for panel B,
C, and D the corresponding loads [g] are given.
Aa at Niederuster (A)
0
20
40
60
80
0
2
4
6
8
10
0
100
200
300
400
0
5
10
15
20
0
100
200
300
400
500
0
5
10
15
20
0
5
10
15
20
25
30
35
0
5
10
15
20
1.01.10 1.05.10 1.09.10 1.01.11 1.05.11 1.09.11
0.5
1.5
2.5
3.5
4.5
3-A
ce
tyl-
de
oxyn
iva
len
ol
Niv
ale
no
lD
eo
xyn
iva
len
ol
Be
au
ve
ricin
Weekly
dis
charg
e
[m
3/s
]
Myco
toxin
co
ncen
trati
on
[n
g/L
] Cu
mu
lativ
e m
yco
toxin
load
[g]
A)
B)
C)
D)
E)
LOD
LOD
LOD
LOD
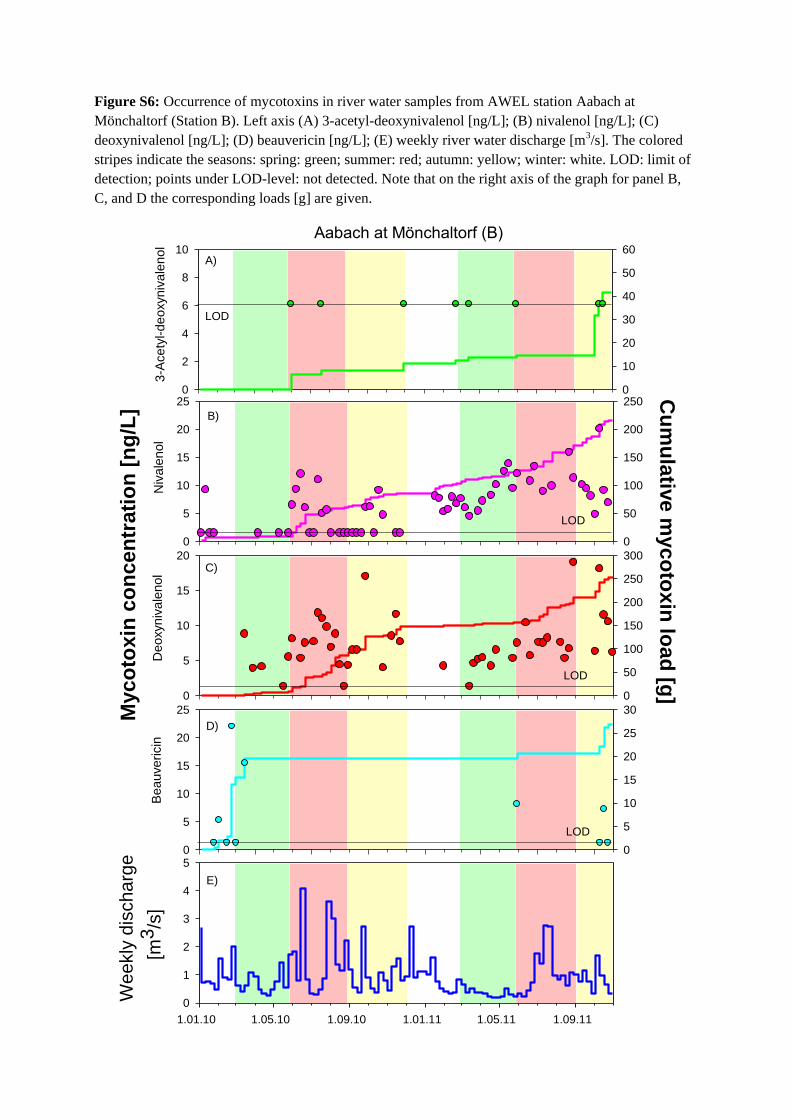
Figure S6: Occurrence of mycotoxins in river water samples from AWEL station Aabach at
Mönchaltorf (Station B). Left axis (A) 3-acetyl-deoxynivalenol [ng/L]; (B) nivalenol [ng/L]; (C)
deoxynivalenol [ng/L]; (D) beauvericin [ng/L]; (E) weekly river water discharge [m3/s]. The colored
stripes indicate the seasons: spring: green; summer: red; autumn: yellow; winter: white. LOD: limit of
detection; points under LOD-level: not detected. Note that on the right axis of the graph for panel B,
C, and D the corresponding loads [g] are given.
Aabach at Mönchaltorf (B)
0
10
20
30
40
50
60
0
2
4
6
8
10
0
50
100
150
200
250
0
5
10
15
20
25
0
50
100
150
200
250
300
0
5
10
15
20
0
5
10
15
20
25
30
0
5
10
15
20
25
1.01.10 1.05.10 1.09.10 1.01.11 1.05.11 1.09.11
0
1
2
3
4
5
3-A
ce
tyl-
de
oxyn
iva
len
ol
Niv
ale
no
lD
eo
xyn
iva
len
ol
Be
au
ve
ricin
Weekly
dis
charg
e
[m3/s
]
Myco
toxin
co
ncen
trati
on
[n
g/L
]C
um
ula
tive m
yco
toxin
load
[g]
A)
B)
C)
D)
E)
LOD
LOD
LOD
LOD
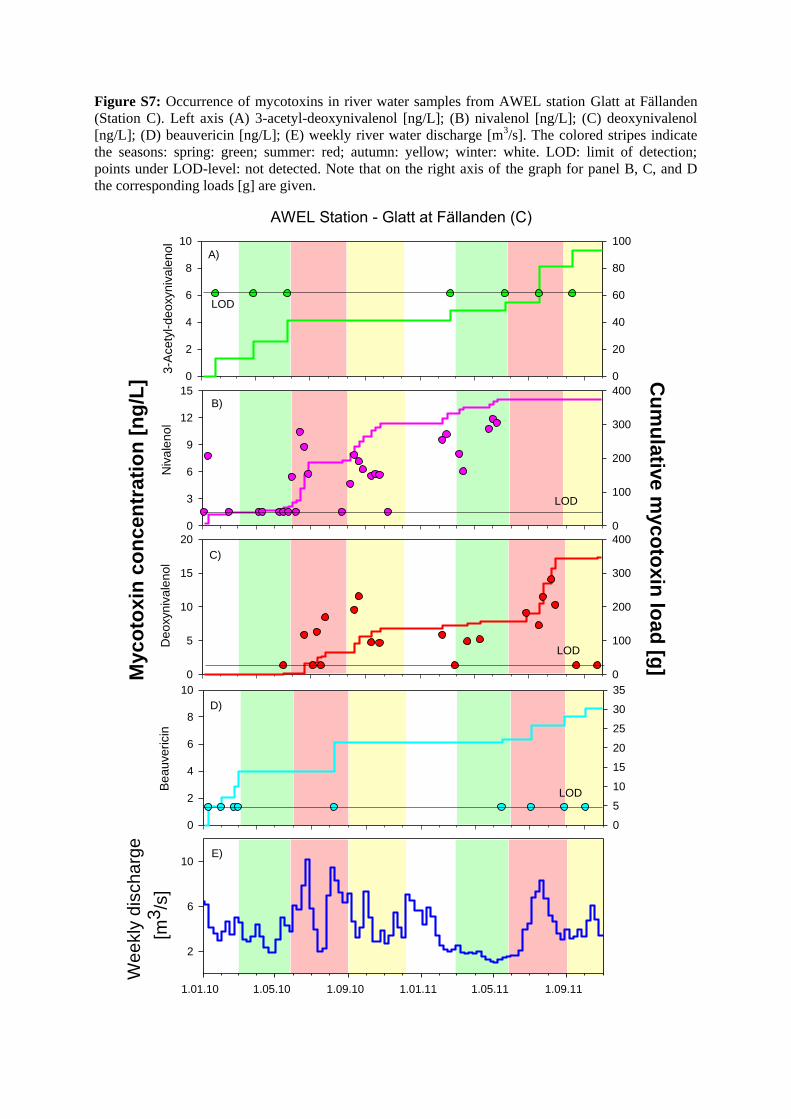
Figure S7: Occurrence of mycotoxins in river water samples from AWEL station Glatt at Fällanden
(Station C). Left axis (A) 3-acetyl-deoxynivalenol [ng/L]; (B) nivalenol [ng/L]; (C) deoxynivalenol
[ng/L]; (D) beauvericin [ng/L]; (E) weekly river water discharge [m3/s]. The colored stripes indicate
the seasons: spring: green; summer: red; autumn: yellow; winter: white. LOD: limit of detection;
points under LOD-level: not detected. Note that on the right axis of the graph for panel B, C, and D
the corresponding loads [g] are given.
AWEL Station - Glatt at Fällanden (C)
0
20
40
60
80
100
0
2
4
6
8
10
0
100
200
300
400
0
3
6
9
12
15
0
100
200
300
400
0
5
10
15
20
0
5
10
15
20
25
30
35
0
2
4
6
8
10
3-A
ce
tyl-
de
oxyn
iva
len
ol
Niv
ale
no
lD
eo
xyn
iva
len
ol
Be
au
ve
ricin
Myc
oto
xin
co
nc
en
tra
tio
n [
ng
/L] C
um
ula
tive
myc
oto
xin
loa
d [g
]
A)
B)
C)
D)
LOD
LOD
LOD
LOD
E)
1.01.10 1.05.10 1.09.10 1.01.11 1.05.11 1.09.11
We
ekly
dis
ch
arg
e
[m3/s
]
2
6
10

Figure S8: Occurrence of mycotoxins in river water samples from AWEL station Glatt at
Rheinsfelden (Station E). Left axis (A) 3-acetyl-deoxynivalenol [ng/L]; (B) nivalenol [ng/L]; (C)
deoxynivalenol [ng/L]; (D) beauvericin [ng/L]; (E) weekly river water discharge [m3/s]. The colored
stripes indicate the seasons: spring: green; summer: red; autumn: yellow; winter: white. LOD: limit of
detection; points under LOD-level: not detected. Note that on the right axis of the graph for panel B,
C, and D the corresponding loads [g] are given.
Glatt at Rheinsfelden (E)
0
200
400
600
800
1000
0
2
4
6
8
10
0
200
400
600
800
1000
1200
0
5
10
15
20
0
250
500
750
1000
1250
1500
0
5
10
15
20
0
100
200
300
0
5
10
15
20
1.01.10 1.05.10 1.09.10 1.01.11 1.05.11 1.09.11
0
5
10
15
20
3-A
cety
l-de
oxyniv
ale
nol
Niv
ale
nol
Deoxyniv
ale
nol
Bea
uveri
cin
Weekly
dis
charg
e
[m
3/s
]
Myco
toxin
co
ncen
trati
on
[n
g/L
]C
um
ula
tive m
yco
toxin
load
[g]
A)
B)
C)
D)
E)
LOD
LOD
LOD
LOD

Figure S9: Occurrence of mycotoxins in river water samples from AWEL station Töss at Rämismühle
(Station F): Left axis (A) 3-acetyl-deoxynivalenol [ng/L]; (B) nivalenol [ng/L]; (C) deoxynivalenol
[ng/L]; (D) beauvericin [ng/L]; (E) weekly river water discharge [m3/s]. The colored stripes indicate
the seasons: spring: green; summer: red; autumn: yellow; winter: white. LOD: limit of detection;
points under LOD-level: not detected. Note that on the right axis of the graph for panel B, C, and D
the corresponding loads [g] are given.
Töss at Rämismühle (F)
0
10
20
30
0
2
4
6
8
10
0
50
100
150
0
2
4
6
8
10
0
50
100
150
0
2
4
6
8
10
12
0
10
20
30
40
50
60
70
0
5
10
15
20
1.01.10 1.05.10 1.09.10 1.01.11 1.05.11 1.09.11
2
6
10
14
3-A
ce
tyl-
de
oxyn
iva
len
ol
Niv
ale
no
lD
eo
xyn
iva
len
ol
Be
au
ve
ricin
We
ekly
dis
ch
arg
e
[m
3/s
]
Myco
tox
in c
on
ce
ntr
ati
on
[n
g/L
]
Cu
mu
lativ
e m
yc
oto
xin
load
[g]
A)
B)
C)
D)
E)
LOD
LOD
LOD
LOD

Figure S10: Occurrence of mycotoxins in river water samples from AWEL station Kempt at
Winterthur (Station G): Left axis (A) 3-acetyl-deoxynivalenol [ng/L]; (B) nivalenol [ng/L]; (C)
deoxynivalenol [ng/L]; (D) beauvericin [ng/L]; (E) weekly river water discharge [m3/s]. The colored
stripes indicate the seasons: spring: green; summer: red; autumn: yellow; winter: white. LOD: limit of
detection; points under LOD-level: not detected. Note that on the right axis of the graph for panel B,
C, and D the corresponding loads [g] are given.
Kempt at Winterthur (G)
0
20
40
60
80
100
120
0
2
4
6
8
10
0
50
100
150
0
10
20
30
0
50
100
150
200
250
0
5
10
15
20
0
10
20
30
0
2
4
6
8
10
1.01.10 1.05.10 1.09.10 1.01.11 1.05.11 1.09.11
0
2
4
6
8
3-A
ce
tyl-
de
oxyn
iva
len
ol
Niv
ale
no
lD
eo
xyn
iva
len
ol
Be
au
ve
ricin
Weekly
dis
charg
e
[m
3/s
]
Myco
toxin
co
ncen
trati
on
[n
g/L
] Cu
mu
lativ
e m
yco
toxin
load
[g]
A)
B)
C)
D)
E)
LOD
LOD
LOD
LOD

Figure S11: Occurrence of mycotoxins in river water samples from AWEL station Eulach at
Wülfingen (Station H): Left axis (A) 3-acetyl-deoxynivalenol [ng/L]; (B) nivalenol [ng/L]; (C)
deoxynivalenol [ng/L]; (D) beauvericin [ng/L]; (E) weekly river water discharge [m3/s]. The colored
stripes indicate the seasons: spring: green; summer: red; autumn: yellow; winter: white. LOD: limit of
detection; points under LOD-level: not detected. Note that on the right axis of the graph for panel B,
C, and D the corresponding loads [g] are given.
Eulach at Wülfingen (H)
0
10
20
30
40
0
2
4
6
8
10
0
20
40
60
80
100
0
5
10
15
20
0
50
100
150
0
5
10
15
20
0
2
4
6
0
2
4
6
1.01.10 1.05.10 1.09.10 1.01.11 1.05.11 1.09.11
0
1
2
3
4
5
3-A
cety
l-deoxyniv
ale
nol
Niv
ale
nol
Deoxyniv
ale
nol
Beauvericin
We
ekly
dis
ch
arg
e
[m
3/s
]
Myco
toxin
co
ncen
tra
tio
n [
ng
/L] C
um
ula
tive m
yco
toxin
loa
d [g
]
A)
B)
C)
D)
E)
LOD
LOD
LOD
LOD
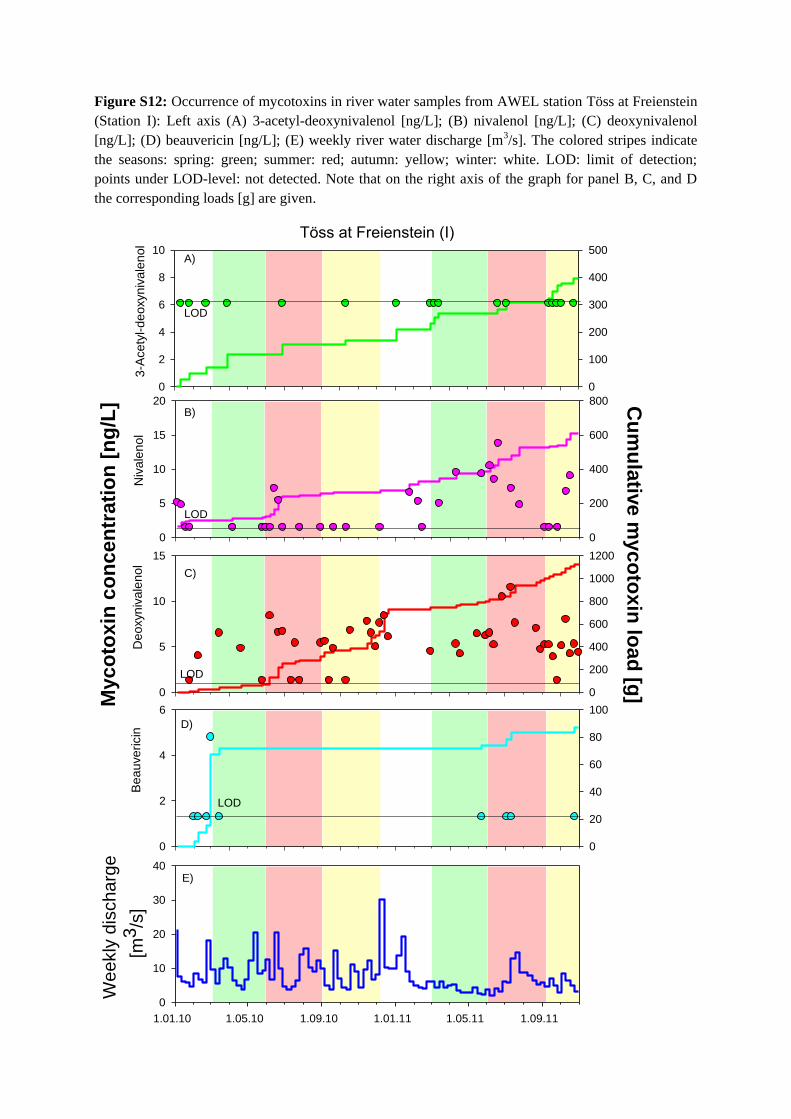
Figure S12: Occurrence of mycotoxins in river water samples from AWEL station Töss at Freienstein
(Station I): Left axis (A) 3-acetyl-deoxynivalenol [ng/L]; (B) nivalenol [ng/L]; (C) deoxynivalenol
[ng/L]; (D) beauvericin [ng/L]; (E) weekly river water discharge [m3/s]. The colored stripes indicate
the seasons: spring: green; summer: red; autumn: yellow; winter: white. LOD: limit of detection;
points under LOD-level: not detected. Note that on the right axis of the graph for panel B, C, and D
the corresponding loads [g] are given.
Töss at Freienstein (I)
0
100
200
300
400
500
0
2
4
6
8
10
0
200
400
600
800
0
5
10
15
20
0
200
400
600
800
1000
1200
0
5
10
15
0
20
40
60
80
100
0
2
4
6
1.01.10 1.05.10 1.09.10 1.01.11 1.05.11 1.09.11
0
10
20
30
40
3-A
ce
tyl-
de
oxyn
iva
len
ol
Niv
ale
no
lD
eo
xyn
iva
len
ol
Be
au
ve
ricin
Weekly
dis
charg
e
[m3/s
]
Myc
oto
xin
co
nc
en
tra
tio
n [
ng
/L] C
um
ula
tive
myc
oto
xin
loa
d [g
]
A)
B)
C)
D)
E)
LOD
LOD
LOD
LOD
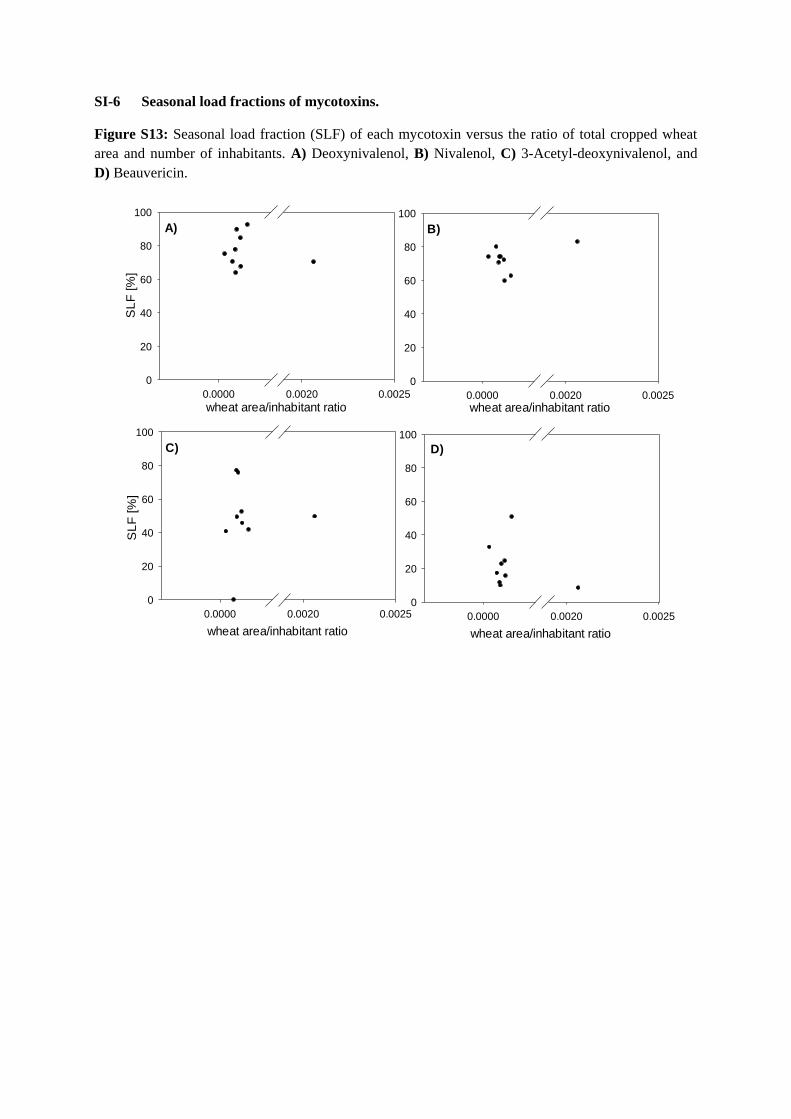
SI-6 Seasonal load fractions of mycotoxins.
Figure S13: Seasonal load fraction (SLF) of each mycotoxin versus the ratio of total cropped wheat
area and number of inhabitants. A) Deoxynivalenol, B) Nivalenol, C) 3-Acetyl-deoxynivalenol, and
D) Beauvericin.
wheat area/inhabitant ratio0.0000 0.0020 0.0025
SL
F [%
]
0
20
40
60
80
100
wheat area/inhabitant ratio0.0000 0.0020 0.0025
0
20
40
60
80
100
wheat area/inhabitant ratio
0.0000 0.0020 0.0025
SL
F [%
]
0
20
40
60
80
100
A) B)
C)
wheat area/inhabitant ratio
0.0000 0.0020 0.0025
0
20
40
60
80
100
D)
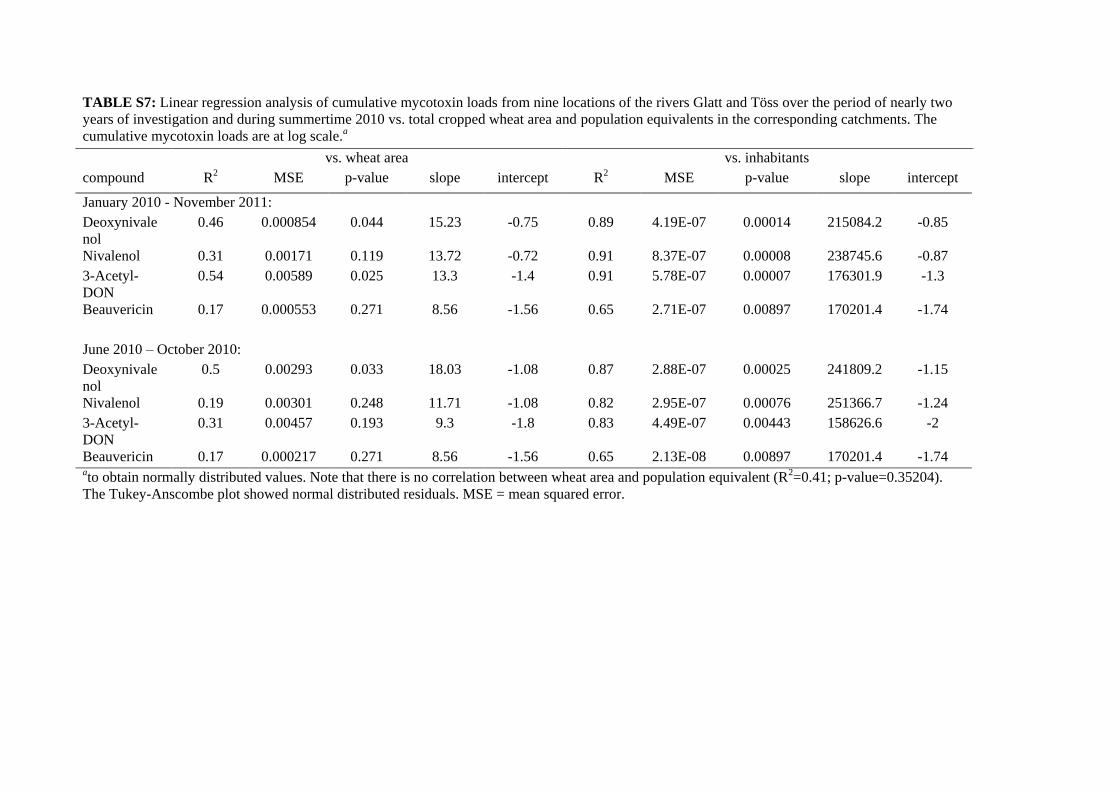
TABLE S7: Linear regression analysis of cumulative mycotoxin loads from nine locations of the rivers Glatt and Töss over the period of nearly two
years of investigation and during summertime 2010 vs. total cropped wheat area and population equivalents in the corresponding catchments. The
cumulative mycotoxin loads are at log scale.a
vs. wheat area vs. inhabitants
compound R2 MSE p-value slope intercept R2 MSE p-value slope intercept
January 2010 - November 2011:
Deoxynivale
nol
0.46 0.000854 0.044 15.23 -0.75 0.89 4.19E-07 0.00014 215084.2 -0.85
Nivalenol 0.31 0.00171 0.119 13.72 -0.72 0.91 8.37E-07 0.00008 238745.6 -0.87
3-Acetyl-
DON
0.54 0.00589 0.025 13.3 -1.4 0.91 5.78E-07 0.00007 176301.9 -1.3
Beauvericin 0.17 0.000553 0.271 8.56 -1.56 0.65 2.71E-07 0.00897 170201.4 -1.74
June 2010 – October 2010:
Deoxynivale
nol
0.5 0.00293 0.033 18.03 -1.08 0.87 2.88E-07 0.00025 241809.2 -1.15
Nivalenol 0.19 0.00301 0.248 11.71 -1.08 0.82 2.95E-07 0.00076 251366.7 -1.24
3-Acetyl-
DON
0.31 0.00457 0.193 9.3 -1.8 0.83 4.49E-07 0.00443 158626.6 -2
Beauvericin 0.17 0.000217 0.271 8.56 -1.56 0.65 2.13E-08 0.00897 170201.4 -1.74 ato obtain normally distributed values. Note that there is no correlation between wheat area and population equivalent (R2=0.41; p-value=0.35204).
The Tukey-Anscombe plot showed normal distributed residuals. MSE = mean squared error.

SI-7 Estimated mycotoxin fractions emitted from agricultural areas cropped with winter wheat and from human excretion via WWTP effluents over
an investigation period from January 2010 until November 2011 in the river Glatt and Töss catchment. The width of green and blue boxes represent
winter wheat area per catchment [km2] and average water flow Q [m
3/s] as observed during the period of investigation, respectively.
Table S8: Predicted loads [g] over the whole investigation period of mycotoxins coming from human emission via WWTP and from agricultural areas
cropped with small grain cereals.
total loads [g] WWTP agriculture
DON NIV 3-Ac-DON BEA DON NIV 3-Ac-DON BEA
Glatt catchment
Aabach at Mönchaltorf
(A)
123 ± 47 32 ± 39 51 ± 27
250%
9 ± 1 177 ± 309 106 ± 164 30 ± 27 -
Aa at Niederuster (B) 587 ± 223 154 ± 188 242 ± 128 14 ± 6 282 ± 491 141 ± 217 21 ± 19 -
Glatt at Fällanden (C) 251 ± 96 66 ± 81 104 ± 55 18 ± 3 0.6 ± 0.9 0.4 ± 0.6 0.05 ± 0.04 - Glatt at Oberglatt (D) 839 ± 319 220 ± 268 346 ± 183 60 ± 8 567 ± 986 396 ± 611 84 ± 75 -
Glatt at Rheinsfelden (E) 1366 ± 519 358 ± 437 564 ± 299 98 ± 14 1735 ± 3020 720 ± 1108 154 ± 138 -
Töss catchment
Töss at Rämismühle (F) 79 ± 30 21 ± 26 33 ± 17 6 ± 1 84 ± 146 79 ± 122 9 ± 8 -
Kempt at Winterthur (G) 202 ± 77 53 ± 65 83 ± 44 14 ± 2 168 ± 293 144 ± 222 17 ± 15 -
Eulach at Wülfingen (H) 53 ± 20 14 ± 17 22 ± 12 4 ± 1 409 ± 711 170 ± 261 44 ± 39 -
Töss at Freienstein (I) 1505 ± 572 394 ± 481 621 ± 329 108 ± 15 1231 ± 2143 585 ± 900 231 ± 207 -

Figure S14: Surface waters of the Canton of Zurich with the river Glatt and Töss highlighted in
dark blue. Inserted bar charts show the estimated amounts from WWTP effluents (blue),
and from agricultural areas cropped with winter wheat (green). They are compared to the
total nivalenol load [g] observed (red) at each sampling station over an investigation period
from January 2010 until November 2011.
E
D
C
B
A
I
H
G
F
Aa Niederuster (A)
0
100
200
300
400
Aabach Mönchaltorf (B)
0
50
100
150
200
250
300
Glatt Fällanden (C)
0
100
200
300
400
Glatt Oberglatt (D)
0
200
400
600
800
1000
1200
Glatt Rheinsfelden (E)
0
500
1000
1500
2000
Töss Rämismühle (F)
0
50
100
150
200
Kempt Winterthur (G)
0
100
200
300
400
Eulach Wülfingen (H)
0
100
200
300
400
Töss Freienstein (I)
0
500
1000
1500
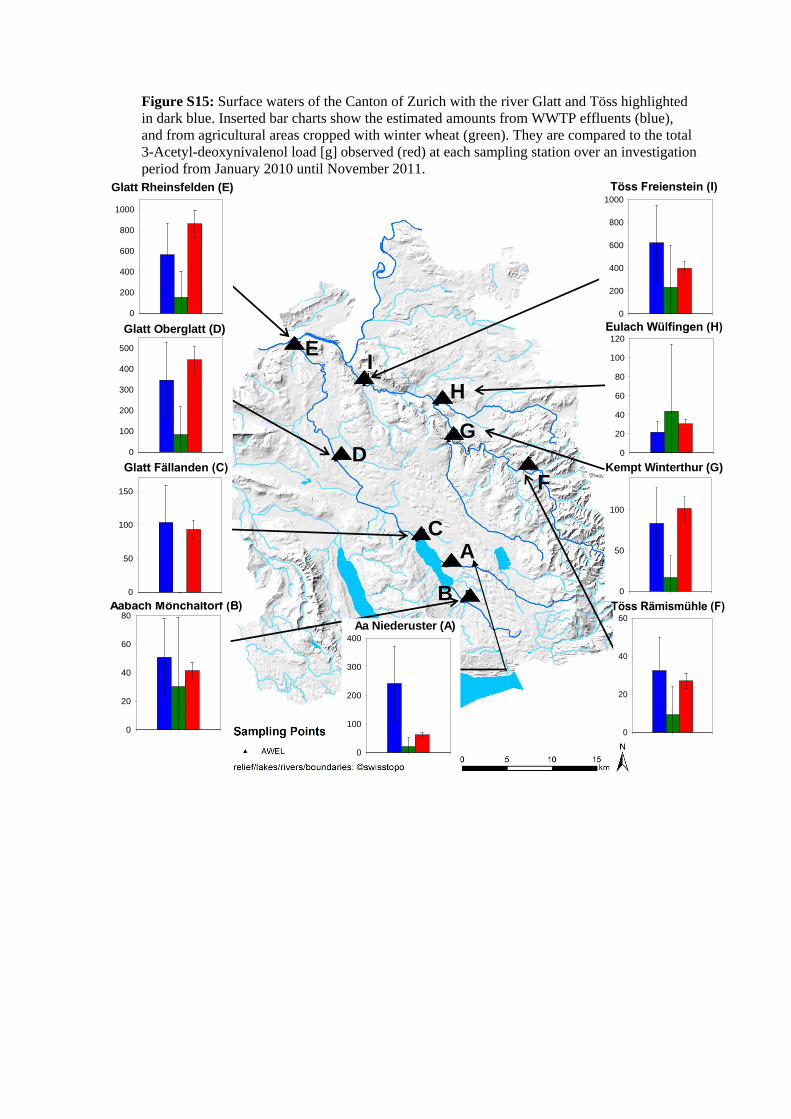
Figure S15: Surface waters of the Canton of Zurich with the river Glatt and Töss highlighted
in dark blue. Inserted bar charts show the estimated amounts from WWTP effluents (blue),
and from agricultural areas cropped with winter wheat (green). They are compared to the total
3-Acetyl-deoxynivalenol load [g] observed (red) at each sampling station over an investigation
period from January 2010 until November 2011.
E
D
C
B
A
I
H
G
F
0
100
200
300
400
Aa Niederuster (A)
0
20
40
60
80Aabach Mönchaltorf (B)
0
50
100
150
Glatt Fällanden (C)
0
100
200
300
400
500
Glatt Oberglatt (D)
0
200
400
600
800
1000
Glatt Rheinsfelden (E)
0
20
40
60
Töss Rämismühle (F)
0
50
100
Kempt Winterthur (G)
0
20
40
60
80
100
120
Eulach Wülfingen (H)
0
200
400
600
800
1000
Töss Freienstein (I)

Figure S16: Surface waters of the Canton of Zurich with the river Glatt and Töss highlighted in
dark blue. Inserted bar charts show the estimated amounts from WWTP effluents (blue), and
from agricultural areas cropped with winter wheat (green). They are compared to the total
beauvericin load [g] observed (red) at each sampling station over an investigation period from
January 2010 until November 2011.
E
D
C
B
A
I
H
G
F
0
20
40
Aa Niederuster (A)
0
10
20
30
Aabach Mönchaltorf (B)0
10
20
30
40
Glatt Fällanden (C)0
50
100
150
Glatt Oberglatt (D)0
100
200
300
Glatt Rheinsfelden (E)
0
20
40
60
80
Töss Rämismühle (F)
0
10
20
30
Kempt Winterthur (G)
0
2
4
6
8Eulach Wülfingen (H)
0
50
100
Töss Freienstein (I)